Video as a Sensor Market Size, Share and Trends

Report Code SE 9180
Published in Nov, 2024, By MarketsandMarkets™
Download PDF

Choose License Type

Buy Report Now Inquire Before Buying

Video as a Sensor Market by Camera Type (IP, Thermal, Machine Vision, Hyperspectral), Sensor (Image Motion, Infrared), Product Type (Video Surveillance, Thermal Imaging, Hyperspectral Imaging, Machine Vision & Monitoring) - Global Forecast to 2029

Video as a Sensor Market Size, Share & Growth

The video as a sensor market is projected to grow from USD 69.52 billion in 2024 to USD 101.89 billion by 2029, registering a CAGR of 7.9% from 2024–2029. Advances in high-resolution cameras, artificial intelligence (Al), machine learning (ML), cloud computing, and edge computing contribute to the development of profound solutions. Furthermore, implementing smart city initiatives creates opportunities for players in the video as a sensor (VaaS) market, leading to integrating advanced VaaS solutions into urban management systems. The burgeoning demand for surveillance and security solutions due to the growing crime rates, high terrorism threats, and the need to safeguard vital infrastructure drive the market.

Attractive Opportunities in the Video as a Sensor Market

ASIA PACIFIC

The Asia Pacific video as a sensor market growth can be attributed due to the rising demand for security & surveillance application

The increasing use of camera in residential, government, and commercial drive the video as a sensor market.

By product type, the market for hyperspectral imaging is expected to grow at a higher CAGR during the forecast period.

Leading countries, such as the US, China, and Japan, as well as emerging economies, including India and other Asian countries, are expected to be major markets for video as a sensor during the forecast period.

Proliferation of smart city initiatives is expected to fuel the growth of the Asia Pacific video as a sensor market during the forecast period.

AI/Gen AI Impact on Video as a Sensor Market

The integration of artificial intelligence in the video as a sensor industry brings significant changes to sectors ranging from surveillance and marketing to content creation. This is because of the development of machine learning and computer vision technologies, which have increased the demand for intelligent video solutions.

Video as a Sensor Market Trends & Dynamics

DRIVER: Rising investment in video surveillance and security infrastructure

Active investment in video surveillance and security infrastructure by governments worldwide has made up its critical role in ensuring public safety, national security, and economic development. The resultant investment provides a significant opportunity to expand video as a sensor industry, which increases demand for video solutions and triggers investors to invest in this sector. For example, Homeland Security in the US has spent significant money upgrading security infrastructure, such as installing video cameras at strategic points, including airports, ports, and government buildings. Videos are in high demand after these efforts, fueling the market rise. For example, till the fiscal year (FY) 2025, the US Department of Homeland Security provisioned about USD 101.8 million for the integrated surveillance towers that aid in modernizing ten existing remote video surveillance system towers. There was also an allocation of USD 30.5 million for interactive voice response system (IVRS), as well as USD 4.0 million in facial recognition, along with efforts to enhance, sustain, and expand the capacity of Homeland Security Investigations’ (HSI) facial recognition technology within the Repository for Analytics in a Virtualized Environment (RAVEN) system.

RESTRAINT: Privacy and security concerns

One major factor hindering the growth of the video as a sensor industry is the widespread concern over privacy and data security. In surveillance applications, VaaS solutions instill fears that the systems could be misused for unauthorized tracking or monitoring of individuals. Video recordings, including strict rules for collecting, processing, and storing personal data under Europe’s General Data Protection Regulation (GDPR), the California Consumer Privacy Act (CCPA) in the US, and so forth, are affected. There is a mandate for VaaS solution providers to implement and adhere to such regulations, whereby they may undertake security measures: data encryption, access controls, and audit trails that will protect unauthorized access, data breaches, or misuse of surveillance footage. To mitigate such privacy issues, the mentioned severe regulations and policies on data privacy and security are implemented in different regions and industries. In contrast, uncertainty and reluctance can be traced among end users toward video sensor technology with unclear guidelines and standards. Public safety vis-à-vis privacy rights creates a challenge in deploying and using video sensors. Ensuring that infringement on the privacy of individuals can be reduced with effective security operations in taking privacy frameworks and privacy impact assessments in the design phase of video sensor systems.


OPPORTUNITY: Proliferation of smart city initiatives

The burgeoning demand for advanced sensor solutions provides growth opportunities for players in the video as a sensor industry. Integrating such solutions with urban management systems creates enormous opportunities through the proliferation of smart city initiatives. VaaS solutions can analyze real-time traffic flow and detect congestion points. Such information will allow city planners to develop adaptive traffic management strategies, such as adjusting the timings of traffic signals or diverting vehicles to reduce bottlenecks. Cities can reduce commute time and protect air quality by optimizing traffic flow. Advanced analytics in VaaS solutions identify suspect behavior patterns through behavioral recognition technologies. It would be possible for city officials to monitor areas effectively while enabling enhanced resource allocation and responses to incidents. ANPR technology, applied within video as the sensor solution, offers smart city initiatives a chance to track vehicles. This capability would enforce traffic regulations and manage parking spaces by taking immediate action against violators for better road safety measures. For instance, IntelliVision (US) offers a Smart City/Security Solution, an AI-enabled video analytics solution. It further offers smart city initiatives with its License Plate Recognizer and IntelliVision’s Face Recognizer.

CHALLENGES:Complexities associated with data management and storage

The data management and storage challenge in video as a sensor market is particularly pronounced due to the large volumes of data such a system generates. Such a commercial organization with high-definition cameras and advanced sensor technologies can outsource, making it difficult to handle. For instance, for one camera, the data could go beyond several terabytes per year, especially when recorded continuously or in high resolutions. This exponential growth of data calls for strong storage solutions that can sustain the increase in volume of data, with cameras and sensors put to more use. Several layers of complexity are involved in the efficient management of the data. One begins with data organizations needing to effectively manage video files to make them easily searchable and retrievable. This might involve metadata tagging to label video files based on features such as time, location, and type of recorded footage. This process can be enhanced using automatic systems created with Al. Such systems will automatically label the content within the video with relevant metadata as it is analyzed. Such methods are vital to operations, which must access such footage easily and easily, thus vital in meeting some regulatory requirements.

Video as a Sensor Market Ecosystem Analysis

The video as a sensor market is a complex ecosystem comprising various interconnected players. technologies, applications, and end users. Understanding this ecosystem is crucial for businesses looking to enter or expand their presence in this rapidly evolving market. Software, hardware providers, service providers, sensors providers, overall solutions providers, and end users are involved in the video as a sensor industry ecosystem.


Hardware segment to capture largest market share in 2029

The hardware segment is expected to capture the largest share of the video as a sensor market in 2029. VaaS solutions are used for security, monitoring, and analysis. Cameras are the primary data capture devices, available in various types such as IP, machine vision, hyperspectral, and thermal, each catering to specific surveillance needs. Monitors are essential in giving real-time views and analysis. However, storage devices permit appropriate and scalable data retention, including DVR and NVR. Accessories include mounts, cables, and power supplies that enhance functionality and make for more system reliability. This makes hardware one of the key components of video as a sensor infrastructure. The demand for IP cameras is particularly notable, as they offer superior scalability and flexibility compared with traditional analog systems, facilitating real-time monitoring and remote access to video feeds. Additionally, integrating AI and ML enhances functionalities such as facial recognition and object detection, further increasing the effectiveness of surveillance systems. As security concerns continue to rise globally, the adoption of advanced camera technologies is expected to grow significantly, making them integral to comprehensive surveillance solutions across various sectors, including commercial, industrial, and residential environments.

Security & surveillance segment to account for largest market share in 2029

The security & surveillance segment is likely to dominate the video as a sensor market, holding its largest share in 2029. Safety and surveillance are considered the primary applications of VaaS solutions as they ensure the safety and safeguarding of assets in every environment. Advanced VaaS technology is utilized to observe activities, deter antisocial behavior, and react to an incident in real time. Rising security threats worldwide have increased the demand for efficient surveillance solutions. Innovation and investment in the sector are also increasing due to this factor. The main drivers of the market for the security and surveillance application segment include soaring crime rates, technological advancements, regulations, and smart city initiatives. The increasing crime and terrorism conditions are forcing organizations and governments to invest in effective all-around surveillance solutions. Advances in technologies such as camera technology improvement, cloud storage, and analytics capabilities improve surveillance systems effectiveness and affordability, reaching more audiences. Moreover, this need imposes certain regulations in different industries that demand security measures to be implemented, and video becomes a sensor solution for the surveillance field.

Asia Pacific to Exhibit Highest CAGR in Video as a Sensor Market During Forecast Period

The video as a sensor market is significant in Asia Pacific. Players in other regions have been acquiring video as a sensor system at a slower pace. The region holds great promise for the video as a sensor industry through its trend of growth fueled by rapid urbanization, increased security fears, and tremendous technological advancements. The growing smart city projects in China and India create more demand for complex surveillance systems. An increase in crime rates means an increase in security measures. Countries such as Singapore, Australia, and India have comprehensive rules regarding data protection laws. In such countries, video surveillance data falls under data protection laws. For example, in India, the Information Technology (IT) Act of 2000 regulates the interception of data. It also prohibits hacking. CCTV cameras are governed by security practices and procedures and sensitive personal data or information rules under the same act. In Australia, videography is regulated under the Queensland Criminal Code, as per Section 227A. China is an important participant in the global video as a sensor industry. Indeed, the government in China has made a lot of investments in smart cities, literally demanding the installation of technical systems to monitor traffic, public safety, and environmental conditions.

HIGHEST CAGR MARKET IN 2024–2029
CHINA FASTEST-GROWING MARKET IN THE REGION

Recent Developments of Video as a Sensor Market

  • In May 2024, Bosch Security Systems GmbH launched its 3100i fixed cameras in schools, office buildings, airports, and government buildings. These cameras come with built-in intelligence and a high level of data security.
  • In April 2024, Hangzhou Hikvision Digital Technology Co., Ltd. launched the Turbo HD 8.0 cameras, which offer two-way audio capability, making them suitable for real-time communication scenarios such as fences or door-to-door intercoms.
  • In October 2023, Orbital Sidekick was a hyperspectral satellite monitoring solution startup firm that collaborated with Corning Incorporated. Orbital Sidekick had launched six satellites in the orbit, all carrying with them a hyperspectral imaging sensor of Corning. Hyperspectral technology provides more precise detection of certain materials existing on Earth through a device that can reach it even from space; far from ground-based techniques of identification. Under this agreement, Corning may break into uncharted regions, heralding the beginning of another level of human evolution and technological advancement.
  • In May 2023, Dahua Technology launched AcuPick video search technology to help users locate target videos accurately and conveniently. Powered by front-end and back-end AI innovations, the product offers quick search, easy operation, and high accuracy, leading to technological breakthroughs in the industry.
  • In April 2022, Motorola Solutions, Inc. acquired Calipsa, Inc., a technology company in cloud-native advanced video analytics based in London, the UK. Calipsa’s scalable platform enables businesses to optimize security with AI-powered analytics that verify alarms, enable content-based searches, detect tampering, and assess real-time camera video feeds. The solution is relied upon by enterprise and security monitoring customers worldwide. This acquisition will result in strategic business expansion and enhanced product capabilities.

Top Video as a Sensor Companies - Key Market Players

Scope of the Video as a Sensor Market

Report Attribute Details
Market size available for years 2020-2029
Forecast units Value (USD Billion)
Segments Covered By Offering, Product Type, Application, End-user, and Region
Geographies covered North America, Europe, Asia Pacific, and Rest of the World (RoW)

Key Questions Addressed by the Report

What are the major companies in the video as a sensor market and their primary strategies to strengthen the market presence?
Honeywell International Inc. (US), Motorola Solutions, Inc. (US), Dahua Technology Co., Ltd (China), Bosch Security Systems GmbH (Germany), and Hangzhou Hikvision Digital Technology Co., Ltd. (China) are among the leading players in the market. These companies have adopted inorganic and organic growth strategies such as partnerships, product launches, and acquisitions to gain a competitive advantage in the market.
Which is the potential end user in the video as a sensor market?
Residential and commercial are key end users with high growth opportunities owing to technological advancements.
What are the opportunities for new market entrants?
The rapid technological advancements and proliferation of smart city initiatives create opportunities for players in the video as a sensor market.
Which product type is expected to drive the video as a sensor market over the next six years?
Video surveillance is expected to remain a major robot type, driving the video as a sensor market.
What are the major strategies adopted by VaaS companies?
VaaS companies adopted product launches, expansions, acquisitions, and contracts to strengthen their position in the market. /div>


Personalize This Research

  • Triangulate with your Own Data
  • Get Data as per your Format and Definition
  • Gain a Deeper Dive on a Specific Application, Geography, Customer or Competitor
  • Any level of Personalization
Request A Free Customisation

Let Us Help You

  • What are the Known and Unknown Adjacencies Impacting the Video as a Sensor Market
  • What will your New Revenue Sources be?
  • Who will be your Top Customer; what will make them switch?
  • Defend your Market Share or Win Competitors
  • Get a Scorecard for Target Partners
Customized Workshop Request

Table of Contents

Exclusive indicates content/data unique to MarketsandMarkets and not available with any competitors.

TITLE
PAGE NO
INTRODUCTION
27
RESEARCH METHODOLOGY
32
EXECUTIVE SUMMARY
44
PREMIUM INSIGHTS
49
MARKET OVERVIEW
54
  • 5.1 INTRODUCTION
  • 5.2 MARKET DYNAMICS
    DRIVERS
    - Rapid technological advancements in high-resolution cameras
    - Favorable government initiatives and funding
    - Rising crime rates
    RESTRAINTS
    - Privacy and security concerns
    - Complexities in integrating video as sensor solutions
    OPPORTUNITIES
    - Rapid advancement in AI
    - Development of smart policies
    CHALLENGES
    - Challenges in data management and storage
    - Vendor lock-in and interoperability issues
  • 5.3 VALUE CHAIN ANALYSIS
  • 5.4 ECOSYSTEM ANALYSIS
  • 5.5 PRICING ANALYSIS
    AVERAGE SELLING PRICE TREND OF VIDEO SURVEILLANCE CAMERAS OF KEY PLAYERS, BY END USER, 2023
    INDICATIVE PRICING, BY CAMERA TYPE, 2023
    AVERAGE SELLING PRICE TREND OF IP CAMERAS, BY REGION, 2020–2023
  • 5.6 INVESTMENT AND FUNDING SCENARIO
  • 5.7 TRENDS/DISRUPTIONS IMPACTING CUSTOMER BUSINESS
  • 5.8 TECHNOLOGY ANALYSIS
    KEY TECHNOLOGIES
    - Artificial intelligence
    - Machine learning
    COMPLEMENTARY TECHNOLOGIES
    - Intelligent video analytics
    - IoT
  • 5.9 PORTER'S FIVE FORCES ANALYSIS
    BARGAINING POWER OF BUYERS
    THREAT OF NEW ENTRANTS
    THREAT OF SUBSTITUTES
    INTENSITY OF COMPETITIVE RIVALRY
  • 5.10 KEY STAKEHOLDERS AND BUYING CRITERIA
    KEY STAKEHOLDERS IN BUYING PROCESS
    BUYING CRITERIA
  • 5.11 TRADE ANALYSIS
    IMPORT SCENARIO (HS CODE 852580)
    EXPORT SCENARIO (HS CODE 852580)
  • 5.12 PATENT ANALYSIS
  • 5.13 REGULATORY LANDSCAPE
    REGULATORY BODIES, GOVERNMENT AGENCIES, AND OTHER ORGANIZATIONS
    GLOBAL REGULATIONS
    STANDARDS
  • 5.14 KEY CONFERENCES AND EVENTS, 2024–2025
  • 5.15 IMPACT OF AI ON VIDEO AS A SENSOR MARKET
    TOP USE CASES AND MARKET POTENTIAL
    KEY AI USE CASES IN VIDEO AS A SENSOR MARKET
    BRIEF DESCRIPTION OF USE CASES
    - Healthcare monitoring
    - Security and surveillance
    - Retail analytics
    - Smart city management
    - Industrial safety and maintenance
    - Best practices: who is implementing above use cases
VIDEO AS A SENSOR MARKET, BY OFFERING
92
  • 6.1 INTRODUCTION
  • 6.2 HARDWARE
    CAMERAS
    - Camera type
    - Camera components
    STORAGE DEVICES
    - DVRs
    - NVRs
    MONITORS
    - Growing adoption for real-time monitoring to spike growth
    ACCESSORIES
    - Adaptability across different applications to fuel market growth
  • 6.3 SOFTWARE
    VIDEO MANAGEMENT SOFTWARE
    - Increasing focus on public safety and security to drive adoption
    INTELLIGENT VIDEO ANALYTICS SOFTWARE
    - Rising focus on real-time threat detection using AI and computer vision to drive segmental growth
    AI AND MACHINE LEARNING ALGORITHMS
    - Growing implementation of predictive analytics technique to stimulate market growth
    INTEGRATION SOFTWARE
    - Surging need for efficient communication between various hardware components to accelerate market growth
  • 6.4 SERVICES
    VIDEO SURVEILLANCE AS A SERVICE
    - Ability to easily scale surveillance systems up or down to increase demand
    INSTALLATION AND MAINTENANCE SERVICES
    - Continuous improvements in video analytics to fuel growth
VIDEO AS A SENSOR MARKET, BY PRODUCT TYPE
114
  • 7.1 INTRODUCTION
  • 7.2 VIDEO SURVEILLANCE
    INCREASING DEMAND FOR INTELLIGENT SURVEILLANCE TO FUEL MARKET GROWTH
  • 7.3 HYPERSPECTRAL IMAGING
    GROWING ADOPTION IN AGRICULTURE & ENVIRONMENTAL MONITORING TO DRIVE SEGMENTAL GROWTH
  • 7.4 MACHINE VISION AND MONITORING
    RISING DEMAND IN INDUSTRY 4.0 TO FOSTER MARKET GROWTH
  • 7.5 THERMAL IMAGING
    INCREASING USE IN DETECTING HEAT SIGNATURES TO DRIVE MARKET GROWTH
VIDEO AS A SENSOR MARKET, BY APPLICATION
136
  • 8.1 INTRODUCTION
  • 8.2 SECURITY & SURVEILLANCE
    SURGING DEMAND IN URBAN ENVIRONMENTS TO BOOST SEGMENTAL GROWTH
  • 8.3 TRAFFIC MANAGEMENT
    ELEVATING NEED FOR CONTINUOUS SURVEILLANCE OF ROADWAYS, INTERSECTIONS, AND TRANSIT SYSTEMS TO AUGMENT MARKET GROWTH
  • 8.4 RETAIL ANALYTICS
    INCREASING FOCUS ON ENHANCING CUSTOMER EXPERIENCE TO BOOST DEMAND
  • 8.5 HEALTHCARE
    PRESSING NEED TO IMPROVE PATIENT CARE TO SPUR DEMAND
  • 8.6 MANUFACTURING
    RISING NEED FOR IMPROVING SAFETY AND PRODUCTION EFFICIENCY TO FOSTER MARKET GROWTH
  • 8.7 MAPPING
    INCREASING DEMAND IN INDOOR SPACES AND AUTONOMOUS VEHICLES TO OFFER LUCRATIVE GROWTH OPPORTUNITIES
VIDEO AS A SENSOR MARKET, BY END USER
143
  • 9.1 INTRODUCTION
  • 9.2 GOVERNMENT
    URGENT REQUIREMENT TO ENHANCE OPERATIONAL EFFICIENCY AND PUBLIC SAFETY TO DRIVE MARKET
  • 9.3 COMMERCIAL
    INCREASING USE IN RETAIL AND BANKING TO IMPROVE SECURITY TO AUGMENT MARKET GROWTH
  • 9.4 INDUSTRIAL
    RISING DEMAND FOR QUALITY CONTROL & SAFETY TO FOSTER MARKET GROWTH
  • 9.5 RESIDENTIAL
    GROWING DEPLOYMENT OF SECURITY SOLUTIONS AND AUTOMATION IN HOMES TO FUEL SEGMENTAL GROWTH
VIDEO AS A SENSOR MARKET, BY REGION
155
  • 10.1 INTRODUCTION
  • 10.2 NORTH AMERICA
    MACROECONOMIC OUTLOOK FOR NORTH AMERICA
    US
    - Increasing security concerns to drive demand
    CANADA
    - Government initiatives to enhance security across urban areas to propel market growth
    MEXICO
    - Surging crime rate to boost demand
  • 10.3 EUROPE
    MACROECONOMIC OUTLOOK FOR EUROPE
    GERMANY
    - Increasing adoption of thermal cameras for security to fuel segmental growth
    UK
    - Government initiatives and private sector partnerships to support market growth
    FRANCE
    - Deployment of AI video surveillance during high-profile events to fuel market growth
    ITALY
    - Supportive government policies and regulations regarding public safety to augment market growth
    REST OF EUROPE
  • 10.4 ASIA PACIFIC
    MACROECONOMIC OUTLOOK FOR ASIA PACIFIC
    CHINA
    - Growing adoption of small-sized and low-cost thermal imaging cameras to spur demand
    INDIA
    - Government-led investments in security infrastructure to accelerate market growth
    JAPAN
    - Surging deployment of thermal cameras in hospitals to support market growth
    SOUTH KOREA
    - Accelerating adoption of AI-powered cameras and cloud-based monitoring systems to stimulate market growth
    REST OF ASIA PACIFIC
  • 10.5 ROW
    MACROECONOMIC OUTLOOK FOR ROW
    MIDDLE EAST
    - Deployment of advanced video analytics solutions to foster market growth
    - GCC countries
    - Rest of Middle East
    AFRICA
    - Pressing need to enhance public safety and modernize urban infrastructure to offer lucrative growth opportunities
    SOUTH AMERICA
    - Government-led investment in smart city initiatives to accelerate market growth
COMPETITIVE LANDSCAPE
197
  • 11.1 INTRODUCTION
  • 11.2 KEY PLAYER STRATEGIES/RIGHT TO WIN, 2020–2024
  • 11.3 REVENUE ANALYSIS, 2019–2023
  • 11.4 VIDEO SURVEILLANCE MARKET SHARE ANALYSIS, 2023
  • 11.5 COMPANY VALUATION AND FINANCIAL METRICS, 2024
  • 11.6 PRODUCT COMPARISON
  • 11.7 COMPANY EVALUATION MATRIX: KEY PLAYERS, 2023
    STARS
    EMERGING LEADERS
    PERVASIVE PLAYERS
    PARTICIPANTS
    COMPANY FOOTPRINT: KEY PLAYERS, 2023
    - Company footprint
    - Region footprint
    - Offering footprint
    - Product type footprint
    - Application footprint
    - End user footprint
  • 11.8 COMPANY EVALUATION MATRIX: STARTUPS/SMES, 2023
    PROGRESSIVE COMPANIES
    RESPONSIVE COMPANIES
    DYNAMIC COMPANIES
    STARTING BLOCKS
    COMPETITIVE BENCHMARKING: STARTUPS/SMES, 2023
    - Detailed list of key startups/SMEs
    - Competitive benchmarking of key startups/SMEs
  • 11.9 COMPETITIVE SCENARIO
    PRODUCT LAUNCHES
    DEALS
    EXPANSIONS
    OTHER DEVELOPMENTS
COMPANY PROFILES
220
  • 12.1 KEY PLAYERS
    BOSCH SECURITY SYSTEMS GMBH
    - Business overview
    - Products/Solutions/Services offered
    - Recent developments
    - MnM view
    MOTOROLA SOLUTIONS, INC.
    - Business overview
    - Products/Services/Solutions offered
    - Recent developments
    - MnM view
    HANGZHOU HIKVISION DIGITAL TECHNOLOGY CO., LTD.
    - Business overview
    - Products/Solutions/Services offered
    - Recent developments
    - MnM view
    ZHEJIANG DAHUA TECHNOLOGY CO., LTD.
    - Business overview
    - Products/Solutions/Services offered
    - Recent developments
    - MnM view
    HONEYWELL INTERNATIONAL INC.
    - Business overview
    - Products/Solutions/Services offered
    - Recent developments
    - MnM view
    AT&T
    - Business overview
    - Products/Solutions/Services offered
    IBM CORPORATION
    - Business overview
    - Products/Solutions/Services offered
    CISCO SYSTEMS, INC.
    - Business overview
    - Products/Solutions/Services offered
    - Recent developments
    AXIS COMMUNICATIONS AB
    - Business overview
    - Products/Solutions/Services offered
    - Recent developments
    JOHNSON CONTROLS INC.
    - Business overview
    - Products/Solutions/Services offered
    - Recent developments
    SONY GROUP CORPORATION
    - Business overview
    - Products/Solutions/Services offered
    - Recent developments
    SHARP CORPORATION
    - Business overview
    - Products/Solutions/Services offered
    TELEDYNE TECHNOLOGIES INCORPORATED
    - Business overview
    - Products/Services/Solutions offered
    - Recent developments
    CORNING INCORPORATED
    - Business overview
    - Products/Solutions/Services offered
    - Recent developments
    PIXART IMAGING INC.
    - Business overview
    - Products/Solutions/Services offered
    EXOSENS
    - Business overview
    - Products/Solutions/Services offered
    - Recent developments
    SENSTAR CORPORATION
    - Business overview
    - Products/Solutions/Services offered
    - Recent developments
    IRISITY
    - Business overview
    - Products/Solutions/Services offered
    - Recent developments
    HEXAGON AB
    - Business overview
    - Products/Services/Solutions offered
    - Recent developments
  • 12.2 OTHER PLAYERS
    ALLGOVISION TECHNOLOGIES PVT. LTD.
    INTELLIVISION
    PURETECH SYSTEMS INC.
    VCA TECHNOLOGY LTD.
    IOMNISCIENT PTY LTD.
    FLUKE CORPORATION
    BRIEFCAM
    OMNIVISION
  • 12.3 STARTUPS PLAYERS
    HINALEA IMAGING CORP.
    PHOTON ETC.
    WYZE LABS, INC.
    SPOT AI, INC.
    RHOMBUS SYSTEMS
APPENDIX
336
  • 13.1 DISCUSSION GUIDE
  • 13.2 KNOWLEDGESTORE: MARKETSANDMARKETS’ SUBSCRIPTION PORTAL
  • 13.3 CUSTOMIZATION OPTIONS
  • 13.4 RELATED REPORTS
  • 13.5 AUTHOR DETAILS
LIST OF TABLES
 
  • TABLE 1 VIDEO AS A SENSOR ECOSYSTEM ANALYSIS
  • TABLE 2 INDICATIVE PRICING OF VIDEO SURVEILLANCE CAMERAS OFFERED BY KEY PLAYERS, 2023 (USD)
  • TABLE 3 INDICATIVE PRICING, BY CAMERA TYPE, 2023 (USD THOUSAND)
  • TABLE 4 AVERAGE SELLING PRICE TREND OF CAMERA TYPES, 2020–2023
  • TABLE 5 VIDEO AS A SENSOR MARKET: PORTER'S FIVE FORCES ANALYSIS
  • TABLE 6 INFLUENCE OF STAKEHOLDERS ON BUYING PROCESS FOR TOP THREE END USERS (%)
  • TABLE 7 KEY BUYING CRITERIA FOR TOP THREE END USERS
  • TABLE 8 IMPORT DATA FOR HS CODE 852580-COMPLIANT PRODUCTS, BY COUNTRY, 2019–2023 (USD MILLION)
  • TABLE 9 EXPORT DATA FOR HS CODE 852580-COMPLIANT PRODUCTS, BY COUNTRY, 2019–2023 (USD MILLION)
  • TABLE 10 LIST OF KEY PATENTS IN VIDEO AS A SENSOR MARKET, 2020–2024
  • TABLE 11 NORTH AMERICA: LIST OF REGULATORY BODIES, GOVERNMENT AGENCIES, AND OTHER ORGANIZATIONS
  • TABLE 12 EUROPE: LIST OF REGULATORY BODIES, GOVERNMENT AGENCIES, AND OTHER ORGANIZATIONS
  • TABLE 13 ASIA PACIFIC: LIST OF REGULATORY BODIES, GOVERNMENT AGENCIES, AND OTHER ORGANIZATIONS
  • TABLE 14 ROW: LIST OF REGULATORY BODIES, GOVERNMENT AGENCIES, AND OTHER ORGANIZATIONS
  • TABLE 15 VIDEO AS A SENSOR MARKET: REGULATIONS
  • TABLE 16 MARKET: STANDARDS
  • TABLE 17 MARKET: LIST OF CONFERENCES AND EVENTS, 2024–2025
  • TABLE 18 MARKET, BY OFFERING, 2020–2023 (USD MILLION)
  • TABLE 19 VIDEO AS A SENSOR MARKET, BY OFFERING, 2024–2029 (USD MILLION)
  • TABLE 20 HARDWARE: MARKET, BY TYPE, 2020–2023 (USD MILLION)
  • TABLE 21 HARDWARE: MARKET, BY TYPE, 2024–2029 (USD MILLION)
  • TABLE 22 CAMERAS: MARKET, BY CAMERA TYPE, 2020–2023 (USD MILLION)
  • TABLE 23 CAMERAS: MARKET, BY CAMERA TYPE, 2024–2029 (USD MILLION)
  • TABLE 24 CAMERAS: MARKET, BY CAMERA TYPE, 2020–2023 (MILLION UNITS)
  • TABLE 25 CAMERAS: MARKET, BY CAMERA TYPE, 2024–2029 (MILLION UNITS)
  • TABLE 26 HYPERSPECTRAL CAMERA: MARKET, 2020–2023 (UNITS)
  • TABLE 27 HYPERSPECTRAL CAMERA: MARKET, 2024–2029 (UNITS)
  • TABLE 28 CAMERA: MARKET, BY CAMERA COMPONENT, 2020–2023 (USD MILLION)
  • TABLE 29 CAMERA: MARKET, BY CAMERA COMPONENT, 2024–2029 (USD MILLION)
  • TABLE 30 CAMERA SENSORS: VIDEO AS A SENSOR MARKET, BY TYPE, 2020–2023 (USD MILLION)
  • TABLE 31 CAMERA SENSORS: MARKET, BY TYPE, 2024–2029 (USD MILLION)
  • TABLE 32 STORAGE DEVICES: MARKET, BY TYPE, 2020–2023 (USD MILLION)
  • TABLE 33 STORAGE DEVICES: MARKET, BY TYPE, 2024–2029 (USD MILLION)
  • TABLE 34 SOFTWARE: MARKET, BY TYPE, 2020–2023 (USD MILLION)
  • TABLE 35 SOFTWARE: MARKET, BY TYPE, 2024–2029 (USD MILLION)
  • TABLE 36 SERVICES: MARKET, BY TYPE, 2020–2023 (USD MILLION)
  • TABLE 37 SERVICES: MARKET, BY TYPE, 2024–2029 (USD MILLION)
  • TABLE 38 VIDEO AS A SENSOR MARKET, BY PRODUCT TYPE, 2020–2023 (USD MILLION)
  • TABLE 39 MARKET, BY PRODUCT TYPE, 2024–2029 (USD MILLION)
  • TABLE 40 VIDEO SURVEILLANCE: MARKET, BY REGION, 2020–2023 (USD MILLION)
  • TABLE 41 VIDEO SURVEILLANCE: MARKET, BY REGION, 2024–2029 (USD MILLION)
  • TABLE 42 VIDEO SURVEILLANCE: MARKET, BY END USER, 2020–2023 (USD MILLION)
  • TABLE 43 VIDEO SURVEILLANCE: MARKET, BY END USER, 2024–2029 (USD MILLION)
  • TABLE 44 VIDEO SURVEILLANCE: MARKET IN NORTH AMERICA, BY COUNTRY, 2020–2023 (USD MILLION)
  • TABLE 45 VIDEO SURVEILLANCE: MARKET IN NORTH AMERICA, BY COUNTRY, 2024–2029 (USD MILLION)
  • TABLE 46 VIDEO SURVEILLANCE: ARKET IN EUROPE, BY COUNTRY, 2020–2023 (USD MILLION)
  • TABLE 47 VIDEO SURVEILLANCE: MARKET IN EUROPE, BY COUNTRY, 2024–2029 (USD MILLION)
  • TABLE 48 VIDEO SURVEILLANCE: MARKET IN ASIA PACIFIC, BY COUNTRY, 2020–2023 (USD MILLION)
  • TABLE 49 VIDEO SURVEILLANCE: MARKET IN ASIA PACIFIC, BY COUNTRY, 2024–2029 (USD MILLION)
  • TABLE 50 VIDEO SURVEILLANCE: MARKET IN ROW, BY REGION, 2020–2023 (USD MILLION)
  • TABLE 51 VIDEO SURVEILLANCE: MARKET IN ROW, BY REGION, 2024–2029 (USD MILLION)
  • TABLE 52 HYPERSPECTRAL IMAGING: VIDEO AS A SENSOR MARKET, BY REGION, 2020–2023 (USD MILLION)
  • TABLE 53 HYPERSPECTRAL IMAGING: MARKET, BY REGION, 2024–2029 (USD MILLION)
  • TABLE 54 HYPERSPECTRAL IMAGING: MARKET, BY END USER, 2020–2023 (USD MILLION)
  • TABLE 55 HYPERSPECTRAL IMAGING: MARKET, BY END USER, 2024–2029 (USD MILLION)
  • TABLE 56 HYPERSPECTRAL IMAGING: MARKET IN NORTH AMERICA, BY COUNTRY, 2020–2023 (USD MILLION)
  • TABLE 57 HYPERSPECTRAL IMAGING: MARKET IN NORTH AMERICA, BY COUNTRY, 2024–2029 (USD MILLION)
  • TABLE 58 HYPERSPECTRAL IMAGING: MARKET IN EUROPE, BY COUNTRY, 2020–2023 (USD MILLION)
  • TABLE 59 HYPERSPECTRAL IMAGING: MARKET IN EUROPE, BY COUNTRY, 2024–2029 (USD MILLION)
  • TABLE 60 HYPERSPECTRAL IMAGING: MARKET IN ASIA PACIFIC, BY COUNTRY, 2020–2023 (USD MILLION)
  • TABLE 61 HYPERSPECTRAL IMAGING: MARKET IN ASIA PACIFIC, BY COUNTRY, 2024–2029 (USD MILLION)
  • TABLE 62 HYPERSPECTRAL IMAGING: MARKET IN ROW, BY REGION, 2020–2023 (USD MILLION)
  • TABLE 63 HYPERSPECTRAL IMAGING: MARKET IN ROW, BY REGION, 2024–2029 (USD MILLION)
  • TABLE 64 MACHINE VISION AND MONITORING: VIDEO AS A SENSOR MARKET, BY REGION, 2020–2023 (USD MILLION)
  • TABLE 65 MACHINE VISION AND MONITORING: MARKET, BY REGION, 2024–2029 (USD MILLION)
  • TABLE 66 MACHINE VISION AND MONITORING: MARKET, BY END USER, 2020–2023 (USD MILLION)
  • TABLE 67 MACHINE VISION AND MONITORING: MARKET, BY END USER, 2024–2029 (USD MILLION)
  • TABLE 68 MACHINE VISION AND MONITORING: MARKET IN NORTH AMERICA, BY COUNTRY, 2020–2023 (USD MILLION)
  • TABLE 69 MACHINE VISION AND MONITORING: MARKET IN NORTH AMERICA, BY COUNTRY, 2024–2029 (USD MILLION)
  • TABLE 70 MACHINE VISION AND MONITORING: MARKET IN EUROPE, BY COUNTRY, 2020–2023 (USD MILLION)
  • TABLE 71 MACHINE VISION AND MONITORING: MARKET IN EUROPE, BY COUNTRY, 2024–2029 (USD MILLION)
  • TABLE 72 MACHINE VISION AND MONITORING: MARKET IN ASIA PACIFIC, BY COUNTRY, 2020–2023 (USD MILLION)
  • TABLE 73 MACHINE VISION AND MONITORING: MARKET IN ASIA PACIFIC, BY COUNTRY, 2024–2029 (USD MILLION)
  • TABLE 74 MACHINE VISION AND MONITORING: MARKET IN ROW, BY COUNTRY, 2020–2023 (USD MILLION)
  • TABLE 75 MACHINE VISION AND MONITORING: MARKET IN ROW, BY COUNTRY, 2024–2029 (USD MILLION)
  • TABLE 76 THERMAL IMAGING: VIDEO AS A SENSOR MARKET, BY REGION, 2020–2023 (USD MILLION)
  • TABLE 77 THERMAL IMAGING: MARKET, BY REGION, 2024–2029 (USD MILLION)
  • TABLE 78 THERMAL IMAGING: MARKET, BY END USER, 2020–2023 (USD MILLION)
  • TABLE 79 THERMAL IMAGING: MARKET, BY END USER, 2024–2029 (USD MILLION)
  • TABLE 80 THERMAL IMAGING: MARKET IN NORTH AMERICA, BY COUNTRY, 2020–2023 (USD MILLION)
  • TABLE 81 THERMAL IMAGING: MARKET IN NORTH AMERICA, BY COUNTRY, 2024–2029 (USD MILLION)
  • TABLE 82 THERMAL IMAGING: MARKET IN EUROPE, BY COUNTRY, 2020–2023 (USD MILLION)
  • TABLE 83 THERMAL IMAGING: MARKET IN EUROPE, BY COUNTRY, 2024–2029 (USD MILLION)
  • TABLE 84 THERMAL IMAGING: MARKET IN ASIA PACIFIC, BY COUNTRY, 2020–2023 (USD MILLION)
  • TABLE 85 THERMAL IMAGING: MARKET IN ASIA PACIFIC, BY COUNTRY, 2024–2029 (USD MILLION)
  • TABLE 86 THERMAL IMAGING: MARKET IN ROW, BY REGION, 2020–2023 (USD MILLION)
  • TABLE 87 THERMAL IMAGING: MARKET IN ROW, BY REGION, 2024–2029 (USD MILLION)
  • TABLE 88 VIDEO AS A SENSOR MARKET, BY APPLICATION, 2020–2023 (USD MILLION)
  • TABLE 89 MARKET, BY APPLICATION, 2024–2029 (USD MILLION)
  • TABLE 90 MARKET, BY END USER, 2020–2023 (USD MILLION)
  • TABLE 91 MARKET, BY END USER, 2024–2029 (USD MILLION)
  • TABLE 92 GOVERNMENT: VIDEO AS A SENSOR MARKET, BY REGION, 2020–2023 (USD MILLION)
  • TABLE 93 GOVERNMENT: MARKET, BY REGION, 2024–2029 (USD MILLION)
  • TABLE 94 GOVERNMENT: MARKET, BY PRODUCT TYPE, 2020–2023 (USD MILLION)
  • TABLE 95 GOVERNMENT: MARKET, BY PRODUCT TYPE, 2024–2029 (USD MILLION)
  • TABLE 96 COMMERCIAL: MARKET, BY REGION, 2020–2023 (USD MILLION)
  • TABLE 97 COMMERCIAL: MARKET, BY REGION, 2024–2029 (USD MILLION)
  • TABLE 98 COMMERCIAL: MARKET, BY PRODUCT TYPE, 2020–2023 (USD MILLION)
  • TABLE 99 COMMERCIAL: MARKET, BY PRODUCT TYPE, 2024–2029 (USD MILLION)
  • TABLE 100 INDUSTRIAL: VIDEO AS A SENSOR MARKET, BY REGION, 2020–2023 (USD MILLION)
  • TABLE 101 INDUSTRIAL: MARKET, BY REGION, 2024–2029 (USD MILLION)
  • TABLE 102 INDUSTRIAL: MARKET, BY PRODUCT TYPE, 2020–2023 (USD MILLION)
  • TABLE 103 INDUSTRIAL: MARKET, BY PRODUCT TPE, 2024–2029 (USD MILLION)
  • TABLE 104 RESIDENTIAL:  MARKET, BY REGION, 2020–2023 (USD MILLION)
  • TABLE 105 RESIDENTIAL: MARKET, BY REGION, 2024–2029 (USD MILLION)
  • TABLE 106 RESIDENTIAL: MARKET, BY PRODUCT TYPE, 2020–2023 (USD MILLION)
  • TABLE 107 RESIDENTIAL: MARKET, BY PRODUCT TYPE, 2024–2029 (USD MILLION)
  • TABLE 108 VIDEO AS A SENSOR MARKET, BY REGION, 2020–2023 (USD MILLION)
  • TABLE 109 MARKET, BY REGION, 2024–2029 (USD MILLION)
  • TABLE 110 NORTH AMERICA: VIDEO AS A SENSOR MARKET, BY COUNTRY, 2020–2023 (USD MILLION)
  • TABLE 111 NORTH AMERICA: MARKET, BY COUNTRY, 2024–2029 (USD MILLION)
  • TABLE 112 NORTH AMERICA: MARKET, BY PRODUCT TYPE, 2020–2023 (USD MILLION)
  • TABLE 113 NORTH AMERICA: MARKET, BY PRODUCT TYPE, 2024–2029 (USD MILLION)
  • TABLE 114 NORTH AMERICA: MARKET, BY END USER, 2020–2023 (USD MILLION)
  • TABLE 115 NORTH AMERICA: MARKET, BY END USER, 2024–2029 (USD MILLION)
  • TABLE 116 US: MARKET, BY PRODUCT TYPE, 2020–2023 (USD MILLION)
  • TABLE 117 US: MARKET, BY PRODUCT TYPE, 2024–2029 (USD MILLION)
  • TABLE 118 CANADA: MARKET, BY PRODUCT TYPE, 2020–2023 (USD MILLION)
  • TABLE 119 CANADA: MARKET, BY PRODUCT TYPE, 2024–2029 (USD MILLION)
  • TABLE 120 MEXICO: MARKET, BY PRODUCT TYPE, 2020–2023 (USD MILLION)
  • TABLE 121 MEXICO: MARKET, BY PRODUCT TYPE, 2024–2029 (USD MILLION)
  • TABLE 122 EUROPE: VIDEO AS A SENSOR MARKET, BY COUNTRY, 2020–2023 (USD MILLION)
  • TABLE 123 EUROPE: MARKET, BY COUNTRY, 2024–2029 (USD MILLION)
  • TABLE 124 EUROPE: MARKET, BY PRODUCT TYPE, 2020–2023 (USD MILLION)
  • TABLE 125 EUROPE: MARKET, BY PRODUCT TYPE, 2024–2029 (USD MILLION)
  • TABLE 126 EUROPE: MARKET, BY END USER, 2020–2023 (USD MILLION)
  • TABLE 127 EUROPE: MARKET, BY END USER, 2024–2029 (USD MILLION)
  • TABLE 128 GERMANY: MARKET, BY PRODUCT TYPE, 2020–2023 (USD MILLION)
  • TABLE 129 GERMANY: MARKET, BY PRODUCT TYPE, 2024–2029 (USD MILLION)
  • TABLE 130 UK: MARKET, BY PRODUCT TYPE, 2020–2023 (USD MILLION)
  • TABLE 131 UK: MARKET, BY PRODUCT TYPE, 2024–2029 (USD MILLION)
  • TABLE 132 FRANCE: MARKET, BY PRODUCT TYPE, 2020–2023 (USD MILLION)
  • TABLE 133 FRANCE: MARKET, BY PRODUCT TYPE, 2024–2029 (USD MILLION)
  • TABLE 134 ITALY: MARKET, BY PRODUCT TYPE, 2020–2023 (USD MILLION)
  • TABLE 135 ITALY: MARKET, BY PRODUCT TYPE, 2024–2029 (USD MILLION)
  • TABLE 136 REST OF EUROPE: VIDEO AS A SENSOR MARKET, BY PRODUCT TYPE, 2020–2023 (USD MILLION)
  • TABLE 137 REST OF EUROPE: MARKET, BY PRODUCT TYPE, 2024–2029 (USD MILLION)
  • TABLE 138 ASIA PACIFIC: MARKET, BY COUNTRY, 2020–2023 (USD MILLION)
  • TABLE 139 ASIA PACIFIC: MARKET, BY COUNTRY, 2024–2029 (USD MILLION)
  • TABLE 140 ASIA PACIFIC: MARKET, BY PRODUCT TYPE, 2020–2023 (USD MILLION)
  • TABLE 141 ASIA PACIFIC: MARKET, BY PRODUCT TYPE, 2024–2029 (USD MILLION)
  • TABLE 142 ASIA PACIFIC: MARKET, BY END USER, 2020–2023 (USD MILLION)
  • TABLE 143 ASIA PACIFIC: MARKET, BY END USER, 2024–2029 (USD MILLION)
  • TABLE 144 CHINA: VIDEO AS A SENSOR MARKET, BY PRODUCT TYPE, 2020–2023 (USD MILLION)
  • TABLE 145 CHINA: MARKET, BY PRODUCT TYPE, 2024–2029 (USD MILLION)
  • TABLE 146 INDIA: MARKET, BY PRODUCT TYPE, 2020–2023 (USD MILLION)
  • TABLE 147 INDIA: MARKET, BY PRODUCT TYPE, 2024–2029 (USD MILLION)
  • TABLE 148 JAPAN: MARKET, BY PRODUCT TYPE, 2020–2023 (USD MILLION)
  • TABLE 149 JAPAN: MARKET, BY PRODUCT TYPE, 2024–2029 (USD MILLION)
  • TABLE 150 SOUTH KOREA: MARKET, BY PRODUCT TYPE, 2020–2023 (USD MILLION)
  • TABLE 151 SOUTH KOREA: MARKET, BY PRODUCT TYPE, 2024–2029 (USD MILLION)
  • TABLE 152 REST OF ASIA PACIFIC: MARKET, BY PRODUCT TYPE, 2020–2023 (USD MILLION)
  • TABLE 153 REST OF ASIA PACIFIC: MARKET, BY PRODUCT TYPE, 2024–2029 (USD MILLION)
  • TABLE 154 ROW: VIDEO AS A SENSOR MARKET, BY COUNTRY, 2020–2023 (USD MILLION)
  • TABLE 155 ROW: MARKET, BY COUNTRY, 2024–2029 (USD MILLION)
  • TABLE 156 ROW: MARKET, BY PRODUCT TYPE, 2020–2023 (USD MILLION)
  • TABLE 157 ROW: MARKET, BY PRODUCT TYPE, 2024–2029 (USD MILLION)
  • TABLE 158 ROW: MARKET, BY END USER, 2020–2023 (USD MILLION)
  • TABLE 159 ROW: MARKET, BY END USER, 2024–2029 (USD MILLION)
  • TABLE 160 MIDDLE EAST: VIDEO AS A SENSOR MARKET, BY PRODUCT TYPE, 2020–2023 (USD MILLION)
  • TABLE 161 MIDDLE EAST: MARKET, BY PRODUCT TYPE, 2024–2029 (USD MILLION)
  • TABLE 162 MIDDLE EAST: MARKET, BY COUNTRY, 2020–2023 (USD MILLION)
  • TABLE 163 MIDDLE EAST: MARKET, BY COUNTRY, 2024–2029 (USD MILLION)
  • TABLE 164 AFRICA: VIDEO AS A SENSOR MARKET, BY PRODUCT TYPE, 2020–2023 (USD MILLION)
  • TABLE 165 AFRICA: MARKET, BY PRODUCT TYPE, 2024–2029 (USD MILLION)
  • TABLE 166 SOUTH AMERICA: MARKET, BY PRODUCT TYPE, 2020–2023 (USD MILLION)
  • TABLE 167 SOUTH AMERICA: MARKET, BY PRODUCT TYPE, 2024–2029 (USD MILLION)
  • TABLE 168 VIDEO AS A SENSOR MARKET: OVERVIEW OF STRATEGIES ADOPTED BY KEY PLAYERS, 2020–2024
  • TABLE 169 VIDEO SURVEILLANCE MARKET SHARE ANALYSIS, 2023
  • TABLE 170 MARKET: REGION FOOTPRINT
  • TABLE 171 MARKET: OFFERING FOOTPRINT
  • TABLE 172 MARKET: PRODUCT TYPE FOOTPRINT
  • TABLE 173 MARKET: APPLICATION FOOTPRINT
  • TABLE 174 MARKET: END USER FOOTPRINT
  • TABLE 175 MARKET: DETAILED LIST OF KEY STARTUPS/SMES
  • TABLE 176 MARKET: COMPETITIVE BENCHMARKING OF KEY STARTUPS/SMES
  • TABLE 177 MARKET: PRODUCT LAUNCHES, JANUARY 2020–JUNE 2024
  • TABLE 178 MARKET: DEALS, JANUARY 2020–JUNE 2024
  • TABLE 179 MARKET: EXPANSIONS, JANUARY 2020–JUNE 2024
  • TABLE 180 MARKET: OTHER DEVELOPMENTS, JANUARY 2020–JUNE 2024
  • TABLE 181 BOSCH SECURITY SYSTEMS GMBH: COMPANY OVERVIEW
  • TABLE 182 BOSCH SECURITY SYSTEMS GMBH: PRODUCTS/SOLUTIONS/SERVICES OFFERED
  • TABLE 183 BOSCH SECURITY SYSTEMS GMBH: PRODUCT LAUNCHES
  • TABLE 184 MOTOROLA SOLUTIONS, INC.: COMPANY OVERVIEW
  • TABLE 185 MOTOROLA SOLUTIONS, INC.: PRODUCTS/SERVICES/SOLUTIONS OFFERED
  • TABLE 186 MOTOROLA SOLUTIONS, INC.: PRODUCT LAUNCHES
  • TABLE 187 MOTOROLA SOLUTIONS, INC.: DEALS
  • TABLE 188 MOTOROLA SOLUTIONS, INC.: EXPANSIONS
  • TABLE 189 MOTOROLA SOLUTIONS, INC.: OTHER DEVELOPMENTS
  • TABLE 190 HANGZHOU HIKVISION DIGITAL TECHNOLOGY CO., LTD.: COMPANY OVERVIEW
  • TABLE 191 HANGZHOU HIKVISION DIGITAL TECHNOLOGY CO., LTD.: PRODUCTS/SOLUTIONS/SERVICES OFFERED
  • TABLE 192 HANGZHOU HIKVISION DIGITAL TECHNOLOGY CO., LTD.: PRODUCT LAUNCHES
  • TABLE 193 HANGZHOU HIKVISION DIGITAL TECHNOLOGY CO., LTD.: DEALS
  • TABLE 194 ZHEJIANG DAHUA TECHNOLOGY CO., LTD.: COMPANY OVERVIEW
  • TABLE 195 ZHEJIANG DAHUA TECHNOLOGY CO., LTD.: PRODUCTS/SOLUTIONS/SERVICES OFFERED
  • TABLE 196 ZHEJIANG DAHUA TECHNOLOGY CO., LTD.: PRODUCT LAUNCHES
  • TABLE 197 ZHEJIANG DAHUA TECHNOLOGY CO., LTD.: DEALS
  • TABLE 198 ZHEJIANG DAHUA TECHNOLOGY CO., LTD.: OTHER DEVELOPMENTS
  • TABLE 199 HONEYWELL INTERNATIONAL INC.: COMPANY OVERVIEW
  • TABLE 200 HONEYWELL INTERNATIONAL INC.: PRODUCTS/SOLUTIONS/SERVICES OFFERED
  • TABLE 201 HONEYWELL INTERNATIONAL INC.: PRODUCT LAUNCHES
  • TABLE 202 HONEYWELL INTERNATIONAL INC.: DEALS
  • TABLE 203 AT&T: COMPANY OVERVIEW
  • TABLE 204 AT&T: PRODUCTS/SOLUTIONS/SERVICES OFFERED
  • TABLE 205 IBM CORPORATION: COMPANY OVERVIEW
  • TABLE 206 IBM CORPORATION: PRODUCTS/SOLUTIONS/SERVICES OFFERED
  • TABLE 207 CISCO SYSTEMS, INC.: COMPANY OVERVIEW
  • TABLE 208 CISCO SYSTEMS, INC.: PRODUCTS/SOLUTIONS/SERVICES OFFERED
  • TABLE 209 CISCO SYSTEMS, INC.: DEALS
  • TABLE 210 AXIS COMMUNICATIONS AB: COMPANY OVERVIEW
  • TABLE 211 AXIS COMMUNICATIONS AB: PRODUCTS/SOLUTIONS/SERVICES OFFERED
  • TABLE 212 AXIS COMMUNICATIONS AB: PRODUCT LAUNCHES
  • TABLE 213 AXIS COMMUNICATIONS AB: DEALS
  • TABLE 214 AXIS COMMUNICATIONS AB: OTHER DEVELOPMENTS
  • TABLE 215 JOHNSON CONTROLS INC.: COMPANY OVERVIEW
  • TABLE 216 JOHNSON CONTROLS INC.: PRODUCTS/SOLUTIONS/SERVICES OFFERED
  • TABLE 217 JOHNSON CONTROLS INC.: PRODUCT LAUNCHES
  • TABLE 218 JOHNSON CONTROLS INC.: DEALS
  • TABLE 219 SONY GROUP CORPORATION: COMPANY OVERVIEW
  • TABLE 220 SONY GROUP CORPORATION: PRODUCTS/SOLUTIONS/SERVICES OFFERED
  • TABLE 221 SONY GROUP CORPORATION: PRODUCT LAUNCHES
  • TABLE 222 SONY GROUP CORPORATION: DEALS
  • TABLE 223 SHARP CORPORATION: COMPANY OVERVIEW
  • TABLE 224 SHARP CORPORATION: PRODUCTS/SOLUTIONS/SERVICES OFFERED
  • TABLE 225 TELEDYNE TECHNOLOGIES INCORPORATED: COMPANY OVERVIEW
  • TABLE 226 TELEDYNE TECHNOLOGIES INCORPORATED: PRODUCTS/SERVICES/SOLUTIONS OFFERED
  • TABLE 227 TELEDYNE TECHNOLOGIES INCORPORATED: PRODUCT LAUNCHES
  • TABLE 228 TELEDYNE TECHNOLOGIES INCORPORATED: DEALS
  • TABLE 229 CORNING INCORPORATED: COMPANY OVERVIEW
  • TABLE 230 CORNING INCORPORATED: PRODUCTS/SOLUTIONS/SERVICES OFFERED
  • TABLE 231 CORNING INCORPORATED: DEALS
  • TABLE 232 PIXART IMAGING INC.: COMPANY OVERVIEW
  • TABLE 233 PIXART IMAGING INC.: PRODUCTS/SOLUTIONS/SERVICES OFFERED
  • TABLE 234 EXOSENS: COMPANY OVERVIEW
  • TABLE 235 EXOSENS: PRODUCTS/SOLUTIONS/SERVICES OFFERED
  • TABLE 236 EXOSENS: DEALS
  • TABLE 237 EXOSENS: OTHER DEVELOPMENTS
  • TABLE 238 SENSTAR CORPORATION: COMPANY OVERVIEW
  • TABLE 239 SENSTAR CORPORATION: PRODUCTS/SOLUTIONS/SERVICES OFFERED
  • TABLE 240 SENSTAR CORPORATION: PRODUCT LAUNCHES
  • TABLE 241 SENSTAR CORPORATION: DEALS
  • TABLE 242 SENSTAR CORPORATION: EXPANSIONS
  • TABLE 243 SENSTAR CORPORATION: OTHER DEVELOPMENTS
  • TABLE 244 IRISITY: COMPANY OVERVIEW
  • TABLE 245 IRISITY: PRODUCTS/SOLUTIONS/SERVICES OFFERED
  • TABLE 246 IRISITY: PRODUCT LAUNCHES
  • TABLE 247 IRISITY: DEALS
  • TABLE 248 IRISITY: EXPANSIONS
  • TABLE 249 HEXAGON AB: COMPANY OVERVIEW
  • TABLE 250 HEXAGON AB: PRODUCTS/SERVICES/SOLUTIONS OFFERED
  • TABLE 251 HEXAGON AB: PRODUCT LAUNCHES
  • TABLE 252 HEXAGON AB: DEALS
  • TABLE 253 HEXAGON AB: OTHER DEVELOPMENTS
  • TABLE 254 ALLGOVISION TECHNOLOGIES PVT. LTD.: COMPANY OVERVIEW
  • TABLE 255 INTELLIVISION: COMPANY OVERVIEW
  • TABLE 256 PURETECH SYSTEMS INC.: COMPANY OVERVIEW
  • TABLE 257 VCA TECHNOLOGY LTD.: COMPANY OVERVIEW
  • TABLE 258 IOMNISCIENT PTY LTD.: COMPANY OVERVIEW
  • TABLE 259 FLUKE CORPORATION: COMPANY OVERVIEW
  • TABLE 260 BRIEFCAM: COMPANY OVERVIEW
  • TABLE 261 OMNIVISION: COMPANY OVERVIEW
  • TABLE 262 HINALEA IMAGING CORP.: COMPANY OVERVIEW
  • TABLE 263 PHOTON ETC.: COMPANY OVERVIEW
  • TABLE 264 WYZE LABS, INC.: COMPANY OVERVIEW
  • TABLE 265 SPOT AI, INC.: COMPANY OVERVIEW
  • TABLE 266 RHOMBUS SYSTEMS: COMPANY OVERVIEW
LIST OF FIGURES
 
  • FIGURE 1 VIDEO AS A SENSOR MARKET SEGMENTATION
  • FIGURE 2 MARKET: RESEARCH DESIGN
  • FIGURE 3 MARKET: RESEARCH APPROACH
  • FIGURE 4 MARKET: BOTTOM-UP APPROACH
  • FIGURE 5 MARKET: TOP-DOWN APPROACH
  • FIGURE 6 VIDEO SURVEILLANCE MARKET: MARKET SIZE ESTIMATION METHODOLOGY (SUPPLY-SIDE ANALYSIS)
  • FIGURE 7 MARKET BREAKDOWN AND DATA TRIANGULATION
  • FIGURE 8 RESEARCH ASSUMPTIONS
  • FIGURE 9 VIDEO AS A SENSOR MARKET SIZE, 2021–2029 (USD BILLION)
  • FIGURE 10 HARDWARE SEGMENT TO DOMINATE VIDEO AS A SENSOR MARKET IN 2029
  • FIGURE 11 VIDEO SURVEILLANCE SEGMENT TO LEAD MARKET IN 2029
  • FIGURE 12 COMMERCIAL SEGMENT TO HOLD LARGEST SHARE OF MARKET IN 2029
  • FIGURE 13 SECURITY & SURVEILLANCE SEGMENT TO HOLD LARGEST SHARE OF MARKET IN 2029
  • FIGURE 14 ASIA PACIFIC TO RECORD HIGHEST CAGR IN MARKET DURING FORECAST PERIOD
  • FIGURE 15 RAPID TECHNOLOGICAL DEVELOPMENTS IN AI, ML, AND CAMERA TECHNOLOGIES TO DRIVE MARKET
  • FIGURE 16 HARDWARE SEGMENT TO HOLD LARGEST SHARE OF MARKET IN 2029
  • FIGURE 17 VIDEO SURVEILLANCE SEGMENT TO DOMINATE MARKET IN 2029
  • FIGURE 18 COMMERCIAL SEGMENT TO CAPTURE MAJORITY OF MARKET SHARE IN 2029
  • FIGURE 19 SECURITY & SURVEILLANCE SEGMENT TO SECURE LARGEST MARKET SHARE IN 2029
  • FIGURE 20 VIDEO SURVEILLANCE AND US TO LEAD NORTH AMERICAN MARKET IN 2024
  • FIGURE 21 CHINA TO EXHIBIT HIGHEST CAGR IN GLOBAL MARKET DURING FORECAST PERIOD
  • FIGURE 22 VIDEO AS A SENSOR MARKET: DRIVERS, RESTRAINTS, OPPORTUNITIES, AND CHALLENGES
  • FIGURE 23 NUMBER OF VIOLENT CRIMES ACROSS US, 2018 TO 2024
  • FIGURE 24 MARKET: IMPACT ANALYSIS OF DRIVERS
  • FIGURE 25 MARKET: IMPACT ANALYSIS OF RESTRAINTS
  • FIGURE 26 MARKET: IMPACT ANALYSIS OF OPPORTUNITIES
  • FIGURE 27 MARKET: IMPACT ANALYSIS OF CHALLENGES
  • FIGURE 28 VALUE CHAIN ANALYSIS
  • FIGURE 29 VIDEO AS A SENSOR ECOSYSTEM ANALYSIS
  • FIGURE 30 AVERAGE SELLING PRICE TREND OF VIDEO SURVEILLANCE CAMERAS OFFERED BY KEY PLAYERS, BY END USER, 2023
  • FIGURE 31 AVERAGE SELLING PRICE TREND OF CAMERA TYPES, 2020–2023
  • FIGURE 32 AVERAGE SELLING PRICE TREND OF IP CAMERAS, BY REGION, 2020–2023
  • FIGURE 33 INVESTMENT AND FUNDING SCENARIO
  • FIGURE 34 TRENDS/DISRUPTIONS IMPACTING CUSTOMER BUSINESS
  • FIGURE 35 VIDEO AS A SENSOR MARKET: PORTER'S FIVE FORCES ANALYSIS
  • FIGURE 36 INFLUENCE OF STAKEHOLDERS ON BUYING PROCESS FOR TOP THREE END USERS
  • FIGURE 37 KEY BUYING CRITERIA FOR TOP THREE END USERS
  • FIGURE 38 IMPORT SCENARIO FOR HS CODE 852580-COMPLIANT PRODUCTS, BY COUNTRY, 2019–2023
  • FIGURE 39 EXPORT SCENARIO FOR HS CODE 852580-COMPLIANT PRODUCTS, BY COUNTRY, 2019–2023
  • FIGURE 40 PATENT ANALYSIS, 2014–2023
  • FIGURE 41 AI USE CASES IN VIDEO AS A SENSOR MARKET
  • FIGURE 42 MARKET, BY OFFERING
  • FIGURE 43 HARDWARE TO DOMINATE VIDEO AS A SENSOR MARKET IN 2029
  • FIGURE 44 CAMERAS TO DOMINATE MARKET IN 2029
  • FIGURE 45 VIDEO MANAGEMENT SOFTWARE TO DOMINATE MARKET IN 2029
  • FIGURE 46 INSTALLATION AND MAINTENANCE SERVICES TO DOMINATE MARKET IN 2029
  • FIGURE 47 VIDEO AS A SENSOR MARKET, BY PRODUCT TYPE
  • FIGURE 48 VIDEO SURVEILLANCE PRODUCTS TO DOMINATE MARKET IN 2029
  • FIGURE 49 MARKET, BY APPLICATION
  • FIGURE 50 SECURITY & SURVEILLANCE APPLICATIONS TO REGISTER HIGHEST CAGR IN MARKET DURING FORECAST PERIOD
  • FIGURE 51 MARKET, BY END USER
  • FIGURE 52 COMMERCIAL END USERS TO SECURE LARGEST MARKET SHARE IN 2029
  • FIGURE 53 MARKET, BY REGION
  • FIGURE 54 CHINA TO WITNESS HIGHEST CAGR IN GLOBAL MARKET DURING FORECAST PERIOD
  • FIGURE 55 NORTH AMERICA: VIDEO AS A SENSOR MARKET SNAPSHOT
  • FIGURE 56 US TO DOMINATE NORTH AMERICAN MARKET DURING FORECAST PERIOD
  • FIGURE 57 PROPERTY CRIMES IN US, JANUARY 2021–JANUARY 2023
  • FIGURE 58 EUROPE: VIDEO AS A SENSOR MARKET SNAPSHOT
  • FIGURE 59 GERMANY TO EXHIBIT HIGHEST CAGR IN MARKET DURING FORECAST PERIOD
  • FIGURE 60 ASIA PACIFIC: MARKET SNAPSHOT
  • FIGURE 61 CHINA TO DOMINATE ASIA PACIFIC MARKET DURING FORECAST PERIOD
  • FIGURE 62 MIDDLE EAST TO CAPTURE LARGEST SHARE OF MARKET IN ROW DURING FORECAST PERIOD
  • FIGURE 63 VIDEO SURVEILLANCE MARKET: REVENUE ANALYSIS OF TOP FOUR KEY PLAYERS, 2019–2023
  • FIGURE 64 VIDEO SURVEILLANCE MARKET: SHARE OF KEY PLAYERS, 2023
  • FIGURE 65 COMPANY VALUATION, 2024
  • FIGURE 66 FINANCIAL METRICS, 2024
  • FIGURE 67 PRODUCT COMPARISON
  • FIGURE 68 VIDEO AS A SENSOR MARKET: COMPANY EVALUATION MATRIX (KEY PLAYERS), 2023
  • FIGURE 69 MARKET: COMPANY FOOTPRINT
  • FIGURE 70 MARKET: COMPANY EVALUATION MATRIX (STARTUPS/SMES), 2023
  • FIGURE 71 MOTOROLA SOLUTIONS, INC.: COMPANY SNAPSHOT
  • FIGURE 72 HANGZHOU HIKVISION DIGITAL TECHNOLOGY CO., LTD.: COMPANY SNAPSHOT
  • FIGURE 73 ZHEJIANG DAHUA TECHNOLOGY CO., LTD.: COMPANY SNAPSHOT
  • FIGURE 74 HONEYWELL INTERNATIONAL INC.: COMPANY SNAPSHOT
  • FIGURE 75 AT&T: COMPANY SNAPSHOT
  • FIGURE 76 IBM CORPORATION: COMPANY SNAPSHOT
  • FIGURE 77 CISCO SYSTEMS, INC.: COMPANY SNAPSHOT
  • FIGURE 78 AXIS COMMUNICATIONS AB: COMPANY SNAPSHOT
  • FIGURE 79 JOHNSON CONTROLS INC.: COMPANY SNAPSHOT
  • FIGURE 80 SONY GROUP CORPORATION: COMPANY SNAPSHOT
  • FIGURE 81 SHARP CORPORATION: COMPANY SNAPSHOT
  • FIGURE 82 TELEDYNE TECHNOLOGIES INCORPORATED: COMPANY SNAPSHOT
  • FIGURE 83 CORNING INCORPORATED: COMPANY SNAPSHOT
  • FIGURE 84 PIXART IMAGING INC.: COMPANY SNAPSHOT
  • FIGURE 85 SENSTAR CORPORATION: COMPANY SNAPSHOT
  • FIGURE 86 IRISITY: COMPANY SNAPSHOT
  • FIGURE 87 HEXAGON AB: COMPANY SNAPSHOT


The study involved four major activities for estimating the video as a sensor market size. Exhaustive secondary research has been conducted to collect information relevant to the market, its peer markets, and its child market. Primary research has been undertaken to validate key findings, assumptions, and sizing with industry experts across the value chain of the video as a sensor market. Both top-down and bottom-up approaches have been employed to estimate the complete market size. It has been followed by the market breakdown and data triangulation methods to estimate the size of different segments and subsegments of the market.

Secondary Research

The research methodology used to estimate and forecast the size of the video as a sensor market began with the acquisition of data related to the revenues of key vendors in the market through secondary research. Various secondary sources have been referred to in the secondary research process for identifying and collecting information for this study. Secondary sources include annual reports, press releases, and investor presentations of companies; white papers, journals, certified publications, and articles by recognized authors; websites; directories; and databases. Secondary research has mainly been used to obtain key information about the value chain of the video as a sensor market, key players, market classification, and segmentation according to the industry trends to the bottom-most level, geographic markets, and key developments from both market and technology-oriented perspectives. Secondary data has been collected and analyzed to determine the overall market size, further validated through primary research. Some of the secondary research referred to for this research study involves the Institute of Electrical and Electronics Engineers (IEEE), Federal Communications Commission (FCC), National Institute of Standards and Technology (NIST), American National Standards Institute, Semiconductor Industry Association, Digital Imaging Association, Society for Imaging Sciences and Technology, and Camera & Imaging Products Association (CIPA). Moreover, the study involved extensive use of secondary sources, directories, and databases, such as Hoovers, Bloomberg Businessweek, Factiva, and OneSource, to identify and collect valuable information for a technical, market-oriented, and commercial study of the video as a sensor market. Vendor offerings have been taken into consideration to determine market segmentation.

Primary Research

In the primary research, various primary sources from both the supply and demand sides have been interviewed to obtain the qualitative and quantitative information relevant to this report. Primary sources from the supply side include the key industry participants, subject-matter experts (SMEs), and C-level executives and consultants from various key companies and organizations in the video as a sensor ecosystem. After the complete market engineering (including calculations for the market statistics, the market breakdown, the market size estimations, the market forecasting, and the data triangulation), extensive primary research has been conducted to verify and validate the critical market numbers obtained. Extensive qualitative and quantitative analyses have been performed during the market engineering process to list key information/insights throughout the report. Extensive primary research has been conducted after understanding the video as a sensor market scenario through secondary research. Several primary interviews have been conducted with market experts from the demand and supply-side players across key regions, namely, North America, Europe, Asia Pacific, and the Rest of the World (Middle East, Africa, and South America). Various primary sources from both the supply and demand sides of the market have been interviewed to obtain qualitative and quantitative information. Following is the breakdown of the primary respondents.

Primary data has been collected through questionnaires, emails, and telephonic interviews. In the canvassing of primaries, various departments within organizations, such as sales, operations, and administration, were covered to provide a holistic viewpoint in our report. After interacting with industry experts, brief sessions were conducted with highly experienced independent consultants to reinforce the findings from our primaries. This and the in-house subject matter experts’ opinions have led us to the findings described in the remainder of this report.
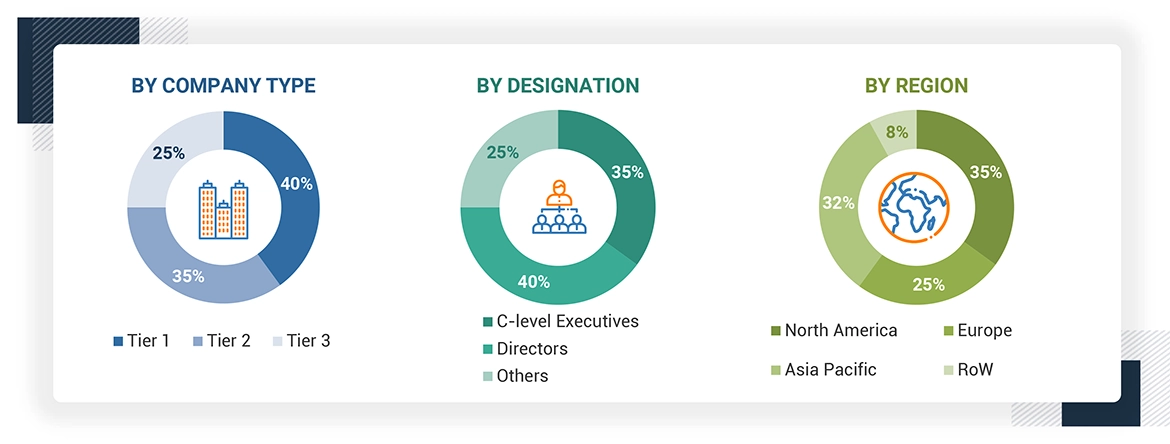
Note: The three tiers of the companies are defined based on their total revenue in 2023: Tier 1 - revenue greater than or equal to USD 1 billion; Tier 2 - revenue between USD 100 million and USD 1 billion; and Tier 3 revenue less than or equal to USD 100 million. Other designations include sales managers, marketing managers, and product managers.

About the assumptions considered for the study, To know download the pdf brochure

Market Size Estimation

The total size of the video as a sensor market has been estimated and validated using both top-down and bottom-up approaches. Furthermore, these methods have also been used extensively to estimate the size of various subsegments in the market. The research methodology used to estimate the market size is as follows:

  • Identifying various entities influencing the value chain of the video as a sensor market
  • Identifying major companies, product manufacturers, system integrators, and solutions developers operating in the market
  • Estimating segment-level revenue of individual key players operating in the video as a sensor market
  • Estimating the size of the video as a sensor market for each industry segment, such as government, commercial, industrial, and residential
  • Estimating the size of the video as a sensor market for each region based on the demand for video as a sensor system and solutions
  • Tracking the ongoing and upcoming video as a sensor systems product launches to forecast the market size based on these developments and other critical parameters
  • Estimating the size of the global video as a sensor market and growth rate at the segment and sub-segment levels

Video as a Sensor Market : Top-Down and Bottom-Up Approach

Data Triangulation

After arriving at the overall size of the video as a sensor market from the market size estimation process explained above, the total market has been split into several segments and subsegments. Data triangulation and market breakdown procedures have been employed, wherever applicable, to complete the overall market engineering process and arrive at the exact statistics for all segments and subsegments of the market. The data has been triangulated by studying various factors and trends from both the demand and supply sides. Along with this, the market size has been validated using both top-down and bottom-up approaches.

Market Definition

Video as a sensor is a technology that integrates video surveillance systems with smart analytics capabilities used for converting visual data into actionable insight. A video as a sensor system consists of the installation of cameras and associated technologies that capture videos that are analyzed in real-time to detect events, track behaviors, and enhance situational awareness in retail, healthcare, transportation, and public safety. Video as a sensor market contains products such as hyperspectral imaging, video surveillance, and machine vision and monitoring. Solutions included in the market include video as a sensor for retail analytics, health care, manufacturing, mapping, security and surveillance, and traffic management.

Key Stakeholders

  • Raw material vendors
  • Component providers
  • Video as a sensor software developers
  • Video surveillance as a service (VSaaS) providers
  • Video surveillance cameras and other hardware manufacturers
  • Original equipment manufacturers (OEMs)
  • Video as a sensor system integrators
  • Video surveillance service providers
  • Technology standards organizations, forums, alliances, and associations
  • Governments, financial institutions, and investment communities
  • Research organizations
  • Analysts and strategic business planners
  • Venture capitalists, private equity firms, and startup companies
  • Distributors
  • End users such as commercial, government, industrial, and residential

Report Objectives

  • To define, describe, segment, and forecast the size of the video as a sensor market, by offering, product type, application, and end-user, in terms of value
  • To describe and forecast the market size for camera type in terms of volume
  • To forecast the market size for various segments with respect to four main regions—North America, Europe, Asia Pacific, and the Rest of the World (RoW)—in terms of value
  • To provide detailed information regarding the drivers, restraints, opportunities, and challenges influencing the growth of video as a sensor market
  • To study the complete value chain analysis of the video as a sensor market landscape
  • To strategically analyze macro and micromarkets1 with respect to growth trends, prospects, and their contributions to the overall market
  • To provide a detailed overview of the ecosystem analysis, case study analysis, patent analysis, trade analysis, technology analysis, average selling price (ASP) analysis, AI impact analysis, Porter’s five forces analysis, macroeconomic outlook, and regulations pertaining to the market of the video as a sensor.
  • To analyze opportunities in the market for stakeholders and provide a detailed competitive landscape
  • To strategically profile key players in the market and comprehensively analyze their market share/ranking and core competencies2
  • To analyze competitive developments by players in the video as a sensor market, such as contracts, product launches/developments, expansions, and research and development (R&D) activities

Micromarkets are defined as the further segments and subsegments of the video as a sensor market included in the report.

Core competencies of companies are defined in terms of their key developments and key strategies adopted to sustain their positions in the market.

Available Customizations:

With the given market data, MarketsandMarkets offers customizations according to the company’s specific needs. The following customization options are available for the report:

Company Information

  • Detailed analysis and profiling of additional market players based on various blocks of the value chain.


Previous Versions of this Report

Custom Market Research Services

We Will Customise The Research For You, In Case The Report Listed Above Does Not Meet With Your Requirements

Get 10% Free Customisation

Growth opportunities and latent adjacency in Video as a Sensor Market

DMCA.com Protection Status