This research involved using extensive secondary sources and databases, such as Factiva and Bloomberg, to identify and collect information useful for a technical and market-oriented study of the Tube Packaging market. Primary sources included industry experts from related industries and preferred suppliers, manufacturers, distributors, technologists, standards & certification organizations, and organizations related to all segments of the value chain of this industry. In-depth interviews have been conducted with various primary respondents, such as key industry participants, subject matter experts (SMEs), executives of key companies, and industry consultants, to obtain and verify critical qualitative and quantitative information as well as to assess growth prospects.
Secondary Research
In the secondary research process, various sources such as annual reports, press releases, and investor presentations of companies; white papers; and publications from recognized websites and databases have been referred to for identifying and collecting information. Secondary research has been used to obtain key information about the industry's supply chain, the total pool of key players, market classification and segmentation according to the industry trends to the bottom-most level, regional markets, and key developments from both market- and technology-oriented perspectives.
Primary Research
The Tube Packaging market comprises several stakeholders in the supply chain, which include suppliers, processors, and end-product users. Various primary sources from the supply and demand sides of the markets have been interviewed to obtain qualitative and quantitative information. The primary participants from the demand side include key opinion leaders, executives, managers, directors, and CEOs of companies in the Tube Packaging market. Primary sources from the supply side include associations and institutions involved in the Tube Packaging industry, key opinion leaders, and processing players.
Following is the breakdown of primary respondents

To know about the assumptions considered for the study, download the pdf brochure
Market Size Estimation
Both top-down and bottom-up approaches were used to estimate and validate the size of the global Tube Packaging market. The research methodology used to estimate the market size includes the following:
-
The key players in the industry were identified through extensive secondary research.
-
The supply chain of the industry and market size, in terms of value and volume, were determined through primary and secondary research.
-
All percentage shares split, and breakdowns were determined using secondary sources and verified through primary sources.
-
All possible parameters that affect the markets covered in this research study were accounted for, viewed in extensive detail, verified through primary research, and analyzed to obtain the final quantitative and qualitative data.
-
The research includes the study of reports, reviews, and newsletters of key industry players along with extensive interviews with key officials, such as directors and marketing executives.
Market Size Estimation: Bottom-Up Approach

To know about the assumptions considered for the study, Request for Free Sample Report
Market Size Estimation: Top-Down Approach

Data Triangulation
After arriving at the total market size from the estimation process explained above, the overall market was split into several segments and subsegments. To complete the overall market size estimation process and arrive at the exact statistics for all segments and subsegments, the data triangulation and market breakdown procedures have been employed, wherever applicable. The data have been triangulated by studying various factors and trends from both the demand and supply sides. In addition, the market size has been validated by using both the top-down and bottom-up approaches.
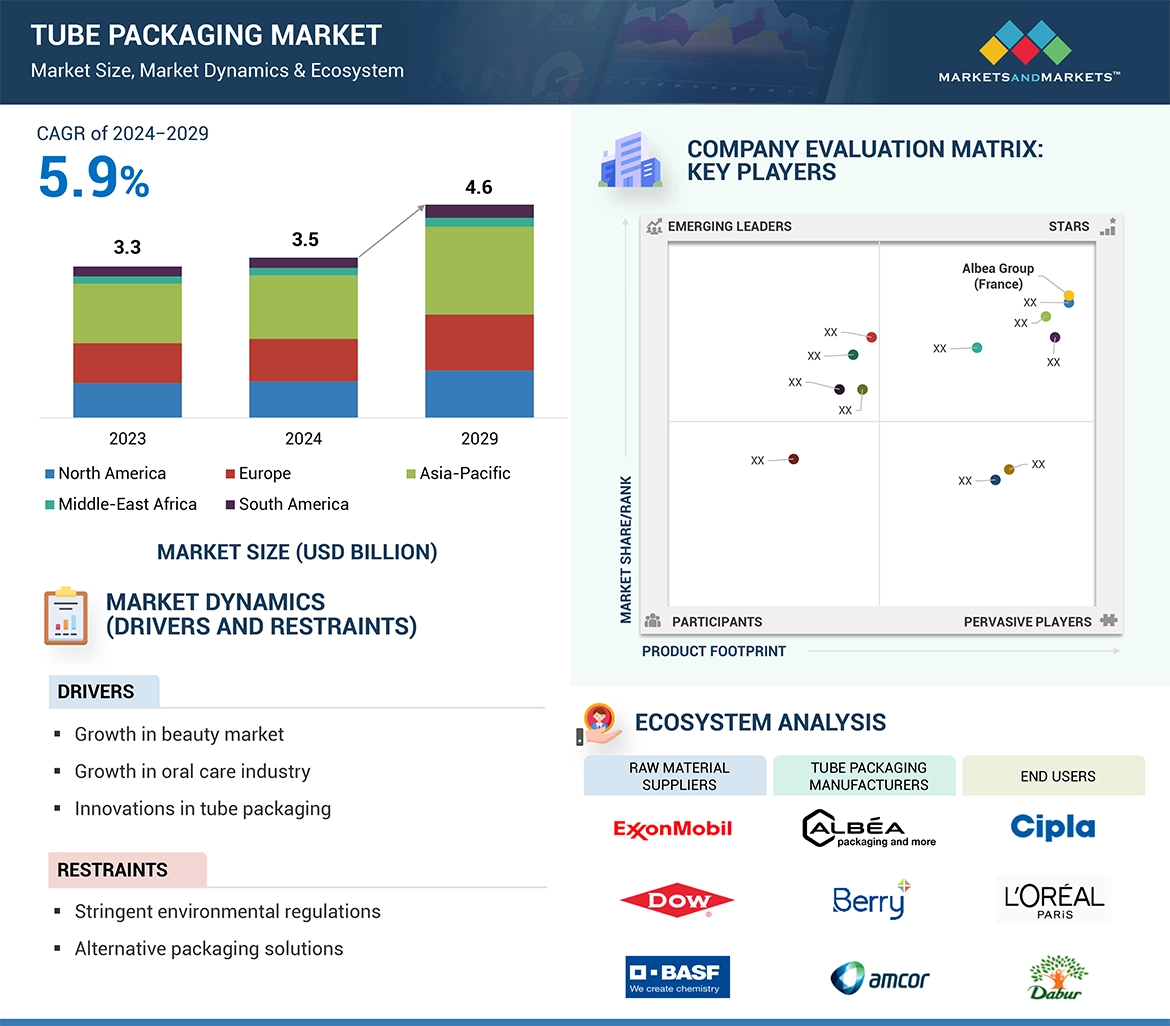
Market Definition
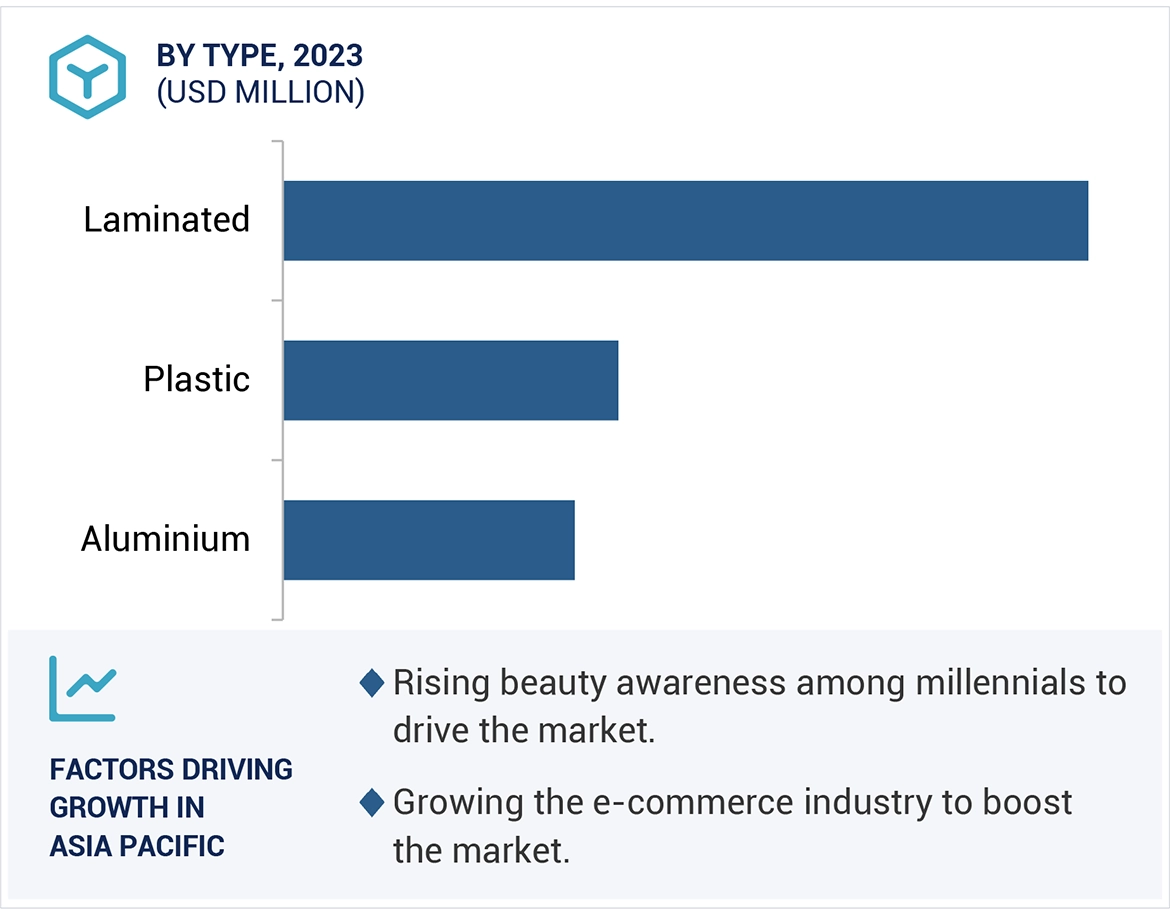
Tube packaging is basically manufactured from the materials such as aluminium, laminated, and plastics. These tubes are generally consumed in several application areas such as oral care, beauty & cosmetics, pharmaceuticals, food & beverages, cleaning products, and others. The tubes can provide protection from outside contamination agents which help ensure product integrity. In addition to this, the tubes are able to provide design flexibility, which helps to enhance the visual appeal of the packaging. The tube packaging market consists of several segments such as type, packaging types, capacity, and applications. In type segments, the tubes are classified into several categories, such as laminated, plastic, and aluminum. In packaging type segment, the tubes come in several formats, such as squeeze & collapsible, twist, and others. In terms of application, the tube packaging divided into several categories such as oral care, beauty & cosmetics, pharmaceuticals, food & beverages, cleaning products, and others. In addition to this, the tube market can be further divided on the basis of tube capacities such as up to 50mL, 51mL-100mL, 101mL-150mL, and above 150mL.
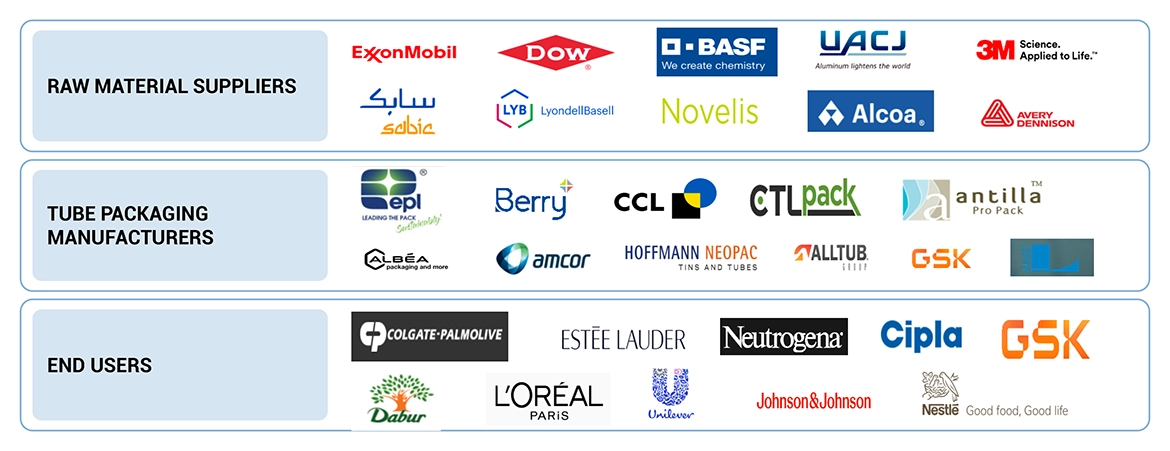
Key Stakeholders
-
Raw Material Suppliers
-
Regulatory Bodies
-
Government, and consulting firms
-
End User
-
Research and Development Organizations
-
Tube Packaging manufacturers, dealers, traders, and suppliers.
Report Objectives
-
To define, describe, and forecast the global Tube Packaging market in terms of value, and volume.
-
To provide insights regarding the significant factors influencing the growth of the market (drivers, restraints, opportunities, and challenges)
-
To analyze and forecast the market based on type, packaging type, application, capacity, and region
-
To forecast the market size, in terms of value and volume, with respect to five main regions: North America, Europe, Asia Pacific, South America, and Middle East & Africa.
-
To analyze the opportunities in the market for stakeholders and provide details of the competitive landscape.
-
To strategically profile key players in the market.
-
To analyze competitive developments in the market, such as new product launches, capacity expansions, partnerships, and mergers & acquisitions.
-
To strategically profile the leading players and comprehensively analyze their key developments in the market.
Available Customizations:
Along with the given market data, MarketsandMarkets offers customizations as per the specific needs of the companies. The following customization options are available for the report:
Product Analysis:
-
Product Matrix which gives a detailed comparison of the product portfolio of each company
Regional Analysis:
-
Further breakdown of the Rest of the APAC Tube Packaging market
-
Further breakdown of the Rest of Europe’s Tube Packaging market
Company Information:
-
Detailed analysis and profiling of additional market players (up to 5)


Growth opportunities and latent adjacency in Tube Packaging Market