Top 10 Food Safety Testing and Technologies Trends Market

Top 10 Food Safety Testing and Technologies Trends Market (Food Safety, GM Food Safety, Food Pathogen, Meat Speciation, Food Authenticity, Pesticide Residue, Mycotoxin, Allergen, Water, and Bottled Water) - Global Forecast to 2028

Report Code: FB 5026 Oct, 2023, by marketsandmarkets.com

The global food safety testing and technologies trends market size is anticipated to grow at a CAGR of 8.2%, reaching USD 22.7 billion in 2023 and USD 33.7 billion by the end of 2028. The globalization of the food supply chain is a significant trend that has transformed the way food products are produced, distributed, and consumed worldwide. It refers to the increasing interconnectedness of food production, processing, and distribution on a global scale. This trend has several implications for food safety, including the need for standardized pathogen testing.  Strategic developments such as expansions, new product launches, and agreements have been adopted by most key players to strengthen their market presence.

Top 10 Food Safety Testing and Technologies Trends

To know about the assumptions considered for the study, Request for Free Sample Report

Top 10 Food Safety Testing and Technologies Trends

To know about the assumptions considered for the study, download the pdf brochure

Market Dynamics

Availability of advanced rapid technology

Manufacturers of food products have multiple testing methods at their disposal to ensure the safety of their products. Various analytical techniques are used to perform chemical testing, including traditional "wet chemical" methods, as well as advanced techniques such as infrared spectroscopy, gas and liquid chromatography, and mass spectrometry. When combined with liquid or gas chromatography, mass spectrometry is the preferred chemical test method as it can detect low concentrations of analyses in complex food matrices.

When it comes to analyzing the microbiology of food, traditional methods involve using selective agars or other biochemical assays. However, DNA-based and biomolecular analytical methods are becoming increasingly popular for testing food safety. These techniques can detect food allergies and potentially harmful bacteria, among other substances. They also provide an efficient way to verify claims about animal or fish-based food sources, which can help combat fraudulent activity and counterfeiting. Unfortunately, microbiological tests and culturing technologies can take two to four days to complete, making them time-consuming. Rapid testing methods are gaining popularity because they generate results within a few hours, which is crucial for ensuring quality and driving the global food pathogen testing market's growth.

In the food industry, accuracy and speed are crucial in preventing and containing the spread of foodborne diseases through microbiological testing. Many scientific techniques are developed and continuously innovated to meet these criteria. Recently, real-time results can be obtained to detect the presence of potentially harmful microbial contaminants in food matrices, albeit with some restrictions. In contrast, traditional culture-based methods take several days to process, delaying decisions on the safety of food products and the need for further investigation. Rapid testing methods like polymerase chain reaction (PCR), immunoassay-based techniques, and chromatography & spectrometry are used to ensure timely analysis of larger sample sizes, reducing the time for food pathogen testing. Moreover, advanced technologies like immunoassay and chromatography & spectrometry can detect food contaminants of biological and chemical origin, leading to increased adoption and driving the market for food pathogen testing.

Scientists and researchers are constantly discovering new and improved methods for testing food pathogens, both chemically and microbiologically. These methods are becoming more efficient and faster, allowing for several compounds to be analyzed in a single test run. The use of techniques such as QuEChERS has also made sample preparation easier and more automated. QuEChERS-based preparations do not require pre-concentration processes and only need minimal extract clean-up, making them the preferred method for evaluating pesticide residues in fruits and vegetables. This technique has also been expanded to include testing for other contaminants like antibiotics and substances found in various food matrices, such as meat, fish, and wine. Advancements in gas chromatography high-resolution mass spectrometry equipment and associated software tools have shown great potential for non-targeted testing and detection of both known and unidentified chemical contaminants and environmental pollutants in the food supply chain.

Restraints: Complexity in testing techniques

The increasing complexity in testing techniques poses a significant restraint for the food and water safety testing industry. While these advanced techniques offer improved accuracy and sensitivity, they can be costly to implement, require highly skilled personnel, and demand more time for analysis. Many advanced testing methods, such as PCR (Polymerase Chain Reaction) for pathogen detection or mass spectrometry for chemical analysis, require a high level of expertise to operate and interpret results accurately. Skilled personnel are needed to manage and maintain these sophisticated instruments, which can be a challenge for smaller laboratories or regions with a shortage of trained professionals.

The complexity of food and water matrices means that multiple testing techniques are often necessary to detect a wide range of contaminants, including pathogens, allergens, chemical residues, and toxins. Coordinating and managing this array of methods adds complexity to testing regimes and can lead to logistical challenges. This complexity can lead to higher testing costs, delays in results, and resource constraints for both regulatory bodies and food industry stakeholders. Striking a balance between the benefits of advanced testing techniques and the practicality of implementation is a continual challenge in ensuring food and water safety.

Furthermore, some advanced testing methods may not be readily available or accessible in all geographic regions, especially in developing countries. This can result in disparities in food safety testing capabilities and hinder global efforts to ensure the safety of food and water supplies.

Opportunity: The Post-COVID-19 Surge in Food and Water Safety Concerns

The COVID-19 pandemic has prompted a profound shift in consumer priorities, with a marked increase in concern regarding food and water safety. This heightened awareness of health and safety has opened a remarkable window of opportunity for the food and water safety testing industry. Consumers now place a stronger emphasis on products that are rigorously tested and certified as safe for consumption, a trend that is expected to persist. Furthermore, the pandemic has triggered a reevaluation of food and water safety at every stage of the supply chain. Governments and regulatory bodies are responding with stricter regulations and standards, creating a growing demand for testing and compliance services. The need for supply chain resilience has also come into focus, with safety testing playing a pivotal role in ensuring the integrity of products from farm to table. Consumers are demanding greater transparency in the food supply chain, seeking information on the origin and production of their food and water, as well as its compliance with safety standards. This aligns seamlessly with the food safety testing industry's core objectives. Moreover, technology has rapidly advanced within the industry, offering innovative solutions such as rapid testing methods, automation, and digital tools that make safety testing more accessible and cost-effective. The surge in food and water safety concerns presents significant opportunities for the industry in emerging markets. As economies grow and middle-class populations expand, there is considerable potential for investment and growth in regions seeking to bolster food safety standards. Global collaboration is on the rise, with stakeholders worldwide working together to establish universal safety standards and best practices. This interconnected approach will shape the industry's future. So, the post-COVID-19 landscape offers a pivotal moment for the food and water safety testing industry. By embracing technology, expanding services, and advocating the importance of safety testing, stakeholders can not only contribute to public health protection but also experience substantial growth in an evolving and dynamic market.

Challenges: High cost associated with procurement of food safety testing equipment

One of the most pressing challenges confronting the food and water safety testing industry is the high cost associated with procuring advanced testing equipment. Ensuring the safety and quality of food and water products demands state-of-the-art technology and precision testing methods. However, this need for cutting-edge equipment often comes with a substantial financial burden. For many smaller laboratories, startups, or businesses with limited resources, the cost of acquiring and maintaining advanced testing equipment can be a significant barrier to entry. This financial constraint not only limits their ability to participate in the industry but also hinders their capacity to compete with more established players. Even for established stakeholders, the high procurement costs can strain budgets and present an ongoing financial challenge. These organizations often face the dilemma of needing to make capital investments in costly equipment to maintain the highest standards of food and water safety. Consequently, the adoption of newer, more effective testing methods may be slowed down due to these financial constraints.

Market EcoSystem

Top 10 Food Safety Testing and Technologies Trends EcoSystem

The GMO food safety testing segment is projected to be the fastest growing in the food safety testing market during the forecast period.

The GMO food safety testing market is currently witnessing the fastest growth within the broader food safety testing market. This accelerated growth can be attributed to the increasing adoption of GM crops, driven by the need for higher yields, resistance to pests and diseases, and improved environmental sustainability in agriculture. With the proliferation of GM crops, there is a growing imperative for rigorous safety testing to ensure these products are safe for human consumption and the environment. Stringent regulatory requirements, consumer concerns, and the necessity for comprehensive testing to meet both international and domestic standards have all contributed to the remarkable expansion of the GMO food safety testing market, making it one of the most dynamic and rapidly evolving segments in the field of food safety testing.

The PCR-based testing segment is projected to dominate the GMO food safety market during the forecast period.

The PCR (Polymerase Chain Reaction) based testing segment is currently dominating the GMO food testing market for several compelling reasons. PCR-based methods are highly precise, sensitive, and specific in detecting the presence of specific DNA sequences, which makes them particularly effective in identifying genetically modified ingredients in food products. This technology offers the advantage of rapid results, enabling quick and efficient screening of large batches of food items. As the demand for accurate GMO food testing continues to rise, PCR-based methods have become the gold standard in ensuring compliance with labeling regulations and meeting consumer expectations for transparency and safety in the food industry.

Fruits and vegetables testing is projected to be the fastest-growing segment in the pesticide residue testing market during the forecast period.

The fruit and vegetables segment is currently dominating the pesticide residue testing market due to several compelling factors. As consumer awareness of pesticide-related health concerns grows, the demand for safe and residue-free fruits and vegetables has surged. This has led to stringent regulations and standards for pesticide residue levels, which the industry must adhere to. The fruit and vegetables sector has experienced a substantial increase in testing activities to ensure compliance with these regulations. Additionally, the rising popularity of organic produce and the need to verify claims of pesticide-free products have further bolstered the demand for pesticide residue testing in this segment. As a result, it continues to be a pivotal and thriving market within the broader food safety testing industry.

Asia Pacific region emerged as the fastest-growing region during the forecast period

Asia Pacific region is poised to exhibit the fastest growth during the forecast period in various industries and sectors. This robust expansion can be attributed to several factors, including rapid urbanization, burgeoning middle-class populations, and increasing consumer demand for a wide range of goods and services. As a result, Asia Pacific presents a fertile ground for market opportunities and investments, attracting both domestic and international businesses. The region's dynamic economic landscape, combined with the adoption of new technologies, innovations, and government initiatives, has fueled this accelerated growth, making it a pivotal region to watch for business expansion and market development in 2023 and beyond.

Top 10 Food Safety Testing and Technologies Trends Regional Analysis

Key Market Players

Key players in the food safety testing market include SGS Société Générale De Surveillance SA (Switzerland), Bureau Veritas (France), Intertek Group PLC (UK), Eurofins Scientific (Luxembourg), and ALS (Australia).

Want to explore hidden markets that can drive new revenue in Top 10 Food Safety Testing and Technologies Trends Market?

Scope of the Report

Report Metric

Details

Market size available for years

2018-2028

Base year considered

2022

Forecast period

2023-2028

Forecast units

Value (USD million/billion)

Segments covered

Food safety testing, GMO food safety testing, food pathogen testing, meat speciation testing, food authenticity testing, pesticide residue testing, mycotoxin testing, allergen testing, water testing and analysis, and bottled water testing equipment market

Geographies covered

North America, Europe, Asia Pacific, and the Rest of the World (RoW)

Key Companies covered

SGS Société Générale De Surveillance SA (Switzerland), Bureau Veritas (France), Intertek Group PLC (UK), Eurofins Scientific (Luxembourg), ALS (Australia), TUV Nord Group (Germany), AsureQuality (New Zealand), Mérieux NutriSciences Corporation (US), Microbac Laboratories, Inc. (Pennsylvania), IFP Institute for Product Quality GmbH (Germany), EMSL Analytical, Inc. (US), Symbio Laboratories (Australia), Hill Laboratories (New Zealand), Thermo Fisher Scientific Inc. (US), Bio-Rad Laboratories, Inc. (US), Romer Labs (Austria), FoodChain ID (US), Nova Biologicals (US), Certified Laboratories (US),  IEH Inc. (US), PrimusLabs (US), PT Seafood Inspection Laboratory (Indonesia), Eureka (India), BioMedal (Spain), and Element Materials Technology (UK)

This research report provides the top 10 food safety and testing technologies trends market such as:

  • Food safety testing
  • GMO food safety testing
  • Food pathogen testing
  • Meat speciation testing
  • Food authenticity testing
  • Pesticide residue testing
  • Mycotoxin testing
  • Allergen testing
  • Water testing and analysis
  • Bottled water testing equipment market

Recent Developments:

  1. In May 2023, SGS entered a partnership with Eezytrace. The collaboration with Eezytrace strengthened the testing, inspection, and certification services of SGS Société Générale de Surveillance SA (Switzerland).
  2. In April 2023, Eurofins Scientific (Luxembourg) acquired Rheonix. This partnership enables Eurofins to include the Rheonix Listeria PatternAlert Assay in their microbiology laboratory network.
  3. In March 2023, SGS acquired Asmecruz Laboratory. The acquisition will enhance SGS’s capabilities in the field of seafood testing, strengthening its position as a trusted provider of quality and safety services for the seafood industry.
  4. In March 2022, Bureau Veritas opened its fifth Canadian Microbiology Laboratory located in Winnipeg, Manitoba. The new laboratory will offer Rapid Pathogen testing (E.coli O157:H7, Salmonella & Listeria), as well as Indicators (Generic E.coli/Coliforms, Total Plate Count, Yeast & Mold).
  5. In July 2021, Intertek Group acquired Brazil-based JLA Brasil Laboratório de Análises de Alimentos SA ('JLA'), one of the leading providers of food, agriculture, and environmental testing solutions. This acquisition will help Intertek enhance its food safety testing service portfolio for Brazilian customers.

Frequently Asked Questions (FAQ):

To speak to our analyst for a discussion on the above findings, click Speak to Analyst

Exclusive indicates content/data unique to MarketsandMarkets and not available with any competitors.

INTRODUCTION
44
RESEARCH METHODOLOGY
48
EXECUTIVE SUMMARY
60
PREMIUM INSIGHTS
64
MARKET OVERVIEW
67
  • 5.1 INTRODUCTION
  • 5.2 MACROECONOMIC INDICATORS
    LARGE-SCALE OUTBREAKS OF FOODBORNE DISEASES GLOBALLY
    RAPID EXPANSION OF FOOD TRADE ACROSS BORDERS
  • 5.3 MARKET DYNAMICS
    DRIVERS
    - Prevalence of foodborne diseases linked to cross-contamination and complex supply chains
    - Advancements in testing technologies
    - High demand for convenience and packaged food products
    - Increased food recalls due to non-compliance with food safety standards
    - Rising consumer awareness about food safety
    RESTRAINTS
    - Inconsistent enforcement of hygiene and safety standards, inadequate infrastructure, and lack of coordination among stakeholders
    - Complexities associated with testing techniques
    OPPORTUNITIES
    - Constant innovations in contaminant detection and food safety technologies
    - Spike in food safety concerns after COVID-19
    CHALLENGES
    - Inflated costs associated with procurement of food and water testing equipment
    - Varying results with different testing methods
INDUSTRY TRENDS
87
  • 6.1 INTRODUCTION
  • 6.2 SUPPLY CHAIN ANALYSIS
    UPSTREAM PROCESSES
    - Research and development (R&D)
    - Production
    MIDSTREAM PROCESSES
    - Processing and transforming
    - Transportation
    DOWNSTREAM PROCESSES
    - Final preparation
    - Distribution
  • 6.3 VALUE CHAIN ANALYSIS
    RAW MATERIAL PROVIDERS
    FOOD AND BEVERAGE COMPANIES
    PRODUCT DISTRIBUTORS
  • 6.4 TECHNOLOGY ANALYSIS
    FOURIER TRANSFORM INFRARED (FTIR)
    MICROARRAY
    PHAGE
    BIOCHIP
    BIOSENSOR
    FLOW CYTOMETRY
    NUCLEAR MAGNETIC RESONANCE (NMR)
    NEAR-INFRARED SPECTROSCOPY (NIRS)
    INDUCTIVELY COUPLED PLASMA (ICP)
  • 6.5 PATENT ANALYSIS
  • 6.6 TRADE ANALYSIS
  • 6.7 KEY STAKEHOLDERS AND BUYING CRITERIA
    KEY STAKEHOLDERS IN BUYING PROCESS
    BUYING CRITERIA
  • 6.8 TRENDS/DISRUPTIONS IMPACTING CUSTOMER BUSINESS
  • 6.9 ECOSYSTEM/MARKET MAP
  • 6.10 CASE STUDY ANALYSIS
  • 6.11 PORTER’S FIVE FORCES ANALYSIS
    INTENSITY OF COMPETITIVE RIVALRY
    BARGAINING POWER OF BUYERS
    BARGAINING POWER OF SUPPLIERS
    THREAT OF SUBSTITUTES
    THREAT OF NEW ENTRANTS
  • 6.12 KEY CONFERENCES AND EVENTS, 2023–2024
  • 6.13 REGULATORY LANDSCAPE
    REGULATORY BODIES, GOVERNMENT AGENCIES, AND OTHER ORGANIZATIONS
    REGULATORY FRAMEWORK FOR FOOD SAFETY TESTING
    - International regulatory bodies for food safety
    - North America
    - Europe
    - Asia Pacific
    - RoW
    REGULATORY FRAMEWORK FOR FOOD PATHOGEN TESTING
    - North America
    - Europe
    - Asia Pacific
    - South America
    - RoW
    REGULATORY FRAMEWORK FOR GMO FOOD SAFETY TESTING
    - Cartagena protocol
    - WTO regulations
    - North America
    - Europe
    - Asia Pacific
    - South America
    - RoW
    REGULATORY FRAMEWORK FOR PESTICIDE RESIDUE SAFETY TESTING
    - International bodies for food safety standards and regulations
    - North America
    - Europe
    - General Food Law for food safety
    - Asia Pacific
    - RoW
    REGULATORY FRAMEWORK FOR MYCOTOXIN TESTING
    - Factors affecting constitution of mycotoxin regulations in food and feed
    - International bodies for food safety standards and regulations
    - North America
    - Europe
    - Asia Pacific
    - Food Safety Standards Amendment Regulations, 2011
    - Food Safety Standards Amendment Regulations, 2012
    - South America
    REGULATORY FRAMEWORK FOR FOOD ALLERGEN TESTING
    - International bodies for food safety standards and regulations
    - Codex Alimentarius Commission (CAC)
    - Global Food Safety Initiative (GFSI)
    - North America
    - Europe
    - Asia Pacific
    - Japan
    - RoW
FOOD SAFETY TESTING MARKET
192
  • 7.1 MARKET DEFINITION
  • 7.2 MARKET ANALYSIS
    FOOD SAFETY TESTING MARKET, REGIONAL ANALYSIS
    FOOD SAFETY TESTING MARKET, BY TARGET TESTED
    FOOD SAFETY TESTING MARKET, BY TECHNOLOGY
    FOOD SAFETY TESTING MARKET, BY FOOD TESTED
  • 7.3 COMPETITIVE LANDSCAPE
    OVERVIEW
    KEY STRATEGIES ADOPTED BY MAJOR PLAYERS
    MARKET SHARE ANALYSIS, 2022
    SEGMENTAL REVENUE ANALYSIS OF FIVE KEY PLAYERS, 2018–2022
    COMPANY EVALUATION MATRIX, 2022
    - Stars
    - Emerging leaders
    - Pervasive players
    - Participants
    COMPANY FOOTPRINT
    STARTUPS/SMALL AND MEDIUM-SIZED ENTERPRISES (SMES) EVALUATION MATRIX, 2022
    - Progressive companies
    - Starting blocks
    - Responsive companies
    - Dynamic companies
    COMPETITIVE BENCHMARKING
    COMPETITIVE SCENARIOS AND TRENDS
    - Product/Service launches
    - Deals
    - Others
GMO FOOD SAFETY TESTING MARKET
234
  • 8.1 MARKET DEFINITION
  • 8.2 MARKET ANALYSIS
    GMO FOOD SAFETY TESTING MARKET, REGIONAL ANALYSIS
    GLOBAL ADOPTION OF GM CROPS
    GMO FOOD SAFETY TESTING MARKET ANALYSIS, BY TRAIT
    GMO FOOD SAFETY TESTING MARKET ANALYSIS, BY TECHNOLOGY
    GMO FOOD SAFETY TESTING MARKET ANALYSIS, BY FOOD TESTED
  • 8.3 COMPETITIVE LANDSCAPE
    OVERVIEW
    GMO FOOD SAFETY TESTING MARKET SHARE AND RANKING ANALYSIS OF FIVE KEY PLAYERS, 2022
    COMPETITIVE SCENARIOS AND TRENDS
    - Product/Service launches
    - Deals
    - Others
FOOD AUTHENTICITY TESTING MARKET
254
  • 9.1 MARKET DEFINITION
  • 9.2 MARKET ANALYSIS
    FOOD AUTHENTICITY TESTING MARKET, REGIONAL ANALYSIS
    FOOD AUTHENTICITY TESTING MARKET, BY TARGET TESTED
    FOOD AUTHENTICITY TESTING MARKET, BY FOOD TESTED
    FOOD AUTHENTICITY TESTING MARKET, BY TECHNOLOGY
  • 9.3 COMPETITIVE LANDSCAPE
    OVERVIEW
    FOOD AUTHENTICITY TESTING MARKET SHARE AND RANKING ANALYSIS OF FIVE KEY PLAYERS, 2022
    COMPETITIVE SCENARIOS AND TRENDS
    - Product/Service launches
    - Deals
    - Others
FOOD PATHOGEN TESTING MARKET
269
  • 10.1 MARKET DEFINITION
  • 10.2 MARKET ANALYSIS
    FOOD PATHOGEN TESTING MARKET, REGIONAL ANALYSIS
    FOOD PATHOGEN TESTING MARKET, BY PATHOGEN TYPE
    FOOD PATHOGEN TESTING MARKET, BY FOOD TESTED
    FOOD PATHOGEN TESTING MARKET, BY TECHNOLOGY
  • 10.3 COMPETITIVE LANDSCAPE
    OVERVIEW
    MARKET SHARE ANALYSIS, 2022
    SEGMENTAL REVENUE ANALYSIS OF FIVE KEY PLAYERS, 2018–2022
    ANNUAL REVENUE VS. GROWTH OF KEY PLAYERS
    KEY PLAYERS IN EBITDA
    KEY STRATEGIES ADOPTED BY MAJOR PLAYERS
    GLOBAL SNAPSHOT OF KEY MARKET PARTICIPANTS
    COMPANY EVALUATION MATRIX, 2022
    - Stars
    - Emerging leaders
    - Pervasive players
    - Participants
    COMPANY FOOTPRINT
    STARTUPS/SMES COMPANY EVALUATION MATRIX, 2022
    - Progressive companies
    - Starting blocks
    - Responsive companies
    - Dynamic companies
    COMPETITIVE BENCHMARKING
    COMPETITIVE SCENARIOS AND TRENDS
    - Product/Service launches
    - Deals
    - Others
MYCOTOXIN TESTING MARKET
299
  • 11.1 MARKET DEFINITION
  • 11.2 MARKET ANALYSIS
    MYCOTOXIN TESTING MARKET, REGIONAL ANALYSIS
    MYCOTOXIN TESTING MARKET, BY TYPE
    MYCOTOXIN TESTING MARKET, BY FOOD TESTED
    MYCOTOXIN TESTING MARKET, BY TECHNOLOGY
  • 11.3 COMPETITIVE LANDSCAPE
    OVERVIEW
    MYCOTOXIN TESTING MARKET SHARE AND RANKING ANALYSIS OF FIVE KEY PLAYERS, 2022
    COMPETITIVE SCENARIOS AND TRENDS
    - Product/Service launches
    - Deals
    - Others
ALLERGEN TESTING MARKET
322
  • 12.1 MARKET DEFINITION
  • 12.2 MARKET ANALYSIS
    FOOD ALLERGEN TESTING MARKET, REGIONAL ANALYSIS
    FOOD ALLERGEN MARKET, BY SOURCE
    FOOD ALLERGEN MARKET, BY TECHNOLOGY
    FOOD ALLERGEN TESTING MARKET, BY FOOD TESTED
  • 12.3 COMPETITIVE LANDSCAPE
    OVERVIEW
    FOOD ALLERGEN TESTING MARKET SHARE AND RANKING ANALYSIS OF FIVE KEY PLAYERS, 2022
    COMPETITIVE SCENARIOS AND TRENDS
    - Product/Service launches
    - Deals
    - Others
MEAT SPECIATION TESTING MARKET
342
  • 13.1 MARKET DEFINITION
  • 13.2 MARKET ANALYSIS
    MEAT SPECIATION TESTING MARKET, REGIONAL ANALYSIS
    MEAT SPECIATION MARKET, BY SPECIES
    MEAT SPECIATION MARKET, BY TECHNOLOGY
    MEAT SPECIATION MARKET, BY FORM
  • 13.3 COMPETITIVE LANDSCAPE
    OVERVIEW
    MEAT SPECIATION TESTING MARKET SHARE AND RANKING ANALYSIS OF FIVE KEY PLAYERS, 2022
    COMPETITIVE SCENARIOS AND TRENDS
    - Product/Service launches
    - Deals
    - Others
PESTICIDE RESIDUE TESTING MARKET
358
  • 14.1 MARKET DEFINITION
  • 14.2 MARKET ANALYSIS
    PESTICIDE RESIDUE TESTING MARKET, REGIONAL ANALYSIS
    PESTICIDE RESIDUE TESTING MARKET, BY TYPE
    PESTICIDE RESIDUE TESTING MARKET, BY TECHNOLOGY
    PESTICIDE RESIDUE MARKET, BY FOOD TESTED
  • 14.3 COMPETITIVE LANDSCAPE
    OVERVIEW
    PESTICIDE RESIDUE TESTING MARKET SHARE AND RANKING ANALYSIS OF FIVE KEY PLAYERS, 2022
    COMPETITIVE SCENARIOS AND TRENDS
    - Product/Service launches
    - Deals
    - Others
WATER TESTING & ANALYSIS MARKET
378
  • 15.1 MARKET DEFINITION
  • 15.2 MARKET ANALYSIS
    WATER TESTING & ANALYSIS MARKET, REGIONAL ANALYSIS
    WATER TESTING & ANALYSIS MARKET, BY PRODUCT
    WATER TESTING & ANALYSIS MARKET, BY PRODUCT TYPE
    WATER TESTING & ANALYSIS MARKET, BY APPLICATION
  • 15.3 COMPETITIVE LANDSCAPE
    OVERVIEW
    WATER TESTING & ANALYSIS MARKET SHARE AND RANKING ANALYSIS OF FIVE KEY PLAYERS, 2022
    COMPETITIVE SCENARIOS AND TRENDS
    - Product/Service launches
    - Deals
    - Others
BOTTLED WATER TESTING EQUIPMENT MARKET
389
  • 16.1 MARKET DEFINITION
  • 16.2 MARKET ANALYSIS
    BOTTLED WATER TESTING EQUIPMENT MARKET, REGIONAL ANALYSIS
    BOTTLED WATER TESTING EQUIPMENT MARKET, BY TECHNOLOGY
    BOTTLED WATER TESTING EQUIPMENT MARKET, BY COMPONENT
    BOTTLED WATER TESTING EQUIPMENT MARKET, BY TEST TYPE
  • 16.3 COMPETITIVE LANDSCAPE
    OVERVIEW
    BOTTLED WATER TESTING EQUIPMENT MARKET SHARE AND RANKING ANALYSIS OF KEY PLAYERS, 2022
    COMPETITIVE SCENARIOS AND TRENDS
    - Product/Service launches
    - Deals
    - Others
COMPANY PROFILES
401
  • 17.1 KEY PLAYERS
    SGS SOCIÉTÉ GÉNÉRALE DE SURVEILLANCE SA.
    - Business overview
    - Products/Solutions/Services offered
    - Recent developments
    - MnM view
    BUREAU VERITAS
    - Business overview
    - Products/Solutions/Services offered
    - Recent developments
    - MnM view
    INTERTEK GROUP PLC
    - Business overview
    - Products/Solutions/Services offered
    - Recent developments
    - MnM view
    EUROFINS SCIENTIFIC
    - Business overview
    - Products/Solutions/Services offered
    - Recent developments
    - MnM view
    ALS
    - Business overview
    - Products/Solutions/Services offered
    - Recent developments
    - MnM view
    TÜV NORD GROUP
    - Business overview
    - Products/Solutions/Services offered
    - Recent developments
    - MnM view
    ASUREQUALITY
    - Business overview
    - Products/Solutions/Services offered
    - Recent developments
    - MnM view
    MÉRIEUX NUTRISCIENCES CORPORATION
    - Business overview
    - Products/Solutions/Services offered
    - Recent developments
    - MnM view
    MICROBAC LABORATORIES, INC.
    - Business overview
    - Products/Solutions/Services offered
    - Recent developments
    - MnM view
    IFP INSTITUTE FOR PRODUCT QUALITY GMBH
    - Business overview
    - Products/Solutions/Services offered
    - Recent developments
    - MnM view
    EMSL ANALYTICAL, INC.
    - Business overview
    - Products/Solutions/Services offered
    - Recent developments
    - MnM view
    SYMBIO LABORATORIES
    - Business overview
    - Products/Solutions/Services offered
    - Recent developments
    - MnM view
    HILL LABORATORIES COMPANY
    - Business overview
    - Products/Solutions/Services offered
    - Recent developments
    - MnM view
    THERMO FISHER SCIENTIFIC INC.
    - Business overview
    - Products/Solutions/Services offered
    - Recent developments
    - MnM view
    BIO-RAD LABORATORIES, INC.
    - Business overview
    - Products/Solutions/Services offered
    - Recent developments
    - MnM view
  • 17.2 STARTUPS/SMES
    ROMER LABS DIVISION HOLDING
    - Business overview
    - Products/Solutions/Services offered
    - Recent developments
    - MnM view
    FOODCHAIN ID
    - Business overview
    - Products/Solutions/Services offered
    - Recent developments
    - MnM view
    NOVA BIOLOGICALS
    - Business overview
    - Products/Solutions/Services offered
    - Recent developments
    - MnM view
    CERTIFIED LABORATORIES
    - Business overview
    - Products/Solutions/Services offered
    - Recent developments
    - MnM view
    IEH INC.
    - Business overview
    - Products/Solutions/Services offered
    - Recent developments
    - MnM view
    PRIMUSLABS
    - Business overview
    - Products/Solutions/Services offered
    - Recent developments
    - MnM view
  • 17.3 OTHER PLAYERS
    PT SEAFOOD INSPECTION LABORATORY
    EUREKA ANALYTICAL SERVICES PRIVATE LIMITED
    BIOMEDAL
    ELEMENT MATERIALS TECHNOLOGY
    ACCEPTA WATER TREATMENT
APPENDIX
489
  • 18.1 DISCUSSION GUIDE
  • 18.2 KNOWLEDGESTORE: MARKETSANDMARKETS’ SUBSCRIPTION PORTAL
  • 18.3 CUSTOMIZATION OPTIONS
  • 18.4 RELATED REPORTS
  • 18.5 AUTHOR DETAILS
LIST OF TABLES
 
  • TABLE 1 USD EXCHANGE RATES, 2018–2022
  • TABLE 2 MAJOR REASONS FOR FOOD RECALLS IN US, 2022
  • TABLE 3 LIST OF FOOD RECALLS, 2020–2021
  • TABLE 4 TOP FOOD TESTING TECHNOLOGY INNOVATIONS
  • TABLE 5 LIST OF MAJOR PATENTS PERTAINING TO FOOD PATHOGEN TESTING, 2013–2022
  • TABLE 6 INFLUENCE OF STAKEHOLDERS ON BUYING PROCESS FOR TECHNOLOGIES (%)
  • TABLE 7 KEY CRITERIA FOR SELECTING SUPPLIER/VENDOR FOR TECHNOLOGIES
  • TABLE 8 EUROFINS MICROBIOLOGY LABORATORY NETWORK REDUCED TESTING TIME WITH RHEONIX LISTERIA PATTERNALERT ASSAY
  • TABLE 9 EUROFINS REDUCED PRODUCTION TO LOGISTICS TURNAROUND TIME WITH SCIENTIFIC EXPRESSMICRO SERVICE
  • TABLE 10 SUNSHINE MILLS APPROACHED BARROW-AGEE LABORATORIES TO MEET QUALITY TESTING NEEDS
  • TABLE 11 FOOD SAFETY TESTING MARKET: PORTER’S FIVE FORCES ANALYSIS
  • TABLE 12 FOOD SAFETY TESTING MARKET: LIST OF KEY CONFERENCES AND EVENTS, 2023–2024
  • TABLE 13 NORTH AMERICA: LIST OF REGULATORY BODIES, GOVERNMENT AGENCIES, AND OTHER ORGANIZATIONS
  • TABLE 14 EUROPE: LIST OF REGULATORY BODIES, GOVERNMENT AGENCIES, AND OTHER ORGANIZATIONS
  • TABLE 15 ASIA PACIFIC: LIST OF REGULATORY BODIES, GOVERNMENT AGENCIES, AND OTHER ORGANIZATIONS
  • TABLE 16 SOUTH AMERICA: LIST OF REGULATORY BODIES, GOVERNMENT AGENCIES, AND OTHER ORGANIZATIONS
  • TABLE 17 FEDERAL FOOD, DRUG, AND COSMETIC ACT, BY TOLERANCE OF RAW AND PROCESSED FOOD PRODUCTS
  • TABLE 18 MAXIMUM LEVEL FOR MELAMINE AND STRUCTURAL ANALOGS
  • TABLE 19 GMO LABELING THRESHOLD IN ASIA PACIFIC COUNTRIES
  • TABLE 20 AFM1 REGULATORY LIMITS FOR DAIRY PRODUCTS
  • TABLE 21 AFLATOXIN B1 AND M1 REGULATORY LIMITS FOR FOOD AND FEED IN US
  • TABLE 22 DEOXYNIVALENOL REGULATORY LIMITS FOR FOOD AND FEED IN US
  • TABLE 23 FUMONISIN B1, B2, AND B3 REGULATORY LIMITS FOR FOOD AND FEED IN US
  • TABLE 24 AFLATOXIN B1 AND M1 REGULATORY LIMITS FOR FOOD AND FEED IN EUROPEAN UNION
  • TABLE 25 FUMONISIN B1 AND B2 REGULATORY LIMITS FOR FOOD AND FEED IN EUROPEAN UNION
  • TABLE 26 OCHRATOXIN REGULATORY LIMITS FOR FOOD AND FEED IN EUROPEAN UNION
  • TABLE 27 CITRININ, PATULIN, AND TROPANE ALKALOIDS REGULATORY LIMITS FOR FOOD IN EUROPEAN UNION
  • TABLE 28 ZEARALENONE REGULATORY LIMITS FOR FOOD AND FEED IN EUROPEAN UNION
  • TABLE 29 T-2 AND HT-2 REGULATORY LIMITS FOR FOOD AND FEED IN EUROPEAN UNION
  • TABLE 30 DEOXYNIVALENOL REGULATORY LIMITS FOR FOOD AND FEED IN EUROPEAN UNION
  • TABLE 31 COMMISSION REGULATION FOR OCHRATOXIN A
  • TABLE 32 AFLATOXIN B1 AND M1 REGULATORY LIMITS FOR FOOD AND FEED IN JAPAN
  • TABLE 33 DEOXYNIVALENOL REGULATORY LIMITS FOR FOOD AND FEED IN JAPAN
  • TABLE 34 AFLATOXIN B1 AND M1 REGULATORY LIMITS FOR FOOD AND FEED IN INDONESIA
  • TABLE 35 MYCOTOXIN REGULATORY LIMITS FOR FOOD IN INDONESIA
  • TABLE 36 MYCOTOXIN REGULATORY LIMITS FOR FOOD IN MALAYSIA
  • TABLE 37 MYCOTOXIN REGULATORY LIMITS FOR FOOD IN SOUTH KOREA
  • TABLE 38 AFLATOXIN B1 AND M1 REGULATORY LIMITS FOR FOOD AND FEED IN CHINA
  • TABLE 39 DEOXYNIVALENOL REGULATORY LIMITS FOR FOOD AND FEED IN CHINA
  • TABLE 40 OCHRATOXIN REGULATORY LIMITS FOR FOOD AND FEED IN CHINA
  • TABLE 41 ZEARALENONE REGULATORY LIMITS FOR FOOD AND FEED IN CHINA
  • TABLE 42 FOOD SAFETY TESTING MARKET, BY REGION, 2018–2022 (USD MILLION)
  • TABLE 43 FOOD SAFETY TESTING MARKET, BY REGION, 2023–2028 (USD MILLION)
  • TABLE 44 FOOD SAFETY TESTING MARKET, BY TARGET TESTED, 2018–2022 (USD MILLION)
  • TABLE 45 FOOD SAFETY TESTING MARKET, BY TARGET TESTED, 2023–2028 (USD MILLION)
  • TABLE 46 FOOD SAFETY TESTING MARKET, BY TECHNOLOGY, 2018–2022 (USD MILLION)
  • TABLE 47 FOOD SAFETY TESTING MARKET, BY TECHNOLOGY, 2023–2028 (USD MILLION)
  • TABLE 48 FOOD SAFETY TESTING MARKET, BY RAPID TECHNOLOGY, 2018–2022 (USD MILLION)
  • TABLE 49 FOOD SAFETY TESTING MARKET, BY RAPID TECHNOLOGY, 2023–2028 (USD MILLION)
  • TABLE 50 FOODBORNE PATHOGENS BY SOURCE
  • TABLE 51 FOOD RECALLS IN US, 2021–2022
  • TABLE 52 FOOD SAFETY TESTING MARKET, BY FOOD TESTED, 2018–2022 (USD MILLION)
  • TABLE 53 FOOD SAFETY TESTING MARKET, BY FOOD TESTED, 2023–2028 (USD MILLION)
  • TABLE 54 OVERVIEW OF KEY STRATEGIES ADOPTED BY MAJOR PLAYERS
  • TABLE 55 FOOD SAFETY TESTING MARKET SHARE ANALYSIS, 2022
  • TABLE 56 TARGET TESTED: COMPANY FOOTPRINT
  • TABLE 57 TECHNOLOGY: COMPANY FOOTPRINT
  • TABLE 58 REGION: COMPANY FOOTPRINT
  • TABLE 59 OVERALL COMPANY FOOTPRINT
  • TABLE 60 FOOD SAFETY TESTING MARKET: LIST OF KEY STARTUPS/SMES
  • TABLE 61 FOOD SAFETY TESTING MARKET: COMPETITIVE BENCHMARKING OF KEY STARTUPS/SMES
  • TABLE 62 FOOD SAFETY TESTING MARKET: PRODUCT/SERVICE LAUNCHES, 2019–2023
  • TABLE 63 FOOD SAFETY TESTING MARKET: DEALS, 2019–2023
  • TABLE 64 FOOD SAFETY TESTING MARKET: OTHERS, 2019–2023
  • TABLE 65 GMO FOOD SAFETY TESTING MARKET, BY REGION, 2018–2022 (USD MILLION)
  • TABLE 66 GMO FOOD SAFETY TESTING MARKET, BY REGION, 2023–2028 (USD MILLION)
  • TABLE 67 GMO FOOD SAFETY TESTING MARKET, BY TRAIT, 2018–2022 (USD MILLION)
  • TABLE 68 GMO FOOD SAFETY TESTING MARKET, BY TRAIT, 2023–2028 (USD MILLION)
  • TABLE 69 GMO FOOD SAFETY TESTING MARKET, BY TECHNOLOGY, 2018–2022 (USD MILLION)
  • TABLE 70 GMO FOOD SAFETY TESTING MARKET, BY TECHNOLOGY, 2023–2028 (USD MILLION)
  • TABLE 71 GMO FOOD SAFETY TESTING MARKET, BY FOOD TESTED, 2018–2022 (USD MILLION)
  • TABLE 72 GMO FOOD SAFETY TESTING MARKET, BY FOOD TESTED, 2023–2028 (USD MILLION)
  • TABLE 73 GMO FOOD SAFETY TESTING MARKET: PRODUCT/SERVICE LAUNCHES, 2019–2023
  • TABLE 74 GMO FOOD SAFETY MARKET: DEALS, 2019–2023
  • TABLE 75 GMO FOOD SAFETY MARKET: OTHERS, 2019–2023
  • TABLE 76 FOOD AUTHENTICITY TESTING MARKET, BY REGION, 2018–2022 (USD MILLION)
  • TABLE 77 FOOD AUTHENTICITY TESTING MARKET, BY REGION, 2023–2028 (USD MILLION)
  • TABLE 78 FOOD AUTHENTICITY TESTING MARKET, BY TARGET TESTED, 2018–2022 (USD MILLION)
  • TABLE 79 FOOD AUTHENTICITY TESTING MARKET, BY TARGET TESTED, 2023–2028 (USD MILLION)
  • TABLE 80 FOOD AUTHENTICITY TESTING MARKET, BY FOOD TESTED, 2018–2022 (USD MILLION)
  • TABLE 81 FOOD AUTHENTICITY TESTING MARKET, BY FOOD TESTED, 2023–2028 (USD MILLION)
  • TABLE 82 FOOD AUTHENTICITY TESTING MARKET, BY TECHNOLOGY, 2018–2022 (USD MILLION)
  • TABLE 83 FOOD AUTHENTICITY TESTING MARKET, BY TECHNOLOGY, 2023–2028 (USD MILLION)
  • TABLE 84 FOOD AUTHENTICITY TESTING MARKET: PRODUCT/SERVICE LAUNCHES, 2019–2023
  • TABLE 85 FOOD AUTHENTICITY TESTING MARKET: DEALS, 2019–2023
  • TABLE 86 FOOD AUTHENTICITY TESTING MARKET: OTHERS, 2019–2023
  • TABLE 87 FOOD PATHOGEN TESTING MARKET, BY REGION, 2018–2022 (USD MILLION)
  • TABLE 88 FOOD PATHOGEN TESTING MARKET, BY REGION, 2023–2028 (USD MILLION)
  • TABLE 89 PATHOGENESIS OF COMMON PATHOGENS
  • TABLE 90 FOOD PATHOGEN TESTING MARKET, BY TYPE, 2018–2022 (USD MILLION)
  • TABLE 91 FOOD PATHOGEN TESTING MARKET, BY TYPE, 2023–2028 (USD MILLION)
  • TABLE 92 FOODBORNE PATHOGENS, BY FOOD SOURCE
  • TABLE 93 FOOD PATHOGEN TESTING MARKET, BY FOOD TESTED, 2018–2022 (USD MILLION)
  • TABLE 94 FOOD PATHOGEN TESTING MARKET, BY FOOD TESTED, 2023–2028 (USD MILLION)
  • TABLE 95 FOOD PATHOGEN TESTING MARKET, BY TECHNOLOGY, 2018–2022 (USD MILLION)
  • TABLE 96 FOOD PATHOGEN TESTING MARKET, BY TECHNOLOGY, 2023–2028 (USD MILLION)
  • TABLE 97 FOOD PATHOGEN TESTING MARKET SHARE ANALYSIS, 2022
  • TABLE 98 OVERVIEW OF KEY STRATEGIES ADOPTED BY MAJOR PLAYERS
  • TABLE 99 TYPE: COMPANY FOOTPRINT
  • TABLE 100 REGION: COMPANY FOOTPRINT
  • TABLE 101 OVERALL COMPANY FOOTPRINT
  • TABLE 102 FOOD PATHOGEN TESTING MARKET: LIST OF KEY STARTUPS/SMES
  • TABLE 103 FOOD PATHOGEN TESTING MARKET: PRODUCT/SERVICE LAUNCHES, 2023–2019
  • TABLE 104 FOOD PATHOGEN TESTING MARKET: DEALS, 2018–2022
  • TABLE 105 FOOD SAFETY TESTING MARKET: OTHERS, 2018–2022
  • TABLE 106 MYCOTOXIN FOOD TESTING MARKET, BY REGION, 2018–2022 (USD MILLION)
  • TABLE 107 MYCOTOXIN TESTING MARKET, BY REGION, 2023–2028 (USD MILLION)
  • TABLE 108 MYCOTOXINS: OCCURRENCE, SOURCE, AND HEALTH EFFECTS
  • TABLE 109 MYCOTOXIN TESTING MARKET, BY TYPE, 2018–2022 (USD MILLION)
  • TABLE 110 MYCOTOXIN TESTING MARKET, BY TYPE, 2023–2028 (USD MILLION)
  • TABLE 111 MYCOTOXIN TESTING MARKET, BY FOOD TESTED, 2018–2022 (USD MILLION)
  • TABLE 112 MYCOTOXIN TESTING MARKET, BY FOOD TESTED, 2023–2028 (USD MILLION)
  • TABLE 113 MYCOTOXIN TESTING MARKET, BY TECHNOLOGY, 2018–2022 (USD MILLION)
  • TABLE 114 MYCOTOXIN TESTING MARKET, BY TECHNOLOGY, 2023–2028 (USD MILLION)
  • TABLE 115 MYCOTOXIN TESTING MARKET: PRODUCT/SERVICE LAUNCHES, 2019–2023
  • TABLE 116 MYCOTOXIN TESTING MARKET: DEALS, 2019–2023
  • TABLE 117 MYCOTOXIN TESTING MARKET: OTHERS, 2019–2023
  • TABLE 118 FOOD ALLERGEN TESTING MARKET, BY REGION, 2018–2022 (USD MILLION)
  • TABLE 119 FOOD ALLERGEN TESTING MARKET, BY REGION, 2023–2028 (USD MILLION)
  • TABLE 120 FOOD ALLERGEN TESTING MARKET, BY SOURCE, 2018–2022 (USD MILLION)
  • TABLE 121 FOOD ALLERGEN TESTING MARKET, BY SOURCE, 2023–2028 (USD MILLION)
  • TABLE 122 FOOD ALLERGEN TESTING MARKET, BY TECHNOLOGY, 2018–2022 (USD MILLION)
  • TABLE 123 FOOD ALLERGEN TESTING MARKET, BY TECHNOLOGY, 2023–2028 (USD MILLION)
  • TABLE 124 FOOD ALLERGEN TESTING MARKET, BY FOOD TESTED, 2018–2022 (USD MILLION)
  • TABLE 125 FOOD ALLERGEN TESTING MARKET, BY FOOD TESTED, 2023–2028 (USD MILLION)
  • TABLE 126 FOOD ALLERGEN TESTING MARKET: PRODUCT/SERVICE LAUNCHES, 2019–2023
  • TABLE 127 FOOD ALLERGEN TESTING MARKET: DEALS, 2019–2023
  • TABLE 128 FOOD ALLERGEN TESTING MARKET: OTHERS, 2019–2023
  • TABLE 129 MEAT SPECIATION TESTING MARKET, BY REGION, 2018–2022 (USD MILLION)
  • TABLE 130 MEAT SPECIATION TESTING MARKET, BY REGION, 2023–2028 (USD MILLION)
  • TABLE 131 MEAT SPECIATION TESTING MARKET, BY SPECIES, 2018–2022 (USD MILLION)
  • TABLE 132 MEAT SPECIATION TESTING MARKET, BY SPECIES, 2023–2028 (USD MILLION)
  • TABLE 133 MEAT SPECIATION TESTING MARKET, BY TECHNOLOGY, 2018–2022 (USD MILLION)
  • TABLE 134 MEAT SPECIATION TESTING MARKET, BY TECHNOLOGY, 2023–2028 (USD MILLION)
  • TABLE 135 MEAT SPECIATION TESTING MARKET, BY FORM, 2018–2022 (USD MILLION)
  • TABLE 136 MEAT SPECIATION TESTING MARKET, BY FORM, 2023–2028 (USD MILLION)
  • TABLE 137 MEAT SPECIATION TESTING MARKET: PRODUCT/SERVICE LAUNCHES, 2019–2023
  • TABLE 138 MEAT SPECIATION TESTING MARKET: DEALS, 2019–2023
  • TABLE 139 MEAT SPECIATION TESTING MARKET: OTHERS, 2019–2023
  • TABLE 140 PESTICIDE RESIDUE TESTING MARKET, BY REGION, 2018–2022 (USD MILLION)
  • TABLE 141 PESTICIDE RESIDUE TESTING MARKET, BY REGION, 2023–2028 (USD MILLION)
  • TABLE 142 PESTICIDE RESIDUE TESTING MARKET, BY TYPE, 2018–2022 (USD MILLION)
  • TABLE 143 PESTICIDE RESIDUE TESTING MARKET, BY TYPE, 2023–2028 (USD MILLION)
  • TABLE 144 PESTICIDE RESIDUE TESTING MARKET, BY TECHNOLOGY, 2018–2022 (USD MILLION)
  • TABLE 145 PESTICIDE RESIDUE TESTING MARKET, BY TECHNOLOGY, 2023–2028 (USD MILLION)
  • TABLE 146 PESTICIDE RESIDUE TESTING MARKET, BY FOOD TESTED, 2018–2022 (USD MILLION)
  • TABLE 147 PESTICIDE RESIDUE TESTING MARKET, BY FOOD TESTED, 2023–2028 (USD MILLION)
  • TABLE 148 PESTICIDE RESIDUE TESTING MARKET: PRODUCT/SERVICE LAUNCHES, 2019–2023
  • TABLE 149 PESTICIDE RESIDUE TESTING MARKET: DEALS, 2019–2023
  • TABLE 150 PESTICIDE RESIDUE TESTING MARKET: OTHERS, 2019–2023
  • TABLE 151 WATER TESTING & ANALYSIS MARKET, BY REGION, 2018–2022 (USD MILLION)
  • TABLE 152 WATER TESTING & ANALYSIS MARKET, BY REGION, 2023–2028 (USD MILLION)
  • TABLE 153 WATER TESTING & ANALYSIS MARKET, BY PRODUCT, 2018–2022 (USD MILLION)
  • TABLE 154 WATER TESTING & ANALYSIS MARKET, BY PRODUCT, 2023–2028 (USD MILLION)
  • TABLE 155 WATER TESTING & ANALYSIS MARKET, BY PRODUCT TYPE, 2018–2022 (USD MILLION)
  • TABLE 156 WATER TESTING & ANALYSIS MARKET, BY PRODUCT TYPE, 2023–2028 (USD MILLION)
  • TABLE 157 WATER TESTING & ANALYSIS MARKET, BY APPLICATION, 2018–2022 (USD MILLION)
  • TABLE 158 WATER TESTING & ANALYSIS MARKET, BY APPLICATION, 2023–2028 (USD MILLION)
  • TABLE 159 WATER TESTING & ANALYSIS MARKET: PRODUCT/SERVICE LAUNCHES, 2019–2023
  • TABLE 160 WATER TESTING & ANALYSIS MARKET: DEALS, 2019–2023
  • TABLE 161 WATER TESTING & ANALYSIS MARKET: OTHERS, 2019–2023
  • TABLE 162 BOTTLED WATER TESTING EQUIPMENT MARKET, BY REGION, 2018–2022 (USD MILLION)
  • TABLE 163 BOTTLED WATER TESTING EQUIPMENT MARKET, BY REGION, 2023–2028 (USD MILLION)
  • TABLE 164 BOTTLED WATER TESTING EQUIPMENT MARKET, BY TECHNOLOGY, 2018–2022 (USD MILLION)
  • TABLE 165 BOTTLED WATER TESTING EQUIPMENT MARKET, BY TECHNOLOGY, 2023–2028 (USD MILLION)
  • TABLE 166 BOTTLED WATER TESTING EQUIPMENT MARKET, BY RAPID TECHNOLOGY, 2018–2022 (USD MILLION)
  • TABLE 167 BOTTLED WATER TESTING EQUIPMENT MARKET, BY RAPID TECHNOLOGY, 2023–2028 (USD MILLION)
  • TABLE 168 BOTTLED WATER TESTING EQUIPMENT MARKET, BY COMPONENT, 2018–2022 (USD MILLION)
  • TABLE 169 BOTTLED WATER TESTING EQUIPMENT MARKET, BY COMPONENT, 2023–2028 (USD MILLION)
  • TABLE 170 BOTTLED WATER TESTING EQUIPMENT MARKET, BY TEST TYPE, 2018–2022 (USD MILLION)
  • TABLE 171 BOTTLED WATER TESTING EQUIPMENT MARKET, BY TEST TYPE, 2023–2028 (USD MILLION)
  • TABLE 172 BOTTLED WATER TESTING EQUIPMENT MARKET: PRODUCT/SERVICE LAUNCHES, 2019–2023
  • TABLE 173 BOTTLED WATER TESTING EQUIPMENT MARKET: DEALS, 2019–2023
  • TABLE 174 BOTTLED WATER TESTING EQUIPMENT MARKET: OTHERS, 2019–2023
  • TABLE 175 SGS SOCIÉTÉ GÉNÉRALE DE SURVEILLANCE SA.: COMPANY OVERVIEW
  • TABLE 176 SGS SOCIÉTÉ GÉNÉRALE DE SURVEILLANCE SA.: PRODUCTS/SOLUTIONS/SERVICES OFFERED
  • TABLE 177 SGS SOCIÉTÉ GÉNÉRALE DE SURVEILLANCE SA.: DEALS
  • TABLE 178 SGS SOCIÉTÉ GÉNÉRALE DE SURVEILLANCE SA.: OTHERS
  • TABLE 179 BUREAU VERITAS: COMPANY OVERVIEW
  • TABLE 180 BUREAU VERITAS: PRODUCTS/SOLUTIONS/SERVICES OFFERED
  • TABLE 181 BUREAU VERITAS: DEALS
  • TABLE 182 BUREAU VERITAS: OTHERS
  • TABLE 183 INTERTEK GROUP PLC: COMPANY OVERVIEW
  • TABLE 184 INTERTEK GROUP PLC.: PRODUCTS/SOLUTIONS/SERVICES OFFERED
  • TABLE 185 INTERTEK GROUP PLC: DEALS
  • TABLE 186 EUROFINS SCIENTIFIC: COMPANY OVERVIEW
  • TABLE 187 EUROFINS SCIENTIFIC: PRODUCTS/SOLUTIONS/SERVICES OFFERED
  • TABLE 188 EUROFINS SCIENTIFIC: PRODUCT/SERVICE LAUNCHES
  • TABLE 189 EUROFINS SCIENTIFIC: DEALS
  • TABLE 190 EUROFINS SCIENTIFIC: OTHERS
  • TABLE 191 ALS: COMPANY OVERVIEW
  • TABLE 192 ALS: PRODUCTS/SOLUTIONS/SERVICES OFFERED
  • TABLE 193 ALS: DEALS
  • TABLE 194 TÜV NORD GROUP: COMPANY OVERVIEW
  • TABLE 195 TÜV NORD GROUP: PRODUCTS/SOLUTIONS/SERVICES OFFERED
  • TABLE 196 TÜV NORD GROUP: PRODUCT/SERVICE LAUNCHES
  • TABLE 197 ASUREQUALITY: COMPANY OVERVIEW
  • TABLE 198 ASUREQUALITY: PRODUCTS/SOLUTIONS/SERVICES OFFERED
  • TABLE 199 MÉRIEUX NUTRISCIENCES CORPORATION: COMPANY OVERVIEW
  • TABLE 200 MÉRIEUX NUTRISCIENCES CORPORATION: PRODUCTS/SOLUTIONS/SERVICES OFFERED
  • TABLE 201 MÉRIEUX NUTRISCIENCES CORPORATION: DEALS
  • TABLE 202 MÉRIEUX NUTRISCIENCES CORPORATION: OTHERS
  • TABLE 203 MICROBAC LABORATORIES, INC.: COMPANY OVERVIEW
  • TABLE 204 MICROBAC LABORATORIES, INC.: PRODUCTS/SOLUTIONS/SERVICES OFFERED
  • TABLE 205 IFP INSTITUTE FOR PRODUCT QUALITY GMBH: COMPANY OVERVIEW
  • TABLE 206 IFP INSTITUTE FOR PRODUCT QUALITY GMBH: PRODUCTS/SOLUTIONS/SERVICES OFFERED
  • TABLE 207 EMSL ANALYTICAL, INC.: COMPANY OVERVIEW
  • TABLE 208 EMSL ANALYTICAL, INC.: PRODUCTS/SOLUTIONS/SERVICES OFFERED
  • TABLE 209 EMSL ANALYTICAL, INC.: DEALS
  • TABLE 210 EMSL ANALYTICAL, INC.: PRODUCT/SERVICE LAUNCHES
  • TABLE 211 EMSL ANALYTICAL, INC.: OTHERS
  • TABLE 212 SYMBIO LABORATORIES: COMPANY OVERVIEW
  • TABLE 213 SYMBIO LABORATORIES: PRODUCTS/SOLUTIONS/SERVICES OFFERED
  • TABLE 214 HILL LABORATORIES COMPANY: COMPANY OVERVIEW
  • TABLE 215 HILL LABORATORIES COMPANY: PRODUCTS/SOLUTIONS/SERVICES OFFERED
  • TABLE 216 HILL LABORATORIES: DEALS
  • TABLE 217 HILL LABORATORIES: OTHERS
  • TABLE 218 THERMO FISHER SCIENTIFIC INC.: BUSINESS OVERVIEW
  • TABLE 219 THERMO FISHER SCIENTIFIC INC.: PRODUCTS/SOLUTIONS/SERVICES OFFERED
  • TABLE 220 THERMO FISHER SCIENTIFIC INC.: DEALS
  • TABLE 221 THERMO FISHER SCIENTIFIC INC.: PRODUCT/SERVICE LAUNCHES
  • TABLE 222 THERMO FISHER SCIENTIFIC INC.: OTHERS
  • TABLE 223 BIO-RAD LABORATORIES, INC.: COMPANY OVERVIEW
  • TABLE 224 BIO-RAD LABORATORIES, INC.: PRODUCTS/SOLUTIONS/SERVICES OFFERED
  • TABLE 225 BIO-RAD LABORATORIES, INC.: PRODUCT/SERVICE LAUNCHES
  • TABLE 226 ROMER LABS DIVISION HOLDING: COMPANY OVERVIEW
  • TABLE 227 ROMER LABS DIVISION HOLDING: PRODUCTS/SOLUTIONS/SERVICES OFFERED
  • TABLE 228 ROMER LABS DIVISION HOLDING: DEALS
  • TABLE 229 ROMER LABS DIVISION HOLDING: PRODUCT/SERVICE LAUNCHES
  • TABLE 230 ROMER LABS DIVISION HOLDING: OTHERS
  • TABLE 231 FOODCHAIN ID: COMPANY OVERVIEW
  • TABLE 232 FOODCHAIN ID: PRODUCTS/SOLUTIONS/SERVICES OFFERED
  • TABLE 233 FOODCHAIN ID: DEALS
  • TABLE 234 FOODCHAIN ID: OTHERS
  • TABLE 235 NOVA BIOLOGICALS: COMPANY OVERVIEW
  • TABLE 236 NOVA BIOLOGICALS: PRODUCTS/SOLUTIONS/SERVICES OFFERED
  • TABLE 237 NOVA BIOLOGICALS: DEALS
  • TABLE 238 NOVA BIOLOGICALS: OTHERS
  • TABLE 239 CERTIFIED LABORATORIES: COMPANY OVERVIEW
  • TABLE 240 CERTIFIED LABORATORIES: PRODUCTS/SOLUTIONS/SERVICES OFFERED
  • TABLE 241 CERTIFIED LABORATORIES: DEALS
  • TABLE 242 CERTIFIED LABORATORIES: OTHERS
  • TABLE 243 IEH INC.: COMPANY OVERVIEW
  • TABLE 244 IEH INC.: PRODUCTS/SOLUTIONS/SERVICES OFFERED
  • TABLE 245 IEH INC.: DEALS
  • TABLE 246 IEH INC.: PRODUCT/SERVICE LAUNCHES
  • TABLE 247 PRIMUSLABS: COMPANY OVERVIEW
  • TABLE 248 PRIMUSLABS: PRODUCTS/SOLUTIONS/SERVICES OFFERED
  • TABLE 249 PRIMUSLABS: PRODUCT/SERVICE LAUNCHES
  • TABLE 250 PRIMUSLABS: OTHERS
LIST OF FIGURES
 
  • FIGURE 1 TOP 10 FOOD SAFETY TESTING AND TECHNOLOGIES TRENDS MARKET: RESEARCH DESIGN
  • FIGURE 2 MARKET SIZE ESTIMATION METHODOLOGY: BOTTOM-UP APPROACH
  • FIGURE 3 MARKET SIZE ESTIMATION METHODOLOGY: TOP-DOWN APPROACH
  • FIGURE 4 DATA TRIANGULATION
  • FIGURE 5 MAJOR INDICATORS OF RECESSION
  • FIGURE 6 GLOBAL INFLATION RATE, 2011–2021
  • FIGURE 7 GLOBAL GDP, 2011–2021 (USD TRILLION)
  • FIGURE 8 IMPACT OF RECESSION INDICATORS ON TOP 10 FOOD SAFETY TESTING AND TECHNOLOGY TRENDS MARKET
  • FIGURE 9 GLOBAL FOOD SAFETY TESTING MARKET: PREVIOUS FORECAST VS. RECESSION FORECAST
  • FIGURE 10 FOOD SAFETY TESTING MARKET, BY TARGET TESTED
  • FIGURE 11 FOOD SAFETY TESTING MARKET, BY REGION
  • FIGURE 12 FOOD AUTHENTICITY MARKET, BY TARGET TESTED
  • FIGURE 13 WATER TESTING & ANALYSIS MARKET, BY APPLICATION
  • FIGURE 14 FOOD SAFETY TESTING MARKET, BY REGION
  • FIGURE 15 INCREASING PREVALENCE OF FOODBORNE ILLNESSES WORLDWIDE TO DRIVE DEMAND
  • FIGURE 16 PCR-BASED TESTING AND MEAT, POULTRY & SEAFOOD SEGMENTS ACCOUNTED FOR LARGEST SHARES OF NORTH AMERICAN FOOD SAFETY TESTING MARKET IN 2022
  • FIGURE 17 CHROMATOGRAPHY SEGMENT TO HOLD MAJOR SHARE OF BOTTLED WATER TESTING EQUIPMENT MARKET IN 2023
  • FIGURE 18 RAW SEGMENT TO ACCOUNT FOR MAJOR SHARE OF MEAT SPECIATION MARKET IN 2023
  • FIGURE 19 MAJOR PATHOGENS RESPONSIBLE FOR FOODBORNE ILLNESSES IN US, 2018
  • FIGURE 20 NUMBER OF CASES OF FOODBORNE DISEASES, BY REGION, 2020
  • FIGURE 21 AGRI-FOOD EXPORT DATA, BY COUNTRY, 2020–2022 (USD MILLION)
  • FIGURE 22 IMPORT AND EXPORT SCENARIOS FOR PREPARED FOOD ITEMS, BY COUNTRY, 2022 (USD THOUSAND)
  • FIGURE 23 FOOD PATHOGEN TESTING MARKET: DRIVERS, RESTRAINTS, OPPORTUNITIES, AND CHALLENGES
  • FIGURE 24 NUMBER OF RECALLED PRODUCTS IN US, 2012–2022
  • FIGURE 25 FOOD RECALLS, BY SPECIES, 2022
  • FIGURE 26 FOOD SAFETY TESTING MARKET: SUPPLY CHAIN ANALYSIS
  • FIGURE 27 FOOD SAFETY MANAGEMENT SYSTEM (FSMS)
  • FIGURE 28 FOOD SAFETY TESTING MARKET: VALUE CHAIN ANALYSIS
  • FIGURE 29 PATENTS RELATED TO FOOD AND WATER SAFETY TESTING, 2012–2022
  • FIGURE 30 REGIONAL ANALYSIS OF PATENTS RELATED TO FOOD AND WATER SAFETY TESTING
  • FIGURE 31 IMPORT DATA FOR INSTRUMENTS AND APPARATUS USED IN PHYSICAL AND CHEMICAL ANALYSES, 2018–2022 (USD THOUSAND)
  • FIGURE 32 EXPORT DATA FOR INSTRUMENTS AND APPARATUS USED IN PHYSICAL AND CHEMICAL ANALYSES, 2018–2022 (USD THOUSAND)
  • FIGURE 33 INFLUENCE OF STAKEHOLDERS ON BUYING PROCESS FOR TECHNOLOGIES
  • FIGURE 34 KEY CRITERIA FOR SELECTING SUPPLIER/VENDOR FOR TECHNOLOGIES
  • FIGURE 35 FOOD SAFETY TESTING MARKET: TRENDS AND DISRUPTIONS IMPACTING CUSTOMER BUSINESS
  • FIGURE 36 FOOD SAFETY TESTING MARKET: MARKET MAP
  • FIGURE 37 EUROPE HELD LARGEST SHARE OF FOOD SAFETY TESTING MARKET IN 2022
  • FIGURE 38 FOOD SAFETY TESTING MARKET, BY TARGET TESTED, 2023 VS. 2028 (USD MILLION)
  • FIGURE 39 FOOD SAFETY TESTING MARKET, BY TECHNOLOGY, 2023 VS. 2028 (USD MILLION)
  • FIGURE 40 FOODS THAT CAUSED OUTBREAK-ASSOCIATED ILLNESSES IN US, 2009–2018
  • FIGURE 41 NUMBER OF OUTBREAKS AND HUMAN CASES IN EU, BY FOOD PRODUCT, 2019
  • FIGURE 42 FOOD RECALLS IN US, BY CONTAMINANT CATEGORY, 2021
  • FIGURE 43 FOOD SAFETY TESTING MARKET, BY FOOD TESTED, 2023 VS. 2028 (USD MILLION)
  • FIGURE 44 SEGMENTAL REVENUE ANALYSIS OF FIVE KEY MARKET PLAYERS, 2018–2022 (USD BILLION)
  • FIGURE 45 FOOD SAFETY TESTING MARKET: COMPANY EVALUATION MATRIX, 2022
  • FIGURE 46 FOOD SAFETY TESTING MARKET: STARTUPS/SMES COMPANY EVALUATION MATRIX, 2022
  • FIGURE 47 GLOBAL ADOPTION OF GM CROPS, 2019
  • FIGURE 48 EUROPE HELD LARGEST SHARE OF GMO FOOD SAFETY TESTING MARKET IN 2022
  • FIGURE 49 GMO FOOD SAFETY TESTING MARKET, BY TRAIT, 2023 VS. 2028 (USD MILLION)
  • FIGURE 50 GMO FOOD SAFETY TESTING MARKET, BY TECHNOLOGY, 2023 VS. 2028 (USD MILLION)
  • FIGURE 51 GMO FOOD TESTING MARKET, BY FOOD TESTED, 2023 VS. 2028 (USD MILLION)
  • FIGURE 52 GMO FOOD SAFETY TESTING MARKET SHARE AND RANKING ANALYSIS OF FIVE KEY PLAYERS, 2022
  • FIGURE 53 EUROPE HELD LARGEST SHARE OF FOOD AUTHENTICITY TESTING MARKET IN 2022
  • FIGURE 54 FOOD AUTHENTICITY MARKET, BY TARGET TESTED, 2023 VS. 2028 (USD MILLION)
  • FIGURE 55 FOOD AUTHENTICITY MARKET, BY FOOD TESTED, 2023 VS. 2028 (USD MILLION)
  • FIGURE 56 FOOD AUTHENTICITY MARKET, BY TECHNOLOGY, 2023 VS. 2028 (USD MILLION)
  • FIGURE 57 FOOD AUTHENTICITY TESTING MARKET SHARE AND RANKING ANALYSIS OF FIVE KEY PLAYERS, 2022
  • FIGURE 58 ASIA PACIFIC TO REGISTER HIGHEST CAGR IN FOOD PATHOGEN TESTING MARKET FROM 2023 TO 2028
  • FIGURE 59 FOOD PATHOGEN TESTING MARKET, BY TYPE, 2023 VS. 2028 (USD MILLION)
  • FIGURE 60 FOOD RECALLS IN US, BY CONTAMINANT CATEGORY, 2021
  • FIGURE 61 FOOD PATHOGEN TESTING MARKET, BY FOOD TESTED, 2023 VS. 2028 (USD MILLION)
  • FIGURE 62 FOOD PATHOGEN TESTING MARKET, BY TECHNOLOGY, 2023 VS. 2028 (USD MILLION)
  • FIGURE 63 SEGMENTAL REVENUE ANALYSIS OF FIVE KEY PLAYERS, 2018–2022 (USD BILLION)
  • FIGURE 64 ANNUAL REVENUE, 2022 (USD BILLION) VS. REVENUE GROWTH, 2020–2022 (%)
  • FIGURE 65 KEY PLAYERS IN EBITDA, 2022 (USD BILLION)
  • FIGURE 66 FOOD PATHOGEN TESTING MARKET: GLOBAL SNAPSHOT OF KEY PARTICIPANTS, 2022
  • FIGURE 67 FOOD PATHOGEN TESTING MARKET: COMPANY EVALUATION MATRIX, 2022
  • FIGURE 68 FOOD PATHOGEN TESTING MARKET: STARTUPS/SMES COMPANY EVALUATION MATRIX, 2022
  • FIGURE 69 EUROPE HELD LARGEST SHARE OF MYCOTOXIN TESTING MARKET IN 2022
  • FIGURE 70 MYCOTOXIN TESTING MARKET, BY TYPE, 2023 VS. 2028 (USD MILLION)
  • FIGURE 71 MYCOTOXIN TESTING MARKET, BY FOOD TESTED, 2023 VS. 2028 (USD MILLION)
  • FIGURE 72 MYCOTOXIN TESTING MARKET, BY TECHNOLOGY, 2023 VS. 2028 (USD MILLION)
  • FIGURE 73 MYCOTOXIN TESTING MARKET SHARE AND RANKING ANALYSIS OF FIVE KEY PLAYERS, 2022
  • FIGURE 74 EUROPE HELD LARGEST SHARE OF FOOD ALLERGEN TESTING MARKET IN 2022
  • FIGURE 75 FOOD ALLERGEN TESTING MARKET, BY SOURCE, 2023 VS. 2028 (USD MILLION)
  • FIGURE 76 FOOD ALLERGEN TESTING MARKET, BY TECHNOLOGY, 2023 VS. 2028 (USD MILLION)
  • FIGURE 77 FOOD ALLERGEN TESTING MARKET, BY FOOD TESTED, 2023 VS. 2028 (USD MILLION)
  • FIGURE 78 FOOD ALLERGEN TESTING MARKET SHARE AND RANKING ANALYSIS OF FIVE KEY PLAYERS, 2022
  • FIGURE 79 EUROPE ACCOUNTED FOR LARGEST SHARE OF MEAT SPECIATION TESTING MARKET IN 2022
  • FIGURE 80 MEAT SPECIATION TESTING MARKET, BY SPECIES, 2023 VS. 2028 (USD MILLION)
  • FIGURE 81 MEAT SPECIATION TESTING MARKET, BY TECHNOLOGY, 2023 VS. 2028 (USD MILLION)
  • FIGURE 82 MEAT SPECIATION TESTING MARKET, BY FORM, 2023 VS. 2028 (USD MILLION)
  • FIGURE 83 MEAT SPECIATION TESTING MARKET SHARE AND RANKING ANALYSIS OF FIVE KEY PLAYERS, 2022
  • FIGURE 84 EUROPE ACCOUNTED FOR LARGEST SHARE OF PESTICIDE RESIDUE TESTING MARKET IN 2022
  • FIGURE 85 PESTICIDE RESIDUE TESTING MARKET, BY TYPE, 2023 VS. 2028 (USD MILLION)
  • FIGURE 86 PESTICIDE RESIDUE TESTING MARKET, BY TECHNOLOGY, 2023 VS. 2028 (USD MILLION)
  • FIGURE 87 PESTICIDE RESIDUE TESTING MARKET, BY FOOD TESTED, 2023 VS. 2028 (USD MILLION)
  • FIGURE 88 PESTICIDE RESIDUE TESTING MARKET SHARE AND RANKING ANALYSIS OF FIVE KEY PLAYERS, 2022
  • FIGURE 89 ASIA PACIFIC TO REGISTER HIGHEST CAGR IN WATER TESTING & ANALYSIS MARKET DURING FORECAST PERIOD
  • FIGURE 90 WATER TESTING & ANALYSIS MARKET, BY PRODUCT, 2023 VS. 2028 (USD MILLION)
  • FIGURE 91 WATER TESTING & ANALYSIS MARKET, BY PRODUCT TYPE, 2023 VS. 2028 (USD MILLION)
  • FIGURE 92 WATER TESTING & ANALYSIS MARKET, BY APPLICATION, 2023 VS. 2028 (USD MILLION)
  • FIGURE 93 WATER TESTING & ANALYSIS MARKET SHARE AND RANKING ANALYSIS OF FIVE KEY PLAYERS, 2022
  • FIGURE 94 ASIA PACIFIC TO REGISTER FASTEST GROWTH IN BOTTLED WATER TESTING EQUIPMENT MARKET BETWEEN 2023 AND 2028
  • FIGURE 95 BOTTLED WATER TESTING EQUIPMENT MARKET, BY TECHNOLOGY, 2023 VS. 2028 (USD MILLION)
  • FIGURE 96 BOTTLED WATER TESTING EQUIPMENT MARKET, BY COMPONENT, 2023 VS. 2028 (USD MILLION)
  • FIGURE 97 BOTTLED WATER TESTING EQUIPMENT MARKET, BY TEST TYPE, 2023 VS. 2028 (USD MILLION)
  • FIGURE 98 BOTTLED WATER TESTING EQUIPMENT MARKET SHARE AND RANKING ANALYSIS OF KEY PLAYERS, 2022
  • FIGURE 99 SGS SOCIÉTÉ GÉNÉRALE DE SURVEILLANCE SA.: COMPANY SNAPSHOT
  • FIGURE 100 BUREAU VERITAS: COMPANY SNAPSHOT
  • FIGURE 101 INTERTEK GROUP PLC: COMPANY SNAPSHOT
  • FIGURE 102 EUROFINS SCIENTIFIC: COMPANY SNAPSHOT
  • FIGURE 103 ALS: COMPANY SNAPSHOT
  • FIGURE 104 TÜV NORD GROUP: COMPANY SNAPSHOT
  • FIGURE 105 ASUREQUALITY: COMPANY SNAPSHOT
  • FIGURE 106 THERMO FISHER SCIENTIFIC INC.: COMPANY SNAPSHOT
  • FIGURE 107 BIO-RAD LABORATORIES, INC.: COMPANY SNAPSHOT

The study involves identifying the top trends in the food safety testing market. Exhaustive secondary research was done to collect information on the market, peer market, and parent market. These findings, assumptions, and market sizes were validated by industry experts across the value chain through primary research. Both the top-down and bottom-up approaches were employed to estimate the complete market size. After that, the market breakdown and data triangulation approaches were used to estimate the market size of segments and subsegments.

Secondary Research

In the secondary research process, various secondary sources, such as Hoovers, Bloomberg BusinessWeek, and Dun & Bradstreet, were referred to identify and collect information for this study. These secondary sources included annual reports, press releases & investor presentations of companies, white papers, certified publications, articles by recognized authors, gold standard & silver standard websites, food safety organizations, regulatory bodies, trade directories, and databases.

Primary Research

The market comprises several stakeholders in the supply chain, which include suppliers, manufacturers, and end-use product manufacturers. Various primary sources from both the supply and demand sides of both markets have been interviewed to obtain qualitative and quantitative information. The primary interviewees from the demand side include key opinion leaders, executives, vice presidents, and CEOs of companies manufacturing biologicals. The primary sources from the supply side include research institutions involved in R&D, key opinion leaders, and manufacturing companies.
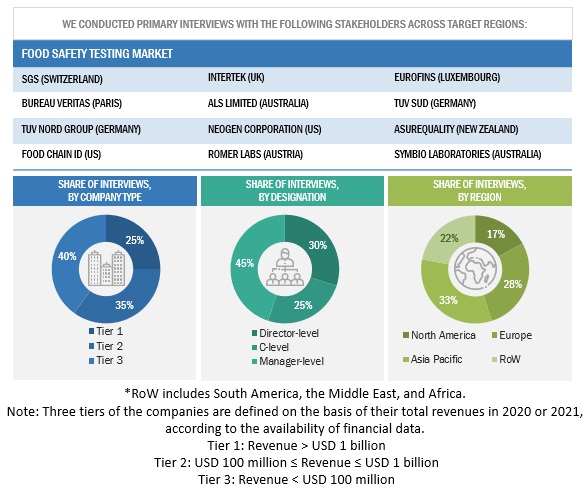
Top 10 Food Safety Testing and Technologies Trends Primary Participants

To know about the assumptions considered for the study, download the pdf brochure

Market Size Estimation

Both the top-down and bottom-up approaches were used to estimate and validate the total size of the market. These approaches were also used extensively to estimate the size of various dependent submarkets.

The research methodology used to estimate the market size includes the following:

  • The key players were identified through extensive secondary research.
  • The 'industry's supply chain and market size were determined through primary and secondary research.
  • All percentage shares, splits, and breakdowns were determined using secondary sources and verified through primary sources.
  • All the possible parameters that affect the markets covered in this research study were accounted for, viewed in extensive detail, verified through primary research, and analyzed to obtain the final quantitative and qualitative data.

Market size estimation: Bottom-up approach
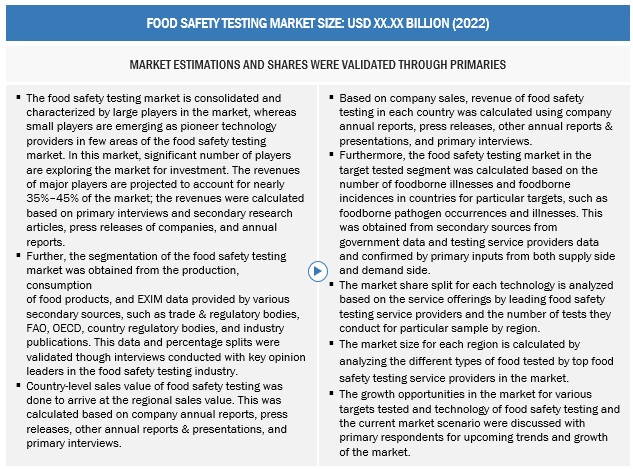
Top 10 Food Safety Testing and Technologies Trends Bottom-up approach

To know about the assumptions considered for the study, Request for Free Sample Report

Market size estimation methodology: top-down approach

In the top-down approach, the overall market size was used to estimate the size of individual markets (target tested, food tested, technology, and region) through percentage splits from secondary and primary research. To calculate each specific market segment, the most appropriate and immediate parent market size was used to implement the top-down approach. The data obtained was further validated by conducting primary interviews with industry experts, key suppliers, and manufacturers of food safety testing in the market.
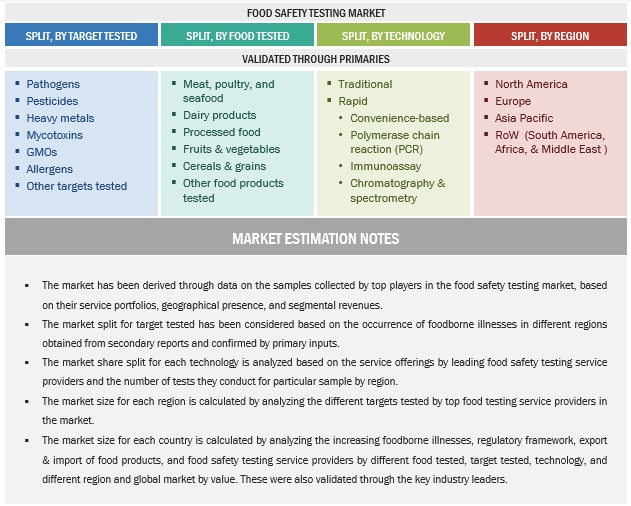
Top 10 Food Safety Testing and Technologies Trends Top Down Approach

Data Triangulation

In order to evaluate the overall food safety testing market and arrive at the exact statistics for all segments and subsegments, data triangulation and market breakdown procedures have been employed, wherever applicable. The data has been triangulated by studying various factors and trends from both the demand and supply sides.

Market Definition:

 Food safety testing is performed to supervise the quality and prevent unwanted incidents of foodborne illnesses, toxicity, or poisoning.

  • “Food safety audit” means a systematic and functionally independent examination of food safety measures adopted by manufacturing units to determine whether such measures and related results meet the objectives of food safety.
  • “Food Safety Management System (FSMS)” means adopting good manufacturing practices, good hygienic practices, hazard analysis, critical control points, and other practices as may be specified by the regulations for the food business.

According to Governing Food Security in Indonesia, the Food Law No 18/2012: “Food safety is a condition and effort that is required to prevent food from the possibility of biological, chemical, and other pollution that can interfere, harm, and endanger the human health as well as not conflicting with religion, belief, and culture of the society so that it is safe for consumption.”

Key Stakeholders:

  • Manufacturers, importers & exporters, traders, distributors, and suppliers of food safety testing kits, equipment, reagents and chemicals
  • Food safety testing laboratories
  • Food raw material suppliers
  • Food ingredient, intermediate, and end-product manufacturers, and processors
  • Government, research organizations, and institutions
  • World Health Organization (WHO)
  • Codex Alimentarius Commission (CAC)
  • Food traders, trade associations, and industry bodies
  • Regulatory bodies
  • Food and Agriculture Organization (FAO)
  • Food Safety Council (FSC)
  • The European Federation of National Associations of Measurement, Testing, and Analytical Laboratories (EUROLAB)
  • European Food Safety Authority (EFSA)
  • Food Standards Australia New Zealand (FSANZ)
  • Canadian Food Inspection Agency (CFIA)
  • Mexico’s National Service of Health, Food Safety, and Agro-Alimentary Quality (SENASICA)
  • Food Safety Commission (FSC)
  • Ministry of Health, Labor, and Welfare (Japan)
  • Food Safety and Standards Authority of India (FSSAI)
  • Commercial research & development (R&D) institutions and financial institutions
  • Regulatory bodies, including government agencies and NGOs   

Report Objectives

  • To describe, segment, and project the global market size for the food safety testing market
  • To offer detailed information about the key factors influencing the growth of the market (drivers, restraints, opportunities, and industry-specific challenges)
  • To evaluate the micro-markets, concerning individual growth trends, prospects, and their contribution to the total food safety testing market
  • To propose the size of the submarkets, in terms of value, for various regions
  • To profile the major players and comprehensively analyze their core competencies
  • To understand the competitive landscape and identify the major growth strategies adopted by the players across key regions
  • To analyze competitive developments such as expansions & investments, mergers & acquisitions, new product launches, partnerships, joint ventures, and agreements.

Available Customizations

With the given market data, MarketsandMarkets offers customizations according to company-specific scientific needs.

The following customization options are available for the report:

Product Analysis

  • Product matrix, which gives a detailed comparison of the product portfolio of each company

Company Information

  • Detailed analysis and profiling of additional market players (up to five)
Custom Market Research Services

We will customize the research for you, in case the report listed above does not meet with your exact requirements. Our custom research will comprehensively cover the business information you require to help you arrive at strategic and profitable business decisions.

Request Customization
Report Code
FB 5026
Published ON
Oct, 2023
Choose License Type
BUY NOW
  • SHARE
X
Request Customization
Speak to Analyst
Speak to Analyst
OR FACE-TO-FACE MEETING
PERSONALIZE THIS RESEARCH
  • Triangulate with your Own Data
  • Get Data as per your Format and Definition
  • Gain a Deeper Dive on a Specific Application, Geography, Customer or Competitor
  • Any level of Personalization
REQUEST A FREE CUSTOMIZATION
LET US HELP YOU!
  • What are the Known and Unknown Adjacencies Impacting the Top 10 Food Safety Testing and Technologies Trends Market
  • What will your New Revenue Sources be?
  • Who will be your Top Customer; what will make them switch?
  • Defend your Market Share or Win Competitors
  • Get a Scorecard for Target Partners
CUSTOMIZED WORKSHOP REQUEST
knowledgestore logo

Want to explore hidden markets that can drive new revenue in Top 10 Food Safety Testing and Technologies Trends Market?

Find Hidden Markets
  • Call Us
  • +1-888-600-6441 (Corporate office hours)
  • +1-888-600-6441 (US/Can toll free)
  • +44-800-368-9399 (UK office hours)
CONNECT WITH US
ABOUT TRUST ONLINE
©2024 MarketsandMarkets Research Private Ltd. All rights reserved
DMCA.com Protection Status
Website Feedback