Tire Recycling Market

Report Code CH 9190
Published in Oct, 2024, By MarketsandMarkets™
Download PDF

Choose License Type

Buy Report Now Inquire Before Buying

Tire Recycling Market by Product (Rubber, TDF, TDA, Carbon Black), Process (Mechanical Shredding, Ambient Grinding, Pyrolysis), Type (Service, Material), End-use Industry (Automotive, Construction, Manufacturing) and Region - Global Forecast to 2029

Updated on : October 25, 2024

Tire Recycling Market

The global tire recycling market is valued at USD 7.44 billion in 2024 and is projected to reach USD 8.92 billion by 2029, growing at 3.7% cagr from 2024 to 2029. The major factors driving the market growth are rising number of automobiles , stringent government regulations and growing focus on sustainability.

Along with the growing volume of end-of life tires. The increasing production of passenger vehicles, three-wheelers, two-wheelers, and quadricycles in Asia, with 2,328,329 units produced in January 2024, contributes to the growing problem of tire waste. Tires are not biodegradable, and they pose actual environmental risks, so proper management through frameworks like EPR (Extended Producer Responsibility) may be necessary. Through EPR, producers are given responsibility for the entire lifecycle of their products, including the end-of-life tires when it expires. That is what sparks the demand for the recycling of tires. Aggressive carbon neutrality goals through global agreements, is also increasing the urgency of the need for tire recycling.

Attractive Opportunities in the Tire Recycling Market

Asia Pacific

Market growth in Asia-Pacific is driven by rising vehicle production across the region, particularly in emerging economies like China and India, growing environmental concerns, and regulatory frameworks promoting sustainable waste management.

Asia Pacific is expected to lead the tire recycling market due to rise in end-of-life tires generated, demand for green construction materials and stringent laws related to tire recycling.

The drive for reduced energy consumption, the growing volume of end-of-life tires, and an increased focus on sustainability are key factors propelling the tire recycling market.

Global tire recycling market is expected to be worth USD 8.92 billion by 2029, growing at CAGR of 3.7% during the forecast period.

The increasing demand for sustainable products, along with government support and incentives to encourage tire recycling, is expected to generate lucrative opportunities for market players.

Global Tire Recycling Market Dynamics

Driver: Growing volume of end of life tires, focus on sustainability along with stringent government regulations

According to the World Business Council for Sustainable Development, one passenger tire is annually discarded in the developed world per person. These produce 1 billion end-of-life tyres every year. This is about 4 billion ELTs already stockpiled and thrown into the landfills across the globe, and the estimate is to rise to 5 billion by 2030. The increasing number of end-of-life tires, coupled with the need for lower energy consumption, is driving the tire recycling market. As the global stockpile of ELTs continues to grow, there is an urgent need to manage this waste sustainably. For tire waste, EPR compliance necessitates that manufacturers or importers manage the collection, recycling, and proper disposal of end-of-life tires. In India, The Central Pollution Control Board (CPCB) enforces rules related to tire recycling. In Europe, the Landfill Directive (1999/31/EC) has banned the landfilling of end-of-life tires . This directive has led to the establishment of various management systems across the EU for tire collection, recycling, and recovery under producer responsibility schemes. There are also regulations and goals set to achieve such a target at the global level, keeping in view the achievement of net-zero emissions by each participating country under the Paris Agreement, adopted in 2015, to limit global temperature rise. Places like the European Union that target full climate neutrality by 2050; India that will target net zero by 2070; and the United States, which plan that all federal government operations be brought to net zero by 2050, are nudging the industry-which includes tire manufacturers-to be sustainable in how it deals with its waste. A rising End of life tires, combined with growing international focus and efforts toward sustainability, especially carbon-neutral goals, is highly driving the business of tire recycling. This is supplemented by legislations like EPR and end-of-tire-landfilling bans that have put the onus on manufacturers and importers for proper disposal of used tires, as exemplified by the EU's Landfill Directive. Agreements like the Paris Agreement set carbon-neutral targets, which pressure industries to adopt a sustainable approach by recycling tires to reduce impacts on the environment and attain optimal emission levels. This regulatory framework, as well as the sustainability initiative, has created a massive need for a globally effective solution in tire recycling.

Restraint: Difficulty in maintaining quality and consistency of recycled materials along with contaminated used tires can reduce the quality of recycled materials

One of the major restraint in the market of recycling tires is product-to-product quality and consistency of material properties when handling degraded used tires that contain various contaminants. Through the lifecycle of tires, are exposed to various environmental condition and substance. As they go through their lifecycle, they capture a whole lot of contaminants, such as dirt, stones, oils, greases, and other automotive fluids that usually degrade the quality of the rubber recovered. These contaminants, therefore lead to a list of problems, starting with the degradation of the chemical composition of the rubber, making it lose its elasticity and durability. Taking an example, the oils and chemicals absorbed by the tires while in use certainly change the properties of the rubber to be less favorable for high-end applications with specific performance standards. This results in a poorer quality product that may only be suitable for low-value applications like basic insulation or fill material but is not high enough margin to be appropriate for higher-margin applications like precision rubber components. The removal process of these contaminants also is difficult and expensive. High-end cleaning and sorting technology must be used to ensure the recycled rubber is good enough to be reused again. Furthermore, the high variability in quality in recycled materials may pose a significant threat when it comes to the inability to meet expectations of customers and industry standards. Products manufactured using recycled rubber would likely show low-quality variability and may fail to meet performance requirements, and eventually, these could be recalled or damage a manufacturer's reputation. Demand for recycled tire products may also decrease since consumers and industries prefer to use virgin materials because their quality is often predictable.


Opportunity: Rising demand for sustainable products along with Government Support and Incentives along with rise in green construction materials

Govt support and incentives are significantly boosting opportunities in this sector. There is financial support and regulatory benefits created by policies around sustainability and carbon reduction for companies to be more eco-friendly. For instance, in India, Delhi and Gurgaon also recycle tires by making public awareness programs, and Extended Producer Responsibility or EPR program. These programs make it mandatory for the producers of tires that have to collect and recycle the tires at their end-of-life from the market. In addition, government incentives and grants are available for the tire recycling plants and recycled tire products are also encouraged in the market. Market opportunity in the form of growing demand for green building materials is also presented by tire recycling. The ELTs' crumb rubber is increasingly in demand with the construction industry's shift towards sustainability: it is used in various green construction applications, from road construction to make rubberized asphalt to roofing and insulation, and also soundproofing. It would also reduce the environmental impacts of construction projects whilst promoting the circular economy through the utilization of the same products as wastes. Many countries' laws and legislations also followed this trend: encouraging the use of sustainable materials. Among such catalysts is the U.S. Green Building Council (USGBC), whose LEED certification program provides for the use of green materials, which include recycled tire materials, in projects. On this aspect, the Circular Economy Action Plan by the European Union encourages the use of recycled materials in construction. Key drivers for the tire recycling market are government aid and incentives along with sustainability-focused policies. EPR is one of the programs that make the tire producer independently manage the collection and recycling of end-of-life tires, along with financial subsidy support to deal with the waste. In addition, public awareness initiatives that the government actively supports also improve tire recycling in a country such as India. Concurrently, growing crumb rubber demand for use in asphalt, roofing, and insulation green building materials represents one of the major market opportunities. Other policy instruments include LEED certification by the U.S. Green Building Council and the Circular Economy Action Plan of the European Union, encourages to use recycled material; therefore, it keeps continuing the growth of tire recycling.

Challenge: High Initial Investment Costs

One of the major barriers to growth in the tire recycling industry is high capital requirements for start-up. A large capital input is required for equipment at a tire recycling facility containing such advanced machinery and technology, which involves shredders and granulators and pyrolysis systems necessary to process ELTs into useful materials, including crumb rubber, TDF, or other recycled products. However, the cost of purchasing and maintaining this kind of equipment is rather expensive and hence is a barrier to new entrants into the market. In addition to machinery, proper systems for waste management, appropriate facilities, and strict regulations relating to environmental and safety standards also form part of the infrastructure for tire recycling. These add to the complete cost as well, pushing up the costs to companies wanting to enter or expand in the market for tire recycling. Due to changing market prices for post-recycled materials, ensuring quality, and demand, the return on investment might take time in recycling tires. Such uncertainty may discourage investors and companies from making large investments in large-scale tire recycling endeavors, especially in areas where there is limited government support and subsidies.

Global Tire Recycling Market Ecosystem Analysis

A market ecosystem refers to the interconnected network of businesses, consumers, suppliers, and regulators in a particular market, influencing and interacting with each other. The key participants in the tire recycling ecosystem include Liberty Tire Recycling (US), GENAN HOLDING A/S (Denmark), ResourceCo (Australia), GRP LTD (India), Lehigh Technologies, Inc. (US), Entech Inc.(US), Emanuel Tire, LLC (US), BDS Tire Recycling (US), Contec (Poland), CRM (US).

Source: Secondary Research, Interviews with Experts, and MarketsandMarkets Analysis


By product, rubber segment is forecasted to be the fastest growing in tire recycling market during forecast period, in terms of value

The fastest growing in the market is the tire recycling sector is rubber because of the broad end-use application across industry lines. Applications of recycled rubber, that is, crumb rubber, are widespread in construction, automotive, and in sport's sectors, hence driving the demand upward. Its use in road construction, rubberized asphalt, and children's playground surfaces render it a good material for sustainability projects in infrastructure upgrade.

Furthermore, environmental consciousness has spurred the recycling of rubber into a faster pace of large-scale manufacturing of eco-friendly consumer commodities like flooring, mats, and athletic tracks. The increase in the consumption of recycled rubber is also due to the interest of the industries to decrease their carbon footprint to cope with rigid governmental terms set forth in terms of environmental standards. Some of the governmental policies encouraging sustainable sources for construction and other sectors propel such increased growth. Based on the tremendous demand for recycled rubber, the commodity takes a vital position in the tire recycling market.

By type, service segment will be the fastest growing in tire recycling market during forecast period, in terms of value

The service type is expected to be the fastest growing in the tire recycling market. Moreover, there is more concern about how the tires are disposed of as well as proper regulations regarding recycling in the service segment. Governments from every country make strong environmental policies, such as EPR programs. Tire manufacturers and importers are considered within the whole cycle of their products from collection to the recycling of end-of-life tires. This has sparked calls for specialized services which collect, dispose of safely, and recycle tires. In addition, rising sensitivities to sustainability and waste management enhance outsourcing of tire recycling operations by industries and local governments from themselves to invest in their facilities. The service companies are hence very instrumental in ensuring compliance with environmental laws besides providing a streamlined process for an efficient manner of managing end of life tires. With a growth in electric vehicles and increased vehicle production, the quantity of waste tires would increase further, raising the demand for tire recycling services. This would again expose this service segment as the primary growth area of the tire recycling market.

By process, mechanical shredding segment to be fastest growing of tire recycling market during forecast period, in terms of value

In the tire recycling market, the mechanical shredding segment is to be the fastest growing process as it is cost-effective and efficient and thus highly adopted. Mechanical shredding is a well-established method that breaks down end-of-life tires into smaller pieces, including crumb rubber, and these are further utilized in lots of purposes like playground surfaces, rubberized asphalt, and sports fields.

This process is favored as it is relatively low in terms of investment considering more complex recycling methods. Mechanical shredding also produces quality recycled materials with consistent properties, making the process reliable for various industries. With a rising need for rubber-based products in construction, and even in the automotive sectors, what is being called for is an increased demand in mechanical shredding as a primary recycling process.

In addition, more stringent environmental regulations and global sustainability initiatives have significantly increased pressure on the entire world to successfully manage waste tires, making mechanical shredding a practically and scalable solution. It therefore enables fast high-volume shredding of tires at much lower costs, thus the fastest-growing segment within the tire recycling market.

By end-use industry, manufacturing industry to be second largest industry for the tire recycling market during forecast period, in terms of value

The manufacturing end-use industry is the second largest end-use industry in the tire recycling market, mainly due to the strong demand for recycled materials in diverse applications. Rubber from ELTs is indeed gaining increased usage in manufacturing several products such as rubber mats, flooring, insulation materials, and molded goods. Due to this very reason, the industry is becoming aggressive about sustainability and dependence on virgin materials. Manufacturers are utilizing the recycled tire products not only as an economical measure to reduce the cost of production but also to meet stringent environmental regulations and the consumers' demands for much greener products. Crumb rubber and other recycled tire components can be used in practically any manufactured item, from automotive parts to household goods.

Asia Pacific to be largest and fastest growing market for tire recycling during forecast period

Asia-Pacific is expected to be the largest region for the tire recycling market because of the factors such as countries in this region are inclined to fast industrialization, increasing their vehicle production, and also have tough in environmental regulations. Countries in this region, such as China, India, Japan, and South Korea have turned into the car-making hub gradually in recent years, thus contributing to the increase in end-of-life tires. This includes growth in urbanization and industrial development, an increase in the number of vehicles on the roads, and correspondingly, the numbers of tires that have to be disposed of or recycled. Sustainability and environmental protection are highly emphasized in this region, and that leads to the growth of the market. The governments of the Asia-Pacific have established initiatives that focus on waste management and recycling. Asia-Pacific's vast industrial industry also places high demands on recycled materials. Products in demand are rubber, steel, and TDF-which are recycled from end of life tires. These are highly applied in the construction industries, energy sectors, and manufacturing industries. The Asia-Pacific region is likely to continue its dominance in the near future by combining economic growth, rising environmental regulations, and industrial demand for recycled materials.

HIGHEST CAGR MARKET IN 2023
CHINA FASTEST GROWING MARKET IN THE REGION

Recent Developments of Tire Recycling Market

  • Liberty Tire Recycling, announced in January 2024 it has acquired two top scrap tire collectors and haulers in Central Florida: "Empire Tire of Edgewater" in Orlando, and "McGee Tire" in Apopka.
  • In July 2024, Michelin is inaugurating a plant at its Olsztyn tire plant in Poland to produce micronized rubber powder from old tires. The US-based subsidiary of Michelin, based in Atlanta, will operate the plant as well, building the company's first beyond North America.
  • In May 2023, IMC Outdoor Living, the division of Liberty Tire Recycling, has started a new manufacturing facility in Hebron, Ohio, about 30 miles east of Columbus. The 60,000 square feet of production will be augmented by an additional 70,000 square feet of warehousing space. Premium rubber mulch will be produced and stored here derived from 100% recycled tires. Durable and eco-friendly, this alternative to wood mulch makes for a great choice for playgrounds and landscapes. The new facility further enhances IMC Outdoor Living's strength in the Midwest while providing effective, sustainable landscaping solutions to regional parks, schools, municipalities, and government agencies.
  • In February 2023, Tyrecycle, part of the ResourceCo group joined forces with REVOLVE RECYCLING MANAGEMENT LLC to recycle bicycle tires that wouldn't end up in the landfill. REVOLVE RECYCLING will collect tires from bike shops and riders and transport them to Tyrecycle's new Erskine Park facility to be recycled into Aussie-made products. With its new significant presence, Tyrecycle is going to take on the huge amount of tires that are either getting dumped or stockpiled while polluting the environment. The inspirational partnership network with a commitment to sustainable solutions supports the target of the government toward achieving a circular economy and an 80 percent resource recovery rate by 2030.

Key Market Players

KEY PLAYERS IN THE TIRE RECYCLING MARKET INCLUDE

Want to explore hidden markets that can drive new revenue in Tire Recycling Market?

Scope of the Report

Report Metric Details
Years Considered for Study 2020-2029
Base Year 2023
Forecast period 2024-2029
Currency & Units Considered Value (USD Billion/Million) and Volume (Kiloton)
Segments Product, Process, Type, End-use Industry and Region
Region Asia Pacific, North America, Europe, Middle East & Africa, and South America


Key Questions Addressed by the Report

What is the expected growth rate of the tire recycling market from 2024 to 2029?
The sustainable tire material market is expected to grow at a CAGR of 3.7% in terms of value from 2024 to 2029.
Who are the key players in the tire recycling market?
The key players in this market include Liberty Tire Recycling (US), GENAN HOLDING A/S (Denmark), ResourceCo (Australia), GRP LTD (India), Lehigh Technologies, Inc. (US), Entech Inc.(US), Emanuel Tire, LLC (US), BDS Tire Recycling (US), Contec (Poland), CRM (US).
What are the emerging trends in the tire recycling market?
Emerging trends in the tire recycling market include advances in recycling technologies such as pyrolysis and devulcanization, which help in attaining higher efficiency, producing more valuable by-products, and improving yield. In addition, consumption of such tire-derived products like crumb rubber for constructions, sports surfaces, and infrastructure is increasing due to sustainability projects. Policy directions and incentives toward eco-friendliness and investment in recycling facilities favor growth in the global market.
What are the drivers and opportunities for the tire recycling market?
Growing volume of end of life tires, focus on sustainability along with stringent government regulations are the major drivers for the growth of this market. The opportunity being rising demand for sustainable products along with government support and incentives along with rise in green construction materials.
What are the restraining factors in the tire recycling market?
Difficulty in maintaining quality and consistency of recycled materials along with contaminated used tires can reduce the quality of recycled materials


Personalize This Research

  • Triangulate with your Own Data
  • Get Data as per your Format and Definition
  • Gain a Deeper Dive on a Specific Application, Geography, Customer or Competitor
  • Any level of Personalization
Request A Free Customisation

Let Us Help You

  • What are the Known and Unknown Adjacencies Impacting the Tire Recycling Market
  • What will your New Revenue Sources be?
  • Who will be your Top Customer; what will make them switch?
  • Defend your Market Share or Win Competitors
  • Get a Scorecard for Target Partners
Customized Workshop Request

Table of Contents

Exclusive indicates content/data unique to MarketsandMarkets and not available with any competitors.

TITLE
PAGE NO
INTRODUCTION
25
RESEARCH METHODOLOGY
30
EXECUTIVE SUMMARY
40
PREMIUM INSIGHTS
45
MARKET OVERVIEW
49
  • 5.1 INTRODUCTION
  • 5.2 MARKET DYNAMICS
    DRIVERS
    - Expanding automotive industry
    - Stringent environmental regulations and increased focus on sustainability
    - Growing volume of end-of-life tires
    RESTRAINTS
    - Difficulty in maintaining quality and consistency of recycled materials
    OPPORTUNITIES
    - Government-led incentives supporting adoption of sustainable products
    - Rising demand for green construction materials
    CHALLENGES
    - High investments in establishing tire recycling facility
  • 5.3 IMPACT OF AI/GENERATIVE AI
    INTRODUCTION
    IMPACT OF GENERATIVE AI ON TIRE RECYCLING MARKET
INDUSTRY TRENDS
57
  • 6.1 INTRODUCTION
  • 6.2 TRENDS/DISRUPTIONS IMPACTING CUSTOMER BUSINESS
  • 6.3 SUPPLY CHAIN ANALYSIS
  • 6.4 INVESTMENT LANDSCAPE AND FUNDING SCENARIO
  • 6.5 PRICING ANALYSIS
    AVERAGE SELLING PRICE TREND, BY REGION
    AVERAGE SELLING PRICE TREND, BY PRODUCT
    AVERAGE SELLING PRICE TREND OF KEY PLAYERS, BY PRODUCT
  • 6.6 ECOSYSTEM ANALYSIS
  • 6.7 TECHNOLOGY ANALYSIS
    KEY TECHNOLOGIES
    COMPLEMENTARY TECHNOLOGIES
    ADJACENT TECHNOLOGIES
  • 6.8 PATENT ANALYSIS
    METHODOLOGY
    PATENTS GRANTED WORLDWIDE
    PATENT PUBLICATION TRENDS
    INSIGHTS
    LEGAL STATUS OF PATENTS
    JURISDICTION ANALYSIS
    TOP COMPANIES/APPLICANTS
    LIST OF MAJOR PATENTS
  • 6.9 TRADE ANALYSIS
    IMPORT SCENARIO (HS CODE 400400)
    EXPORT SCENARIO (HS CODE 400400)
  • 6.10 KEY CONFERENCES AND EVENTS
  • 6.11 TARIFF AND REGULATORY LANDSCAPE
    TARIFF ANALYSIS
    REGULATORY BODIES, GOVERNMENT AGENCIES, AND OTHER ORGANIZATIONS
    REGULATIONS
  • 6.12 PORTER’S FIVE FORCES ANALYSIS
    BARGAINING POWER OF SUPPLIERS
    THREAT OF NEW ENTRANTS
    THREAT OF SUBSTITUTES
    BARGAINING POWER OF BUYERS
    INTENSITY OF COMPETITIVE RIVALRY
  • 6.13 KEY STAKEHOLDERS AND BUYING CRITERIA
    KEY STAKEHOLDERS IN BUYING PROCESS
    BUYING CRITERIA
  • 6.14 MACROECONOMIC OUTLOOK
    GDP TRENDS AND FORECASTS OF MAJOR ECONOMIES
  • 6.15 CASE STUDY ANALYSIS
    SHOWCASING SUSTAINABLE CARBON BLACK MANUFACTURING PROCESSES FOR TIRE & RUBBER INDUSTRY
    COMMERCIALIZING CONTINUOUS TYRE PYROLYSIS TECHNOLOGY IN EUROPEAN UNION
    PROOF THAT INTEGRATED TIRE RECYCLING DELIVERS HIGHEST RETURNS BOTH ENVIRONMENTALLY AND FINANCIALLY
TIRE RECYCLING MARKET, BY TYPE
86
  • 7.1 INTRODUCTION
  • 7.2 SERVICE
    INCREASING ENVIRONMENTAL REGULATIONS AND LANDFILL RESTRICTIONS TO DRIVE DEMAND FOR EFFICIENT TIRE DISPOSAL AND WASTE MANAGEMENT SERVICES
  • 7.3 MATERIAL
    GROWING DEMAND FOR ECO-FRIENDLY, COST-EFFECTIVE RAW MATERIALS IN CONSTRUCTION AND AUTOMOTIVE INDUSTRIES TO FUEL MARKET GROWTH
TIRE RECYCLING MARKET, BY PROCESS
90
  • 8.1 INTRODUCTION
  • 8.2 MECHANICAL SHREDDING
    GROWING USE TO REDUCE TIRE SIZE INTO MANAGEABLE PIECES FOR FURTHER PROCESSING TO DRIVE MARKET
  • 8.3 AMBIENT GRINDING
    RISING ADOPTION TO PRODUCE VERSATILE CRUMB RUBBER FOR VARIOUS APPLICATIONS WITHOUT NEED FOR EXPENSIVE COOLING SYSTEMS TO PROPEL MARKET
  • 8.4 PYROLYSIS
    INCREASING ADOPTION TO CONVERT WASTE TIRES INTO VALUABLE ENERGY AND MATERIALS THROUGH THERMAL DECOMPOSITION IN OXYGEN-FREE ENVIRONMENT TO FUEL MARKET GROWTH
  • 8.5 DEVULCANIZATION
    CAPABILITY TO ENABLE REUSE OF RUBBER IN HIGH-QUALITY APPLICATIONS BY REVERSING VULCANIZATION PROCESS TO DRIVE DEMAND
  • 8.6 OTHER PROCESSES
    CRYOGENIC GRINDING
    MICROWAVE TREATMENT
    GASIFICATION
    THERMAL DEPOLYMERIZATION
TIRE RECYCLING MARKET, BY PRODUCT
96
  • 9.1 INTRODUCTION
  • 9.2 RUBBER
    HIGH DURABILITY AND SHOCK-ABSORPTION CAPABILITIES TO DRIVE DEMAND
  • 9.3 TIRE-DERIVED FUEL (TDF)
    RISING USE AS ALTERNATIVE ENERGY SOURCE OFFERING HIGH ENERGY OUTPUT AND REDUCED WASTE TO FUEL MARKET GROWTH
  • 9.4 TIRE-DERIVED AGGREGATE (TDA)
    INCREASING ADOPTION IN CONSTRUCTION AND LANDSCAPING APPLICATIONS TO PROPEL MARKET
  • 9.5 CARBON BLACK
    RISING USE AS HIGH-PERFORMANCE PIGMENT IN INKS, PAINTS, AND COATINGS AND MANUFACTURING OF NEW TIRES, INDUSTRIAL RUBBER GOODS, AND CONVEYOR BELTS TO DRIVE MARKET
  • 9.6 STEEL WIRES
    INCREASING APPLICATIONS IN METAL RECYCLING INDUSTRY TO DRIVE MARKET
  • 9.7 OTHER PRODUCTS
    RUBBERIZED ASPHALT
    RUBBERIZED CONCRETE
    TIRE-DERIVED OIL (TDO)
TIRE RECYCLING MARKET, BY END-USE INDUSTRY
103
  • 10.1 INTRODUCTION
  • 10.2 AUTOMOTIVE
    RISING USE OF RECYCLED TIRE MATERIALS IN NEW TIRES AND VEHICLE PARTS TO DRIVE MARKET
  • 10.3 CONSTRUCTION
    INCREASING ADOPTION OF RECYCLED TIRE MATERIALS IN RUBBERIZED ASPHALT AND INSULATION APPLICATIONS TO PROPEL MARKET
  • 10.4 MANUFACTURING
    RISING USE OF RECYCLED TIRE MATERIALS TO ACHIEVE COST REDUCTION AND SUSTAINABILITY GOALS TO BOOST MARKET GROWTH
  • 10.5 RUBBER & PLASTICS
    GROWING USE OF RECYCLED TIRE MATERIALS IN MATS AND COMPOSITES TO DRIVE MARKET
  • 10.6 OTHER END-USE INDUSTRIES
    SPORTS & RECREATION
    AGRICULTURE & LANDSCAPING
    MARINE
    CONSUMER PRODUCTS
TIRE RECYCLING MARKET, BY REGION
109
  • 11.1 INTRODUCTION
  • 11.2 ASIA PACIFIC
    CHINA
    - Government-led policies promoting circular economy and stringent environmental regulations to drive market
    JAPAN
    - Technological innovations in recycling processes to propel market
    INDIA
    - Growing industrial demand for reclaimed rubber and cost-effective recycling solutions to boost market growth
    SOUTH KOREA
    - High public awareness regarding environmental sustainability and increasing investments in eco-friendly technologies to drive market
    REST OF ASIA PACIFIC
  • 11.3 NORTH AMERICA
    US
    - Rising green building initiatives and growing demand for sustainable materials to drive market
    CANADA
    - Government-led focus on sustainability to fuel market growth
    MEXICO
    - Expanding automotive sector and rising demand for sustainable waste management solutions to propel market
  • 11.4 EUROPE
    GERMANY
    - Ambitious environmental goals and booming automotive industry to drive market
    ITALY
    - Presence of stringent regulatory policies and adoption of sustainable waste management practices to fuel market growth
    FRANCE
    - Rising investments in recycling technologies to propel market
    UK
    - Government emphasis on sustainability and carbon reduction to drive market
    SPAIN
    - Expanding automotive sector and rising innovations in recycled material applications to boost market growth
    RUSSIA
    - Technological advancements in recycling technologies to fuel market growth
    REST OF EUROPE
  • 11.5 MIDDLE EAST & AFRICA
    GCC COUNTRIES
    - Saudi Arabia
    - UAE
    - Rest of GCC countries
    SOUTH AFRICA
    - Growing need to manage end-of-life disposal and recycling of tires under Extended Producer Responsibility (EPR) schemes to propel market
    REST OF MIDDLE EAST & AFRICA
  • 11.6 SOUTH AMERICA
    BRAZIL
    - Increased government-led environmental regulations and mandates regarding tire disposal and recycling to drive market
    ARGENTINA
    - Rising focus on sustainability and environmental protection supported by National Waste Management Law to fuel market growth
    REST OF SOUTH AMERICA
COMPETITIVE LANDSCAPE
186
  • 12.1 INTRODUCTION
  • 12.2 KEY PLAYER STRATEGIES/RIGHT TO WIN
  • 12.3 MARKET SHARE ANALYSIS
  • 12.4 REVENUE ANALYSIS
  • 12.5 BRAND/PRODUCT COMPARISON
  • 12.6 COMPANY EVALUATION MATRIX: KEY PLAYERS, 2023
    STARS
    EMERGING LEADERS
    PERVASIVE PLAYERS
    PARTICIPANTS
    COMPANY FOOTPRINT: KEY PLAYERS, 2023
    - Company footprint
    - Product footprint
    - End-use industry footprint
    - Region footprint
  • 12.7 COMPANY EVALUATION MATRIX: STARTUPS/SMES, 2023
    PROGRESSIVE COMPANIES
    RESPONSIVE COMPANIES
    DYNAMIC COMPANIES
    STARTING BLOCKS
    COMPETITIVE BENCHMARKING: STARTUPS/SMES, 2023
    - Detailed list of key startups/SMEs
    - Competitive benchmarking of key startups/SMEs
  • 12.8 COMPANY VALUATION AND FINANCIAL METRICS
  • 12.9 COMPETITIVE SCENARIO
    PRODUCT LAUNCHES
    DEALS
    EXPANSIONS
    OTHERS
COMPANY PROFILES
208
  • 13.1 KEY PLAYERS
    GRP LTD
    - Business overview
    - Products/Solutions/Services offered
    - MnM view
    GENAN HOLDING A/S
    - Business overview
    - Products/Solutions/Services offered
    - Recent developments
    - MnM view
    LEHIGH TECHNOLOGIES, INC.
    - Business overview
    - Products/Solutions/Services offered
    - Recent developments
    - MnM view
    ENTECH INC.
    - Business overview
    - Products/Solutions/Services offered
    - Recent developments
    - MnM view
    EMANUEL TIRE, LLC
    - Business overview
    - Products/Solutions/Services offered
    - MnM view
    RESOURCECO
    - Business overview
    - Products/Solutions/Services offered
    - Recent developments
    - MnM view
    LIBERTY TIRE RECYCLING
    - Business overview
    - Products/Solutions/Services offered
    - Recent developments
    - MnM view
    BDS TIRE RECYCLING
    - Business overview
    - Products/Solutions/Services offered
    - MnM view
    CONTEC
    - Business overview
    - Products/Solutions/Services offered
    - MnM view
    CRM
    - Business overview
    - Products/Solutions/Services offered
    - MnM view
  • 13.2 OTHER PLAYERS
    LDC CO., LTD.
    PYRUM INNOVATIONS AG
    TINNA RUBBER & INFRASTRUCTURE LTD
    CIRCTEC
    SCANDINAVIAN ENVIRO SYSTEMS AB
    BIG ATOM LIMITED
    MURFITTS INDUSTRIES
    GDT
    FRONT RANGE TIRE RECYCLE, INC.
    WEST COAST RUBBER RECYCLING
    WASTEFRONT
    RELIABLE TIRE RECYCLING
    VALLEY TIRE RECYCLING
    LAGEDO
    TRS
APPENDIX
246
  • 14.1 DISCUSSION GUIDE
  • 14.2 KNOWLEDGESTORE: MARKETSANDMARKETS’ SUBSCRIPTION PORTAL
  • 14.3 CUSTOMIZATION OPTIONS
  • 14.4 RELATED REPORTS
  • 14.5 AUTHOR DETAILS
LIST OF TABLES
 
  • TABLE 1 AVERAGE SELLING PRICE TREND OF TIRE RECYCLED-PRODUCTS, BY REGION, 2020–2023 (USD/TON)
  • TABLE 2 AVERAGE SELLING PRICE TREND OF TIRE RECYCLING, BY PRODUCT, 2020–2023 (USD/TON)
  • TABLE 3 AVERAGE SELLING PRICE TREND OF TIRE RECYCLING OFFERED BY KEY PLAYERS, BY PRODUCT, 2023 (USD/TON)
  • TABLE 4 ROLE OF COMPANIES IN TIRE RECYCLING ECOSYSTEM
  • TABLE 5 TIRE RECYCLING MARKET: KEY TECHNOLOGIES
  • TABLE 6 TIRE RECYCLING MARKET: COMPLEMENTARY TECHNOLOGIES
  • TABLE 7 TIRE RECYCLING MARKET: ADJACENT TECHNOLOGIES
  • TABLE 8 TIRE RECYCLING MARKET: TOTAL NUMBER OF PATENTS, 2014–2023
  • TABLE 9 TIRE RECYCLING MARKET: LIST OF MAJOR PATENT OWNERS, 2014−2023
  • TABLE 10 TIRE RECYCLING MARKET: LIST OF MAJOR PATENTS, 2017–2023
  • TABLE 11 TIRE RECYCLING MARKET: LIST OF KEY CONFERENCES AND EVENTS, 2024–2025
  • TABLE 12 TIRE RECYCLING MARKET: TARIFF ANALYSIS
  • TABLE 13 NORTH AMERICA: LIST OF REGULATORY BODIES, GOVERNMENT AGENCIES, AND OTHER ORGANIZATIONS
  • TABLE 14 EUROPE: LIST OF REGULATORY BODIES, GOVERNMENT AGENCIES, AND OTHER ORGANIZATIONS
  • TABLE 15 ASIA PACIFIC: LIST OF REGULATORY BODIES, GOVERNMENT AGENCIES, AND OTHER ORGANIZATIONS
  • TABLE 16 MIDDLE EAST & AFRICA: LIST OF REGULATORY BODIES, GOVERNMENT AGENCIES, AND OTHER ORGANIZATIONS
  • TABLE 17 SOUTH AMERICA: LIST OF REGULATORY BODIES, GOVERNMENT AGENCIES, AND OTHER ORGANIZATIONS
  • TABLE 18 TIRE RECYCLING MARKET: LIST OF REGULATIONS
  • TABLE 19 TIRE RECYCLING MARKET: PORTER’S FIVE FORCES ANALYSIS
  • TABLE 20 INFLUENCE OF STAKEHOLDERS ON BUYING PROCESS, BY END-USE INDUSTRY
  • TABLE 21 KEY BUYING CRITERIA, BY END-USE INDUSTRY
  • TABLE 22 PROJECTED REAL GDP GROWTH, BY KEY COUNTRY, 2023–2025 (ANNUAL PERCENTAGE CHANGE)
  • TABLE 23 TIRE RECYCLING MARKET, BY TYPE, 2020–2023 (USD MILLION)
  • TABLE 24 MARKET, BY TYPE, 2024–2029 (USD MILLION)
  • TABLE 25 TIRE RECYCLING MARKET, BY TYPE, 2020–2023 (KILOTON)
  • TABLE 26 MARKET, BY TYPE, 2024–2029 (KILOTON)
  • TABLE 27 TIRE RECYCLING MARKET, BY PROCESS, 2020–2023 (USD MILLION)
  • TABLE 28 MARKET, BY PROCESS, 2024–2029 (USD MILLION)
  • TABLE 29 TIRE RECYCLING MARKET, BY PRODUCT, 2020–2023 (USD MILLION)
  • TABLE 30 MARKET, BY PRODUCT, 2024–2029 (USD MILLION)
  • TABLE 31 TIRE RECYCLING MARKET, BY PRODUCT, 2020–2023 (KILOTON)
  • TABLE 32 MARKET, BY PRODUCT, 2024–2029 (KILOTON)
  • TABLE 33 TIRE RECYCLING MARKET, BY END-USE INDUSTRY, 2020–2023 (USD MILLION)
  • TABLE 34 MARKET, BY END-USE INDUSTRY, 2024–2029 (USD MILLION)
  • TABLE 35 TIRE RECYCLING MARKET, BY END-USE INDUSTRY, 2020–2023 (KILOTON)
  • TABLE 36 MARKET, BY END-USE INDUSTRY, 2024–2029 (KILOTON)
  • TABLE 37 TIRE RECYCLING MARKET, BY REGION, 2020–2023 (USD MILLION)
  • TABLE 38 MARKET, BY REGION, 2024–2029 (USD MILLION)
  • TABLE 39 TIRE RECYCLING MARKET, BY REGION, 2020–2023 (KILOTON)
  • TABLE 40 MARKET, BY REGION, 2024–2029 (KILOTON)
  • TABLE 41 ASIA PACIFIC: TIRE RECYCLING MARKET, BY COUNTRY, 2020–2023 (USD MILLION)
  • TABLE 42 ASIA PACIFIC: MARKET, BY COUNTRY, 2024–2029 (USD MILLION)
  • TABLE 43 ASIA PACIFIC: TIRE RECYCLING MARKET, BY COUNTRY, 2020–2023 (KILOTON)
  • TABLE 44 ASIA PACIFIC: MARKET, BY COUNTRY, 2024–2029 (KILOTON)
  • TABLE 45 ASIA PACIFIC: TIRE RECYCLING MARKET, BY PRODUCT, 2020–2023 (USD MILLION)
  • TABLE 46 ASIA PACIFIC: MARKET, BY PRODUCT, 2024–2029 (USD MILLION)
  • TABLE 47 ASIA PACIFIC: TIRE RECYCLING MARKET, BY PRODUCT, 2020–2023 (KILOTON)
  • TABLE 48 ASIA PACIFIC: MARKET, BY PRODUCT, 2024–2029 (KILOTON)
  • TABLE 49 ASIA PACIFIC: TIRE RECYCLING MARKET, BY TYPE, 2020–2023 (USD MILLION)
  • TABLE 50 ASIA PACIFIC: MARKET, BY TYPE, 2024–2029 (USD MILLION)
  • TABLE 51 ASIA PACIFIC: TIRE RECYCLING MARKET, BY TYPE, 2020–2023 (KILOTON)
  • TABLE 52 ASIA PACIFIC: MARKET, BY TYPE, 2024–2029 (KILOTON)
  • TABLE 53 ASIA PACIFIC: TIRE RECYCLING MARKET, BY PROCESS, 2020–2023 (USD MILLION)
  • TABLE 54 ASIA PACIFIC: MARKET, BY PROCESS, 2024–2029 (USD MILLION)
  • TABLE 55 ASIA PACIFIC: TIRE RECYCLING MARKET, BY END-USE INDUSTRY, 2020–2023 (USD MILLION)
  • TABLE 56 ASIA PACIFIC: MARKET, BY END-USE INDUSTRY, 2024–2029 (USD MILLION)
  • TABLE 57 ASIA PACIFIC: TIRE RECYCLING MARKET, BY END-USE INDUSTRY, 2020–2023 (KILOTON)
  • TABLE 58 ASIA PACIFIC: MARKET, BY END-USE INDUSTRY, 2024–2029 (KILOTON)
  • TABLE 59 CHINA: TIRE RECYCLING MARKET, BY END-USE INDUSTRY, 2020–2023(USD MILLION)
  • TABLE 60 CHINA: MARKET, BY END-USE INDUSTRY, 2024–2029 (USD MILLION)
  • TABLE 61 CHINA: TIRE RECYCLING MARKET, BY END-USE INDUSTRY, 2020–2023 (KILOTON)
  • TABLE 62 CHINA: MARKET, BY END-USE INDUSTRY, 2024–2029 (KILOTON)
  • TABLE 63 JAPAN: TIRE RECYCLING MARKET, BY END-USE INDUSTRY, 2020–2023(USD MILLION)
  • TABLE 64 JAPAN: MARKET, BY END-USE INDUSTRY, 2024–2029 (USD MILLION)
  • TABLE 65 JAPAN: TIRE RECYCLING MARKET, BY END-USE INDUSTRY, 2020–2023 (KILOTON)
  • TABLE 66 JAPAN: MARKET, BY END-USE INDUSTRY, 2024–2029 (KILOTON)
  • TABLE 67 INDIA: TIRE RECYCLING MARKET, BY END-USE INDUSTRY, 2020–2023(USD MILLION)
  • TABLE 68 INDIA: MARKET, BY END-USE INDUSTRY, 2024–2029 (USD MILLION)
  • TABLE 69 INDIA: TIRE RECYCLING MARKET, BY END-USE INDUSTRY, 2020–2023 (KILOTON)
  • TABLE 70 INDIA: MARKET, BY END-USE INDUSTRY, 2024–2029 (KILOTON)
  • TABLE 71 SOUTH KOREA: TIRE RECYCLING MARKET, BY END-USE INDUSTRY, 2020–2023(USD MILLION)
  • TABLE 72 SOUTH KOREA: MARKET, BY END-USE INDUSTRY, 2024–2029 (USD MILLION)
  • TABLE 73 SOUTH KOREA: TIRE RECYCLING MARKET, BY END-USE INDUSTRY, 2020–2023 (KILOTON)
  • TABLE 74 SOUTH KOREA: MARKET, BY END-USE INDUSTRY, 2024–2029 (KILOTON)
  • TABLE 75 REST OF ASIA PACIFIC: TIRE RECYCLING MARKET, BY END-USE INDUSTRY, 2020–2023(USD MILLION)
  • TABLE 76 REST OF ASIA PACIFIC: MARKET, BY END-USE INDUSTRY, 2024–2029 (USD MILLION)
  • TABLE 77 REST OF ASIA PACIFIC: TIRE RECYCLING MARKET, BY END-USE INDUSTRY, 2020–2023 (KILOTON)
  • TABLE 78 REST OF ASIA PACIFIC: MARKET, BY END-USE INDUSTRY, 2024–2029 (KILOTON)
  • TABLE 79 NORTH AMERICA: TIRE RECYCLING MARKET, BY COUNTRY, 2020–2023 (USD MILLION)
  • TABLE 80 NORTH AMERICA: MARKET, BY COUNTRY, 2024–2029 (USD MILLION)
  • TABLE 81 NORTH AMERICA: TIRE RECYCLING MARKET, BY COUNTRY, 2020–2023 (KILOTON)
  • TABLE 82 NORTH AMERICA: MARKET, BY COUNTRY, 2024–2029 (KILOTON)
  • TABLE 83 NORTH AMERICA: TIRE RECYCLING MARKET, BY PRODUCT, 2020–2023 (USD MILLION)
  • TABLE 84 NORTH AMERICA: MARKET, BY PRODUCT, 2024–2029 (USD MILLION)
  • TABLE 85 NORTH AMERICA: TIRE RECYCLING MARKET, BY PRODUCT, 2020–2023 (KILOTON)
  • TABLE 86 NORTH AMERICA: MARKET, BY PRODUCT, 2024–2029 (KILOTON)
  • TABLE 87 NORTH AMERICA: TIRE RECYCLING MARKET, BY TYPE, 2020–2023 (USD MILLION)
  • TABLE 88 NORTH AMERICA: MARKET, BY TYPE, 2024–2029 (USD MILLION)
  • TABLE 89 NORTH AMERICA: TIRE RECYCLING MARKET, BY TYPE, 2020–2023 (KILOTON)
  • TABLE 90 NORTH AMERICA: MARKET, BY TYPE, 2024–2029 (KILOTON)
  • TABLE 91 NORTH AMERICA: TIRE RECYCLING MARKET, BY PROCESS, 2020–2023 (USD MILLION)
  • TABLE 92 NORTH AMERICA: MARKET, BY PROCESS, 2024–2029 (USD MILLION)
  • TABLE 93 NORTH AMERICA: TIRE RECYCLING MARKET, BY END-USE INDUSTRY, 2020–2023 (USD MILLION)
  • TABLE 94 NORTH AMERICA: MARKET, BY END-USE INDUSTRY, 2024–2029 (USD MILLION)
  • TABLE 95 NORTH AMERICA: TIRE RECYCLING MARKET, BY END-USE INDUSTRY, 2020–2023 (KILOTON)
  • TABLE 96 NORTH AMERICA: MARKET, BY END-USE INDUSTRY, 2024–2029 (KILOTON)
  • TABLE 97 US: TIRE RECYCLING MARKET, BY END-USE INDUSTRY, 2020–2023 (USD MILLION)
  • TABLE 98 US: MARKET, BY END-USE INDUSTRY, 2024–2029 (USD MILLION)
  • TABLE 99 US: TIRE RECYCLING MARKET, BY END-USE INDUSTRY, 2020–2023 (KILOTON)
  • TABLE 100 US: MARKET, BY END-USE INDUSTRY, 2024–2029 (KILOTON)
  • TABLE 101 CANADA: TIRE RECYCLING MARKET, BY END-USE INDUSTRY, 2020–2023 (USD MILLION)
  • TABLE 102 CANADA: MARKET, BY END-USE INDUSTRY, 2024–2029 (USD MILLION)
  • TABLE 103 CANADA: TIRE RECYCLING MARKET, BY END-USE INDUSTRY, 2020–2023 (KILOTON)
  • TABLE 104 CANADA: MARKET, BY END-USE INDUSTRY, 2024–2029 (KILOTON)
  • TABLE 105 MEXICO: TIRE RECYCLING MARKET, BY END-USE INDUSTRY, 2020–2023 (USD MILLION)
  • TABLE 106 MEXICO: MARKET, BY END-USE INDUSTRY, 2024–2029 (USD MILLION)
  • TABLE 107 MEXICO: TIRE RECYCLING MARKET, BY END-USE INDUSTRY, 2020–2023 (KILOTON)
  • TABLE 108 MEXICO: MARKET, BY END-USE INDUSTRY, 2024–2029 (KILOTON)
  • TABLE 109 EUROPE: TIRE RECYCLING MARKET, BY COUNTRY, 2020–2023 (USD MILLION)
  • TABLE 110 EUROPE: MARKET, BY COUNTRY, 2024–2029 (USD MILLION)
  • TABLE 111 EUROPE: TIRE RECYCLING MARKET, BY COUNTRY, 2020–2023 (KILOTON)
  • TABLE 112 EUROPE: MARKET, BY COUNTRY, 2024–2029 (KILOTON)
  • TABLE 113 EUROPE: TIRE RECYCLING MARKET, BY PRODUCT, 2020–2023 (USD MILLION)
  • TABLE 114 EUROPE: MARKET, BY PRODUCT, 2024–2029 (USD MILLION)
  • TABLE 115 EUROPE: TIRE RECYCLING MARKET, BY PRODUCT, 2020–2023 (KILOTON)
  • TABLE 116 EUROPE: MARKET, BY PRODUCT, 2024–2029 (KILOTON)
  • TABLE 117 EUROPE: TIRE RECYCLING MARKET, BY TYPE, 2020–2023 (USD MILLION)
  • TABLE 118 EUROPE: MARKET, BY TYPE, 2024–2029 (USD MILLION)
  • TABLE 119 EUROPE: TIRE RECYCLING MARKET, BY TYPE, 2020–2023 (KILOTON)
  • TABLE 120 EUROPE: MARKET, BY TYPE, 2024–2029 (USD KILOTON)
  • TABLE 121 EUROPE: TIRE RECYCLING MARKET, BY PROCESS, 2020–2023 (USD MILLION)
  • TABLE 122 EUROPE: MARKET, BY PROCESS, 2024–2029 (USD MILLION)
  • TABLE 123 EUROPE: TIRE RECYCLING MARKET, BY END-USE INDUSTRY, 2020–2023 (USD MILLION)
  • TABLE 124 EUROPE: MARKET, BY END-USE INDUSTRY, 2024–2029 (USD MILLION)
  • TABLE 125 EUROPE: TIRE RECYCLING MARKET, BY END-USE INDUSTRY, 2020–2023 (KILOTON
  • TABLE 126 EUROPE: MARKET, BY END-USE INDUSTRY, 2024–2029 (KILOTON)
  • TABLE 127 GERMANY: TIRE RECYCLING MARKET, BY END-USE INDUSTRY, 2020–2023 (USD MILLION)
  • TABLE 128 GERMANY: MARKET, BY END-USE INDUSTRY, 2024–2029 (USD MILLION)
  • TABLE 129 GERMANY: TIRE RECYCLING MARKET, BY END-USE INDUSTRY, 2020–2023 (KILOTON)
  • TABLE 130 GERMANY: MARKET, BY END-USE INDUSTRY, 2024–2029 (KILOTON)
  • TABLE 131 ITALY: TIRE RECYCLING MARKET, BY END-USE INDUSTRY, 2020–2023 (USD MILLION)
  • TABLE 132 ITALY: MARKET, BY END-USE INDUSTRY, 2024–2029 (USD MILLION)
  • TABLE 133 ITALY : TIRE RECYCLING MARKET, BY END-USE INDUSTRY, 2020–2023 (KILOTON)
  • TABLE 134 ITALY: MARKET, BY END-USE INDUSTRY, 2024–2029 (KILOTON)
  • TABLE 135 FRANCE: TIRE RECYCLING MARKET, BY END-USE INDUSTRY, 2020–2023 (USD MILLION)
  • TABLE 136 FRANCE: MARKET, BY END-USE INDUSTRY, 2024–2029 (USD MILLION)
  • TABLE 137 FRANCE: TIRE RECYCLING MARKET, BY END-USE INDUSTRY, 2020–2023 (KILOTON)
  • TABLE 138 FRANCE: MARKET, BY END-USE INDUSTRY, 2024–2029 (KILOTON)
  • TABLE 139 UK: TIRE RECYCLING MARKET, BY END-USE INDUSTRY, 2020–2023 (USD MILLION)
  • TABLE 140 UK: MARKET, BY END-USE INDUSTRY, 2024–2029 (USD MILLION)
  • TABLE 141 UK: TIRE RECYCLING MARKET, BY END-USE INDUSTRY, 2020–2023 (KILOTON)
  • TABLE 142 UK: MARKET, BY END-USE INDUSTRY, 2024–2029 (KILOTON)
  • TABLE 143 SPAIN: TIRE RECYCLING MARKET, BY END-USE INDUSTRY, 2020–2023 (USD MILLION)
  • TABLE 144 SPAIN: MARKET, BY END-USE INDUSTRY, 2024–2029 (USD MILLION)
  • TABLE 145 SPAIN: TIRE RECYCLING MARKET, BY END-USE INDUSTRY, 2020–2023 (KILOTON)
  • TABLE 146 SPAIN: MARKET, BY END-USE INDUSTRY, 2024–2029 (KILOTON)
  • TABLE 147 RUSSIA: TIRE RECYCLING MARKET, BY END-USE INDUSTRY, 2020–2023 (USD MILLION)
  • TABLE 148 RUSSIA: MARKET, BY END-USE INDUSTRY, 2024–2029 (USD MILLION)
  • TABLE 149 RUSSIA: TIRE RECYCLING MARKET, BY END-USE INDUSTRY, 2020–2023 (KILOTON)
  • TABLE 150 RUSSIA: MARKET, BY END-USE INDUSTRY, 2024–2029 (KILOTON)
  • TABLE 151 REST OF EUROPE: TIRE RECYCLING MARKET, BY END-USE INDUSTRY, 2020–2023 (USD MILLION)
  • TABLE 152 REST OF EUROPE: MARKET, BY END-USE INDUSTRY, 2024–2029 (USD MILLION)
  • TABLE 153 REST OF EUROPE: TIRE RECYCLING MARKET, BY END-USE INDUSTRY, 2020–2023 (KILOTON)
  • TABLE 154 REST OF EUROPE: MARKET, BY END-USE INDUSTRY, 2024–2029 (KILOTON)
  • TABLE 155 MIDDLE EAST & AFRICA: TIRE RECYCLING MARKET, BY COUNTRY, 2020–2023 (USD MILLION)
  • TABLE 156 MIDDLE EAST & AFRICA: MARKET, BY COUNTRY, 2024–2029 (USD MILLION)
  • TABLE 157 MIDDLE EAST & AFRICA: TIRE RECYCLING MARKET, BY COUNTRY, 2020–2023 (KILOTON)
  • TABLE 158 MIDDLE EAST & AFRICA: MARKET, BY COUNTRY, 2024–2029 (KILOTON)
  • TABLE 159 MIDDLE EAST & AFRICA: TIRE RECYCLING MARKET, BY PRODUCT, 2020–2023 (USD MILLION)
  • TABLE 160 MIDDLE EAST & AFRICA: MARKET, BY PRODUCT, 2024–2029 (USD MILLION)
  • TABLE 161 MIDDLE EAST & AFRICA: TIRE RECYCLING MARKET, BY PRODUCT, 2020–2023 (KILOTON)
  • TABLE 162 MIDDLE EAST & AFRICA: MARKET, BY PRODUCT, 2024–2029 (KILOTON)
  • TABLE 163 MIDDLE EAST & AFRICA: TIRE RECYCLING MARKET, BY TYPE, 2020–2023 (USD MILLION)
  • TABLE 164 MIDDLE EAST & AFRICA: MARKET, BY TYPE, 2024–2029 (USD MILLION)
  • TABLE 165 MIDDLE EAST & AFRICA: TIRE RECYCLING MARKET, BY TYPE, 2020–2023 (KILOTON)
  • TABLE 166 MIDDLE EAST & AFRICA: MARKET, BY TYPE, 2024–2029 (USD KILOTON)
  • TABLE 167 MIDDLE EAST & AFRICA: TIRE RECYCLING MARKET, BY PROCESS, 2020–2023 (USD MILLION)
  • TABLE 168 MIDDLE EAST & AFRICA: MARKET, BY PROCESS, 2024–2029 (USD MILLION)
  • TABLE 169 MIDDLE EAST & AFRICA: TIRE RECYCLING MARKET, BY END-USE INDUSTRY, 2020–2023 (USD MILLION)
  • TABLE 170 MIDDLE EAST & AFRICA: MARKET, BY END-USE INDUSTRY, 2024–2029 (USD MILLION)
  • TABLE 171 MIDDLE EAST & AFRICA: TIRE RECYCLING MARKET, BY END-USE INDUSTRY, 2020–2023 (KILOTON)
  • TABLE 172 MIDDLE EAST & AFRICA: TIRE RECYCLING MARKET, BY END-USE INDUSTRY, 2024–2029 (KILOTON)
  • TABLE 173 SAUDI ARABIA: TIRE RECYCLING MARKET, BY END-USE INDUSTRY, 2020–2023(USD MILLION)
  • TABLE 174 SAUDI ARABIA: MARKET, BY END-USE INDUSTRY, 2024–2029 (USD MILLION)
  • TABLE 175 SAUDI ARABIA: TIRE RECYCLING MARKET, BY END-USE INDUSTRY, 2020–2023 (KILOTON)
  • TABLE 176 SAUDI ARABIA: MARKET, BY END-USE INDUSTRY, 2024–2029 (KILOTON)
  • TABLE 177 UAE: TIRE RECYCLING MARKET, BY END-USE INDUSTRY, 2020–2023(USD MILLION)
  • TABLE 178 UAE: MARKET, BY END-USE INDUSTRY, 2024–2029 (USD MILLION)
  • TABLE 179 UAE: TIRE RECYCLING MARKET, BY END-USE INDUSTRY, 2020–2023 (KILOTON)
  • TABLE 180 UAE: MARKET, BY END-USE INDUSTRY, 2024–2029 (KILOTON)
  • TABLE 181 REST OF GCC COUNTRIES: TIRE RECYCLING MARKET, BY END-USE INDUSTRY, 2020–2023(USD MILLION)
  • TABLE 182 REST OF GCC COUNTRIES: MARKET, BY END-USE INDUSTRY, 2024–2029 (USD MILLION)
  • TABLE 183 REST OF GCC COUNTRIES: TIRE RECYCLING MARKET, BY END-USE INDUSTRY, 2020–2023 (KILOTON)
  • TABLE 184 REST OF GCC COUNTRIES: MARKET, BY END-USE INDUSTRY, 2024–2029 (KILOTON)
  • TABLE 185 SOUTH AFRICA: TIRE RECYCLING MARKET, BY END-USE INDUSTRY, 2020–2023(USD MILLION)
  • TABLE 186 SOUTH AFRICA: MARKET, BY END-USE INDUSTRY, 2024–2029 (USD MILLION)
  • TABLE 187 SOUTH AFRICA: TIRE RECYCLING MARKET, BY END-USE INDUSTRY, 2020–2023 (KILOTON)
  • TABLE 188 SOUTH AFRICA: MARKET, BY END-USE INDUSTRY, 2024–2029 (KILOTON)
  • TABLE 189 REST OF MIDDLE EAST & AFRICA: TIRE RECYCLING MARKET, BY END-USE INDUSTRY, 2020–2023(USD MILLION)
  • TABLE 190 REST OF MIDDLE EAST & AFRICA: MARKET, BY END-USE INDUSTRY, 2024–2029 (USD MILLION)
  • TABLE 191 REST OF MIDDLE EAST & AFRICA: TIRE RECYCLING MARKET, BY END-USE INDUSTRY, 2020–2023 (KILOTON)
  • TABLE 192 REST OF MIDDLE EAST & AFRICA: MARKET, BY END-USE INDUSTRY, 2024–2029 (KILOTON)
  • TABLE 193 SOUTH AMERICA: TIRE RECYCLING MARKET, BY COUNTRY, 2020–2023 (USD MILLION)
  • TABLE 194 SOUTH AMERICA: MARKET, BY COUNTRY, 2024–2029 (USD MILLION)
  • TABLE 195 SOUTH AMERICA: TIRE RECYCLING MARKET, BY COUNTRY, 2020–2023 (KILOTON)
  • TABLE 196 SOUTH AMERICA: MARKET, BY COUNTRY, 2024–2029 (KILOTON)
  • TABLE 197 SOUTH AMERICA: TIRE RECYCLING MARKET, BY PRODUCT, 2020–2023 (USD MILLION)
  • TABLE 198 SOUTH AMERICA: MARKET, BY PRODUCT, 2024–2029 (USD MILLION)
  • TABLE 199 SOUTH AMERICA: TIRE RECYCLING MARKET, BY PRODUCT, 2020–2023 (KILOTON)
  • TABLE 200 SOUTH AMERICA: MARKET, BY PRODUCT, 2024–2029 (KILOTON)
  • TABLE 201 SOUTH AMERICA: TIRE RECYCLING MARKET, BY TYPE, 2020–2023 (USD MILLION)
  • TABLE 202 SOUTH AMERICA: MARKET, BY TYPE, 2024–2029 (USD MILLION)
  • TABLE 203 SOUTH AMERICA: TIRE RECYCLING MARKET, BY TYPE, 2020–2023 (KILOTON)
  • TABLE 204 SOUTH AMERICA: MARKET, BY TYPE, 2024–2029 (KILOTON)
  • TABLE 205 SOUTH AMERICA: TIRE RECYCLING MARKET, BY PROCESS, 2020–2023 (USD MILLION)
  • TABLE 206 SOUTH AMERICA: MARKET, BY PROCESS, 2024–2029 (USD MILLION)
  • TABLE 207 SOUTH AMERICA: TIRE RECYCLING MARKET, BY END-USE INDUSTRY, 2020–2023 (USD MILLION)
  • TABLE 208 SOUTH AMERICA: MARKET, BY END-USE INDUSTRY, 2024–2029 (USD MILLION)
  • TABLE 209 SOUTH AMERICA: TIRE RECYCLING MARKET, BY END-USE INDUSTRY, 2020–2023 (KILOTON)
  • TABLE 210 SOUTH AMERICA: MARKET, BY END-USE INDUSTRY, 2024–2029 (KILOTON)
  • TABLE 211 BRAZIL: TIRE RECYCLING MARKET, BY END-USE INDUSTRY, 2020–2023(USD MILLION)
  • TABLE 212 BRAZIL: MARKET, BY END-USE INDUSTRY, 2024–2029 (USD MILLION)
  • TABLE 213 BRAZIL: TIRE RECYCLING MARKET, BY END-USE INDUSTRY, 2020–2023 (KILOTON)
  • TABLE 214 BRAZIL: MARKET, BY END-USE INDUSTRY, 2024–2029 (KILOTON)
  • TABLE 215 ARGENTINA: TIRE RECYCLING MARKET, BY END-USE INDUSTRY, 2020–2023(USD MILLION)
  • TABLE 216 ARGENTINA: MARKET, BY END-USE INDUSTRY, 2024–2029 (USD MILLION)
  • TABLE 217 ARGENTINA: TIRE RECYCLING MARKET, BY END-USE INDUSTRY, 2020–2023 (KILOTON)
  • TABLE 218 ARGENTINA: MARKET, BY END-USE INDUSTRY, 2024–2029 (KILOTON)
  • TABLE 219 REST OF SOUTH AMERICA: TIRE RECYCLING MARKET, BY END-USE INDUSTRY, 2020–2023(USD MILLION)
  • TABLE 220 REST OF SOUTH AMERICA: MARKET, BY END-USE INDUSTRY, 2024–2029 (USD MILLION)
  • TABLE 221 REST OF SOUTH AMERICA: TIRE RECYCLING MARKET, BY END-USE INDUSTRY, 2020–2023 (KILOTON)
  • TABLE 222 REST OF SOUTH AMERICA: MARKET, BY END-USE INDUSTRY, 2024–2029 (KILOTON)
  • TABLE 223 TIRE RECYCLING MARKET: OVERVIEW OF KEY STRATEGIES ADOPTED BY MAJOR PLAYERS
  • TABLE 224 MARKET: DEGREE OF COMPETITION, 2023
  • TABLE 225 TIRE RECYCLING MARKET: PRODUCT FOOTPRINT
  • TABLE 226 MARKET: END-USE INDUSTRY FOOTPRINT
  • TABLE 227 TIRE RECYCLING MARKET: REGION FOOTPRINT
  • TABLE 228 MARKET: DETAILED LIST OF KEY STARTUPS/SMES
  • TABLE 229 TIRE RECYCLING MARKET: COMPETITIVE BENCHMARKING OF KEY STARTUPS/SMES
  • TABLE 230 SUSTAINABLE TIRE MATERIALS MARKET: PRODUCT LAUNCHES, JANUARY 2020–AUGUST 2024
  • TABLE 231 TIRE RECYCLING MARKET: DEALS, JANUARY 2020–AUGUST 2024
  • TABLE 232 MARKET: EXPANSIONS, JANUARY 2020–AUGUST 2024
  • TABLE 233 TIRE RECYCLING MARKET: OTHERS, JANUARY 2020– AUGUST 2024
  • TABLE 234 GRP LTD: COMPANY OVERVIEW
  • TABLE 235 GRP LTD: PRODUCTS/SOLUTIONS/SERVICES OFFERED
  • TABLE 236 GENAN HOLDING A/S: COMPANY OVERVIEW
  • TABLE 237 GENAN HOLDING A/S: PRODUCTS/SOLUTIONS/SERVICES OFFERED
  • TABLE 238 GENAN HOLDING A/S: PRODUCT LAUNCHES, JANUARY 2021–JULY 2024
  • TABLE 239 LEHIGH TECHNOLOGIES, INC.: COMPANY OVERVIEW
  • TABLE 240 LEHIGH TECHNOLOGIES, INC.: PRODUCTS/SOLUTIONS/SERVICES OFFERED
  • TABLE 241 LEHIGH TECHNOLOGIES, INC.: OTHERS
  • TABLE 242 LEHIGH TECHNOLOGIES, INC.: EXPANSIONS
  • TABLE 243 ENTECH INC.: COMPANY OVERVIEW
  • TABLE 244 ENTECH INC.: PRODUCTS/SOLUTIONS/SERVICES OFFERED
  • TABLE 245 ENTECH INC.: OTHERS
  • TABLE 246 EMANUEL TIRE, LLC: COMPANY OVERVIEW
  • TABLE 247 EMANUEL TIRE, LLC: PRODUCTS/SOLUTIONS/SERVICES OFFERED
  • TABLE 248 RESOURCECO: COMPANY OVERVIEW
  • TABLE 249 RESOURCECO: PRODUCTS/SOLUTIONS/SERVICES OFFERED
  • TABLE 250 RESOURCECO: DEALS
  • TABLE 251 RESOURCECO: EXPANSIONS
  • TABLE 252 LIBERTY TIRE RECYCLING: COMPANY OVERVIEW
  • TABLE 253 LIBERTY TIRE RECYCLING: PRODUCTS/SOLUTIONS/SERVICES OFFERED
  • TABLE 254 LIBERTY TIRE RECYCLING: DEALS
  • TABLE 255 LIBERTY TIRE RECYCLING: EXPANSIONS
  • TABLE 256 BDS TIRE RECYCLING: COMPANY OVERVIEW
  • TABLE 257 BDS TIRE RECYCLING: PRODUCTS/SOLUTIONS/SERVICES OFFERED
  • TABLE 258 CONTEC: COMPANY OVERVIEW
  • TABLE 259 CONTEC: PRODUCTS/SOLUTIONS/SERVICES OFFERED
  • TABLE 260 CRM: COMPANY OVERVIEW
  • TABLE 261 CRM: PRODUCTS/SOLUTIONS/SERVICES OFFERED
  • TABLE 262 LDC CO., LTD.: COMPANY OVERVIEW
  • TABLE 263 PYRUM INNOVATIONS AG: COMPANY OVERVIEW
  • TABLE 264 TINNA RUBBER & INFRASTRUCTURE LTD: COMPANY OVERVIEW
  • TABLE 265 CIRCTEC: COMPANY OVERVIEW
  • TABLE 266 SCANDINAVIAN ENVIRO SYSTEMS AB: COMPANY OVERVIEW
  • TABLE 267 BIG ATOM LIMITED: COMPANY OVERVIEW
  • TABLE 268 MURFITTS INDUSTRIES: COMPANY OVERVIEW
  • TABLE 269 GDT: COMPANY OVERVIEW
  • TABLE 270 FRONT RANGE TIRE RECYCLE, INC.: COMPANY OVERVIEW
  • TABLE 271 WEST COAST RUBBER RECYCLING: COMPANY OVERVIEW
  • TABLE 272 WASTEFRONT: COMPANY OVERVIEW
  • TABLE 273 RELIABLE TIRE RECYCLING: COMPANY OVERVIEW
  • TABLE 274 VALLEY TIRE RECYCLING: COMPANY OVERVIEW
  • TABLE 275 LAGEDO: COMPANY OVERVIEW
  • TABLE 276 TRS: COMPANY OVERVIEW
LIST OF FIGURES
 
  • FIGURE 1 TIRE RECYCLING MARKET SEGMENTATION
  • FIGURE 2 TIRE RECYCLING MARKET: RESEARCH DESIGN
  • FIGURE 3 MARKET SIZE ESTIMATION METHODOLOGY: SUPPLY-SIDE APPROACH
  • FIGURE 4 MARKET SIZE ESTIMATION METHODOLOGY: DEMAND-SIDE APPROACH
  • FIGURE 5 MARKET SIZE ESTIMATION METHODOLOGY: BOTTOM-UP APPROACH
  • FIGURE 6 MARKET SIZE ESTIMATION METHODOLOGY: TOP-DOWN APPROACH
  • FIGURE 7 TIRE RECYCLING MARKET: DATA TRIANGULATION
  • FIGURE 8 RUBBER SEGMENT TO DOMINATE TIRE RECYCLING MARKET IN 2024
  • FIGURE 9 MECHANICAL SHREDDING SEGMENT TO ACCOUNT FOR LARGEST SHARE OF TIRE RECYCLING MARKET IN 2029
  • FIGURE 10 CONSTRUCTION SEGMENT TO ACCOUNT FOR LARGEST SHARE OF TIRE RECYCLING MARKET IN 2029
  • FIGURE 11 SERVICE SEGMENT TO ACCOUNT FOR LARGER SHARE OF TIRE RECYCLING MARKET IN 2029
  • FIGURE 12 ASIA PACIFIC TO LEAD TIRE RECYCLING MARKET DURING FORECAST PERIOD
  • FIGURE 13 RISING DEMAND FOR ECO-FRIENDLY TIRE SOLUTIONS ATTRIBUTED TO ENVIRONMENTAL REGULATIONS AND GROWING CONSUMER AWARENESS TO CREATE LUCRATIVE OPPORTUNITIES FOR MARKET PLAYERS
  • FIGURE 14 RUBBER TO BE FASTEST-GROWING SEGMENT DURING FORECAST PERIOD
  • FIGURE 15 MECHANICAL SHREDDING TO BE FASTEST-GROWING SEGMENT DURING FORECAST PERIOD
  • FIGURE 16 CONSTRUCTION TO BE FASTEST-GROWING SEGMENT DURING FORECAST PERIOD
  • FIGURE 17 SERVICE TO REGISTER HIGHER CAGR DURING FORECAST PERIOD
  • FIGURE 18 CHINA TO BE FASTEST-GROWING MARKET DURING FORECAST PERIOD
  • FIGURE 19 TIRE RECYCLING MARKET: DRIVERS, RESTRAINTS, OPPORTUNITIES, AND CHALLENGES
  • FIGURE 20 US OF AI BY CHEMICAL COMPANIES ACROSS VARIOUS BUSINESS AREAS
  • FIGURE 21 USE OF GENERATIVE AI IN TIRE RECYCLING MARKET
  • FIGURE 22 TRENDS/DISRUPTIONS INFLUENCING CUSTOMER BUSINESS
  • FIGURE 23 TIRE RECYCLING MARKET: SUPPLY CHAIN ANALYSIS
  • FIGURE 24 TIRE RECYCLING MARKET: INVESTMENT AND FUNDING SCENARIO, 2020–2024 (USD MILLION)
  • FIGURE 25 AVERAGE SELLING PRICE TREND OF TIRE RECYCLED-PRODUCTS, BY REGION, 2020–2023 (USD/TON)
  • FIGURE 26 AVERAGE SELLING PRICE TREND OF TIRE RECYCLING OFFERED BY KEY PLAYERS, BY PRODUCT, 2023 (USD/TON)
  • FIGURE 27 NUMBER OF PATENTS GRANTED, 2014−2023
  • FIGURE 28 TIRE RECYCLING MARKET: LEGAL STATUS OF PATENTS, 2014−2023
  • FIGURE 29 PATENT ANALYSIS FOR TIRE RECYCLING, BY JURISDICTION, 2014−2023
  • FIGURE 30 TOP 10 COMPANIES WITH HIGHEST NUMBER OF PATENTS, 2014−2023
  • FIGURE 31 IMPORT DATA FOR TIRE RECYCLING (HS CODE 400400), BY COUNTRY, 2020–2023 (USD THOUSAND)
  • FIGURE 32 EXPORT DATA FOR TIRE RECYCLING (HS CODE 400400), BY COUNTRY, 2020–2023 (USD THOUSAND)
  • FIGURE 33 PORTER’S FIVE FORCES ANALYSIS: TIRE RECYCLING MARKET
  • FIGURE 34 INFLUENCE OF STAKEHOLDERS ON BUYING PROCESS, BY END-USE INDUSTRY
  • FIGURE 35 KEY BUYING CRITERIA, BY END-USE INDUSTRY
  • FIGURE 36 SERVICE SEGMENT TO HOLD LARGER MARKET SHARE IN 2024
  • FIGURE 37 MECHANICAL SHREDDING SEGMENT TO LEAD MARKET DURING FORECAST PERIOD
  • FIGURE 38 RUBBER SEGMENT TO HOLD LARGEST MARKET SHARE IN 2024
  • FIGURE 39 CONSTRUCTION SEGMENT TO HOLD LARGEST SHARE OF TIRE RECYCLING MARKET IN 2024
  • FIGURE 40 ASIA PACIFIC TO BE FASTEST-GROWING TIRE RECYCLING MARKET DURING FORECAST PERIOD
  • FIGURE 41 ASIA PACIFIC: TIRE RECYCLING MARKET SNAPSHOT
  • FIGURE 42 NORTH AMERICA: TIRE RECYCLING MARKET SNAPSHOT
  • FIGURE 43 EUROPE: TIRE RECYCLING MARKET SNAPSHOT
  • FIGURE 44 MARKET SHARE ANALYSIS, 2023
  • FIGURE 45 MARKET: REVENUE ANALYSIS OF KEY PLAYERS, 2020–2024 (USD BILLION)
  • FIGURE 46 MARKET: BRAND/PRODUCT COMPARATIVE ANALYSIS
  • FIGURE 47 MARKET: COMPANY EVALUATION MATRIX (KEY PLAYERS), 2023
  • FIGURE 48 MARKET: COMPANY FOOTPRINT
  • FIGURE 49 MARKET: COMPANY EVALUATION MATRIX (STARTUPS/SMES), 2023
  • FIGURE 50 MARKET: EV/EBITDA OF KEY VENDOR
  • FIGURE 51 MARKET: YEAR-TO-DATE (YTD) PRICE TOTAL RETURN
  • FIGURE 52 GRP LTD: COMPANY SNAPSHOT
  • FIGURE 53 GENAN HOLDING A/S: COMPANY SNAPSHOT
  • FIGURE 54 LEHIGH TECHNOLOGIES, INC.: COMPANY SNAPSHOT


The study involved four major activities in estimating the market size of the tire recycling market. Exhaustive secondary research was done to collect information on the market, the peer market, and the parent market. The next step was to validate these findings, assumptions, and sizing with industry experts across the value chain through primary research. Both top-down and bottom-up approaches were employed to estimate the complete market size. Thereafter, the market breakdown and data triangulation procedures were used to estimate the market size of the segments and subsegments.

Secondary Research

In the secondary research process, various secondary sources have been referred to for identifying and collecting information for this study. These secondary sources include annual reports, press releases, investor presentations of companies, white papers, certified publications, trade directories, articles from recognized authors, the gold standard and silver standard websites, and databases.

Secondary research has been used to obtain key information about the value chain of the industry, the monetary chain of the market, the total pool of key players, market classification, and segmentation according to industry trends to the bottom-most level and regional markets. It was also used to obtain information about the key developments from a market-oriented perspective.

Primary Research

The tire recycling market comprises several stakeholders in the value chain, which include tire collection, sorting and processing, material recovery, distribution and logistics and end-user. Various primary sources from the supply and demand sides of the tire recycling market have been interviewed to obtain qualitative and quantitative information. The primary interviewees from the demand side include key opinion leaders in tire industries. The primary sources from the supply side include manufacturers, associations, and institutions involved in the tire recycling industry.

Primary interviews were conducted to gather insights such as market statistics, data on revenue collected from the products and services, market breakdowns, market size estimations, market forecasting, and data triangulation. Primary research also helped in understanding the various trends related to product, process, type, end-use industries and region. Stakeholders from the demand side, such as CIOs, CTOs, and CSOs, were interviewed to understand the buyer’s perspective on the suppliers, products, fabricators, and their current usage of tire recycling and the outlook of their business, which will affect the overall market.

The breakdown of profiles of the primary interviewees is illustrated in the figure below:
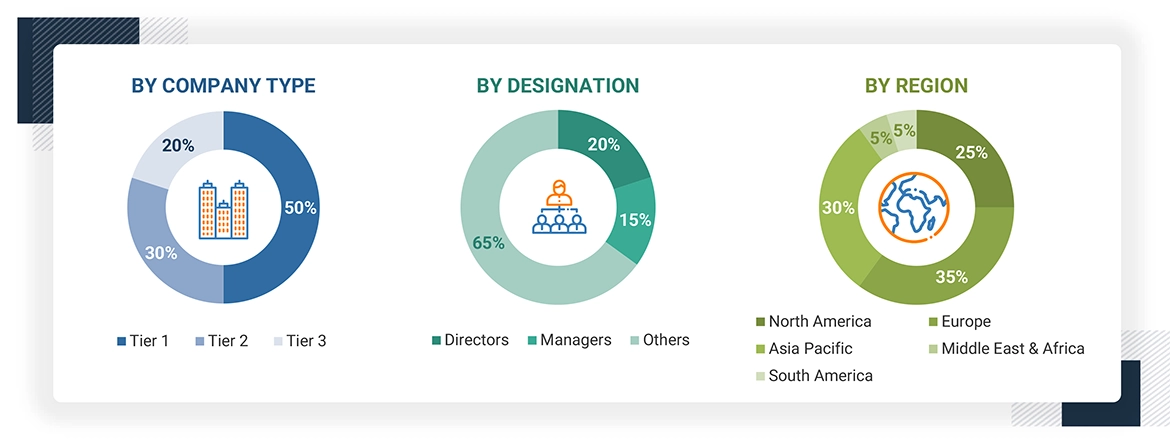
Note: Tier 1, Tier 2, and Tier 3 companies are classified based on their market revenue in 2022, available in the public domain, product portfolios, and geographical presence.

Other designations include consultants and sales, marketing, and procurement managers.

To know about the assumptions considered for the study, download the pdf brochure

COMPANY NAME DESIGNATION
Lehigh Technologies, Inc. Tire recycling manufacturer
ResourceCo Tire recycling manufacturer
GRP LTD. Tire recycling manufacturer
GENAN HOLDING A/S Tire recycling manufacturer
Liberty Tire Recycling Tire recycling manufacturer

Market Size Estimation

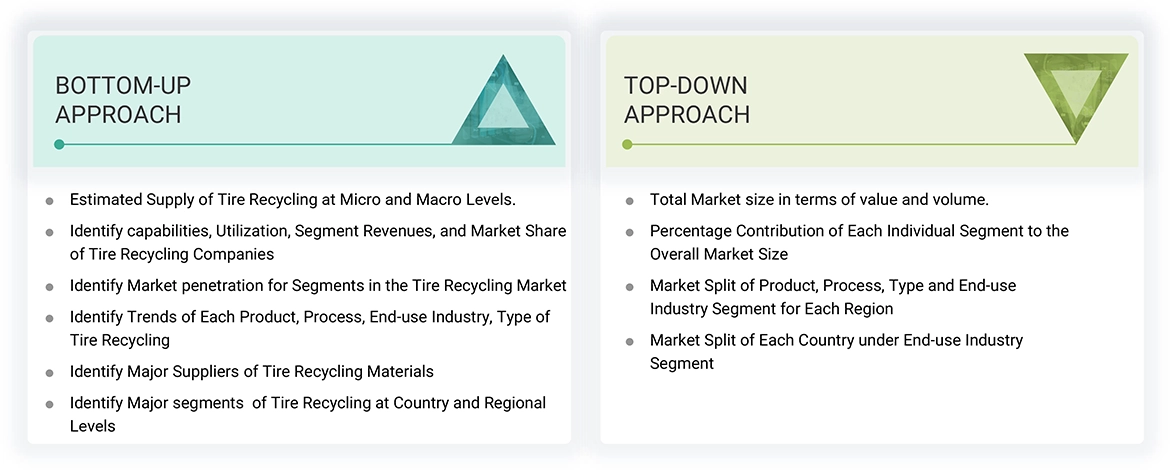
The top-down and bottom-up approaches have been used to estimate and validate the size of the tire recycling market.

  • The key players in the industry have been identified through extensive secondary research.
  • The industry's supply chain has been determined through primary and secondary research.
  • All percentage shares, splits, and breakdowns have been determined using secondary sources and verified through primary sources.
  • All possible parameters that affect the markets covered in this research study have been accounted for, viewed in extensive detail, verified through primary research, and analyzed to obtain the final quantitative and qualitative data.
  • The research includes the study of reports, reviews, and newsletters of the key market players, along with extensive interviews for opinions with leaders such as directors and marketing executives.
Data Triangulation

After arriving at the total market size from the estimation process explained above, the overall market has been split into several segments and sub-segments. To complete the overall market engineering process and arrive at the exact statistics for all the segments and sub-segments, the data triangulation and market breakdown procedures have been employed, wherever applicable. The data has been triangulated by studying various factors and trends from both the demand and supply sides. Along with this, the market size has been validated by using both the top-down and bottom-up approaches and primary interviews. Hence, for every data segment, there have been three sources—top-down approach, bottom-up approach, and expert interviews. The data was assumed correct when the values arrived from the three sources matched.

Market Definition

This market is the collection, processing, and reuse of waste tires into useful products or materials. This market fits the environmental dilemma in disposal waste tires by processing to useful materials in forms of crumb rubber, TDF, TDA, carbon black, and steel, applied generally in construction, automotive, manufacturing, and energy sectors. The key recycling processes include mechanical shredding, pyrolysis, ambient grinding, and devulcanization, which break down the tires into its components for different applications. Global growth in sustainability, coupled with rigid regulations by governments for safe and proper disposal of tires, is stimulating market growth. Growth in demand for eco-friendly products, especially in road construction like rubberized asphalt, sports surfaces and alternative fuels supports the growth of the tire recycling market. Advances and innovations in technological processes related to recycling processes have continually seen improvement in efficiency and broadened the scope of tire applications for recycling.

Stakeholders

  • End-of-life tire Suppliers
  • Tire recycling traders, distributors, and suppliers
  • Recycling Companies
  • Government and research organizations
  • Associations and industrial bodies
  • Research & development (R&D) institutions.
  • Environmental support agencies.

Report Objectives

  • To define, describe, and forecast the size of the tire recycling market, in terms of value and volume.
  • To provide detailed information regarding the major factors (drivers, opportunities, restraints, and challenges) influencing the growth of the market
  • To estimate and forecast the market size based on product, process, type, end-use industry, and region.
  • To forecast the size of the market with respect to major regions, namely, Europe, North America, Asia Pacific, Middle East & Africa, and South America, along with their key countries.
  • To strategically analyze micromarkets1 with respect to individual growth trends, prospects, and their contribution to the overall market.
  • To analyze opportunities in the market for stakeholders and provide a competitive landscape of market leaders.
  • To track and analyze recent developments such as expansions, new product launches, partnerships & agreements, and acquisitions in the market.
  • To strategically profile key market players and comprehensively analyze their core competencies.

Previous Versions of this Report

"Our USP is "providing game-changing business opportunities reports with free customization" - so please feel free to provide us with your specific areas of interest / business challenges in much greater detail !!"

We appreciate your interest in this report. Once you fill out the form, you'll be immediately directed to an exclusive solution tailored to your needs. This high-value offering can help boost your revenue by 30% - a must-see opportunity for anyone looking to maximize growth.


By clicking the "Submit" button, you are agreeing to the Terms of Use and Privacy Policy.

Custom Market Research Services

We Will Customise The Research For You, In Case The Report Listed Above Does Not Meet With Your Requirements

Get 10% Free Customisation

Growth opportunities and latent adjacency in Tire Recycling Market

DMCA.com Protection Status