The research report includes four major activities, estimating the size of the test and measurement equipment market. Secondary research has been done to gather important information about the market and peer markets. To validate the findings, assumptions, and sizing with the primary research with industry experts across the supply chain is the next step. Both bottom-up and top-down approaches have been used to estimate the market size. After this, the market breakdown and data triangulation have been adopted to estimate the market sizes of segments and sub-segments
Secondary Research
For estimating the revenues of the test and measurement equipment providing companies around the world, the secondary data were collected from the paid and free online sources. Sample sources for secondary research include government body publications, companies’ annual reports and financial statements and trade/professional association publications. This data contributes to establishing the market size that, in turn, was verified during the primary research.
Secondary research approach is used to obtain key insights about the supply chain of the industry to identify key players and to prevail trends with regards to different instruments, sampling methods, applications, and geographical area. Also, the market and the technology trends were monitored during the study.
Primary Research
In the primary research phase, a variety of industry experts were interviewed to gather qualitative and quantitative insights about the market across four key regions: Asia Pacific, North America, Europe, and RoW (the Middle East, Africa, and South America). These experts included CEOs, vice presidents, marketing directors, technology directors, and other key executives from leading companies and organizations in the test and measurement equipment sector.
Having fine-tuned the common and key variables from the market engineering the next step was to gather primary data that was otherwise obtained from other sources. This research also sought to uncover the target markets, the industry trends, the market stakeholders, and the key features of the market including drivers, restraints, opportunities, challenges among others. The questionnaire was used together with the emails and telephone conversation to source out this important data mainly from the supply side of the market.

To know about the assumptions considered for the study, download the pdf brochure
Market Size Estimation
The top-down and bottom-up approaches were extensively employed in the market engineering process. Various data triangulation methods were utilized to forecast and estimate the market segments and subsegments covered in the report. Multiple qualitative and quantitative analyses were conducted during the market engineering process to extract key insights throughout the report.
Secondary research helped identify key players in the test and measurement equipment market. Their revenues were determined through a combination of primary and secondary research, analyzed both geographically and by market segment, using financial statements and annual reports. Insights were further enriched through interviews with CEOs, VPs, directors, and marketing executives.
The market shares were estimated using this combined research approach. The data was then consolidated and supplemented with detailed inputs and analysis from MarketsandMarkets and presented in the report.
Market Size Estimation Methodology-Bottom-Up Approach
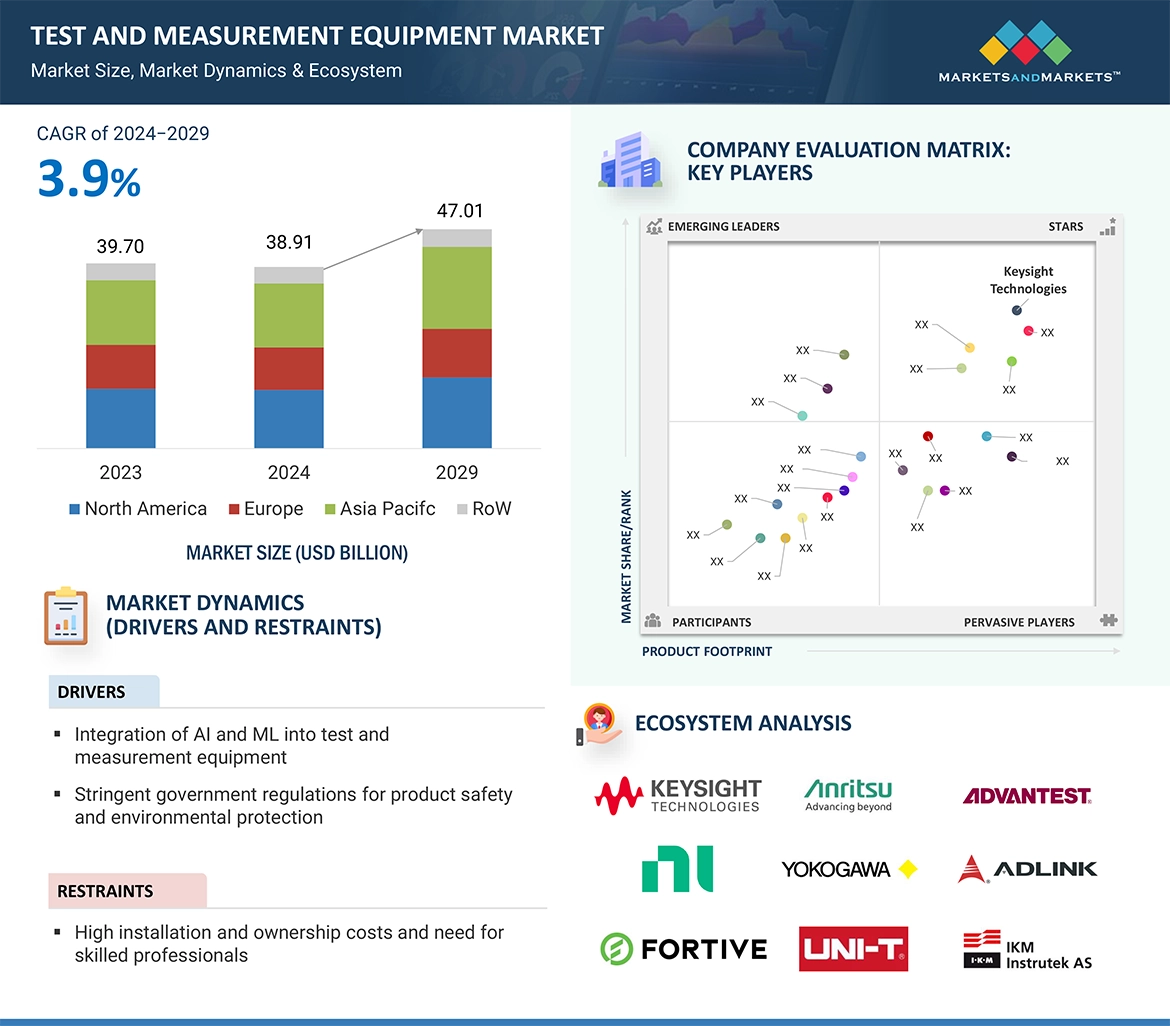
The bottom-up approach was employed to arrive at the overall size of the test and measurement equipment market from the calculations based on the revenues of the key players and their shares in the market. Key players in the market, including Keysight Technologies (US), Fortive (US), AMETEK.Inc. (US), Rohde & Schwarz (Germany), and NATIONAL INSTRUMENTS CORP. (US) were studied. The market size estimations were carried out considering the market size of their test and measurement equipment offerings.

Market Size Estimation Methodology-Top-Down Approach
In the top-down approach, the overall market size was utilized to forecast the size of individual markets, using percentage splits derived from both secondary and primary research. The most relevant parent market size was employed to calculate specific market segments.
The revenue shares calculated earlier in the bottom-up approach were verified by identifying and estimating the market share of each company. This study determined and confirmed the overall parent market size and individual market sizes through data triangulation and validation with primary sources.

Data Triangulation
After determining the overall market size through the estimation process, the total market was divided into various segments and subsegments. To finalize the market engineering process and obtain precise statistics for all segments and subsegments, data triangulation was employed. This involved analyzing various factors and trends from both the demand and supply sides. Additionally, the market was validated using both top-down and bottom-up approaches.
Market Definition
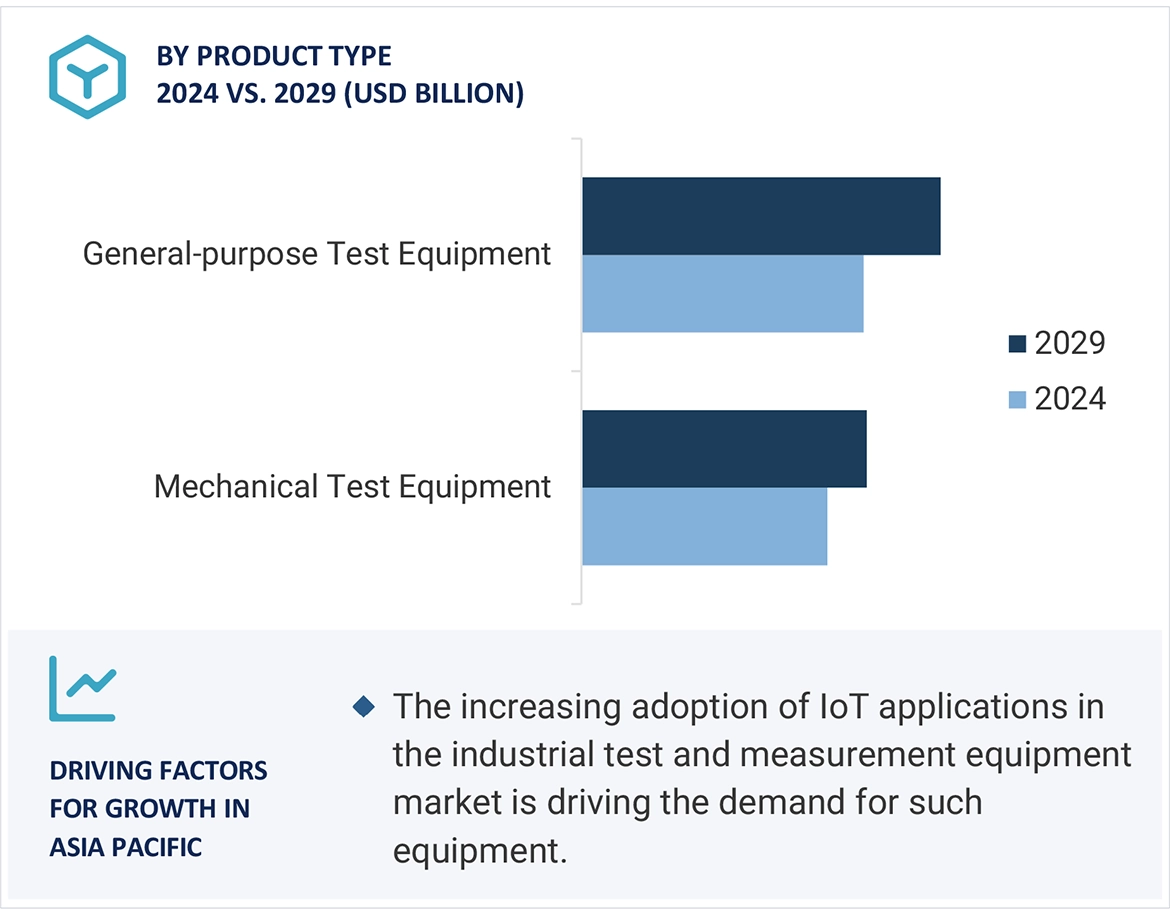
Multiple types of test and measurement instruments are used for testing, evaluating and authenticating measurements in both electronics and mechanical applications. These tools produce stimulus and response information of the DUTs and allow the manufacturer to monitor the success of an operation process. It is helpful here to enhance the quantity, quality and safety of their production in equal measures. Based on the nature and usage the equipment could be classified as General-purpose Test Equipment (GPTE) and Mechanical Test Equipment (MTE). GPTE has oscilloscopes, signal generators, arbitrary waveform generator, digital multimeters, logic analyzers, power meters, power supplies and modular instruments. MTE comprises of non-destructive test equipment, machine vision inspection systems and machine conditioning monitoring systems. Among all the verticals industry, healthcare and IT & telecom are predicted to create a maximum demand for test and measurement equipment throughout the forecast period.
Key Stakeholders
-
Raw Material and Manufacturing Equipment Suppliers
-
Semiconductor Wafer Vendors
-
Fabless Players
-
Foundry Players
-
Original Equipment Manufacturers (OEMs)
-
Original Design Manufacturers (ODMs) And OEM Technology Solution Providers
-
Networking Solutions Providers
-
Distributors and Retailers
-
Research Organizations
-
Technology Standards Organizations, Forums, Alliances, and Associations
-
Technology Investors
-
Software Providers
-
Value-added Resellers (Vars)
The main objectives of this study are as follows:
-
To define, describe, and forecast the test and measurement equipment market by product type, service type, vertical, and region in terms of value.
-
To forecast the market for general-purpose test equipment (GPTE) in terms of volume.
-
To forecast the market for various segments with respect to 4 main regions—North America, Europe, Asia Pacific, and Rest of the World (RoW), in terms of value.
-
To provide detailed information regarding the drivers, restraints, opportunities, and challenges that influence the growth of the market.
-
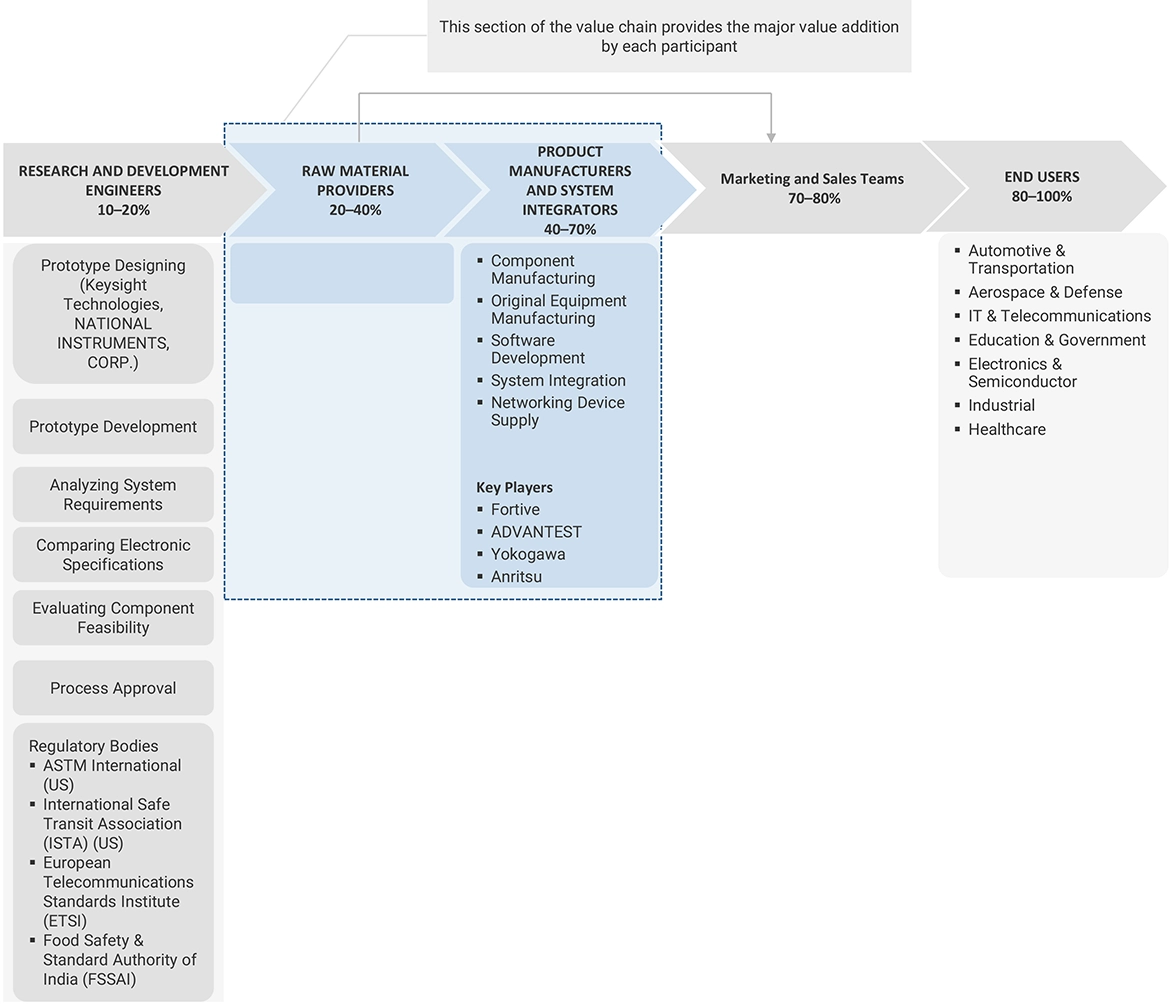
To provide a detailed overview of the test and measurement equipment value chain, along with industry trends, technology trends, use cases, regulatory landscape, and Porter’s five forces.
-
To strategically analyze the micromarkets1 with respect to individual growth trends, prospects, and contributions to the total market.
-
To analyze the opportunities in the market for stakeholders by identifying high-growth segments and detailing the competitive landscape for market players.
-
To strategically profile key players and comprehensively analyze their market rankings and core competencies2.
-
To analyze the competitive developments such as joint ventures, mergers and acquisitions, product launches, and research and development (R&D) carried out by market players
-
To map the competitive intelligence based on company profiles, key player strategies, and game-changing developments, such as product developments, collaborations, and acquisitions
-
To benchmark players within the market using the proprietary Competitive Leadership Mapping framework, which analyzes market players on various parameters within the broad categories of business strategy excellence and strength of product portfolio
Customization Options
With the given market data, MarketsandMarkets offers customizations according to the specific requirements of companies. The following customization options are available for the report:
-
Country-wise Information for Asia Pacific
-
Detailed analysis and profiling of additional market players (up to five)


Growth opportunities and latent adjacency in Test and Measurement Equipment Market