Speaking Valves Market

Report Code MD 9126
Published in Aug, 2024, By MarketsandMarkets™
Download PDF

Choose License Type

Buy Report Now Inquire Before Buying

Speaking Valves Market Size, Share & Trends by Material (Silicone, PVC), Application (Tracheostomy, Laryngectomy), End User (Hospitals, Ambulatory Surgical Centers), and Region - Global Forecast to 2029

Overview

The speaking valves market is expected to generate a revenue of USD 128 million by 2029, with a revenue of USD 94 million in 2024 to register a CAGR of 6.4%. During the forecasted year, the growth of the speaking valves market can be attributed to the increasing number of chronic respiratory diseases like COPD, asthma, and neck injuries, which are leading to a growing number of tracheostomy and laryngectomy surgeries. Other factors include favorable reimbursement scenarios provided by the government and technological advancements in speaking valves, such as reductions in aspiration, ease of use, enhanced swallowing, and the availability of different speaking valves that cater to the individual needs of patients.Emerging countries like India and China are expected to register the highest growth rates due to the rise in the geriatric population needing airway management, including speaking valves. Rising awareness about the use of speaking valves also leads to higher adoption rates. Additionally, the increase in healthcare expenditures in several countries emphasizes increased quality of life and access to healthcare. Constant investments by players in product development and innovation contribute to the overall growth of this market.

Attractive Opportunities in the Speaking Valves Market

ASIA PACIFIC

The Asia Pacific market is expected to register the highest CAGR during the forecast period, primarily due to the increasing healthcare expenditure and rapid expansion of medical infrastructure in Asia Pacific countries.

The market is driven by the increasing number of tracheostomy and laryngectomy procedures and technological advancements.

Emerging markets are expected to offer lucrative growth opportunities for players in the speaking valves market.

Product launches and acquisitions were the most widely adopted growth strategies by market players.

The occurrence of respiratory diseases and disorders has boosted the growth of this market, resulting in the rising demand for speaking valves.

Global Speaking Valves Market Dynamics

Driver: Increase in tracheostomy procedures

The rising number of cases of respiratory disorders, traumatic injuries to the neck, and chronic conditions that require prolonged ventilation, leading to tracheostomies, is a key driver for the expansion of the speaking valves market. With the increasing need for tracheostomy procedures, there is also a greater demand for devices such as speaking valves that improve patient quality of life and enable communication. According to the Global Tracheostomy Collaborative, more than 100,000 individuals in the US annually undergo tracheostomy procedures. Such funding initiatives are expected to support the further growth of the speaking valves market.

Restraint: High cost of tracheostomy procedures

The notable financial costs related to tracheostomy surgeries, comprised of pre-operative assessments, surgical interventions, post-operative management, and continuous provision of equipment and supplies, may discourage patients from opting for tracheostomy procedures. This could affect the expansion of the speaking valves market. For instance, the average cost of a tracheostomy procedure in the US is approximately USD 5,399. These high costs may limit the growth of the speaking valves market.


Opportunity: Opportunities for growth in developing economies

Major players in the speaking valves market could see development prospects from emerging economies, including South Africa, China, Brazil, and India. Emerging countries such as India and Brazil have some of the highest incidence rates of respiratory diseases like COPD, asthma, and bronchitis worldwide. Furthermore, factors contributing to this growth include the growing per capita income, increased investments in healthcare, the expansion of private-sector hospitals to rural areas, low infrastructure and treatment costs, as well as the availability of highly educated physicians. This, in turn, encourages the growth of the speaking valves market and contributes to the expanding use of speaking valves.

Challenge: Lack of awareness in emerging countries

Speaking valves are not widely recognized in emerging economies, which creates a serious problem for the market. Speaking valves are not widely known or used in developing nations despite their huge benefits for aspiration reduction, swallowing, communication, and improved psychological effects. A comprehensive approach is needed to address these issues, such as increasing healthcare workers' education and training about speaking valves, which can improve their awareness of and proficiency in managing patients who may benefit from speaking valves. Because of these barriers, the speaking valves market may find it challenging to grow.

Global Speaking Valves Market Ecosystem Analysis

Speaking Valves Ecosystem/Market Map The ecosystem analysis of the speaking valves market comprises the elements present in this market and defines these elements with a demonstration of the bodies involved. It includes the various types of speaking valves, their material types, and their applications and end users.


The largest share in the speaking valves industry in 2023 was held by the silicone segment, by material.

The speaking valves market is divided into three material categories: silicone, PVC, and other materials. Silicone dominates the market due to its biocompatibility, durability, and resistance to thermal and chemical degradation, making it well-suited for medical devices like speaking valves. Its biocompatibility ensures no allergic reactions or irritation. Silicone not only lasts long but also provides more comfort to patients than any other material. This results in regular repeat purchases from customers, establishing the silicone segment as a reliable and steady revenue source in the speaking valves market.

Tracheostomy segment accounted for the largest share of the speaking valves industry in 2023, by application.

The speaking valves market is categorized into three types based on application: tracheostomy, laryngectomy, and other applications. Tracheostomy holds the largest market share and experiences the highest growth rate in the global speaking valves market. This is due to the increasing number of tracheostomy surgeries performed for conditions such as asthma, COPD, and various other diseases. The rise in tracheostomy procedures has made speaking valves an invaluable device for patients, helping them communicate more easily, swallow more effectively, and reduce aspiration, among other benefits. These factors are driving the growth of this segment.

North America Region Holds the Largest Share of the Speaking Valves Market.

The speaking valves market is divided into five primary regions: North America, Europe, Asia Pacific, Latin America, and the Middle East & Africa. In 2023, North America held the leading position in this market. This is mainly due to the advanced healthcare systems in the US and Canada. The speaking valves market in North America is expected to grow due to factors such as an increasing number of patients in the emergency department, high adoption of speaking valves after laryngectomy and tracheostomy, wide availability of advanced speaking valves, and an increase in the number of chronic respiratory diseases. These factors have significantly contributed to the expansion of the speaking valves market in North America.


Recent Developments of Speaking Valves Market Industry

  • In November 2021, Coloplast acquired Atos Medical. With this acquisition, Coloplast added a new business segment called Voice and Respiratory Care, focusing on patients with tracheostomy and laryngectomy.
  • In October 2021, InHealth Technologies, the maker of Blom-Singer voice restoration and ENT products and a business unit of Freudenberg Medical, announced the commercial launch of the Blom-Singer SpeakFree HME Hands-free Valve created for people who have undergone a total laryngectomy.

Key Market Players

Want to explore hidden markets that can drive new revenue in Speaking Valves Market?

Scope of the Report

Report Attribute Details
Market Revenue in 2024 $94 million
Projected Revenue by 2029 $128 million
Revenue Rate Poised to Grow at a CAGR of 6.4%
Market Driver Increase in tracheostomy procedures
Market Opportunity  


Personalize This Research

  • Triangulate with your Own Data
  • Get Data as per your Format and Definition
  • Gain a Deeper Dive on a Specific Application, Geography, Customer or Competitor
  • Any level of Personalization
Request A Free Customisation

Let Us Help You

  • What are the Known and Unknown Adjacencies Impacting the Speaking Valves Market
  • What will your New Revenue Sources be?
  • Who will be your Top Customer; what will make them switch?
  • Defend your Market Share or Win Competitors
  • Get a Scorecard for Target Partners
Customized Workshop Request

Table of Contents

Exclusive indicates content/data unique to MarketsandMarkets and not available with any competitors.

TITLE
PAGE NO
INTRODUCTION
19
RESEARCH METHODOLOGY
23
EXECUTIVE SUMMARY
34
PREMIUM INSIGHTS
37
MARKET OVERVIEW
40
  • 5.1 INTRODUCTION
  • 5.2 MARKET DYNAMICS
    DRIVERS
    - Increasing number of tracheostomy and laryngectomy procedures
    - Technological advancements
    - Favorable reimbursement scenario
    - Rising patient demand for ICUs and ambulatory care
    RESTRAINTS
    - High cost of tracheostomy procedures
    OPPORTUNITIES
    - Emerging markets
    CHALLENGES
    - Lack of awareness in emerging countries
    - Dearth of skilled surgeons
  • 5.3 PRICING ANALYSIS
    AVERAGE SELLING PRICE OF SPEAKING VALVES, BY REGION
  • 5.4 PATENT ANALYSIS
    LIST OF MAJOR PATENTS
  • 5.5 VALUE CHAIN ANALYSIS
  • 5.6 SUPPLY CHAIN ANALYSIS
  • 5.7 TRADE ANALYSIS
    TRADE ANALYSIS
  • 5.8 ECOSYSTEM ANALYSIS
  • 5.9 PORTER’S FIVE FORCES ANALYSIS
    THREAT OF NEW ENTRANTS
    THREAT OF SUBSTITUTES
    BARGAINING POWER OF BUYERS
    BARGAINING POWER OF SUPPLIERS
    INTENSITY OF COMPETITIVE RIVALRY
  • 5.10 REGULATORY LANDSCAPE
    REGULATORY BODIES, GOVERNMENT AGENCIES, AND OTHER ORGANIZATIONS
    REGULATORY SCENARIO
    - North America
    - Europe
    - Asia Pacific
    - Latin America
    - Middle East
    - Africa
  • 5.11 KEY CONFERENCES & EVENTS IN 2024–2025
  • 5.12 TRENDS/DISRUPTIONS IMPACTING CUSTOMERS’ BUSINESSES
    REVENUE SHIFT AND REVENUE POCKETS FOR SPEAKING VALVE MANUFACTURERS
  • 5.13 KEY STAKEHOLDERS & BUYING CRITERIA
    KEY STAKEHOLDERS IN BUYING PROCESS
    BUYING CRITERIA
  • 5.14 INVESTMENT & FUNDING SCENARIO
  • 5.15 CASE STUDY ANALYSIS
    CASE STUDY: SPEAKING VALVE IMPROVES QUALITY OF LIFE FOR TRACHEOSTOMY PATIENT
  • 5.16 IMPACT OF ARTIFICIAL INTELLIGENCE ON SPEAKING VALVES MARKET
SPEAKING VALVES MARKET, BY MATERIAL
65
  • 6.1 INTRODUCTION
  • 6.2 SILICONE
    BIOCOMPATIBLE ADVANTAGE OF SILICONE FOR IMPROVED SPEAKING VALVE PERFORMANCE TO BOOST MARKET GROWTH
  • 6.3 PVC
    LOW COST OF PVC TO SUPPORT MARKET ADOPTION
  • 6.4 OTHER MATERIALS
SPEAKING VALVES MARKET, BY APPLICATION
74
  • 7.1 INTRODUCTION
  • 7.2 TRACHEOSTOMY
    INCREASING NUMBER OF TRACHEOSTOMY PROCEDURES PERFORMED TO DRIVE MARKET GROWTH
  • 7.3 LARYNGECTOMY
    GROWING ROLE OF SPEAKING VALVES IN LARYNGECTOMY RECOVERY TO SUPPORT GROWTH
  • 7.4 OTHER APPLICATIONS
SPEAKING VALVES MARKET, BY END USER
83
  • 8.1 INTRODUCTION
  • 8.2 HOSPITALS
    GROWING NUMBER OF HOSPITALS WORLDWIDE TO BOOST GROWTH
  • 8.3 AMBULATORY SURGICAL CENTERS
    COST-EFFECTIVENESS OF AMBULATORY SURGICAL CENTERS COMPARED TO HOSPITAL SETTINGS TO FAVOR GROWTH
  • 8.4 OTHER END USERS
SPEAKING VALVES MARKET, BY REGION
92
  • 9.1 INTRODUCTION
  • 9.2 NORTH AMERICA
    MACROECONOMIC OUTLOOK FOR NORTH AMERICA
    US
    - US to dominate market in North America during forecast period
    CANADA
    - Favorable government investments to augment market growth
  • 9.3 EUROPE
    MACROECONOMIC OUTLOOK FOR EUROPE
    GERMANY
    - Germany to command largest share of speaking valves market in Europe
    UK
    - Increasing government initiatives and support to aid market
    FRANCE
    - Favorable health insurance system to drive market growth
    ITALY
    - Well-established healthcare infrastructure to support market
    SPAIN
    - Increasing incidence of COPD to fuel market growth
    REST OF EUROPE
  • 9.4 ASIA PACIFIC
    MACROECONOMIC OUTLOOK FOR ASIA PACIFIC
    CHINA
    - Large patient population and healthcare infrastructure improvements to drive market growth in China
    JAPAN
    - Favorable reimbursement policies and supportive regulatory environment to aid market
    INDIA
    - Availability of skilled personnel and low treatment costs to favor market growth
    REST OF ASIA PACIFIC
  • 9.5 LATIN AMERICA
    INCREASING GERIATRIC POPULATION TO PROPEL MARKET
    MACROECONOMIC OUTLOOK FOR LATIN AMERICA
  • 9.6 MIDDLE EAST & AFRICA
    INFRASTRUCTURAL IMPROVEMENTS TO CONTRIBUTE TO MARKET GROWTH
    MACROECONOMIC OUTLOOK FOR MIDDLE EAST & AFRICA
COMPETITIVE LANDSCAPE
128
  • 10.1 INTRODUCTION
  • 10.2 KEY PLAYER STRATEGY/RIGHT TO WIN
    OVERVIEW OF STRATEGIES ADOPTED BY PLAYERS IN SPEAKING VALVES MARKET
  • 10.3 REVENUE ANALYSIS
  • 10.4 MARKET SHARE ANALYSIS
  • 10.5 COMPANY EVALUATION MATRIX: KEY PLAYERS, 2023
    STARS
    EMERGING LEADERS
    PERVASIVE PLAYERS
    PARTICIPANTS
    COMPANY FOOTPRINT: KEY PLAYERS, 2023
    - Company footprint
    - Material footprint
    - Application footprint
    - Region footprint
  • 10.6 COMPANY EVALUATION MATRIX: STARTUPS/SMES, 2023
    PROGRESSIVE COMPANIES
    RESPONSIVE COMPANIES
    DYNAMIC COMPANIES
    STARTING BLOCKS
    COMPETITIVE BENCHMARKING: STARTUP/SME PLAYERS, 2023
  • 10.7 COMPANY VALUATION & FINANCIAL METRICS
  • 10.8 BRAND/PRODUCT COMPARISON
    MEDTRONIC
    PASSY-MUIR, INC.
    FREUDENBERG GROUP
  • 10.9 COMPETITIVE SCENARIO
    PRODUCT LAUNCHES
    DEALS
COMPANY PROFILES
142
  • 11.1 KEY PLAYERS
    COLOPLAST A/S
    - Business overview
    - Products offered
    - Recent developments
    - MnM view
    FREUDENBERG GROUP
    - Business overview
    - Products offered
    - Recent developments
    - MnM view
    PASSY-MUIR, INC.
    - Business overview
    - Products offered
    - MnM view
    PRIMED HALBERSTADT MEDIZINTECHNIK GMBH
    - Business overview
    - Products offered
    MEDTRONIC
    - Business overview
    - Products offered
    TELEFLEX INCORPORATED
    - Business overview
    - Products offered
    ANDREAS FAHL MEDIZINTECHNIK-VERTRIEB GMBH
    - Business overview
    - Products offered
    BOSTON MEDICAL PRODUCTS INC.
    - Business overview
    - Products offered
    PEPPER MEDICAL
    - Business overview
    - Products offered
    PARBURCH MEDICAL DEVELOPMENTS LTD.
    - Business overview
    - Products offered
  • 11.2 OTHER PLAYERS
    THE AIRWAY COMPANY
    BESMED HEALTH BUSINESS CORP.
    PRUNUS MEDICAL
    MEDNOM
    INSIGHT MEDICAL PRODUCTS LTD.
    E. BENSON HOOD LABORATORIES, INC.
    ASHTON INDIA PRIVATE LIMITED
APPENDIX
166
  • 12.1 DISCUSSION GUIDE
  • 12.2 KNOWLEDGESTORE: MARKETSANDMARKETS’ SUBSCRIPTION PORTAL
  • 12.3 CUSTOMIZATION OPTIONS
  • 12.4 RELATED REPORTS
  • 12.5 AUTHOR DETAILS
LIST OF TABLES
 
  • TABLE 1 AVERAGE SELLING PRICE OF SPEAKING VALVES, BY PRODUCT, 2022–2024
  • TABLE 2 AVERAGE SELLING PRICE OF SPEAKING VALVES, BY COUNTRY (2024)
  • TABLE 3 IMPORT DATA FOR INSTRUMENTS AND APPLIANCES USED IN MEDICAL, SURGICAL, DENTAL, OR VETERINARY SCIENCES, BY COUNTRY, 2019–2023 (USD MILLION)
  • TABLE 4 EXPORT DATA FOR INSTRUMENTS AND APPLIANCES USED IN MEDICAL, SURGICAL, DENTAL, OR VETERINARY SCIENCES, BY COUNTRY, 2019–2023 (USD MILLION)
  • TABLE 5 SPEAKING VALVES MARKET: ROLE IN ECOSYSTEM
  • TABLE 6 SPEAKING VALVES MARKET: PORTER’S FIVE FORCES ANALYSIS
  • TABLE 9 ASIA PACIFIC: REGULATORY BODIES, GOVERNMENT AGENCIES, AND OTHER ORGANIZATIONS
  • TABLE 12 JAPAN: TIME, COST, AND COMPLEXITY OF REGISTRATION PROCESS
  • TABLE 13 SPEAKING VALVES MARKET: DETAILED LIST OF CONFERENCES & EVENTS
  • TABLE 14 INFLUENCE OF STAKEHOLDERS ON BUYING PROCESS OF SPEAKING VALVES
  • TABLE 15 KEY BUYING CRITERIA FOR SPEAKING VALVES
  • TABLE 16 SPEAKING VALVES MARKET, BY MATERIAL, 2022–2029 (USD MILLION)
  • TABLE 17 SILICONE-BASED SPEAKING VALVES AVAILABLE IN MARKET
  • TABLE 18 SILICONE SPEAKING VALVES MARKET, BY REGION, 2022–2029 (USD MILLION)
  • TABLE 19 NORTH AMERICA: SILICONE SPEAKING VALVES MARKET, BY COUNTRY, 2022–2029 (USD MILLION)
  • TABLE 20 EUROPE: SILICONE SPEAKING VALVES MARKET, BY COUNTRY, 2022–2029 (USD MILLION)
  • TABLE 21 ASIA PACIFIC: SILICONE SPEAKING VALVES MARKET, BY COUNTRY, 2022–2029 (USD MILLION)
  • TABLE 22 PVC-BASED SPEAKING VALVES AVAILABLE IN MARKET
  • TABLE 23 PVC SPEAKING VALVES MARKET, BY REGION, 2022–2029 (USD MILLION)
  • TABLE 24 NORTH AMERICA: PVC SPEAKING VALVES MARKET, BY COUNTRY, 2022–2029 (USD MILLION)
  • TABLE 25 EUROPE: PVC SPEAKING VALVES MARKET, BY COUNTRY, 2022–2029 (USD MILLION)
  • TABLE 26 ASIA PACIFIC: PVC SPEAKING VALVES MARKET, BY COUNTRY, 2022–2029 (USD MILLION)
  • TABLE 27 OTHER SPEAKING VALVE MATERIALS AVAILABLE IN MARKET
  • TABLE 28 OTHER SPEAKING VALVE MATERIALS MARKET, BY REGION, 2022–2029 (USD MILLION)
  • TABLE 29 NORTH AMERICA: OTHER SPEAKING VALVE MATERIALS MARKET, BY COUNTRY, 2022–2029 (USD MILLION)
  • TABLE 30 EUROPE: OTHER SPEAKING VALVE MATERIALS MARKET, BY COUNTRY, 2022–2029 (USD MILLION)
  • TABLE 31 ASIA PACIFIC: OTHER SPEAKING VALVE MATERIALS MARKET, BY COUNTRY, 2022–2029 (USD MILLION)
  • TABLE 32 SPEAKING VALVES MARKET, BY APPLICATION, 2022–2029 (USD MILLION)
  • TABLE 33 SPEAKING VALVES MARKET, BY APPLICATION, 2022–2029 (MILLION UNITS)
  • TABLE 34 SPEAKING VALVES MARKET FOR TRACHEOSTOMY APPLICATIONS, BY REGION, 2022–2029 (USD MILLION)
  • TABLE 35 NORTH AMERICA: SPEAKING VALVES MARKET FOR TRACHEOSTOMY APPLICATIONS, BY COUNTRY, 2022–2029 (USD MILLION)
  • TABLE 36 EUROPE: SPEAKING VALVES MARKET FOR TRACHEOSTOMY APPLICATIONS, BY COUNTRY, 2022–2029 (USD MILLION)
  • TABLE 37 ASIA PACIFIC: SPEAKING VALVES MARKET FOR TRACHEOSTOMY APPLICATIONS, BY COUNTRY, 2022–2029 (USD MILLION)
  • TABLE 38 SPEAKING VALVES MARKET FOR LARYNGECTOMY APPLICATIONS, BY REGION, 2022–2029 (USD MILLION)
  • TABLE 39 NORTH AMERICA: SPEAKING VALVES MARKET FOR LARYNGECTOMY APPLICATIONS, BY COUNTRY, 2022–2029 (USD MILLION)
  • TABLE 40 EUROPE: SPEAKING VALVES MARKET FOR LARYNGECTOMY APPLICATIONS, BY COUNTRY, 2022–2029 (USD MILLION)
  • TABLE 41 ASIA PACIFIC: SPEAKING VALVES MARKET FOR LARYNGECTOMY APPLICATIONS, BY COUNTRY, 2022–2029 (USD MILLION)
  • TABLE 42 SPEAKING VALVES MARKET FOR OTHER APPLICATIONS, BY REGION, 2022–2029 (USD MILLION)
  • TABLE 43 NORTH AMERICA: SPEAKING VALVES MARKET FOR OTHER APPLICATIONS, BY COUNTRY, 2022–2029 (USD MILLION)
  • TABLE 44 EUROPE: SPEAKING VALVES MARKET FOR OTHER APPLICATIONS, BY COUNTRY, 2022–2029 (USD MILLION)
  • TABLE 45 ASIA PACIFIC: SPEAKING VALVES MARKET FOR OTHER APPLICATIONS, BY COUNTRY, 2022–2029 (USD MILLION)
  • TABLE 46 SPEAKING VALVES MARKET, BY END USER, 2022–2029 (USD MILLION)
  • TABLE 47 SPEAKING VALVES MARKET FOR HOSPITALS, BY REGION, 2022–2029 (USD MILLION)
  • TABLE 48 NORTH AMERICA: SPEAKING VALVES MARKET FOR HOSPITALS, BY COUNTRY, 2022–2029 (USD MILLION)
  • TABLE 49 EUROPE: SPEAKING VALVES MARKET FOR HOSPITALS, BY COUNTRY, 2022–2029 (USD MILLION)
  • TABLE 50 ASIA PACIFIC: SPEAKING VALVES MARKET FOR HOSPITALS, BY COUNTRY, 2022–2029 (USD MILLION)
  • TABLE 51 SPEAKING VALVES MARKET FOR AMBULATORY SURGICAL CENTERS, BY REGION, 2022–2029 (USD MILLION)
  • TABLE 52 NORTH AMERICA: SPEAKING VALVES MARKET FOR AMBULATORY SURGICAL CENTERS, BY COUNTRY, 2022–2029 (USD MILLION)
  • TABLE 53 EUROPE: SPEAKING VALVES MARKET FOR AMBULATORY SURGICAL CENTERS, BY COUNTRY, 2022–2029 (USD MILLION)
  • TABLE 54 ASIA PACIFIC: SPEAKING VALVES MARKET FOR AMBULATORY SURGICAL CENTERS, BY COUNTRY, 2022–2029 (USD MILLION)
  • TABLE 55 SPEAKING VALVES MARKET FOR OTHER END USERS, BY REGION, 2022–2029 (USD MILLION)
  • TABLE 56 NORTH AMERICA: SPEAKING VALVES MARKET FOR OTHER END USERS, BY COUNTRY, 2022–2029 (USD MILLION)
  • TABLE 57 EUROPE: SPEAKING VALVES MARKET FOR OTHER END USERS, BY COUNTRY, 2022–2029 (USD MILLION)
  • TABLE 58 ASIA PACIFIC: SPEAKING VALVES MARKET FOR OTHER END USERS, BY COUNTRY, 2022–2029 (USD MILLION)
  • TABLE 59 SPEAKING VALVES MARKET, BY REGION, 2022–2029 (USD MILLION)
  • TABLE 60 NORTH AMERICA: SPEAKING VALVES MARKET, BY COUNTRY, 2022–2029 (USD MILLION)
  • TABLE 61 NORTH AMERICA: SPEAKING VALVES MARKET, BY MATERIAL, 2022–2029 (USD MILLION)
  • TABLE 62 NORTH AMERICA: SPEAKING VALVES MARKET, BY APPLICATION, 2022–2029 (USD MILLION)
  • TABLE 63 NORTH AMERICA: SPEAKING VALVES MARKET, BY END USER, 2022–2029 (USD MILLION)
  • TABLE 64 US: SPEAKING VALVES MARKET, BY MATERIAL, 2022–2029 (USD MILLION)
  • TABLE 65 US: SPEAKING VALVES MARKET, BY APPLICATION, 2022–2029 (USD MILLION)
  • TABLE 66 US: SPEAKING VALVES MARKET, BY END USER, 2022–2029 (USD MILLION)
  • TABLE 67 CANADA: SPEAKING VALVES MARKET, BY MATERIAL, 2022–2029 (USD MILLION)
  • TABLE 68 CANADA: SPEAKING VALVES MARKET, BY APPLICATION, 2022–2029 (USD MILLION)
  • TABLE 69 CANADA: SPEAKING VALVES MARKET, BY END USER, 2022–2029 (USD MILLION)
  • TABLE 70 EUROPE: SPEAKING VALVES MARKET, BY COUNTRY, 2022–2029 (USD MILLION)
  • TABLE 71 EUROPE: SPEAKING VALVES MARKET, BY MATERIAL, 2022–2029 (USD MILLION)
  • TABLE 72 EUROPE: SPEAKING VALVES MARKET, BY APPLICATION, 2022–2029 (USD MILLION)
  • TABLE 73 EUROPE: SPEAKING VALVES MARKET, BY END USER, 2022–2029 (USD MILLION)
  • TABLE 74 GERMANY: SPEAKING VALVES MARKET, BY MATERIAL, 2022–2029 (USD MILLION)
  • TABLE 75 GERMANY: SPEAKING VALVES MARKET, BY APPLICATION, 2022–2029 (USD MILLION)
  • TABLE 76 GERMANY: SPEAKING VALVES MARKET, BY END USER, 2022–2029 (USD MILLION)
  • TABLE 77 UK: SPEAKING VALVES MARKET, BY MATERIAL, 2022–2029 (USD MILLION)
  • TABLE 78 UK: SPEAKING VALVES MARKET, BY APPLICATION, 2022–2029 (USD MILLION)
  • TABLE 79 UK: SPEAKING VALVES MARKET, BY END USER, 2022–2029 (USD MILLION)
  • TABLE 80 FRANCE: SPEAKING VALVES MARKET, BY MATERIAL, 2022–2029 (USD MILLION)
  • TABLE 81 FRANCE: SPEAKING VALVES MARKET, BY APPLICATION, 2022–2029 (USD MILLION)
  • TABLE 82 FRANCE: SPEAKING VALVES MARKET, BY END USER, 2022–2029 (USD MILLION)
  • TABLE 83 ITALY: SPEAKING VALVES MARKET, BY MATERIAL, 2022–2029 (USD MILLION)
  • TABLE 84 ITALY: SPEAKING VALVES MARKET, BY APPLICATION, 2022–2029 (USD MILLION)
  • TABLE 85 ITALY: SPEAKING VALVES MARKET, BY END USER, 2022–2029 (USD MILLION)
  • TABLE 86 SPAIN: SPEAKING VALVES MARKET, BY MATERIAL, 2022–2029 (USD MILLION)
  • TABLE 87 SPAIN: SPEAKING VALVES MARKET, BY APPLICATION, 2022–2029 (USD MILLION)
  • TABLE 88 SPAIN: SPEAKING VALVES MARKET, BY END USER, 2022–2029 (USD MILLION)
  • TABLE 89 REST OF EUROPE: SPEAKING VALVES MARKET, BY MATERIAL, 2022–2029 (USD MILLION)
  • TABLE 90 REST OF EUROPE: SPEAKING VALVES MARKET, BY APPLICATION, 2022–2029 (USD MILLION)
  • TABLE 91 REST OF EUROPE: SPEAKING VALVES MARKET, BY END USER, 2022–2029 (USD MILLION)
  • TABLE 92 ASIA PACIFIC: SPEAKING VALVES MARKET, BY COUNTRY, 2022–2029 (USD MILLION)
  • TABLE 93 ASIA PACIFIC: SPEAKING VALVES MARKET, BY MATERIAL, 2022–2029 (USD MILLION)
  • TABLE 94 ASIA PACIFIC: SPEAKING VALVES MARKET, BY APPLICATION, 2022–2029 (USD MILLION)
  • TABLE 95 ASIA PACIFIC: SPEAKING VALVES MARKET, BY END USER, 2022–2029 (USD MILLION)
  • TABLE 96 CHINA: SPEAKING VALVES MARKET, BY MATERIAL, 2022–2029 (USD MILLION)
  • TABLE 97 CHINA: SPEAKING VALVES MARKET, BY APPLICATION, 2022–2029 (USD MILLION)
  • TABLE 98 CHINA: SPEAKING VALVES MARKET, BY END USER, 2022–2029 (USD MILLION)
  • TABLE 99 JAPAN: SPEAKING VALVES MARKET, BY MATERIAL, 2022–2029 (USD MILLION)
  • TABLE 100 JAPAN: SPEAKING VALVES MARKET, BY APPLICATION, 2022–2029 (USD MILLION)
  • TABLE 101 JAPAN: SPEAKING VALVES MARKET, BY END USER, 2022–2029 (USD MILLION)
  • TABLE 102 INDIA: SPEAKING VALVES MARKET, BY MATERIAL, 2022–2029 (USD MILLION)
  • TABLE 103 INDIA: SPEAKING VALVES MARKET, BY APPLICATION, 2022–2029 (USD MILLION)
  • TABLE 104 INDIA: SPEAKING VALVES MARKET, BY END USER, 2022–2029 (USD MILLION)
  • TABLE 105 REST OF ASIA PACIFIC: SPEAKING VALVES MARKET, BY MATERIAL, 2022–2029 (USD MILLION)
  • TABLE 106 REST OF ASIA PACIFIC: SPEAKING VALVES MARKET, BY APPLICATION, 2022–2029 (USD MILLION)
  • TABLE 107 REST OF ASIA PACIFIC: SPEAKING VALVES MARKET, BY END USER, 2022–2029 (USD MILLION)
  • TABLE 108 LATIN AMERICA: SPEAKING VALVES MARKET, BY MATERIAL, 2022–2029 (USD MILLION)
  • TABLE 109 LATIN AMERICA: SPEAKING VALVES MARKET, BY APPLICATION, 2022–2029 (USD MILLION)
  • TABLE 110 LATIN AMERICA: SPEAKING VALVES MARKET, BY END USER, 2022–2029 (USD MILLION)
  • TABLE 111 MIDDLE EAST & AFRICA: SPEAKING VALVES MARKET, BY MATERIAL, 2022–2029 (USD MILLION)
  • TABLE 112 MIDDLE EAST & AFRICA: SPEAKING VALVES MARKET, BY APPLICATION, 2022–2029 (USD MILLION)
  • TABLE 113 MIDDLE EAST & AFRICA: SPEAKING VALVES MARKET, BY END USER, 2022–2029 (USD MILLION)
  • TABLE 114 OVERVIEW OF STRATEGIES DEPLOYED BY KEY MANUFACTURING COMPANIES
  • TABLE 115 SPEAKING VALVES MARKET: DEGREE OF COMPETITION
  • TABLE 116 SPEAKING VALVES MARKET: MATERIAL FOOTPRINT
  • TABLE 117 SPEAKING VALVES MARKET: APPLICATION FOOTPRINT
  • TABLE 118 SPEAKING VALVES MARKET: REGION FOOTPRINT
  • TABLE 119 SPEAKING VALVES MARKET: DETAILED LIST OF KEY STARTUPS/SME PLAYERS
  • TABLE 120 SPEAKING VALVES MARKET: COMPETITIVE BENCHMARKING OF STARTUP/SME PLAYERS
  • TABLE 121 SPEAKING VALVES MARKET: PRODUCT LAUNCHES, JANUARY 2021–MAY 2024
  • TABLE 122 SPEAKING VALVES MARKET: DEALS, JANUARY 2021– MAY 2024
  • TABLE 123 COLOPLAST A/S: COMPANY OVERVIEW
  • TABLE 124 COLOPLAST A/S: PRODUCTS OFFERED
  • TABLE 125 COLOPLAST A/S: DEALS, JANUARY 2021–JULY 2024
  • TABLE 126 FREUDENBERG GROUP: COMPANY OVERVIEW
  • TABLE 127 FREUDENBERG GROUP: PRODUCTS OFFERED
  • TABLE 128 FREUDENBERG GROUP: PRODUCT LAUNCHES, JANUARY 2021–MARCH 2024
  • TABLE 129 PASSY-MUIR, INC.: COMPANY OVERVIEW
  • TABLE 130 PASSY-MUIR INC.: PRODUCTS OFFERED
  • TABLE 131 PRIMED HALBERSTADT MEDIZINTECHNIK GMBH: COMPANY OVERVIEW
  • TABLE 132 PRIMED HALBERSTADT MEDIZINTECHNIK GMBH: PRODUCTS OFFERED
  • TABLE 133 MEDTRONIC: COMPANY OVERVIEW
  • TABLE 134 MEDTRONIC: PRODUCTS OFFERED
  • TABLE 135 TELEFLEX INCORPORATED: COMPANY OVERVIEW
  • TABLE 136 TELEFLEX INCORPORATED: PRODUCTS OFFERED
  • TABLE 137 ANDREAS FAHL MEDIZINTECHNIK-VERTRIEB GMBH: COMPANY OVERVIEW
  • TABLE 138 ANDREAS FAHL MEDIZINTECHNIK-VERTRIEB GMBH: PRODUCTS OFFERED
  • TABLE 139 BOSTON MEDICAL PRODUCTS INC.: COMPANY OVERVIEW
  • TABLE 140 BOSTON MEDICAL PRODUCTS INC.: PRODUCTS OFFERED
  • TABLE 141 PEPPER MEDICAL: COMPANY OVERVIEW
  • TABLE 142 PEPPER MEDICAL: PRODUCTS OFFERED
  • TABLE 143 PARBURCH MEDICAL DEVELOPMENTS LTD.: COMPANY OVERVIEW
  • TABLE 144 PARBURCH MEDICAL DEVELOPMENTS LTD.: PRODUCTS OFFERED
LIST OF FIGURES
 
  • FIGURE 1 SPEAKING VALVES MARKET SEGMENTATION
  • FIGURE 2 SPEAKING VALVES MARKET: RESEARCH DESIGN METHODOLOGY
  • FIGURE 3 BREAKDOWN OF PRIMARY INTERVIEWS: SUPPLY-SIDE AND DEMAND-SIDE PARTICIPANTS
  • FIGURE 4 BREAKDOWN OF PRIMARY INTERVIEWS: BY COMPANY TYPE, DESIGNATION, AND REGION
  • FIGURE 5 BOTTOM-UP APPROACH: COMPANY REVENUE ESTIMATION APPROACH
  • FIGURE 6 CAGR PROJECTIONS: SUPPLY-SIDE ANALYSIS
  • FIGURE 7 SPEAKING VALVES MARKET: TOP-DOWN APPROACH
  • FIGURE 8 DATA TRIANGULATION METHODOLOGY
  • FIGURE 9 SPEAKING VALVES MARKET, BY MATERIAL, 2024 VS. 2029 (USD MILLION)
  • FIGURE 10 SPEAKING VALVES MARKET, BY APPLICATION, 2024 VS. 2029 (USD MILLION)
  • FIGURE 11 SPEAKING VALVES MARKET, BY END USER, 2024 VS. 2029 (USD MILLION)
  • FIGURE 12 SPEAKING VALVES MARKET: GEOGRAPHIC SNAPSHOT
  • FIGURE 13 INCREASING NUMBER OF TRACHEOSTOMY PROCEDURES TO DRIVE MARKET GROWTH DURING FORECAST PERIOD
  • FIGURE 14 SILICONE SEGMENT TO HOLD LARGER SHARE OF MARKET IN 2029
  • FIGURE 15 TRACHEOSTOMY SEGMENT TO LEAD MARKET DURING FORECAST PERIOD
  • FIGURE 16 HOSPITALS SEGMENT TO DOMINATE MARKET IN 2029
  • FIGURE 17 ASIA PACIFIC TO REGISTER HIGHEST GROWTH RATE IN MARKET DURING FORECAST PERIOD
  • FIGURE 18 SPEAKING VALVES MARKET: DRIVERS, RESTRAINTS, OPPORTUNITIES, AND CHALLENGES
  • FIGURE 19 PATENT ANALYSIS FOR SPEAKING VALVES MARKET, JANUARY 2013–DECEMBER 2023
  • FIGURE 20 VALUE CHAIN ANALYSIS: MAJOR VALUE ADDED DURING MANUFACTURING AND ASSEMBLY PHASES
  • FIGURE 21 SPEAKING VALVES MARKET: SUPPLY CHAIN ANALYSIS
  • FIGURE 22 SPEAKING VALVES MARKET: ECOSYSTEM ANALYSIS
  • FIGURE 23 SPEAKING VALVES MARKET: PORTER’S FIVE FORCES ANALYSIS
  • FIGURE 24 REVENUE SHIFT IN SPEAKING VALVES MARKET
  • FIGURE 25 INFLUENCE OF STAKEHOLDERS ON BUYING PROCESS FOR TOP THREE END USERS
  • FIGURE 26 KEY BUYING CRITERIA FOR SPEAKING VALVES
  • FIGURE 27 SPEAKING VALVES MARKET: INVESTMENT & FUNDING SCENARIO
  • FIGURE 28 NORTH AMERICA: SPEAKING VALVES MARKET SNAPSHOT
  • FIGURE 29 US: LARYNX CANCER INCIDENCE, 2022 VS. 2025 VS. 2030
  • FIGURE 30 CANADA: LARYNX CANCER INCIDENCE, 2022 VS. 2025 VS. 2030
  • FIGURE 31 GERMANY: LARYNX CANCER INCIDENCE, 2022 VS. 2025 VS. 2030
  • FIGURE 32 UK: LARYNX CANCER INCIDENCE, 2022 VS. 2025 VS. 2030
  • FIGURE 33 FRANCE: LARYNX CANCER INCIDENCE, 2022 VS. 2025 VS. 2030
  • FIGURE 34 ITALY: LARYNX CANCER INCIDENCE, 2022 VS. 2025 VS. 2030
  • FIGURE 35 SPAIN: LARYNX CANCER INCIDENCE, 2022 VS. 2025 VS. 2030
  • FIGURE 36 ASIA PACIFIC: SPEAKING VALVES MARKET SNAPSHOT
  • FIGURE 37 CHINA: LARYNX CANCER INCIDENCE, 2022 VS. 2025 VS. 2030
  • FIGURE 38 JAPAN: LARYNX CANCER INCIDENCE, 2022 VS. 2025 VS. 2030
  • FIGURE 39 INDIA: LARYNX CANCER INCIDENCE, 2022 VS. 2025 VS. 2030
  • FIGURE 40 REVENUE ANALYSIS OF KEY PLAYERS IN SPEAKING VALVES MARKET (2021–2023)
  • FIGURE 41 MARKET SHARE ANALYSIS OF KEY PLAYERS IN SPEAKING VALVES MARKET (2023)
  • FIGURE 42 SPEAKING VALVES MARKET: COMPANY EVALUATION MATRIX (KEY PLAYERS), 2023
  • FIGURE 43 SPEAKING VALVES MARKET: COMPANY FOOTPRINT
  • FIGURE 44 SPEAKING VALVES MARKET: COMPANY EVALUATION MATRIX (STARTUPS/SMES), 2023
  • FIGURE 45 EV/EBITDA OF KEY VENDORS
  • FIGURE 46 YEAR-TO-DATE (YTD) PRICE TOTAL RETURN AND 5-YEAR STOCK BETA OF KEY VENDORS
  • FIGURE 47 BRAND COMPARISON OF SPEAKING VALVES
  • FIGURE 48 COLOPLAST A/S: COMPANY SNAPSHOT (2023)
  • FIGURE 49 MEDTRONIC: COMPANY SNAPSHOT (2023)
  • FIGURE 50 TELEFLEX INCORPORATED: COMPANY SNAPSHOT (2023)

The objective of the study is to analyze the key market dynamics, such as drivers, opportunities, restraints, challenges, and key player strategies. To track company developments such as acquisitions, product launches, expansions, agreements, and partnerships of the leading players, the competitive landscape of the Speaking Valves Market to analyze market players on various parameters within the broad categories of business and product strategy. Top-down and bottom-up approaches were used to estimate the market size. To estimate the market size of segments and subsegments, the market breakdown and data triangulation were used.

The four steps involved in estimating the market size are

Secondary Research

In the secondary research process, various secondary sources such as annual reports, press releases & investor presentations of companies, white papers, certified publications, articles by recognized authors, gold-standard & silver-standard websites, regulatory bodies, and databases (such as D&B Hoovers, Bloomberg Business, and Factiva) were referred to identify and collect information for this study.

Primary Research

In the primary research process, various sources from both the supply and demand sides were interviewed to obtain qualitative and quantitative information for this report. Primary sources were mainly industry experts from the core and related industries and preferred suppliers, manufacturers, distributors, service providers, technology developers, researchers, and organizations related to all segments of this industry’s value chain. In-depth interviews were conducted with various primary respondents, including key industry participants, subject-matter experts, C-level executives of key market players, and industry consultants, to obtain and verify critical qualitative and quantitative information as well as assess prospects.

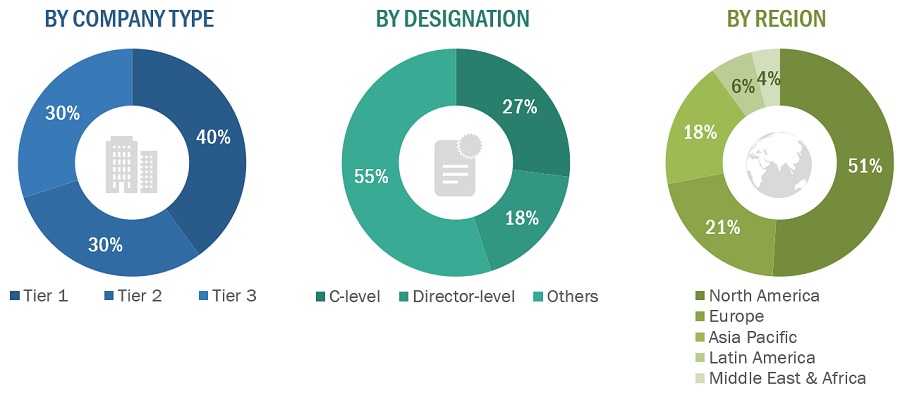
The following is a breakdown of the primary respondents:

Breakdown of Primary Participants:
Speaking Valves Market Size, and Share

Note 1: Others include sales managers, marketing managers, and product managers.

Note 2: Companies are classified into tiers based on their total revenues. As of 2022/2023, Tier 1 = >USD 100 million, Tier 2 = USD 10 million to USD 100 million, and Tier 3 = <USD 10 million.

To know about the assumptions considered for the study, download the pdf brochure

COMPANY NAME

DESIGNATION

Innaumation Medical Devices Pvt. Ltd

Consultant

Primed Halberstadt Medizintechnik

Global Business Development Manager

Market Size Estimation

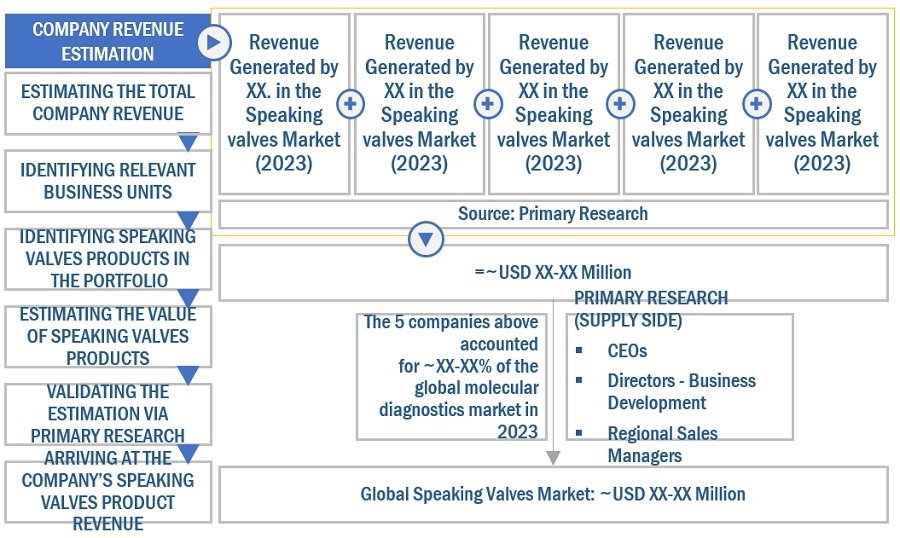
Both top-down and bottom-up approaches were used to estimate and validate the speaking valves market's total size. These methods were also used extensively to estimate the size of various subsegments in the market. The research methodology used to estimate the market size includes the following:

  • The key players in the industry have been identified through extensive secondary research
  • The revenues generated by leading players operating in the speaking valves market have been determined through primary and secondary research.
  • All percentage shares, splits, and breakdowns have been determined using secondary sources and verified through primary sources.

Global Speaking Valves Market Size: Bottom-Up Approach
Speaking Valves Market Size, and Share

To know about the assumptions considered for the study, Request for Free Sample Report

Global Speaking Valves Market Size: Top-Down Approach

Speaking Valves Market Size, and Share

Data Triangulation

After arriving at the overall market size by applying the process mentioned above, the total market was split into several segments and subsegments. To complete the overall market engineering process and arrive at the exact statistics for all segments and subsegments, data triangulation and market breakdown procedures were employed, wherever applicable. The data was triangulated by studying various factors and trends from both the demand and supply sides.

Market Definition

A speaking valve is a medical device designed to be attached to a tracheostomy tube. It allows inhaling through the valve and closes when exhaling, enabling airflow through the larynx, mouth, and nose. A speaking valve can help restore the senses of smell and taste. It can quickly improve the patient’s ability to speak and swallow while reducing problems such as aspiration.

Key Stakeholders

  • Senior Management
  • End User
  • Finance/Procurement Department
  • R&D Department

Report Objectives

  • To define, describe, segment, and forecast the global Speaking Valves market, by material, application, end user, and region
  • To provide detailed information regarding the major factors influencing the market growth (such as drivers, restraints, opportunities, and challenges)
  • To analyze the micro markets with respect to individual growth trends, prospects, and contributions to the overall speaking valves market
  • To analyze market opportunities for stakeholders and provide details of the competitive landscape for key players
  • To forecast the size of the market segments with respect to five regions, namely, North America, Europe, the Asia Pacific, Latin America and Middle East & Africa
  • To profile the key players and comprehensively analyze their product portfolios, market positions, and core competencies
  • To track and analyze company developments such as product launches & approvals, partnerships, acquisitions, agreements, and other developments
  • To benchmark players within the market using the proprietary Competitive Leadership Mapping framework, which analyzes market players on various parameters within the broad categories of business and product excellence

Available Customizations

MarketsandMarkets offers the following customizations for this market report.

Country Information

  • Additional country-level analysis of the speaking valves market

Company profiles

  • Additional five company profiles of players operating in the speaking valves market.

Product Analysis

  • Product matrix, which provides a detailed comparison of the product portfolio of each company in the speaking valves market

Previous Versions of this Report

"Our USP is "providing game-changing business opportunities reports with free customization" - so please feel free to provide us with your specific areas of interest / business challenges in much greater detail !!"

We appreciate your interest in this report. Once you fill out the form, you'll be immediately directed to an exclusive solution tailored to your needs. This high-value offering can help boost your revenue by 30% - a must-see opportunity for anyone looking to maximize growth.


By clicking the "Submit" button, you are agreeing to the Terms of Use and Privacy Policy.

Custom Market Research Services

We Will Customise The Research For You, In Case The Report Listed Above Does Not Meet With Your Requirements

Get 10% Free Customisation

Growth opportunities and latent adjacency in Speaking Valves Market

DMCA.com Protection Status