Solvent Recovery and Recycling Market by Solvent Type (NMP, DMSO, Cresol, DMF, DMAC, Acetone, Butanol, Propanol, 2-Aminoethanol, 1, 4 Dioxane, E-Caprolactam, Terephthalic Acid), End-Use Industry, and Region - Global Forecast to 2028
Updated on : August 05, 2024
Solvent Recovery and Recycling Market
Solvent Recovery and Recycling Market size was valued at USD 1,085 million in 2023 and is projected to reach USD 1,384 million in 2028, growing at 5.0% cagr from 2023 to 2028. Solvent recovery and recycling involve the process of extracting and reusing useful materials from waste or by-product solvents generated during manufacturing. This process is a form of waste reduction and is widely used to reduce waste generation and minimize the need to produce new solvents. Solvent recovery typically uses a multi-stage distillation process to separate solvents into their components at lower-than-boiling point temperatures, resulting in recovered solvents that are virtually indistinguishable from virgin solvent products. The recovered solvents can then be repurposed, reducing the need to produce new solvents and eliminating a large amount of waste, while also removing potentially hazardous substances from the environment.
Opportunities in the Solvent Recovery and Recycling Market
To know about the assumptions considered for the study, Request for Free Sample Report
Recession Impact
During a recession, the solvent recovery and recycling market may face both challenges and opportunities. On the downside, economic downturns can lead to reduced industrial activity and capital constraints, impacting investment in sustainable practices. Companies may prioritize cost-cutting measures, potentially deferring investments in solvent recovery technologies. However, the market can also experience a positive shift as businesses seek cost-effective solutions to weather economic challenges. Solvent recovery, offering both environmental benefits and cost savings, may gain traction as companies strive for operational efficiency. Additionally, governments may incentivize green initiatives during economic downturns, potentially providing support for solvent recovery projects. The overall impact depends on the severity of the recession and the extent to which businesses prioritize sustainability amid economic uncertainties.
Solvent Recovery and Recycling Market Dynamics
Driver: Stringent regulations promoting the reduction of emissions and hazardous waste
Stringent regulations mandating the reduction of emissions and hazardous waste have emerged as a driving force in the solvent recovery and recycling market. As governments worldwide intensify their commitment to sustainability, the comparative assessment of disposal methods has become crucial, with quantitative analysis playing a key role in evaluating the environmental impact of various techniques. The conventional method of waste solvent disposal, such as incineration, has come under scrutiny due to its contribution to increased greenhouse gas emissions and the overall carbon footprint. This has prompted governmental bodies to enact legislation aimed at addressing sustainability concerns and promoting eco-friendly alternatives. Solvent recovery processes offer a significant advantage in this landscape, not only aligning with environmental regulations but also providing substantial benefits to both industries and the environment. These advantages include enhanced compliance with environmental standards, reduced reliance on fresh solvent purchases, minimized transportation requirements, and decreased human exposure to hazardous substances. The rising awareness among businesses about their corporate social responsibility (CSR) has amplified the adoption of solvent recovery and recycling technologies. Companies are proactively seeking ways to minimize their carbon footprint and enhance their sustainability profiles, making solvent recovery an integral component of their environmental stewardship.
Innovations in solvent recovery technologies further propel market expansion. Advanced systems and methodologies are continually being developed to enhance the efficiency and effectiveness of solvent recovery processes, ensuring the optimal utilization of resources while adhering to stringent environmental standards. The adoption of solvent recovery technologies has led to a notable reduction in carbon footprints across various industries. Studies on isopropanol (IPA) recovery processes, utilizing SimaPro, reported emissions reductions of up to 61% compared to conventional methods. Similarly, tetrahydrofuran (THF) recovery processes showed that over 93.8% of total emissions could be prevented through optimized combinations of recovery technologies. Temperature-swing molecular imprinting technology resulted in a remarkable 61% reduction in the E factor of the process and a 49% reduction in carbon footprints. This emphasizes the tangible environmental benefits achievable through innovative solvent recovery approaches. The incorporation of ecological footprint assessments, such as the Sustainable Process Index (SPI), further enhances the evaluation of solvent recovery processes. SPI considers land area usage, providing a comprehensive approach to measuring the environmental burden and pressure associated with the process. In conclusion, stringent regulations promoting emissions reduction and waste management are propelling the solvent recovery and recycling market forward. The industry's response involves adopting advanced technologies, conducting comprehensive life cycle assessments, and embracing a holistic approach to sustainability, thereby contributing to a more environmentally conscious and economically viable future.
Restraint: High initial capital investments of solvent recovery and recycling systems
The main challenge for businesses looking to adopt solvent recovery and recycling systems is the significant upfront cost involved. Setting up the necessary equipment and technology, along with creating the infrastructure and training personnel, requires a substantial investment. This can be a barrier, especially for smaller businesses with limited financial resources. The advanced technologies involved in solvent recovery, such as distillation and membrane separation, come with their own set of expenses. For many companies, particularly smaller ones, it can be difficult to allocate the funds needed for these capital-intensive projects. The high initial investment can also mean a longer wait to see financial returns, as the payback period may be extended. In the short term, businesses often have competing priorities for their finances, and the substantial upfront cost of solvent recovery systems might not align with these immediate needs. This can lead to a hesitancy to invest in such projects, even if they offer long-term benefits and sustainability advantages. The uncertainties surrounding the return on investment and the evolving landscape of solvent recovery technologies may lead businesses to adopt a cautious approach. The perceived risk associated with high upfront costs can overshadow the potential long-term benefits, slowing down the pace of adoption within the market.
Opportunity: Growing awareness on environmental issues
The growing awareness of environmental issues presents a significant opportunity for the solvent recovery and recycling market. As individuals, businesses, and governments become increasingly conscious of the impact of industrial activities on the environment, there is a rising demand for sustainable and eco-friendly practices. This heightened environmental awareness creates a favorable environment for the adoption and growth of solvent recovery and recycling solutions. Businesses are under increasing pressure to align their operations with environmentally responsible practices. Solvent recovery and recycling offer a clear pathway for industries to demonstrate their commitment to sustainability. Companies that integrate solvent recovery into their processes can showcase their dedication to reducing carbon footprints, minimizing waste, and responsibly managing resources. The regulatory bodies are emphasizing environmental compliance, imposing stringent standards on waste disposal and emissions. Solvent recovery not only helps businesses meet these regulatory requirements but also positions them as responsible stewards of the environment. This alignment with environmental regulations can lead to favorable relationships with regulatory authorities, reducing the risk of penalties and legal complications.
The opportunity is not limited to regulatory compliance, it extends to market positioning and customer perception. Consumers are increasingly making choices based on a company's environmental practices and values. Businesses that implement solvent recovery and recycling initiatives can differentiate themselves as environmentally conscious, attracting environmentally minded customers and enhancing their brand reputation. The push for sustainability is driving innovation in solvent recovery technologies. The market is witnessing the development of more efficient and cost-effective solutions, making solvent recovery a viable and attractive option for businesses looking to balance economic considerations with environmental responsibility.
Challenge: Availability of low-cost virgin solvents
The availability of low-cost virgin solvents poses a challenge for the solvent recovery and recycling market. While the benefits of solvent recovery are clear in terms of cost savings and environmental sustainability, the presence of inexpensive new solvents creates a competitive hurdle. Businesses often face the choice between investing in solvent recovery systems, which may involve a significant upfront cost, and opting for readily available low-cost virgin solvents. In cases where the price difference is substantial, the economic incentive to adopt solvent recovery practices may be diminished, especially for companies with tight budgets or those focused on short-term financial gains. The perception that new solvents are more convenient and readily accessible may discourage businesses from making the switch to solvent recovery. The upfront investment in recovery systems, coupled with the potential operational adjustments required, may be seen as a barrier compared to the simplicity of continuing with traditional solvent usage. Some industries may prioritize immediate cost considerations over long-term sustainability goals. The allure of low-cost virgin solvents can be a tempting short-term solution, especially if the environmental impact is not a primary concern or if regulatory pressure is perceived as lenient.
Solvent Recovery and Recycling Market Ecosystem
The paints & coating industry is the second-fastest growing end-use industry in the solvent recovery and recycling market during the forecast period.
The paints & coating industry is the second fastest-growing end-use industry in the solvent recovery and recycling market due to expanding construction and automotive activities. Solvents play a crucial role in formulations, making their recovery essential. Heightened environmental consciousness and stringent regulations drive the adoption of recycling practices within the industry, promoting sustainability. The growing demand for eco-friendly solutions in paints and coatings, coupled with regulatory pressures, positions this sector as a key contributor to the market's rapid expansion.
Top of Form
Asia Pacific is the fastest growing in the solvent recovery and recycling market, in terms of value.
Asia Pacific stands as the fastest-growing region in the solvent recovery and recycling market due to its dynamic industrial landscape and robust economic growth. Rapid industrialization in countries like China and India increases solvent usage, necessitating efficient recovery measures. With a heightened focus on environmental sustainability and stringent regulations, there's a surge in demand for solvent recovery technologies. The region's strategic initiatives towards eco-friendly practices and the expanding industrial activities solidify Asia Pacific's position as the primary driver of rapid growth in this market.
Source: Secondary Research, Primary Interviews, and MarketsandMarkets Analysis
To know about the assumptions considered for the study, download the pdf brochure
Solvent Recovery and Recycling Market Players
Veolia (France), CycleSolv LLC (US), Tradebe Environmental Services (US), Clean Harbors (US), and Indaver (Belgium). These players have established a strong foothold in the market by adopting strategies, such expansions, joint ventures, and mergers & acquisitions.
Read More: Solvent Recovery and Recycling Companies
Solvent Recovery and Recycling Market Report Scope
Report Metric |
Details |
Market Size Value in 2022 |
USD 1,046 Million |
Revenue Forecast in 2028 |
USD 1,384 Million |
CAGR |
5.0% |
Years considered for the study |
2020–2028 |
Base year considered |
2022 |
Forecast period |
2023–2028 |
Units considered |
Volume (KT) and Value (USD Million/Billion) |
Segments |
By Solvent Type, End-use Industry, and Region |
Regions |
North America, Asia Pacific, Europe, Middle East & Africa, and South America |
Companies |
Veolia (France), CycleSolv LLC (US), Tradebe Environmental Services (US), Clean Harbors (US), and Indaver (Belgium). |
This research report categorizes the solvent recovery and recycling market based on solvent type, type, end-use industry, and region.
By solvent type:
- NMP (N-Methyl-2-pyrrolidone)
- DMSO (Dimethyl sulfoxide)
- Cresol
- DMF (N, N-dimethylformamide)
- DMAC (N, N-Dimethylacetamide)
- Acetone
- Butanol
- Propanol
- 2-aminoethanol
- 1, 4-dioxane
- E-Caprolactam
- Terephthalic acid
- Others
By end-use industry:
- Paints & Coatings
- Printing
- Chemicals
- Electronics
- Pharmaceuticals
- Others
By region:
- Asia Pacific
- Europe
- North America
- Middle East & Africa
- South America
Recent Developments
- In January 2020, Veolia signed an agreement to take over Alcoa USA Corporation’s Hazardous Waste Treatment Site located in Gum Springs, Arkansas (US). With this operation, Veolia continues the global expansion of its hazardous waste treatment and recycling activity, with a step further in North America.
- In September 2020, CycleSolv LLC expanded its capabilities with the acquisition of Engov Ltd, gaining two decades of invaluable recycling industry expertise.
Frequently Asked Questions (FAQ):
What is the current size of the global solvent recovery and recycling market?
Global solvent recovery and recycling market size is estimated to reach USD 1,384 million by 2028 from USD 1,085 million in 2023, at a CAGR of 5.0% during the forecast period.
Who are the winners in the global solvent recovery and recycling market?
Veolia, CycleSolv LLC, Tradebe Environmental Services, Clean Harbors, and Indaver fall under the winner’s category. They have the potential to broaden their product portfolio and compete with other key market players. Such advantages give these companies an edge over other companies.
What are some of the strategies adopted by the top market players to penetrate emerging regions?
The major players in the market use expansions, joint ventures, and mergers & acquisitions as important growth tactics.
What is the recession on solvent recovery and recycling manufacturers?
During a recession, companies may face challenges in the solvent recovery market due to reduced industrial activity. However, the emphasis on cost-effective and sustainable solutions may drive interest in solvent recovery, offering both environmental benefits and operational savings.
What are some of the drivers in the market?
Stringent regulations promoting the reduction of emissions and hazardous waste .
To speak to our analyst for a discussion on the above findings, click Speak to Analyst
Exclusive indicates content/data unique to MarketsandMarkets and not available with any competitors.
- 5.1 INTRODUCTION
-
5.2 MARKET DYNAMICSDRIVERS- Stringent regulations promoting reduction of emissions and hazardous waste- Increasing demand for solvent recovery and recycling in end-use industries- Financial benefits through reduced procurement costs and waste disposal expenditureRESTRAINTS- High initial capital investments in solvent recovery and recycling systems- Solvent recovery and recycling systems require significant space and specific infrastructureOPPORTUNITIES- Growing awareness about environmental issues- Increasing adoption in healthcare and pharmaceuticalsCHALLENGES- Availability of low-cost virgin solvents
- 6.1 INTRODUCTION
-
6.2 VALUE CHAIN ANALYSISSOLVENT GENERATIONCOLLECTION AND TRANSPORTATIONSOLVENT RECOVERY AND RECYCLINGDISTRIBUTORSEND-USE INDUSTRIES
-
6.3 PRICING ANALYSISAVERAGE SELLING PRICE TREND OF KEY PLAYERS, BY END-USE INDUSTRYAVERAGE SELLING PRICE TREND, BY REGION
-
6.4 TARIFF AND REGULATORY LANDSCAPEREGULATIONS- North America- Europe- Asia PacificSTANDARDS- ISO 14001- ISO 14004- EN 12952- ASTM D6803–19REGULATORY BODIES, GOVERNMENT AGENCIES, & OTHER ORGANIZATIONS
-
6.5 TRADE ANALYSISIMPORT TRADE ANALYSISEXPORT TRADE ANALYSIS
- 6.6 ECOSYSTEM/MARKET MAP
- 6.7 TRENDS/DISRUPTIONS IMPACTING CUSTOMER BUSINESS
-
6.8 TECHNOLOGY ANALYSISADVANCED ADSORPTION MATERIALSNANOTECHNOLOGY APPLICATIONSELECTROCHEMICAL PROCESS
-
6.9 PORTER’S FIVE FORCES ANALYSISTHREAT OF NEW ENTRANTSTHREAT OF SUBSTITUTESBARGAINING POWER OF SUPPLIERSBARGAINING POWER OF BUYERSINTENSITY OF COMPETITIVE RIVALRY
-
6.10 CASE STUDY ANALYSISVEOLIACBG BIOTECH
- 6.11 KEY CONFERENCES & EVENTS (2023–24)
-
6.12 PATENT ANALYSISMETHODOLOGYDOCUMENT TYPEPUBLICATION TRENDS, LAST 10 YEARSINSIGHTLEGAL STATUS OF PATENTSJURISDICTION ANALYSISTOP COMPANIES/APPLICANTS
-
6.13 KEY STAKEHOLDERS AND BUYING CRITERIAKEY STAKEHOLDERS IN BUYING PROCESSBUYING CRITERIA
- 7.1 INTRODUCTION
-
7.2 NMP (N-METHYL-2-PYRROLIDONE)PHARMACEUTICAL, PETROCHEMICAL, AGROCHEMICAL, ELECTRONICS, AND COATINGS END-USE INDUSTRIES TO DRIVE MARKET
-
7.3 DMSO (DIMETHYL SULFOXIDE)PHARMACEUTICAL, POLYMER PROCESSING, AND ELECTRONICS END-USE INDUSTRIES TO DRIVE MARKET
-
7.4 CRESOLUTILIZATION IN PRODUCTION OF RESINS, PLASTICS, AND AS PRECURSORS FOR VARIOUS CHEMICALS TO DRIVE MARKET
-
7.5 DMF (N, N-DIMETHYLFORMAMIDE)USE AS A REACTION SOLVENT AND SOLUBILIZING AGENT TO DRIVE MARKET
-
7.6 DMAC (N, N-DIMETHYLACETAMIDE)GROWING PHARMACEUTICAL, TEXTILE, AND CHEMICAL END-USE INDUSTRIES TO DRIVE MARKET
-
7.7 ACETONEEXCELLENT SOLVENT PROPERTIES TO DRIVE APPLICABILITY IN VARIOUS INDUSTRIAL PROCESSES
-
7.8 BUTANOLUSE AS VALUABLE CHEMICAL INTERMEDIATE IN PRODUCTION TO DRIVE MARKET
-
7.9 PROPANOLEFFECTIVE USE FOR DISSOLVING OILS, RESINS, AND OTHER ORGANIC COMPOUNDS TO DRIVE MARKET
-
7.10 2-AMINOETHANOLABILITY TO DISSOLVE VARIOUS SUBSTANCES, INCLUDING GASES TO DRIVE MARKET
-
7.11 1,4-DIOXANEPRODUCTION OF PAINT STRIPPERS, VARNISHES, AND WAXES TO DRIVE MARKET
-
7.12 E-CAPROLACTAMKEY RAW MATERIAL IN PRODUCTION OF NYLON-6 TO DRIVE MARKET
-
7.13 TEREPHTHALIC ACIDUSE AS KEY PRECURSOR IN PRODUCTION OF POLYESTER FIBERS AND RESINS TO DRIVE MARKET
- 7.14 OTHER SOLVENT TYPES
- 8.1 INTRODUCTION
-
8.2 PAINTS & COATINGSCONTRIBUTION TO CLOSED-LOOP SYSTEM ENHANCING RESOURCE EFFICIENCY TO DRIVE MARKET
-
8.3 PRINTINGUSE OF RECOVERED SOLVENTS IN INK APPLICATION AND CLEANING TO DRIVE MARKET
-
8.4 CHEMICALSAFFORDABLE ALTERNATIVE TO VIRGIN COUNTERPARTS, FOSTERING OPERATIONAL EFFICIENCY AND COST SAVINGS TO DRIVE MARKET
-
8.5 ELECTRONICSCOSTLY AND ENVIRONMENTALLY UNSUSTAINABLE CONVENTIONAL DISCARDING PRACTICES TO DRIVE MARKET
-
8.6 PHARMACEUTICALINCREASING MERITS OF ON-SITE SOLVENT RECOVERY AND RECYCLING TO DRIVE MARKET
- 8.7 OTHER END-USE INDUSTRIES
- 9.1 INTRODUCTION
-
9.2 NORTH AMERICAIMPACT OF RECESSION ON NORTH AMERICAUS- Expansive chemical sector to drive marketCANADA- Growing pharmaceutical and paints & coatings industries to boost marketMEXICO- Paints & coatings and textiles industries to drive market
-
9.3 EUROPEIMPACT OF RECESSION ON EUROPEGERMANY- Demand for sustainable practices from robust pharmaceutical industry to drive marketFRANCE- Ambitious environmental objectives and waste reduction targets to drive marketSPAIN- Government emphasis on circular economy to propel marketUK- Growing construction industry to drive marketITALY- Rising demand from automotive and manufacturing industries to drive marketREST OF EUROPE
-
9.4 ASIA PACIFICIMPACT OF RECESSION ON ASIA PACIFICCHINA- Transformation from generic drug-dominated to an innovative drug-driven market opens new opportunitiesINDIA- Government initiatives to drive marketJAPAN- Automotive and electronics industries to drive marketSOUTH KOREA- Economic benefits associated with solvent recovery and recycling to fuel marketREST OF ASIA PACIFIC
-
9.5 MIDDLE EAST & AFRICAIMPACT OF RECESSION ON MIDDLE EAST & AFRICAGCC COUNTRIES- Region's heavy reliance on industries such as petrochemicals, oil & gas, and manufacturing to drive market- Saudi Arabia- UAE- Rest of GCCSOUTH AFRICA- Growing manufacturing industries to boost marketREST OF MIDDLE EAST & AFRICA
-
9.6 SOUTH AMERICAIMPACT OF RECESSION ON SOUTH AMERICABRAZIL- Paints & coatings industry, among world's top five producers, to drive marketARGENTINA- Growing construction industry to drive marketREST OF SOUTH AMERICA
- 10.1 INTRODUCTION
- 10.2 KEY PLAYER STRATEGIES/RIGHT TO WIN
- 10.3 REVENUE ANALYSIS
-
10.4 MARKET SHARE ANALYSISVEOLIACYCLESOLV LLCTRADEBE ENVIRONMENTAL SERVICESCLEAN HARBORSINDAVER
- 10.5 MARKET SHARE OF KEY PLAYERS, 2022
-
10.6 COMPANY EVALUATION MATRIXSTARSEMERGING LEADERSPERVASIVE PLAYERSPARTICIPANTSCOMPANY FOOTPRINT
-
10.7 STARTUP/SME EVALUATION MATRIXPROGRESSIVE COMPANIESRESPONSIVE COMPANIESSTARTING BLOCKSDYNAMIC COMPANIESCOMPETITIVE BENCHMARKING
-
10.8 COMPETITIVE SCENARIO & TRENDSPRODUCT LAUNCHESDEALS
-
11.1 KEY PLAYERSVEOLIA- Business overview- Products/Solutions/Services offered- Recent developments- MnM viewCYCLESOLV LLC- Business overview- Products/Solutions/Services offered- Recent developments- MnM viewTRADEBE ENVIRONMENTAL SERVICES- Business overview- Products/Solutions/Services offered- Recent developments- MnM viewCLEAN HARBORS- Business overview- Products/Solutions/Services offered- Recent developments- MnM viewINDAVER- Business overview- Products/Solutions/Services offered- Recent developments- MnM viewCBG BIOTECH- Business overview- Products/Solutions/Services offered- Recent developments- MnM viewOFRU RECYCLING- Business overview- Products/Solutions/Services offered- MnM viewMARATEK ENVIRONMENTAL INC.- Business overview- Products/Solutions/Services offered- MnM viewNIPPON REFINE CO., LTD.- Business overview- Products/Solutions/Services offered- MnM viewCLEANPLANET CHEMICAL- Business overview- Products/Solutions/Services offered- MnM viewGEA- Business overview- Products/Solutions/Services offered- MnM view
-
11.2 OTHER PLAYERSCHEMOXY INTERNATIONAL LTD.SHINKO ORGANIC CHEMICAL INDUSTRY LTD.IST PUREKOCH MODULAR PROCESS SYSTEMS, LLCALAQUA INC.SOLVENT WASTE MANAGEMENT INC.TIANLONG ENVIRONMENTAL ENGINEERING CO., LTD.ENVIRO TECH INTERNATIONAL INC.RENERGIESNEXTGEN ENVIRO SYSTEMS INC.LN CHEMPRISOLUTEX LTDJACOBI GROUPBEST TECHNOLOGY INC.
- 12.1 DISCUSSION GUIDE
- 12.2 KNOWLEDGESTORE: MARKETSANDMARKETS’ SUBSCRIPTION PORTAL
- 12.3 AVAILABLE CUSTOMIZATIONS
- 12.4 RELATED REPORTS
- 12.5 AUTHOR DETAILS
- TABLE 1 INCLUSIONS & EXCLUSIONS
- TABLE 2 NORTH AMERICA: LIST OF REGULATORY BODIES, GOVERNMENT AGENCIES, AND OTHER ORGANIZATIONS
- TABLE 3 EUROPE: LIST OF REGULATORY BODIES, GOVERNMENT AGENCIES, AND OTHER ORGANIZATIONS
- TABLE 4 ASIA PACIFIC: LIST OF REGULATORY BODIES, GOVERNMENT AGENCIES, AND OTHER ORGANIZATIONS
- TABLE 5 ROW: LIST OF REGULATORY BODIES, GOVERNMENT AGENCIES, AND OTHER ORGANIZATIONS
- TABLE 6 ROLE IN ECOSYSTEM: SOLVENT RECOVERY AND RECYCLING MARKET
- TABLE 7 PORTER’S FIVE FORCES ANALYSIS
- TABLE 8 LIST OF CONFERENCES & EVENTS
- TABLE 9 LIST OF PATENTS BY SAUDI ARABIAN OIL CO.
- TABLE 10 LIST OF PATENTS BY CHINA PETROLEUM & CHEM CORP.
- TABLE 11 LIST OF PATENTS BY SHELL OIL CO.
- TABLE 12 TOP 20 PATENT OWNERS DURING LAST TEN YEARS
- TABLE 13 INFLUENCE OF STAKEHOLDERS ON BUYING PROCESS FOR TOP 3 APPLICATIONS (%)
- TABLE 14 KEY BUYING CRITERIA FOR TOP 3 APPLICATIONS
- TABLE 15 SOLVENT RECOVERY AND RECYCLING MARKET, BY SOLVENT TYPE, 2020–2022 (USD MILLION)
- TABLE 16 SOLVENT RECOVERY AND RECYCLING MARKET, BY SOLVENT TYPE, 2023–2028 (USD MILLION)
- TABLE 17 SOLVENT RECOVERY AND RECYCLING MARKET, BY SOLVENT TYPE, 2020–2022 (KILOTON)
- TABLE 18 SOLVENT RECOVERY AND RECYCLING MARKET, BY SOLVENT TYPE, 2023–2028 (KILOTON)
- TABLE 19 SOLVENT RECOVERY AND RECYCLING MARKET, BY END-USE INDUSTRY, 2020–2022 (USD MILLION)
- TABLE 20 SOLVENT RECOVERY AND RECYCLING MARKET, BY END-USE INDUSTRY, 2023–2028 (USD MILLION)
- TABLE 21 SOLVENT RECOVERY AND RECYCLING MARKET, BY END-USE INDUSTRY, 2020–2022 (KILOTON)
- TABLE 22 SOLVENT RECOVERY AND RECYCLING MARKET, BY END-USE INDUSTRY, 2023–2028 (KILOTON)
- TABLE 23 SOLVENT RECOVERY AND RECYCLING MARKET, BY REGION, 2020–2022 (USD MILLION)
- TABLE 24 SOLVENT RECOVERY AND RECYCLING MARKET, BY REGION, 2023–2028 (USD MILLION)
- TABLE 25 SOLVENT RECOVERY AND RECYCLING MARKET, BY REGION, 2020–2022 (KILOTON)
- TABLE 26 SOLVENT RECOVERY AND RECYCLING MARKET, BY REGION, 2023–2028 (KILOTON)
- TABLE 27 NORTH AMERICA: SOLVENT RECOVERY AND RECYCLING MARKET, BY COUNTRY, 2020–2022 (USD MILLION)
- TABLE 28 NORTH AMERICA: SOLVENT RECOVERY AND RECYCLING MARKET, BY COUNTRY, 2023–2028 (USD MILLION)
- TABLE 29 NORTH AMERICA: SOLVENT RECOVERY AND RECYCLING MARKET, BY COUNTRY, 2020–2022 (KILOTON)
- TABLE 30 NORTH AMERICA: SOLVENT RECOVERY AND RECYCLING MARKET, BY COUNTRY, 2023–2028 (KILOTON)
- TABLE 31 NORTH AMERICA: SOLVENT RECOVERY AND RECYCLING MARKET, BY SOLVENT TYPE, 2020–2022 (USD MILLION)
- TABLE 32 NORTH AMERICA: SOLVENT RECOVERY AND RECYCLING MARKET, BY SOLVENT TYPE, 2023–2028 (USD MILLION)
- TABLE 33 NORTH AMERICA: SOLVENT RECOVERY AND RECYCLING MARKET, BY SOLVENT TYPE, 2020–2022 (KILOTON)
- TABLE 34 NORTH AMERICA: SOLVENT RECOVERY AND RECYCLING MARKET, BY SOLVENT TYPE, 2023–2028 (KILOTON)
- TABLE 35 NORTH AMERICA: SOLVENT RECOVERY AND RECYCLING MARKET, BY END-USE INDUSTRY, 2020–2022 (USD MILLION)
- TABLE 36 NORTH AMERICA: SOLVENT RECOVERY AND RECYCLING MARKET, BY END-USE INDUSTRY, 2023–2028 (USD MILLION)
- TABLE 37 NORTH AMERICA: SOLVENT RECOVERY AND RECYCLING MARKETS, BY END-USE INDUSTRY, 2020–2022 (KILOTON)
- TABLE 38 NORTH AMERICA: SOLVENT RECOVERY AND RECYCLING MARKET, BY END-USE INDUSTRY, 2023–2028 (KILOTON)
- TABLE 39 US: SOLVENT RECOVERY AND RECYCLING MARKET, BY END-USE INDUSTRY, 2020–2022 (USD MILLION)
- TABLE 40 US: SOLVENT RECOVERY AND RECYCLING MARKET, BY END-USE INDUSTRY, 2023–2028 (USD MILLION)
- TABLE 41 US: SOLVENT RECOVERY AND RECYCLING MARKET, BY END-USE INDUSTRY, 2020–2022 (KILOTON)
- TABLE 42 US: SOLVENT RECOVERY AND RECYCLING MARKET, BY END-USE INDUSTRY, 2023–2028 (KILOTON)
- TABLE 43 CANADA: SOLVENT RECOVERY AND RECYCLING MARKET, BY END-USE INDUSTRY, 2020–2022 (USD MILLION)
- TABLE 44 CANADA: SOLVENT RECOVERY AND RECYCLING MARKET, BY END-USE INDUSTRY, 2023–2028 (USD MILLION)
- TABLE 45 CANADA: SOLVENT RECOVERY AND RECYCLING MARKET, BY END-USE INDUSTRY, 2020–2022 (KILOTON)
- TABLE 46 CANADA: SOLVENT RECOVERY AND RECYCLING MARKET, BY END-USE INDUSTRY, 2023–2028 (KILOTON)
- TABLE 47 MEXICO: SOLVENT RECOVERY AND RECYCLING MARKET, BY END-USE INDUSTRY, 2020–2022 (USD MILLION)
- TABLE 48 MEXICO: SOLVENT RECOVERY AND RECYCLING MARKET, BY END-USE INDUSTRY, 2023–2028 (USD MILLION)
- TABLE 49 MEXICO: SOLVENT RECOVERY AND RECYCLING MARKET, BY END-USE INDUSTRY, 2020–2022 (KILOTON)
- TABLE 50 MEXICO: SOLVENT RECOVERY AND RECYCLING MARKET, BY END-USE INDUSTRY, 2023–2028 (KILOTON)
- TABLE 51 EUROPE: SOLVENT RECOVERY AND RECYCLING MARKET, BY COUNTRY, 2020–2022 (USD MILLION)
- TABLE 52 EUROPE: SOLVENT RECOVERY AND RECYCLING MARKET, BY COUNTRY, 2023–2028 (USD MILLION)
- TABLE 53 EUROPE: SOLVENT RECOVERY AND RECYCLING MARKET, BY COUNTRY, 2020–2022 (KILOTON)
- TABLE 54 EUROPE: SOLVENT RECOVERY AND RECYCLING MARKET, BY COUNTRY, 2023–2028 (KILOTON)
- TABLE 55 EUROPE: SOLVENT RECOVERY AND RECYCLING MARKET, BY SOLVENT TYPE, 2020–2022 (USD MILLION)
- TABLE 56 EUROPE: SOLVENT RECOVERY AND RECYCLING MARKET, BY SOLVENT TYPE, 2023–2028 (USD MILLION)
- TABLE 57 EUROPE: SOLVENT RECOVERY AND RECYCLING MARKET, BY SOLVENT TYPE, 2020–2022 (KILOTON)
- TABLE 58 EUROPE: SOLVENT RECOVERY AND RECYCLING MARKET, BY SOLVENT TYPE, 2023–2028 (KILOTON)
- TABLE 59 EUROPE: SOLVENT RECOVERY AND RECYCLING MARKET, BY END-USE INDUSTRY, 2020–2022 (USD MILLION)
- TABLE 60 EUROPE: SOLVENT RECOVERY AND RECYCLING MARKET, BY END-USE INDUSTRY, 2023–2028 (USD MILLION)
- TABLE 61 EUROPE: SOLVENT RECOVERY AND RECYCLING MARKET, BY END-USE INDUSTRY, 2020–2022 (KILOTON)
- TABLE 62 EUROPE: SOLVENT RECOVERY AND RECYCLING MARKET, BY END-USE INDUSTRY, 2023–2028 (KILOTON)
- TABLE 63 GERMANY: SOLVENT RECOVERY AND RECYCLING MARKET, BY END-USE INDUSTRY, 2020–2022 (USD MILLION)
- TABLE 64 GERMANY: SOLVENT RECOVERY AND RECYCLING MARKET, BY END-USE INDUSTRY, 2023–2028 (USD MILLION)
- TABLE 65 GERMANY: SOLVENT RECOVERY AND RECYCLING MARKET, BY END-USE INDUSTRY, 2020–2022 (KILOTON)
- TABLE 66 GERMANY: SOLVENT RECOVERY AND RECYCLING MARKET, BY END-USE INDUSTRY, 2023–2028 (KILOTON)
- TABLE 67 FRANCE: SOLVENT RECOVERY AND RECYCLING MARKET, BY END-USE INDUSTRY, 2020–2022 (USD MILLION)
- TABLE 68 FRANCE: SOLVENT RECOVERY AND RECYCLING MARKET, BY END-USE INDUSTRY, 2023–2028 (USD MILLION)
- TABLE 69 FRANCE: SOLVENT RECOVERY AND RECYCLING MARKET, BY END-USE INDUSTRY, 2020–2022 (KILOTON)
- TABLE 70 FRANCE: SOLVENT RECOVERY AND RECYCLING MARKET, BY END-USE INDUSTRY, 2023–2028 (KILOTON)
- TABLE 71 SPAIN: SOLVENT RECOVERY AND RECYCLING MARKET, BY END-USE INDUSTRY, 2020–2022 (USD MILLION)
- TABLE 72 SPAIN: SOLVENT RECOVERY AND RECYCLING MARKET, BY END-USE INDUSTRY, 2023–2028 (USD MILLION)
- TABLE 73 SPAIN: SOLVENT RECOVERY AND RECYCLING MARKET, BY END-USE INDUSTRY, 2020–2022 (KILOTON)
- TABLE 74 SPAIN: SOLVENT RECOVERY AND RECYCLING MARKET, BY END-USE INDUSTRY, 2023–2028 (KILOTON)
- TABLE 75 UK: SOLVENT RECOVERY AND RECYCLING MARKET, BY END-USE INDUSTRY, 2020–2022 (USD MILLION)
- TABLE 76 UK: SOLVENT RECOVERY AND RECYCLING MARKET, BY END-USE INDUSTRY, 2023–2028 (USD MILLION)
- TABLE 77 UK: SOLVENT RECOVERY AND RECYCLING MARKET, BY END-USE INDUSTRY, 2020–2022 (KILOTON)
- TABLE 78 UK: SOLVENT RECOVERY AND RECYCLING MARKET, BY END-USE INDUSTRY, 2023–2028 (KILOTON)
- TABLE 79 ITALY: SOLVENT RECOVERY AND RECYCLING MARKET, BY END-USE INDUSTRY, 2020–2022 (USD MILLION)
- TABLE 80 ITALY: SOLVENT RECOVERY AND RECYCLING MARKET, BY END-USE INDUSTRY, 2023–2028 (USD MILLION)
- TABLE 81 ITALY: SOLVENT RECOVERY AND RECYCLING MARKET, BY END-USE INDUSTRY, 2020–2022 (KILOTON)
- TABLE 82 ITALY: SOLVENT RECOVERY AND RECYCLING MARKET, BY END-USE INDUSTRY, 2023–2028 (KILOTON)
- TABLE 83 REST OF EUROPE: SOLVENT RECOVERY AND RECYCLING MARKET, BY END-USE INDUSTRY, 2020–2022 (USD MILLION)
- TABLE 84 REST OF EUROPE: SOLVENT RECOVERY AND RECYCLING MARKET, BY END-USE INDUSTRY, 2023–2028 (USD MILLION)
- TABLE 85 REST OF EUROPE: SOLVENT RECOVERY AND RECYCLING MARKET, BY END-USE INDUSTRY, 2020–2022 (KILOTON)
- TABLE 86 REST OF EUROPE: SOLVENT RECOVERY AND RECYCLING MARKET, BY END-USE INDUSTRY, 2023–2028 (KILOTON)
- TABLE 87 ASIA PACIFIC: SOLVENT RECOVERY AND RECYCLING MARKET, BY COUNTRY, 2020–2022 (USD MILLION)
- TABLE 88 ASIA PACIFIC: SOLVENT RECOVERY AND RECYCLING MARKET, BY COUNTRY, 2023–2028 (USD MILLION)
- TABLE 89 ASIA PACIFIC: SOLVENT RECOVERY AND RECYCLING MARKET, BY COUNTRY, 2020–2022 (KILOTON)
- TABLE 90 ASIA PACIFIC: SOLVENT RECOVERY AND RECYCLING MARKET, BY COUNTRY, 2023–2028 (KILOTON)
- TABLE 91 ASIA PACIFIC: SOLVENT RECOVERY AND RECYCLING MARKET, BY SOLVENT TYPE, 2020–2022 (USD MILLION)
- TABLE 92 ASIA PACIFIC: SOLVENT RECOVERY AND RECYCLING MARKET, BY SOLVENT TYPE, 2023–2028 (USD MILLION)
- TABLE 93 ASIA PACIFIC: SOLVENT RECOVERY AND RECYCLING MARKET, BY SOLVENT TYPE, 2020–2022 (KILOTON)
- TABLE 94 ASIA PACIFIC: SOLVENT RECOVERY AND RECYCLING MARKET, BY SOLVENT TYPE, 2023–2028 (KILOTON)
- TABLE 95 ASIA PACIFIC: SOLVENT RECOVERY AND RECYCLING MARKET, BY END-USE INDUSTRY, 2020–2022 (USD MILLION)
- TABLE 96 ASIA PACIFIC: SOLVENT RECOVERY AND RECYCLING MARKET, BY END-USE INDUSTRY, 2023–2028 (USD MILLION)
- TABLE 97 ASIA PACIFIC: SOLVENT RECOVERY AND RECYCLING MARKET, BY END-USE INDUSTRY, 2020–2022 (KILOTON)
- TABLE 98 ASIA PACIFIC: SOLVENT RECOVERY AND RECYCLING MARKET, BY END-USE INDUSTRY, 2023–2028 (KILOTON)
- TABLE 99 CHINA: SOLVENT RECOVERY AND RECYCLING MARKET, BY END-USE INDUSTRY, 2020–2022 (USD MILLION)
- TABLE 100 CHINA: SOLVENT RECOVERY AND RECYCLING MARKET, BY END-USE INDUSTRY, 2023–2028 (USD MILLION)
- TABLE 101 CHINA: SOLVENT RECOVERY AND RECYCLING MARKET, BY END-USE INDUSTRY, 2020–2022 (KILOTON)
- TABLE 102 CHINA: SOLVENT RECOVERY AND RECYCLING MARKET, BY END-USE INDUSTRY, 2023–2028 (KILOTON)
- TABLE 103 INDIA: SOLVENT RECOVERY AND RECYCLING MARKET, BY END-USE INDUSTRY, 2020–2022 (USD MILLION)
- TABLE 104 INDIA: SOLVENT RECOVERY AND RECYCLING MARKET, BY END-USE INDUSTRY, 2023–2028 (USD MILLION)
- TABLE 105 INDIA: SOLVENT RECOVERY AND RECYCLING MARKET, BY END-USE INDUSTRY, 2020–2022 (KILOTON)
- TABLE 106 INDIA: SOLVENT RECOVERY AND RECYCLING MARKET, BY END-USE INDUSTRY, 2023–2028 (KILOTON)
- TABLE 107 JAPAN: SOLVENT RECOVERY AND RECYCLING MARKET, BY END-USE INDUSTRY, 2020–2022 (USD MILLION)
- TABLE 108 JAPAN: SOLVENT RECOVERY AND RECYCLING MARKET, BY END-USE INDUSTRY, 2023–2028 (USD MILLION)
- TABLE 109 JAPAN: SOLVENT RECOVERY AND RECYCLING MARKET, BY END-USE INDUSTRY, 2020–2022 (KILOTON)
- TABLE 110 JAPAN: SOLVENT RECOVERY AND RECYCLING MARKET, BY END-USE INDUSTRY, 2023–2028 (KILOTON)
- TABLE 111 SOUTH KOREA: SOLVENT RECOVERY AND RECYCLING MARKET, BY END-USE INDUSTRY, 2020–2022 (USD MILLION)
- TABLE 112 SOUTH KOREA: SOLVENT RECOVERY AND RECYCLING MARKET, BY END-USE INDUSTRY, 2023–2028 (USD MILLION)
- TABLE 113 SOUTH KOREA: SOLVENT RECOVERY AND RECYCLING MARKET, BY END-USE INDUSTRY, 2020–2022 (KILOTON)
- TABLE 114 SOUTH KOREA: SOLVENT RECOVERY AND RECYCLING MARKET, BY END-USE INDUSTRY, 2023–2028 (KILOTON)
- TABLE 115 REST OF ASIA PACIFIC: SOLVENT RECOVERY AND RECYCLING MARKET, BY END-USE INDUSTRY, 2020–2022 (USD MILLION)
- TABLE 116 REST OF ASIA PACIFIC: SOLVENT RECOVERY AND RECYCLING MARKET, BY END-USE INDUSTRY, 2023–2028 (USD MILLION)
- TABLE 117 REST OF ASIA PACIFIC: SOLVENT RECOVERY AND RECYCLING MARKET, BY END-USE INDUSTRY, 2020–2022 (KILOTON)
- TABLE 118 REST OF ASIA PACIFIC: SOLVENT RECOVERY AND RECYCLING MARKET, BY END-USE INDUSTRY, 2023–2028 (KILOTON)
- TABLE 119 MIDDLE EAST & AFRICA: SOLVENT RECOVERY AND RECYCLING MARKET, BY COUNTRY, 2020–2022 (USD MILLION)
- TABLE 120 MIDDLE EAST & AFRICA: SOLVENT RECOVERY AND RECYCLING MARKET, BY COUNTRY, 2023–2028 (USD MILLION)
- TABLE 121 MIDDLE EAST & AFRICA: SOLVENT RECOVERY AND RECYCLING MARKET, BY COUNTRY, 2020–2022 (KILOTON)
- TABLE 122 MIDDLE EAST & AFRICA: SOLVENT RECOVERY AND RECYCLING MARKET, BY COUNTRY, 2023–2028 (KILOTON)
- TABLE 123 MIDDLE EAST & AFRICA: SOLVENT RECOVERY AND RECYCLING MARKET, BY SOLVENT TYPE, 2020–2022 (USD MILLION)
- TABLE 124 MIDDLE EAST & AFRICA: SOLVENT RECOVERY AND RECYCLING MARKET, BY SOLVENT TYPE, 2023–2028 (USD MILLION)
- TABLE 125 MIDDLE EAST & AFRICA: SOLVENT RECOVERY AND RECYCLING MARKET, BY SOLVENT TYPE, 2020–2022 (KILOTON)
- TABLE 126 MIDDLE EAST & AFRICA: SOLVENT RECOVERY AND RECYCLING MARKET, BY SOLVENT TYPE, 2023–2028 (KILOTON)
- TABLE 127 MIDDLE EAST & AFRICA: SOLVENT RECOVERY AND RECYCLING MARKET, BY END-USE INDUSTRY, 2020–2022 (USD MILLION)
- TABLE 128 MIDDLE EAST & AFRICA: SOLVENT RECOVERY AND RECYCLING MARKET, BY END-USE INDUSTRY, 2023–2028 (USD MILLION)
- TABLE 129 MIDDLE EAST & AFRICA: SOLVENT RECOVERY AND RECYCLING MARKET, BY END-USE INDUSTRY, 2020–2022 (KILOTON)
- TABLE 130 MIDDLE EAST & AFRICA: SOLVENT RECOVERY AND RECYCLING MARKET, BY END-USE INDUSTRY, 2023–2028 (KILOTON)
- TABLE 131 GCC COUNTRIES: SOLVENT RECOVERY AND RECYCLING MARKET, BY END-USE INDUSTRY, 2020–2022 (USD MILLION)
- TABLE 132 GCC COUNTRIES: SOLVENT RECOVERY AND RECYCLING MARKET, BY END-USE INDUSTRY, 2023–2028 (USD MILLION)
- TABLE 133 GCC COUNTRIES: SOLVENT RECOVERY AND RECYCLING MARKET, BY END-USE INDUSTRY, 2020–2022 (KILOTON)
- TABLE 134 GCC COUNTRIES: SOLVENT RECOVERY AND RECYCLING MARKET, BY END-USE INDUSTRY, 2023–2028 (KILOTON)
- TABLE 135 SAUDI ARABIA: SOLVENT RECOVERY AND RECYCLING MARKET, BY END-USE INDUSTRY, 2020–2022 (USD MILLION)
- TABLE 136 SAUDI ARABIA: SOLVENT RECOVERY AND RECYCLING MARKET, BY END-USE INDUSTRY, 2023–2028 (USD MILLION)
- TABLE 137 SAUDI ARABIA: SOLVENT RECOVERY AND RECYCLING MARKET, BY END-USE INDUSTRY, 2020–2022 (KILOTON)
- TABLE 138 SAUDI ARABIA: SOLVENT RECOVERY AND RECYCLING MARKET, BY END-USE INDUSTRY, 2023–2028 (KILOTON)
- TABLE 139 UAE: SOLVENT RECOVERY AND RECYCLING MARKET, BY END-USE INDUSTRY, 2020–2022 (USD MILLION)
- TABLE 140 UAE: SOLVENT RECOVERY AND RECYCLING MARKET, BY END-USE INDUSTRY, 2023–2028 (USD MILLION)
- TABLE 141 UAE: SOLVENT RECOVERY AND RECYCLING MARKET, BY END-USE INDUSTRY, 2020–2022 (KILOTON)
- TABLE 142 UAE: SOLVENT RECOVERY AND RECYCLING MARKET, BY END-USE INDUSTRY, 2023–2028 (KILOTON)
- TABLE 143 REST OF GCC: SOLVENT RECOVERY AND RECYCLING MARKET, BY END-USE INDUSTRY, 2020–2022 (USD MILLION)
- TABLE 144 REST OF GCC: SOLVENT RECOVERY AND RECYCLING MARKET, BY END-USE INDUSTRY, 2023–2028 (USD MILLION)
- TABLE 145 REST OF GCC: SOLVENT RECOVERY AND RECYCLING MARKET, BY END-USE INDUSTRY, 2020–2022 (KILOTON)
- TABLE 146 REST OF GCC: SOLVENT RECOVERY AND RECYCLING MARKET, BY END-USE INDUSTRY, 2023–2028 (KILOTON)
- TABLE 147 SOUTH AFRICA: SOLVENT RECOVERY AND RECYCLING MARKET, BY END-USE INDUSTRY, 2020–2022 (USD MILLION)
- TABLE 148 SOUTH AFRICA: SOLVENT RECOVERY AND RECYCLING MARKET, BY END-USE INDUSTRY, 2023–2028 (USD MILLION)
- TABLE 149 SOUTH AFRICA: SOLVENT RECOVERY AND RECYCLING MARKET, BY END-USE INDUSTRY, 2020–2022 (KILOTON)
- TABLE 150 SOUTH AFRICA: SOLVENT RECOVERY AND RECYCLING MARKET, BY END-USE INDUSTRY, 2023–2028 (KILOTON)
- TABLE 151 REST OF MIDDLES EAST & AFRICA: SOLVENT RECOVERY AND RECYCLING MARKET, BY END-USE INDUSTRY, 2020–2022 (USD MILLION)
- TABLE 152 REST OF MIDDLES EAST & AFRICA: SOLVENT RECOVERY AND RECYCLING MARKET, BY END-USE INDUSTRY, 2023–2028 (USD MILLION)
- TABLE 153 REST OF MIDDLES EAST & AFRICA: SOLVENT RECOVERY AND RECYCLING MARKET, BY END-USE INDUSTRY, 2020–2022 (KILOTON)
- TABLE 154 REST OF MIDDLES EAST & AFRICA: SOLVENT RECOVERY AND RECYCLING MARKET, BY END-USE INDUSTRY, 2023–2028 (KILOTON)
- TABLE 155 SOUTH AMERICA: SOLVENT RECOVERY AND RECYCLING MARKET, BY COUNTRY, 2020–2022 (USD MILLION)
- TABLE 156 SOUTH AMERICA: SOLVENT RECOVERY AND RECYCLING MARKET, BY COUNTRY, 2023–2028 (USD MILLION)
- TABLE 157 SOUTH AMERICA: SOLVENT RECOVERY AND RECYCLING MARKET, BY COUNTRY, 2020–2022 (KILOTON)
- TABLE 158 SOUTH AMERICA: SOLVENT RECOVERY AND RECYCLING MARKET, BY COUNTRY, 2023–2028 (KILOTON)
- TABLE 159 SOUTH AMERICA: SOLVENT RECOVERY AND RECYCLING MARKET, BY SOLVENT TYPE, 2020–2022 (USD MILLION)
- TABLE 160 SOUTH AMERICA: SOLVENT RECOVERY AND RECYCLING MARKET, BY SOLVENT TYPE, 2023–2028 (USD MILLION)
- TABLE 161 SOUTH AMERICA: SOLVENT RECOVERY AND RECYCLING MARKET, BY SOLVENT TYPE, 2020–2022 (KILOTON)
- TABLE 162 SOUTH AMERICA: SOLVENT RECOVERY AND RECYCLING MARKET, BY SOLVENT TYPE, 2023–2028 (KILOTON)
- TABLE 163 SOUTH AMERICA: SOLVENT RECOVERY AND RECYCLING MARKET, BY END-USE INDUSTRY, 2020–2022 (USD MILLION)
- TABLE 164 SOUTH AMERICA: SOLVENT RECOVERY AND RECYCLING MARKET, BY END-USE INDUSTRY, 2023–2028 (USD MILLION)
- TABLE 165 SOUTH AMERICA: SOLVENT RECOVERY AND RECYCLING MARKET, BY END-USE INDUSTRY, 2020–2022 (KILOTON)
- TABLE 166 SOUTH AMERICA: SOLVENT RECOVERY AND RECYCLING MARKET, BY END-USE INDUSTRY, 2023–2028 (KILOTON)
- TABLE 167 BRAZIL: SOLVENT RECOVERY AND RECYCLING MARKET, BY END-USE INDUSTRY, 2020–2022 (USD MILLION)
- TABLE 168 BRAZIL: SOLVENT RECOVERY AND RECYCLING MARKET, BY END-USE INDUSTRY, 2023–2028 (USD MILLION)
- TABLE 169 BRAZIL: SOLVENT RECOVERY AND RECYCLING MARKET, BY END-USE INDUSTRY, 2020–2022 (KILOTON)
- TABLE 170 BRAZIL: SOLVENT RECOVERY AND RECYCLING MARKET, BY END-USE INDUSTRY, 2023–2028 (KILOTON)
- TABLE 171 ARGENTINA: SOLVENT RECOVERY AND RECYCLING MARKET, BY END-USE INDUSTRY, 2020–2022 (USD MILLION)
- TABLE 172 ARGENTINA: SOLVENT RECOVERY AND RECYCLING MARKET, BY END-USE INDUSTRY, 2023–2028 (USD MILLION)
- TABLE 173 ARGENTINA: SOLVENT RECOVERY AND RECYCLING MARKET, BY END-USE INDUSTRY, 2020–2022 (KILOTON)
- TABLE 174 ARGENTINA: SOLVENT RECOVERY AND RECYCLING MARKET, BY END-USE INDUSTRY, 2023–2028 (KILOTON)
- TABLE 175 REST OF SOUTH AMERICA: SOLVENT RECOVERY AND RECYCLING MARKET, BY END-USE INDUSTRY, 2020–2022 (USD MILLION)
- TABLE 176 REST OF SOUTH AMERICA: SOLVENT RECOVERY AND RECYCLING MARKET, BY END-USE INDUSTRY, 2023–2028 (USD MILLION)
- TABLE 177 REST OF SOUTH AMERICA: SOLVENT RECOVERY AND RECYCLING MARKET, BY END-USE INDUSTRY, 2020–2022 (KILOTON)
- TABLE 178 REST OF SOUTH AMERICA: SOLVENT RECOVERY AND RECYCLING MARKET, BY END-USE INDUSTRY, 2023–2028 (KILOTON)
- TABLE 179 DEGREE OF COMPETITIVE RIVALRY
- TABLE 180 END-USE INDUSTRY FOOTPRINT (26 COMPANIES)
- TABLE 181 REGION FOOTPRINT (26 COMPANIES)
- TABLE 182 OVERALL COMPANY FOOTPRINT (26 COMPANIES)
- TABLE 183 DETAILED LIST OF KEY STARTUPS/SMES
- TABLE 184 COMPETITIVE BENCHMARKING OF KEY PLAYERS [STARTUPS/SMES]
- TABLE 185 PRODUCT LAUNCHES, 2019–2023
- TABLE 186 DEALS, 2019–2023
- TABLE 187 VEOLIA: COMPANY OVERVIEW
- TABLE 188 VEOLIA: PRODUCT OFFERINGS
- TABLE 189 VEOLIA: DEALS
- TABLE 190 CYCLESOLV LLC: COMPANY OVERVIEW
- TABLE 191 CYCLESOLV LLC: PRODUCT OFFERINGS
- TABLE 192 CYCLESOLV LLC: DEALS
- TABLE 193 TRADEBE ENVIRONMENTAL SERVICES: COMPANY OVERVIEW
- TABLE 194 TRADEBE ENVIRONMENTAL SERVICES: PRODUCT OFFERINGS
- TABLE 195 TRADEBE ENVIRONMENTAL SERVICES: DEALS
- TABLE 196 CLEAN HARBORS: COMPANY OVERVIEW
- TABLE 197 CLEAN HARBORS: PRODUCT OFFERINGS
- TABLE 198 CLEAN HARBORS: DEALS
- TABLE 199 INDAVER: COMPANY OVERVIEW
- TABLE 200 INDAVER: PRODUCT OFFERINGS
- TABLE 201 INDAVER: DEALS
- TABLE 202 CBG BIOTECH: COMPANY OVERVIEW
- TABLE 203 CBG BIOTECH: PRODUCT OFFERINGS
- TABLE 204 CBG BIOTECH: PRODUCT LAUNCHES
- TABLE 205 OFRU RECYCLING: COMPANY OVERVIEW
- TABLE 206 OFRU RECYCLING: PRODUCT OFFERINGS
- TABLE 207 MARATEK ENVIRONMENTAL INC.: COMPANY OVERVIEW
- TABLE 208 MARATEK ENVIRONMENTAL INC.: PRODUCT OFFERINGS
- TABLE 209 NIPPON REFINE CO., LTD: COMPANY OVERVIEW
- TABLE 210 NIPPON REFINE CO., LTD.: PRODUCT OFFERINGS
- TABLE 211 CLEANPLANET CHEMICAL: COMPANY OVERVIEW
- TABLE 212 CLEANPLANET CHEMICAL: PRODUCT OFFERINGS
- TABLE 213 GEA: COMPANY OVERVIEW
- TABLE 214 GEA: PRODUCT OFFERINGS
- TABLE 215 CHEMOXY INTERNATIONAL LTD.: COMPANY OVERVIEW
- TABLE 216 SHINKO ORGANIC CHEMICAL INDUSTRY LTD.: COMPANY OVERVIEW
- TABLE 217 IST PURE: COMPANY OVERVIEW
- TABLE 218 KOCH MODULAR PROCESS SYSTEMS, LLC: COMPANY OVERVIEW
- TABLE 219 ALAQUA INC.: COMPANY OVERVIEW
- TABLE 220 SOLVENT WASTE MANAGEMENT INC.: COMPANY OVERVIEW
- TABLE 221 TIANLONG ENVIRONMENTAL ENGINEERING CO., LTD: COMPANY OVERVIEW
- TABLE 222 ENVIRO TECH INTERNATIONAL INC.: COMPANY OVERVIEW
- TABLE 223 RENERGIES: COMPANY OVERVIEW
- TABLE 224 NEXTGEN ENVIRO SYSTEMS INC.: COMPANY OVERVIEW
- TABLE 225 LN CHEM: COMPANY OVERVIEW
- TABLE 226 PRI: COMPANY OVERVIEW
- TABLE 227 SOLUTEX LTD: COMPANY OVERVIEW
- TABLE 228 JACOBI GROUP: COMPANY OVERVIEW
- TABLE 229 BEST TECHNOLOGY INC.: COMPANY OVERVIEW
- FIGURE 1 RESEARCH DESIGN
- FIGURE 2 MARKET SIZE ESTIMATION
- FIGURE 3 TOP-DOWN APPROACH
- FIGURE 4 BOTTOM-UP APPROACH
- FIGURE 5 DATA TRIANGULATION
- FIGURE 6 DMF TO BE LARGEST SOLVENT TYPE BETWEEN 2023 AND 2028
- FIGURE 7 ASIA PACIFIC TO LEAD SOLVENT RECOVERY AND RECYCLING MARKET, 2023–2028
- FIGURE 8 PAINTS & COATINGS SEGMENT TO DOMINATE SOLVENT RECOVERY AND RECYCLING MARKET
- FIGURE 9 EMERGING ECONOMIES TO OFFER ATTRACTIVE OPPORTUNITIES DURING FORECAST PERIOD
- FIGURE 10 DMF SOLVENT TYPE TO LEAD MARKET DURING FORECAST PERIOD
- FIGURE 11 PAINTS & COATINGS SEGMENT TO LEAD MARKET DURING FORECAST PERIOD
- FIGURE 12 MARKET IN INDIA TO REGISTER HIGHEST CAGR FROM 2023 TO 2028
- FIGURE 13 DRIVERS, RESTRAINTS, OPPORTUNITIES, AND CHALLENGES IN SOLVENT RECOVERY AND RECYCLING MARKET
- FIGURE 14 VALUE CHAIN ANALYSIS
- FIGURE 15 AVERAGE SELLING PRICE OF KEY PLAYERS, BY END-USE INDUSTRY (USD/KG)
- FIGURE 16 AVERAGE SELLING PRICE TREND, BY REGION (USD/KG)
- FIGURE 17 SOLVENT IMPORT, BY KEY COUNTRY, 2018–2022 (USD MILLION)
- FIGURE 18 SOLVENT EXPORT, KEY COUNTRY, 2018–2022 (USD MILLION)
- FIGURE 19 ECOSYSTEM/MARKET MAP: SOLVENT RECOVERY AND RECYCLING MARKET
- FIGURE 20 TRENDS IN SOLVENT RECOVERY AND RECYCLING MARKET
- FIGURE 21 PORTER’S FIVE FORCES ANALYSIS
- FIGURE 22 GRANTED PATENTS
- FIGURE 23 NUMBER OF PATENTS YEAR-WISE FROM 2012 TO 2022
- FIGURE 24 TOP JURISDICTION, BY DOCUMENT
- FIGURE 25 TOP 10 PATENT APPLICANTS
- FIGURE 26 INFLUENCE OF STAKEHOLDERS ON BUYING PROCESS FOR TOP 3 APPLICATIONS
- FIGURE 27 KEY BUYING CRITERIA FOR TOP 3 APPLICATIONS
- FIGURE 28 CRESOL SOLVENT TYPE TO GROW AT HIGHEST CAGR DURING FORECAST PERIOD (USD MILLION)
- FIGURE 29 PAINTS & COATINGS END-USE INDUSTRY TO LEAD MARKET DURING FORECAST PERIOD
- FIGURE 30 ASIA PACIFIC TO BE FASTEST-GROWING MARKET DURING FORECAST PERIOD
- FIGURE 31 NORTH AMERICA: SOLVENT RECOVERY AND RECYCLING MARKET SNAPSHOT
- FIGURE 32 ASIA PACIFIC: SOLVENT RECOVERY AND RECYCLING MARKET SNAPSHOT
- FIGURE 33 OVERVIEW OF STRATEGIES ADOPTED BY SOLVENT RECOVERY AND RECYCLING COMPANIES
- FIGURE 34 REVENUE ANALYSIS OF TOP 3 KEY PLAYERS (2020–2022)
- FIGURE 35 SHARE OF LEADING COMPANIES IN SOLVENT RECOVERY AND RECYCLING MARKET, (2022)
- FIGURE 36 COMPANY EVALUATION MATRIX, 2022
- FIGURE 37 PRODUCT FOOTPRINT (26 COMPANIES)
- FIGURE 38 STARTUP/SME EVALUATION MATRIX, 2022
- FIGURE 39 VEOLIA: COMPANY SNAPSHOT
- FIGURE 40 CLEAN HARBORS: COMPANY SNAPSHOT
- FIGURE 41 GEA: COMPANY SNAPSHOT
The study involved four major activities in estimating the current market size for solvent recovery and recycling. Exhaustive secondary research was done to collect information on the market, peer market, and parent market. The next step was to validate these findings, assumptions, and sizing with industry experts across the value chain through primary research. Both top-down and bottom-up approaches were employed to estimate the complete market size. After that, the market breakdown and data triangulation methodologies were used to estimate the market size of segments and sub-segments.
Secondary Research
In the secondary research process, various sources have been referred to for identifying and collecting information for this study. The secondary sources include annual reports, press releases, and investor presentations of companies; white papers, journals, and certified publications; and articles from recognized authors, directories, and databases. Secondary data has been collected and analyzed to arrive at the overall market size, which is further validated by primary research. Secondary research has been used to obtain key information about the value chain of the industry, monetary chain of the market, the total pool of key players, market classification and segmentation according to industry trends to the bottom-most level, and regional markets. It was also used to obtain information about the key developments from a market-oriented perspective.
Primary Research
The solvent recovery and recycling market involves a variety of stakeholders across the value chain, including raw material suppliers, manufacturers, and end-users. For this study, both the supply and demand sides of the market were interviewed to gather qualitative and quantitative information. Key opinion leaders from various end-use sectors were interviewed from the demand side, while manufacturers and associations were interviewed from the supply side.
Primary interviews helped to gather insights on market statistics, revenue data, market breakdowns, market size estimations, market forecasting, and data triangulation. Primary research also helped to identify trends related to material type, component, end-use industries, and region. C-level executives from the demand side, such as CIOs, CTOs, and CSOs, were interviewed to understand their perspective on suppliers, products, and component providers, which will affect the overall market.
Breakdown of Primaries
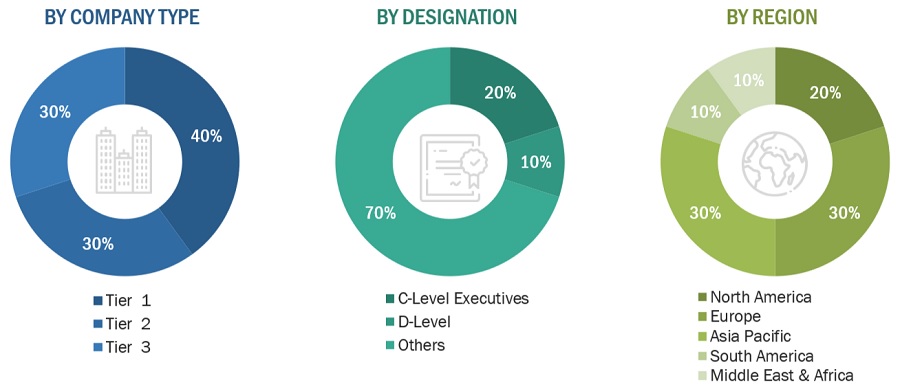
Note: Tier 1, Tier 2, and Tier 3 companies are classified based on their market revenue in 2022 available in the public domain, product portfolios, and geographical presence.
Other designations include sales representatives, production heads, and technicians.
To know about the assumptions considered for the study, download the pdf brochure
Market Size Estimation
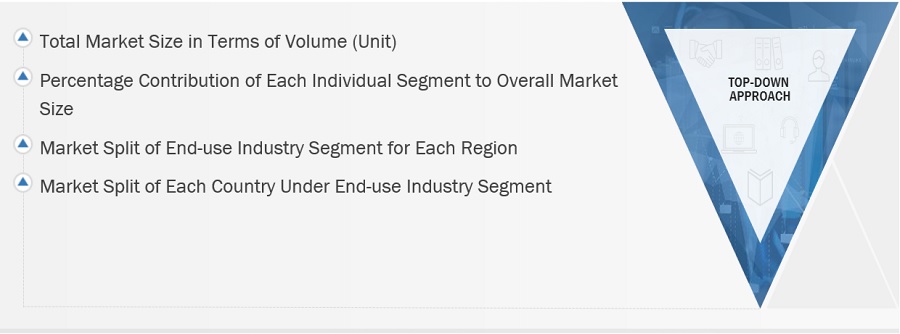
- The top-down approach was used to estimate and validate the size of various submarkets for solvent recovery and recycling for each region. The research methodology used to estimate the market size included the following steps:
- The key players in the industry have been identified through extensive secondary research.
- The supply chain of the industry has been determined through primary and secondary research.
- The global market was then segmented into five major regions and validated by industry experts.
- All percentage shares, splits, and breakdowns based on type, end-use industry, and country were determined using secondary sources and verified through primary sources.
All possible parameters that affect the markets covered in this research study were accounted for, viewed in extensive detail, verified through primary research, and analyzed to get the final quantitative and qualitative data. This data was consolidated and added with detailed inputs and analysis and presented in this report.
Solvent Recovery And Recycling Market: Bottum-Up Approach
Source: Secondary Research, Interviews with Experts, and MarketsandMarkets Analysis
To know about the assumptions considered for the study, Request for Free Sample Report
Solvent Recovery And Recycling Market: Top-Down Approach
Source: Secondary Research, Interviews with Experts, and MarketsandMarkets Analysis
Data Triangulation
After arriving at the overall market size—using the market size estimation process explained above—the market was split into several segments and sub-segments. To complete the overall market engineering process and arrive at the exact statistics of each market segment and sub-segment, the data triangulation, and market breakdown procedures were employed, wherever applicable. The data was triangulated by studying various factors and trends from both the demand and supply of solvent recovery and recycling and their applications.
MARKET DEFINITION
Solvent recovery and recycling involve the process of extracting and reusing useful materials from waste or by-product solvents generated during manufacturing. This process is a form of waste reduction and is widely used to reduce waste generation and minimize the need to produce new solvents. Solvent recovery typically uses a multi-stage distillation process to separate solvents into their components at lower-than-boiling point temperatures, resulting in recovered solvents that are virtually indistinguishable from virgin solvent products. The recovered solvents can then be repurposed, reducing the need to produce new solvents and eliminating a large amount of waste, while also removing potentially hazardous substances from the environment. The solvent recycling process can be performed using a variety of technologies, including distillation, and the requalified recovered solvents can be used for manufacturing different products or solutions, making the process both cost-effective and environmentally friendly.
STAKEHOLDERS
- Manufacturers of solvent recovery and recycling systems
- Manufacturers In End-use Industries
- Traders, Distributors, and Suppliers
- Regional Manufacturers’ Associations
- Government & Regional Agencies and Research Organizations
The main objectives of this study are as follows:
- To analyze and forecast the size of the solvent recovery and recycling market in terms of value and volume.
- To provide detailed information about the key factors (drivers, restraints, opportunities, and challenges) influencing the market
- To analyze and forecast the market by solvent type, end-use industry, and region.
- To forecast the size of the market with respect to five regions: Asia Pacific, Europe, North America, South America, and the Middle East & Africa, along with their key countries
- To strategically analyze micromarkets1 with respect to individual trends, growth prospects, and their contribution to the overall market
- To analyze opportunities in the market for stakeholders and provide a competitive landscape for the market leaders.
- To analyze competitive developments in the market, such as investment & expansion, joint venture, partnership, and merger & acquisition
- To strategically profile key players and comprehensively analyze their market shares and core competencies2.
- Notes: Micromarkets1 are the sub-segments of the solvent recovery and recycling market included in the report.
- Core competencies2 of companies are determined in terms of their key developments, SWOT analysis, and key strategies adopted by them to sustain in the market.
Available Customizations:
MarketsandMarkets offers the following customizations for this market report.
- Additional country-level analysis of solvent recovery and recycling market
- Profiling of additional market players (up to 3)
Growth opportunities and latent adjacency in Solvent Recovery and Recycling Market