Smart Grid Analytics Market Size, Share, Growth Analysis, by Offering (Meter analytics, Reliability Analytics, Services), Application (AMI, Load Forecasting, Demand Response, Grid Optimization), Analytics Type and Region - Global Industry Forecast to 2029
[323 Pages Report] The smart grid analytics market is witnessing a rapid growth trajectory, with estimates projecting a substantial market value surge from approximately USD 7.9 billion in 2024 to USD 14.3 billion by 2029. This phenomenal upward trend, characterized by a remarkable CAGR of 12.4% between 2024–2029, is driven by enhanced adoption of smart grid metering solutions, growing need to upgrade aging power grid systems, and increasing drive towards energy-efficient and sustainable technologies. Governments worldwide are actively supporting the deployment of smart grid technologies through various initiatives and policies. Additionally, collaborations between governments, utilities, and technology providers are fostering innovation in smart grid analytics, ensuring continuous improvements in grid performance and resilience.
To know about the assumptions considered for the study, Request for Free Sample Report
To know about the assumptions considered for the study, download the pdf brochure
Market Dynamics
Driver: Growing demand for energy efficiency and sustainability
Growing demand for energy efficiency and sustainability is driving the smart grid analytics market as utilities and consumers alike seek to optimize energy usage and reduce environmental impact. Smart grid analytics enable real-time monitoring and management of energy consumption, leading to more efficient operations and reduced wastage. They also support the integration of renewable energy sources, enhancing grid stability and promoting sustainable practices. Regulatory pressures and incentives for reducing carbon footprints further compel utilities to adopt these advanced analytics solutions. Consequently, the push for more sustainable energy practices aligns with the capabilities of smart grid analytics, fostering their widespread adoption and market growth.
Restraint: High initial investment and implementation costs
High initial investment and implementation costs in the smart grid analytics market stem from the need for advanced hardware, software, and skilled personnel to deploy and maintain these systems. Utilities must invest in upgrading existing infrastructure, integrating new technologies, and training staff, which can be financially burdensome, especially for smaller entities. Moreover, the complexity of integrating various data sources and ensuring interoperability between different systems adds to the costs. These financial and technical barriers can delay or limit the adoption of smart grid analytics, particularly in regions or organizations with constrained budgets or less access to capital, hindering widespread implementation.
Opportunity: Boost to the growing smart city initiatives
Smart grid analytics significantly enhance the growth of smart city initiatives by optimizing energy distribution, improving grid reliability, and facilitating the integration of renewable energy sources. These analytics enable real-time monitoring and predictive maintenance of grid infrastructure, reducing downtime and operational costs. By providing detailed insights into energy consumption patterns, they help cities implement more efficient energy management practices, support the development of electric vehicle infrastructure, and enhance overall sustainability. Furthermore, smart grid analytics enable better demand response strategies, enhancing the ability of cities to balance energy supply and demand dynamically, thereby supporting the broader goals of smart city development and environmental sustainability.
Challenge: Data management complexity associated with smart grids
Data management complexity in smart grids arises from the vast amount of data generated by diverse sources such as smart meters, sensors, and distributed energy resources. This data is heterogeneous, coming in various formats and requiring integration and real-time processing to be useful. Ensuring data accuracy, consistency, and security is challenging, especially with the need for interoperability across different systems and platforms. Additionally, advanced analytics require robust data storage and management solutions to handle the volume and velocity of data, necessitating significant investment in infrastructure and expertise.
Smart grid analytics Market Ecosystem
By software type, operational analytics segment to account for the largest market share in 2024
Operational analytics software will command the largest market share in the smart grid analytics market due to its critical role in enhancing grid performance and efficiency. This software enables real-time monitoring, data analysis, and optimization of grid operations, helping utilities to quickly identify and resolve issues, reduce outages, and improve energy distribution. The growing complexity of modern grids, driven by the integration of renewable energy sources and distributed energy resources, necessitates robust operational analytics to ensure reliability and resilience, making it indispensable for utilities aiming to maintain high service standards and regulatory compliance.
By deployment mode, cloud deployment mode is slated to register the highest growth rate during the forecast period.
The cloud deployment mode of the smart grid analytics market is set for the fastest growth due to its scalability, cost-effectiveness, and ease of implementation. Cloud solutions enable utilities to quickly deploy advanced analytics without the need for significant upfront investments in hardware. They offer flexible, on-demand access to powerful computing resources and data storage, facilitating real-time analytics and remote monitoring. Additionally, cloud-based platforms are continuously updated with the latest features and security measures, allowing utilities to stay ahead of technological advancements and regulatory requirements efficiently.
By organization size, large enterprises segment will hold the largest market share in 2024.
The large enterprises segment will dominate the smart grid analytics market due to their substantial financial resources, extensive infrastructure, and ability to invest in advanced technologies. These enterprises require robust analytics solutions to manage complex, large-scale grid operations efficiently. Their need for enhanced grid reliability, regulatory compliance, and improved operational efficiency drives significant investments in smart grid analytics. Additionally, large enterprises often lead in adopting cutting-edge technologies, further cementing their dominant market share as they implement comprehensive, integrated analytics solutions to optimize their grid systems.
By region, Asia Pacific is set to experience the fastest growth rate during the forecast period.
The Asia Pacific region is projected to experience the fastest growth in the smart grid analytics market due to several key factors. Rapid urbanization and industrialization across countries like China, India, Japan, and South Korea are driving substantial increases in energy demand. Governments in the region are investing heavily in smart grid technologies to modernize aging infrastructure, improve energy efficiency, and integrate renewable energy sources. Additionally, supportive regulatory frameworks and initiatives aimed at reducing carbon emissions are encouraging the adoption of advanced grid analytics. The region's focus on technological innovation and the growing number of smart city projects further contribute to the accelerated adoption of smart grid analytics solutions.
Key Market Players
The smart grid analytics solution and service providers have implemented several types of organic and inorganic growth strategies, such as new product launches, product upgrades, partnerships, and agreements, business expansions, and mergers and acquisitions to strengthen their offerings in the market. Some major players in the smart grid analytics market include Siemens (Germany), Oracle (US), GE Vernova (US), Schneider Electric (US), Landis+Gyr (Switzerland), along with SMEs and startups such as Autogrid Systems (US), eSmart Systems (Norway), Innwatts (US), Amperon (US), and Kevala (US).
Want to explore hidden markets that can drive new revenue in Smart Grid Analytics Market?
Scope of the Report
Want to explore hidden markets that can drive new revenue in Smart Grid Analytics Market?
Report Metrics |
Details |
Market size available for years |
2019–2029 |
Base year considered |
2023 |
Forecast period |
2024–2029 |
Forecast units |
USD (Billion) |
Segments Covered |
Offering, Organization Size, Application, Anlytics Type, and Region |
Geographies covered |
North America, Europe, Asia Pacific, Middle East & Africa, and Latin America |
List of Companies covered |
Siemens (Germany), IBM (US), Oracle (US), Schneider Electric (France), GE Vernova (US), Landis+Gyr (Switzerland), Capgemini (France), Infosys (India), SAP (Germany), Honeywell (US), Accenture (Ireland), SAS Institute (US), Itron (US), Autogrid Systems (US), Hive Power (Switzerland), eSmart Systems (Norway), SteamaCo (UK), Grid4C (US), Globema (Poland), SparkMeter (US), Innwatts (US), Amperon (US), Kevala (US), GridPoint (US), Safegrid (Finland), Sentient Energy (US). |
This research report categorizes the smart grid analytics market based on offering, organization size, application, analytics type, and region:
By Offering:
-
Software
-
Software, By Type
- Meter Analytics
- Operational Analytics
- Reliability Analytics
-
Software, By Deployment Mode
- Cloud
- On-Premises
-
Software, By Type
-
Services
-
Professional Services
- Training & Consulting Services
- System Integration & Deployment Services
- Support & Maintenance Services
- Managed Services
-
Professional Services
By Organization Size
- Small and Medium Businesses (SMBs)
- Large Enterprises
By Application
- AMI Analytics
- Load Forecasting and Demand Response
- Grid Optimization, Monitoring, and Management
- Distributed Energy Resources Management Systems (DERMS)
- Predictive Maintenance
- Energy Theft Detection and Cybersecurity
- Voltage, Frequency, and Stability Management
- Customer Engagement and Analytics
- Visual Analytics
- Outage Management and Fault Detection
- Other Applications
By Vertical
- Descriptive Analytics
- Diagnostic Analytics
- Predictive Analytics
- Prescriptive Analytics
By Region
-
North America
- United States
- Canada
-
Europe
- UK
- Germany
- France
- Italy
- Spain
- Rest of Europe
-
Asia Pacific
- China
- India
- Japan
- South Korea
- Australia and New Zealand (ANZ)
- Rest of Asia Pacific
-
Middle East and Africa
- Saudi Arabia
- UAE
- South Africa
- Rest of Middle East and Africa
-
Latin America
- Brazil
- Mexico
- Rest of Latin America
Recent Developments:
- In May 2024, GE Vernova launched Autonomous Inspection, a cloud-based computer vision software solution designed to automate the manual inspection and monitoring of industrial assets by utilizing image capture devices and artificial intelligence/machine learning (AI/ML) algorithms.
- In May 2024, Energinet signed an official partnership with Siemens Energy on a comprehensive expansion of the power grid in Western Denmark. By 2029, Denmark must quadruple its electricity generation from wind and solar power and use modern analytics and integrated technologies, with more to come in the following decades.
- In May 2024, Honeywell partnered with Enel North America to enhance building automation and demand response solutions for commercial and industrial organizations by using automation to control and regulate energy loads to help stabilize the power grid.
- In March 2024, Itron, Inc. expanded its Grid Edge Intelligence portfolio through the acquisition of Elpis Squared, an innovative provider of software and services for utility grid operations, effective immediately. The acquisition of Elpis Squared allows Itron to embed real-time, high-resolution grid edge data into the grid planning, operations, and engineering process – an industry first.
- In February 2024, SPAN and Landis+Gyr formed a strategic partnership to cost-effectively advance electrification, create grid flexibility, and build resilience. The partnership brings together two energy industry leaders to help utilities improve utilization of existing assets, unlock Distributed Energy Resource (DER) flexibility management, and enhance customer engagement.
- In February 2024, Itron, Inc. and Schneider Electric collaborated to improve energy and grid management for utilities as homeowners and businesses increasingly adopt distributed energy resources (DER)—like rooftop solar, battery energy storage, electric vehicles and microgrids—at the grid edge.
Frequently Asked Questions (FAQ):
What is Smart grid analytics?
Smart grid analytics refers to the application of advanced data analytics, artificial intelligence, and machine learning techniques to enhance the efficiency, reliability, and sustainability of electric power grids. It involves the analysis of large volumes of data generated by smart meters, sensors, and other grid components to optimize grid operations, predict equipment failures, and manage distributed energy resources effectively. Smart grid analytics enables utilities to improve grid performance, reduce operational costs, and meet regulatory requirements, thereby transforming traditional power grids into more intelligent and responsive systems.
What is the total CAGR expected to be recorded for the Smart grid analytics market during 2024-2029?
The Smart grid analytics market is expected to record a CAGR of 12.4% from 2024-2029.
How can smart grid analytics be used to integrate renewable energy sources?
Smart grid analytics facilitate the integration of renewable energy sources by providing real-time monitoring and forecasting of energy output, optimizing demand response strategies, and ensuring grid stability through predictive maintenance. These analytics also manage energy storage systems efficiently, storing excess renewable energy and dispatching it as needed. Additionally, smart grid analytics coordinate distributed energy resources and ensure regulatory compliance through accurate reporting of renewable energy usage. These capabilities enable a smoother integration and maximization of renewable energy within the grid, promoting sustainability and resilience.
Which are the key drivers supporting the growth of the smart grid analytics market?
The key factors driving the growth of the smart grid analytics market include rising importance of efficient and sustainable energy use, increasing focus on the replacement of old grid infrastructure, and proliferation of smart meter installations around the globe.
Which are the top 3 applications prevailing in the smart grid analytics market?
Grid optimization, monitoring, & management, distributed energy resources management systems, and load forecasting & demand responseare the top three applications in the smart grid analytics market. These applications are crucial for enhancing grid reliability and efficiency, integrating renewable energy sources, and balancing supply and demand. They enable real-time monitoring, predictive maintenance, and effective management of distributed energy resources, ensuring a resilient and sustainable energy grid.
Who are the key vendors in the smart grid analytics market?
Some major players in the smart grid analytics market include Siemens (Germany), IBM (US), Oracle (US), Schneider Electric (France), GE Vernova (US), Landis+Gyr (Switzerland), Capgemini (France), Infosys (India), SAP (Germany), Honeywell (US), Accenture (Ireland), SAS Institute (US), Itron (US), Autogrid Systems (US), Hive Power (Switzerland), eSmart Systems (Norway), SteamaCo (UK), Grid4C (US), Globema (Poland), SparkMeter (US), Innwatts (US), Amperon (US), Kevala (US), GridPoint (US), Safegrid (Finland), Sentient Energy (US). .
To speak to our analyst for a discussion on the above findings, click Speak to Analyst
Exclusive indicates content/data unique to MarketsandMarkets and not available with any competitors.
- 5.1 INTRODUCTION
-
5.2 MARKET DYNAMICSDRIVERS- Increase in adoption of smart meters to monitor energy consumption- Rise in number of aging grid infrastructure- Growth in demand for energy efficiency and sustainabilityRESTRAINTS- Shortage of skilled professionals- Interoperability constraints- High initial investment and implementation costsOPPORTUNITIES- Growth in smart city initiatives- Improved renewable energy integration- Enhanced demand response management (DRM)CHALLENGES- Data management complexity associated with smart grids- Cybersecurity threats- Lack of standardization in smart grid analytics landscape
-
5.3 SMART GRID COMMUNICATION NETWORK LEVELSWIDE AREA NETWORK (WAN)FIELD AREA NETWORK (FAN)HOME AREA NETWORK (HAN)
- 5.4 SUPPLY CHAIN ANALYSIS
-
5.5 ECOSYSTEM ANALYSISSMART GRID ANALYTICS SOFTWARE PROVIDERSSMART GRID ANALYTICS SERVICE PROVIDERSCYBERSECURITY SERVICE PROVIDERSSYSTEM INTEGRATORSEND USERSGOVERNMENT & REGULATORY BODIES
-
5.6 CASE STUDY ANALYSISTAMPA ELECTRIC USED ITRON’S EXPERTISE TO EXPLORE VALUE OF DISTRIBUTED INTELLIGENCEGEXA ENERGY PARTNERED WITH AUTOGRID TO OFFER NEW DEMAND RESPONSE PROGRAMS IN ERCOTAEM EDUCATED AND EMPOWERED CONSUMERS BY MAKING THEM ACTIVELY RESPONSIBLE FOR THEIR OWN ENERGY SAVINGSDATA ANALYTICS BY SIEMENS LED TO BETTER GRID LOAD PREDICTION FOR KONSTANT (NRGI)ORACLE UTILITIES NMS PROVIDED WITH MORE HOLISTIC VIEW OF NETWORK FOR BETTER DECISION-MAKING
-
5.7 TECHNOLOGY ANALYSISKEY TECHNOLOGIES- Advanced Metering Infrastructure (AMI)- Supervisory Control and Data Acquisition (SCADA) Systems- Distributed Energy Resource Management Systems (DERMS)- Big Data Analytics- Grid CybersecurityCOMPLEMENTARY TECHNOLOGIES- Internet of Things (IoT)- Blockchain- Geographical Information Systems (GIS)- Edge ComputingADJACENT TECHNOLOGIES- Advanced Demand Forecasting- Non-intrusive Load Monitoring (NILM)- Vehicle-to-Grid (V2G)- Energy Storage Systems
-
5.8 REGULATORY LANDSCAPEREGULATORY BODIES, GOVERNMENT AGENCIES, AND OTHER ORGANIZATIONSREGULATIONS: SMART GRID ANALYTICS- North America- Europe- Asia Pacific- Middle East & Africa- Latin America
-
5.9 PATENT ANALYSISMETHODOLOGYPATENTS FILED, BY DOCUMENT TYPEINNOVATION AND PATENT APPLICATIONS- Top 10 applicants in smart grid analytics market
-
5.10 PORTER’S FIVE FORCES ANALYSISTHREAT OF NEW ENTRANTSTHREAT OF SUBSTITUTESBARGAINING POWER OF SUPPLIERSBARGAINING POWER OF BUYERSINTENSITY OF COMPETITION RIVALRY
-
6.1 INTRODUCTIONOFFERING: SMART GRID ANALYTICS MARKET DRIVERS
-
6.2 SOFTWARESOFTWARE MARKET, BY TYPE- Meter Analytics- Operational Analytics- Reliability AnalyticsSOFTWARE MARKET, BY DEPLOYMENT MODE- Cloud- On-premises
-
6.3 SERVICESPROFESSIONAL SERVICES- Requirement assessment and customized implementation and assistance with deployment of smart grid analytics solutions- Training & consulting services- System integration & deployment services- Support & maintenance servicesMANAGED SERVICES- End-to-end management for smart grid analytics to help businesses focus on core competencies
-
7.1 INTRODUCTIONORGANIZATION SIZE: SMART GRID ANALYTICS MARKET DRIVERS
-
7.2 SMALL & MEDIUM BUSINESSESGROWING ADOPTION OF CLOUD-BASED SMART GRID ANALYTICS PLATFORMS AMONG SMBS
-
7.3 LARGE ENTERPRISESADVANCED DATA ANALYTICS AND AI TO ANALYZE VAST AMOUNTS OF DATA GENERATED BY SMART GRIDS
-
8.1 INTRODUCTIONAPPLICATION: SMART GRID ANALYTICS MARKET DRIVERS
-
8.2 AMI ANALYTICSENHANCING CUSTOMER ENGAGEMENT AND SATISFACTION BY UTILIZING ANALYTICS FOR SMART METERS
-
8.3 LOAD FORECASTING & DEMAND RESPONSEANTICIPATION OF DEMAND FLUCTUATIONS TO PREVENT GRID OVERLOADS AND REDUCE LIKELIHOOD OF BLACKOUTS
-
8.4 GRID OPTIMIZATION, MONITORING, AND MANAGEMENTHELPING UTILITIES MAINTAIN HIGH SERVICE RELIABILITY WHILE OPTIMIZING OPERATIONAL COSTS AND SUPPORTING ENVIRONMENTAL GOALS
-
8.5 DISTRIBUTED ENERGY RESOURCES MANAGEMENT SYSTEMSENABLING UTILITIES AND GRID OPERATORS TO MONITOR, CONTROL, AND OPTIMIZE PERFORMANCE OF THESE ENERGY SOURCES
-
8.6 PREDICTIVE MAINTENANCECOST OPTIMIZATION BY REDUCING NEED FOR EMERGENCY REPAIRS AND OPTIMIZING RESOURCE ALLOCATION
-
8.7 ENERGY THEFT DETECTION & CYBERSECURITYSWIFT RESPONSE TO THREATS, MITIGATION OF RISKS, AND IMPLEMENTATION OF ROBUST SECURITY MEASURES BY LEVERAGING ADVANCED ANALYTICS
-
8.8 VOLTAGE, FREQUENCY, AND STABILITY MANAGEMENTMAINTAINING RELIABILITY AND EFFICIENCY OF ELECTRICAL GRID BY EMPLOYING SMART GRID ANALYTICS
-
8.9 CUSTOMER ENGAGEMENT & ANALYTICSLEVERAGING ADVANCED DATA ANALYTICS TO GAIN INSIGHTS INTO CUSTOMER BEHAVIOR, PREFERENCES, AND ENERGY CONSUMPTION PATTERNS
-
8.10 VISUAL ANALYTICSNEED TO IDENTIFY PATTERNS, TRENDS, AND ANOMALIES IN ENERGY CONSUMPTION
-
8.11 OUTAGE MANAGEMENT & FAULT DETECTIONABILITY TO QUICKLY DETECT ANOMALIES, PINPOINT LOCATION OF FAULTS, AND PREDICT POTENTIAL FAILURES
- 8.12 OTHER APPLICATIONS
-
9.1 INTRODUCTIONANALYTICS TYPE: SMART GRID ANALYTICS MARKET DRIVERS
-
9.2 DESCRIPTIVE ANALYTICSLEVERAGING DATA AGGREGATION AND DATA MINING TECHNIQUES TO PROVIDE INSIGHTFUL SUMMARIES AND VISUALIZATIONS
-
9.3 DIAGNOSTIC ANALYTICSUNCOVERING ROOT CAUSES OF ISSUES SUCH AS POWER OUTAGES AND EQUIPMENT FAILURES WITH DIAGNOSTIC ANALYTICS
-
9.4 PREDICTIVE ANALYTICSENABLING FORECASTING OF ENERGY DEMAND, DETECTING ANOMALIES, AND PREVENTING FAILURES
-
9.5 PRESCRIPTIVE ANALYTICSPROVIDING SOPHISTICATED LEVEL OF DATA ANALYSIS FOR ACTIONABLE RECOMMENDATIONS
- 10.1 INTRODUCTION
-
10.2 NORTH AMERICANORTH AMERICA: SMART GRID ANALYTICS MARKET DRIVERSNORTH AMERICA: RECESSION IMPACTUS- Supportive government and regulatory environment to provide significant boost for deployment of smart grid technologiesCANADA
-
10.3 EUROPEEUROPE: SMART GRID ANALYTICS MARKET DRIVERSEUROPE: RECESSION IMPACTUK- Active investment by UK government as part of broader strategy to transition to low-carbon economyGERMANY- Energiewende (energy transition) policy aims to achieve renewable, efficient, and sustainable energy systemFRANCEITALYSPAINREST OF EUROPE
-
10.4 ASIA PACIFICASIA PACIFIC: SMART GRID ANALYTICS MARKET DRIVERSASIA PACIFIC: RECESSION IMPACTCHINA- Heavy government investment in smart grid technologies, including advanced analyticsINDIA- Urgent need to modernize aging energy infrastructure and meet rising energy demandsJAPANSOUTH KOREAAUSTRALIA & NEW ZEALANDREST OF ASIA PACIFIC
-
10.5 MIDDLE EAST & AFRICAMIDDLE EAST & AFRICA: SMART GRID ANALYTICS MARKET DRIVERSMIDDLE EAST & AFRICA: RECESSION IMPACTSAUDI ARABIA- Efforts toward enhancing energy efficiency, reducing carbon emissions, and incorporating more renewable energy sourcesUAESOUTH AFRICAREST OF MIDDLE EAST & AFRICA
-
10.6 LATIN AMERICALATIN AMERICA: SMART GRID ANALYTICS MARKET DRIVERSLATIN AMERICA: RECESSION IMPACTBRAZIL- Proactive modernizing of electricity infrastructure to improve efficiency, reliability, and sustainabilityMEXICOREST OF LATIN AMERICA
- 11.1 OVERVIEW
- 11.2 KEY PLAYER STRATEGIES
- 11.3 REVENUE ANALYSIS
- 11.4 MARKET SHARE ANALYSIS
-
11.5 COMPANY EVALUATION MATRIX: KEY PLAYERS, 2023STARSEMERGING LEADERSPERVASIVE PLAYERSPARTICIPANTSCOMPANY FOOTPRINT: KEY PLAYERS, 2023- Company Footprint- Regional Footprint- Offering Footprint- Application Footprint- Analytics Type Footprint
-
11.6 COMPANY EVALUATION MATRIX: STARTUPS/SMES, 2023PROGRESSIVE COMPANIESRESPONSIVE COMPANIESDYNAMIC COMPANIESSTARTING BLOCKSCOMPETITIVE BENCHMARKING: STARTUPS/SMES, 2023- Detailed List of Key Startups/SMEs- Competitive Benchmarking of Key Startups/SMEs
-
11.7 COMPETITIVE SCENARIO AND TRENDSPRODUCT LAUNCHES AND ENHANCEMENTSDEALS
- 12.1 INTRODUCTION
-
12.2 KEY PLAYERSSIEMENS- Business overview- Products/Solutions/Services offered- Recent developments- MnM viewIBM- Business overview- Solutions/Services offered- Recent developments- MnM viewORACLE- Business overview- Solutions/Services offered- Recent developments- MnM viewGE VERNOVA- Business overview- Products/Solutions/Services offered- Recent developments- MnM viewSCHNEIDER ELECTRIC- Business overview- Products/Solutions/Services offered- Recent developments- MnM viewLANDIS+GYR- Business overview- Solutions/Services offered- Recent developmentsITRON- Business overview- Products/Solutions/Services offered- Recent developmentsSAP- Business overview- Products/Solutions/Services Offered- Recent developmentsSAS INSTITUTE- Business overview- Products/Solutions/Services offered- Recent developmentsHONEYWELL- Business overview- Products/Solutions/Services offered- Recent developmentsCAPGEMINIACCENTUREINFOSYS
-
12.3 STARTUP/SME PROFILESAUTOGRID SYSTEMSHIVE POWERESMART SYSTEMSSTEAMACOGRID4CGLOBEMASPARKMETERINNOWATTSAMPERONKEVALAGRIDPOINTSAFEGRIDSENTIENT ENERGY
- 13.1 INTRODUCTION
-
13.2 PREDICTIVE MAINTENANCE MARKET - GLOBAL INDUSTRY FORECAST TO 2029MARKET DEFINITIONMARKET OVERVIEW- Predictive maintenance market, by component- Predictive maintenance market, by technology- Predictive maintenance market, by technique- Predictive maintenance market, by vertical- Predictive maintenance market, by region
-
13.3 PRESCRIPTIVE ANALYTICS MARKET - GLOBAL INDUSTRY FORECAST TO 2026MARKET DEFINITIONMARKET OVERVIEW- Prescriptive analytics market, by component- Prescriptive analytics market, by application- Prescriptive maintenance market, by business function- Prescriptive analytics market, by vertical- Prescriptive analytics market, by region
- 14.1 DISCUSSION GUIDE
- 14.2 KNOWLEDGESTORE: MARKETSANDMARKETS’ SUBSCRIPTION PORTAL
- 14.3 CUSTOMIZATION OPTIONS
- 14.4 RELATED REPORTS
- 14.5 AUTHOR DETAILS
- TABLE 1 INCLUSIONS AND EXCLUSIONS
- TABLE 2 USD EXCHANGE RATES, 2019–2023
- TABLE 3 PRIMARY INTERVIEWS
- TABLE 4 FACTOR ANALYSIS
- TABLE 5 ASSUMPTIONS
- TABLE 6 IMPACT OF RECESSION ON GLOBAL SMART GRID ANALYTICS MARKET
- TABLE 7 GLOBAL SMART GRID ANALYTICS MARKET SIZE AND GROWTH RATE, 2020–2023 (USD MILLION, Y-O-Y)
- TABLE 8 GLOBAL SMART GRID ANALYTICS MARKET SIZE AND GROWTH RATE, 2024–2029 (USD MILLION, Y-O-Y)
- TABLE 9 SMART GRID ANALYTICS MARKET: SUPPLY CHAIN ANALYSIS
- TABLE 10 SMART GRID ANALYTICS MARKET: ECOSYSTEM
- TABLE 11 NORTH AMERICA: LIST OF REGULATORY BODIES, GOVERNMENT AGENCIES, AND OTHER ORGANIZATIONS
- TABLE 12 EUROPE: LIST OF REGULATORY BODIES, GOVERNMENT AGENCIES, AND OTHER ORGANIZATIONS
- TABLE 13 ASIA PACIFIC: LIST OF REGULATORY BODIES, GOVERNMENT AGENCIES, AND OTHER ORGANIZATIONS
- TABLE 14 MIDDLE EAST & AFRICA: LIST OF REGULATORY BODIES, GOVERNMENT AGENCIES, AND OTHER ORGANIZATIONS
- TABLE 15 LATIN AMERICA: LIST OF REGULATORY BODIES, GOVERNMENT AGENCIES, AND OTHER ORGANIZATIONS
- TABLE 16 PATENTS FILED, 2013–2023
- TABLE 17 TOP 20 PATENT OWNERS IN SMART GRID ANALYTICS MARKET, 2013–2023
- TABLE 18 LIST OF FEW PATENTS IN SMART GRID ANALYTICS MARKET, 2022–2023
- TABLE 19 IMPACT OF PORTER’S FIVE FORCES ON SMART GRID ANALYTICS MARKET
- TABLE 20 SMART GRID ANALYTICS MARKET, BY OFFERING, 2019–2023 (USD MILLION)
- TABLE 21 SMART GRID ANALYTICS MARKET, BY OFFERING, 2024–2029 (USD MILLION)
- TABLE 22 SMART GRID ANALYTICS SOFTWARE MARKET, BY REGION, 2019–2023 (USD MILLION)
- TABLE 23 SMART GRID ANALYTICS SOFTWARE MARKET, BY REGION, 2024–2029 (USD MILLION)
- TABLE 24 SMART GRID ANALYTICS SOFTWARE MARKET, BY TYPE, 2019–2023 (USD MILLION)
- TABLE 25 SMART GRID ANALYTICS SOFTWARE MARKET, BY TYPE, 2024–2029 (USD MILLION)
- TABLE 26 METER ANALYTICS SOFTWARE MARKET, BY REGION, 2019–2023 (USD MILLION)
- TABLE 27 METER ANALYTICS SOFTWARE MARKET, BY REGION, 2024–2029 (USD MILLION)
- TABLE 28 OPERATIONAL ANALYTICS SOFTWARE MARKET, BY REGION, 2019–2023 (USD MILLION)
- TABLE 29 OPERATIONAL ANALYTICS SOFTWARE MARKET, BY REGION, 2024–2029 (USD MILLION)
- TABLE 30 RELIABILITY ANALYTICS SOFTWARE MARKET, BY REGION, 2019–2023 (USD MILLION)
- TABLE 31 RELIABILITY ANALYTICS SOFTWARE MARKET, BY REGION, 2024–2029 (USD MILLION)
- TABLE 32 SMART GRID ANALYTICS SOFTWARE MARKET, BY DEPLOYMENT MODE, 2019–2023 (USD MILLION)
- TABLE 33 SMART GRID ANALYTICS SOFTWARE MARKET, BY DEPLOYMENT MODE, 2024–2029 (USD MILLION)
- TABLE 34 CLOUD-BASED SMART GRID ANALYTICS SOFTWARE MARKET, BY REGION, 2019–2023 (USD MILLION)
- TABLE 35 CLOUD-BASED SMART GRID ANALYTICS SOFTWARE MARKET, BY REGION, 2024–2029 (USD MILLION)
- TABLE 36 ON-PREMISE SMART GRID ANALYTICS SOFTWARE MARKET, BY REGION, 2019–2023 (USD MILLION)
- TABLE 37 ON-PREMISE SMART GRID ANALYTICS SOFTWARE MARKET, BY REGION, 2024–2029 (USD MILLION)
- TABLE 38 SMART GRID ANALYTICS MARKET, BY SERVICE, 2019–2023 (USD MILLION)
- TABLE 39 SMART GRID ANALYTICS MARKET, BY SERVICE, 2024–2029 (USD MILLION)
- TABLE 40 SMART GRID ANALYTICS SERVICES MARKET, BY REGION, 2019–2023 (USD MILLION)
- TABLE 41 SMART GRID ANALYTICS SERVICES MARKET, BY REGION, 2024–2029 (USD MILLION)
- TABLE 42 SMART GRID ANALYTICS SERVICES MARKET, BY PROFESSIONAL SERVICE, 2019–2023 (USD MILLION)
- TABLE 43 SMART GRID ANALYTICS SERVICES MARKET, BY PROFESSIONAL SERVICE, 2024–2029 (USD MILLION)
- TABLE 44 SMART GRID ANALYTICS PROFESSIONAL SERVICES MARKET, BY REGION, 2019–2023 (USD MILLION)
- TABLE 45 SMART GRID ANALYTICS PROFESSIONAL SERVICES MARKET, BY REGION, 2024–2029 (USD MILLION)
- TABLE 46 SMART GRID ANALYTICS TRAINING & CONSULTING SERVICES MARKET, BY REGION, 2019–2023 (USD MILLION)
- TABLE 47 SMART GRID ANALYTICS TRAINING & CONSULTING SERVICES MARKET, BY REGION, 2024–2029 (USD MILLION)
- TABLE 48 SMART GRID ANALYTICS SYSTEM INTEGRATION & DEPLOYMENT SERVICES MARKET, BY REGION, 2019–2023 (USD MILLION)
- TABLE 49 SMART GRID ANALYTICS SYSTEM INTEGRATION & DEPLOYMENT SERVICES MARKET, BY REGION, 2024–2029 (USD MILLION)
- TABLE 50 SMART GRID ANALYTICS SUPPORT & MAINTENANCE SERVICES MARKET, BY REGION, 2019–2023 (USD MILLION)
- TABLE 51 SMART GRID ANALYTICS SUPPORT & MAINTENANCE SERVICES MARKET, BY REGION, 2024–2029 (USD MILLION)
- TABLE 52 SMART GRID ANALYTICS MANAGED SERVICES MARKET, BY REGION, 2019–2023 (USD MILLION)
- TABLE 53 SMART GRID ANALYTICS MANAGED SERVICES MARKET, BY REGION, 2024–2029 (USD MILLION)
- TABLE 54 SMART GRID ANALYTICS MARKET, BY ORGANIZATION SIZE, 2019–2023 (USD MILLION)
- TABLE 55 SMART GRID ANALYTICS MARKET, BY ORGANIZATION SIZE, 2024–2029 (USD MILLION)
- TABLE 56 SMART GRID ANALYTICS MARKET FOR SMALL & MEDIUM BUSINESSES, BY REGION, 2019–2023 (USD MILLION)
- TABLE 57 SMART GRID ANALYTICS MARKET FOR SMALL & MEDIUM BUSINESSES, BY REGION, 2024–2029 (USD MILLION)
- TABLE 58 SMART GRID ANALYTICS MARKET FOR LARGE ENTERPRISES, BY REGION, 2019–2023 (USD MILLION)
- TABLE 59 SMART GRID ANALYTICS MARKET FOR LARGE ENTERPRISES, BY REGION, 2024–2029 (USD MILLION)
- TABLE 60 SMART GRID ANALYTICS MARKET, BY APPLICATION, 2019–2023 (USD MILLION)
- TABLE 61 SMART GRID ANALYTICS MARKET, BY APPLICATION, 2024–2029 (USD MILLION)
- TABLE 62 SMART GRID ANALYTICS MARKET IN AMI ANALYTICS, BY REGION, 2019–2023 (USD MILLION)
- TABLE 63 SMART GRID ANALYTICS MARKET IN AMI ANALYTICS, BY REGION, 2024–2029 (USD MILLION)
- TABLE 64 SMART GRID ANALYTICS MARKET IN LOAD FORECASTING & DEMAND RESPONSE, BY REGION, 2019–2023 (USD MILLION)
- TABLE 65 SMART GRID ANALYTICS MARKET IN LOAD FORECASTING & DEMAND RESPONSE, BY REGION, 2024–2029 (USD MILLION)
- TABLE 66 SMART GRID ANALYTICS MARKET IN GRID OPTIMIZATION, MONITORING, AND MANAGEMENT, BY REGION, 2019–2023 (USD MILLION)
- TABLE 67 SMART GRID ANALYTICS MARKET IN GRID OPTIMIZATION, MONITORING, AND MANAGEMENT, BY REGION, 2024–2029 (USD MILLION)
- TABLE 68 SMART GRID ANALYTICS MARKET IN DISTRIBUTED ENERGY RESOURCES MANAGEMENT SYSTEMS, BY REGION, 2019–2023 (USD MILLION)
- TABLE 69 SMART GRID ANALYTICS MARKET IN DISTRIBUTED ENERGY RESOURCES MANAGEMENT SYSTEMS, BY REGION, 2024–2029 (USD MILLION)
- TABLE 70 SMART GRID ANALYTICS MARKET IN PREDICTIVE MAINTENANCE, BY REGION, 2019–2023 (USD MILLION)
- TABLE 71 SMART GRID ANALYTICS MARKET IN PREDICTIVE MAINTENANCE, BY REGION, 2024–2029 (USD MILLION)
- TABLE 72 SMART GRID ANALYTICS MARKET IN ENERGY THEFT DETECTION & CYBERSECURITY, BY REGION, 2019–2023 (USD MILLION)
- TABLE 73 SMART GRID ANALYTICS MARKET IN ENERGY THEFT DETECTION & CYBERSECURITY, BY REGION, 2024–2029 (USD MILLION)
- TABLE 74 SMART GRID ANALYTICS MARKET IN VOLTAGE, FREQUENCY, AND STABILITY MANAGEMENT, BY REGION, 2019–2023 (USD MILLION)
- TABLE 75 SMART GRID ANALYTICS MARKET IN VOLTAGE, FREQUENCY, AND STABILITY MANAGEMENT, BY REGION, 2024–2029 (USD MILLION)
- TABLE 76 SMART GRID ANALYTICS MARKET IN CUSTOMER ENGAGEMENT & ANALYTICS, BY REGION, 2019–2023 (USD MILLION)
- TABLE 77 SMART GRID ANALYTICS MARKET IN CUSTOMER ENGAGEMENT & ANALYTICS, BY REGION, 2024–2029 (USD MILLION)
- TABLE 78 SMART GRID ANALYTICS MARKET IN VISUAL ANALYTICS, BY REGION, 2019–2023 (USD MILLION)
- TABLE 79 SMART GRID ANALYTICS MARKET IN VISUAL ANALYTICS, BY REGION, 2024–2029 (USD MILLION)
- TABLE 80 SMART GRID ANALYTICS MARKET IN OUTAGE MANAGEMENT & FAULT DETECTION, BY REGION, 2019–2023 (USD MILLION)
- TABLE 81 SMART GRID ANALYTICS MARKET IN OUTAGE MANAGEMENT & FAULT DETECTION, BY REGION, 2024–2029 (USD MILLION)
- TABLE 82 SMART GRID ANALYTICS MARKET IN OTHER APPLICATIONS, BY REGION, 2019–2023 (USD MILLION)
- TABLE 83 SMART GRID ANALYTICS MARKET IN OTHER APPLICATIONS, BY REGION, 2024–2029 (USD MILLION)
- TABLE 84 SMART GRID ANALYTICS MARKET, BY ANALYTICS TYPE, 2019–2023 (USD MILLION)
- TABLE 85 SMART GRID ANALYTICS MARKET, BY ANALYTICS TYPE, 2024–2029 (USD MILLION)
- TABLE 86 SMART GRID DESCRIPTIVE ANALYTICS MARKET, BY REGION, 2019–2023 (USD MILLION)
- TABLE 87 SMART GRID DESCRIPTIVE ANALYTICS MARKET, BY REGION, 2024–2029 (USD MILLION)
- TABLE 88 SMART GRID DIAGNOSTIC ANALYTICS MARKET, BY REGION, 2019–2023 (USD MILLION)
- TABLE 89 SMART GRID DIAGNOSTIC ANALYTICS MARKET, BY REGION, 2024–2029 (USD MILLION)
- TABLE 90 SMART GRID PREDICTIVE ANALYTICS MARKET, BY REGION, 2019–2023 (USD MILLION)
- TABLE 91 SMART GRID PREDICTIVE ANALYTICS MARKET, BY REGION, 2024–2029 (USD MILLION)
- TABLE 92 SMART GRID PRESCRIPTIVE ANALYTICS MARKET, BY REGION, 2019–2023 (USD MILLION)
- TABLE 93 SMART GRID PRESCRIPTIVE ANALYTICS MARKET, BY REGION, 2024–2029 (USD MILLION)
- TABLE 94 SMART GRID ANALYTICS MARKET, BY REGION, 2019–2023 (USD MILLION)
- TABLE 95 SMART GRID ANALYTICS MARKET, BY REGION, 2024–2029 (USD MILLION)
- TABLE 96 NORTH AMERICA: SMART GRID ANALYTICS MARKET, BY OFFERING, 2019–2023 (USD MILLION)
- TABLE 97 NORTH AMERICA: SMART GRID ANALYTICS MARKET, BY OFFERING, 2024–2029 (USD MILLION)
- TABLE 98 NORTH AMERICA: SMART GRID ANALYTICS SOFTWARE MARKET, BY TYPE, 2019–2023 (USD MILLION)
- TABLE 99 NORTH AMERICA: SMART GRID ANALYTICS SOFTWARE MARKET, BY TYPE, 2024–2029 (USD MILLION)
- TABLE 100 NORTH AMERICA: SMART GRID ANALYTICS SOFTWARE MARKET, BY DEPLOYMENT MODE, 2019–2023 (USD MILLION)
- TABLE 101 NORTH AMERICA: SMART GRID ANALYTICS SOFTWARE MARKET, BY DEPLOYMENT MODE, 2024–2029 (USD MILLION)
- TABLE 102 NORTH AMERICA: SMART GRID ANALYTICS MARKET, BY SERVICE, 2019–2023 (USD MILLION)
- TABLE 103 NORTH AMERICA: SMART GRID ANALYTICS MARKET, BY SERVICE, 2024–2029 (USD MILLION)
- TABLE 104 NORTH AMERICA: SMART GRID ANALYTICS MARKET, BY ORGANIZATION SIZE, 2019–2023 (USD MILLION)
- TABLE 105 NORTH AMERICA: SMART GRID ANALYTICS MARKET, BY ORGANIZATION SIZE, 2024–2029 (USD MILLION)
- TABLE 106 NORTH AMERICA: SMART GRID ANALYTICS MARKET, BY APPLICATION, 2019–2023 (USD MILLION)
- TABLE 107 NORTH AMERICA: SMART GRID ANALYTICS MARKET, BY APPLICATION, 2024–2029 (USD MILLION)
- TABLE 108 NORTH AMERICA: SMART GRID ANALYTICS MARKET, BY ANALYTICS TYPE, 2019–2023 (USD MILLION)
- TABLE 109 NORTH AMERICA: SMART GRID ANALYTICS MARKET, BY ANALYTICS TYPE, 2024–2029 (USD MILLION)
- TABLE 110 NORTH AMERICA: SMART GRID ANALYTICS MARKET, BY COUNTRY, 2019–2023 (USD MILLION)
- TABLE 111 NORTH AMERICA: SMART GRID ANALYTICS MARKET, BY COUNTRY, 2024–2029 (USD MILLION)
- TABLE 112 US: SMART GRID ANALYTICS MARKET, BY OFFERING, 2019–2023 (USD MILLION)
- TABLE 113 US: SMART GRID ANALYTICS MARKET, BY OFFERING, 2024–2029 (USD MILLION)
- TABLE 114 CANADA: SMART GRID ANALYTICS MARKET, BY OFFERING, 2019–2023 (USD MILLION)
- TABLE 115 CANADA: SMART GRID ANALYTICS MARKET, BY OFFERING, 2024–2029 (USD MILLION)
- TABLE 116 EUROPE: SMART GRID ANALYTICS MARKET, BY OFFERING, 2019–2023 (USD MILLION)
- TABLE 117 EUROPE: SMART GRID ANALYTICS MARKET, BY OFFERING, 2024–2029 (USD MILLION)
- TABLE 118 EUROPE: SMART GRID ANALYTICS SOFTWARE MARKET, BY TYPE, 2019–2023 (USD MILLION)
- TABLE 119 EUROPE: SMART GRID ANALYTICS SOFTWARE MARKET, BY TYPE, 2024–2029 (USD MILLION)
- TABLE 120 EUROPE: SMART GRID ANALYTICS SOFTWARE MARKET, BY DEPLOYMENT MODE, 2019–2023 (USD MILLION)
- TABLE 121 EUROPE: SMART GRID ANALYTICS SOFTWARE MARKET, BY DEPLOYMENT MODE, 2024–2029 (USD MILLION)
- TABLE 122 EUROPE: SMART GRID ANALYTICS MARKET, BY SERVICE, 2019–2023 (USD MILLION)
- TABLE 123 EUROPE: SMART GRID ANALYTICS MARKET, BY SERVICE, 2024–2029 (USD MILLION)
- TABLE 124 EUROPE: SMART GRID ANALYTICS MARKET, BY ORGANIZATION SIZE, 2019–2023 (USD MILLION)
- TABLE 125 EUROPE: SMART GRID ANALYTICS MARKET, BY ORGANIZATION SIZE, 2024–2029 (USD MILLION)
- TABLE 126 EUROPE: SMART GRID ANALYTICS MARKET, BY APPLICATION, 2019–2023 (USD MILLION)
- TABLE 127 EUROPE: SMART GRID ANALYTICS MARKET, BY APPLICATION, 2024–2029 (USD MILLION)
- TABLE 128 EUROPE: SMART GRID ANALYTICS MARKET, BY ANALYTICS TYPE, 2019–2023 (USD MILLION)
- TABLE 129 EUROPE: SMART GRID ANALYTICS MARKET, BY ANALYTICS TYPE, 2024–2029 (USD MILLION)
- TABLE 130 EUROPE: SMART GRID ANALYTICS MARKET, BY COUNTRY, 2019–2023 (USD MILLION)
- TABLE 131 EUROPE: SMART GRID ANALYTICS MARKET, BY COUNTRY, 2024–2029 (USD MILLION)
- TABLE 132 UK: SMART GRID ANALYTICS MARKET, BY OFFERING, 2019–2023 (USD MILLION)
- TABLE 133 UK: SMART GRID ANALYTICS MARKET, BY OFFERING, 2024–2029 (USD MILLION)
- TABLE 134 GERMANY: SMART GRID ANALYTICS MARKET, BY OFFERING, 2019–2023 (USD MILLION)
- TABLE 135 GERMANY: SMART GRID ANALYTICS MARKET, BY OFFERING, 2024–2029 (USD MILLION)
- TABLE 136 FRANCE: SMART GRID ANALYTICS MARKET, BY OFFERING, 2019–2023 (USD MILLION)
- TABLE 137 FRANCE: SMART GRID ANALYTICS MARKET, BY OFFERING, 2024–2029 (USD MILLION)
- TABLE 138 ITALY: SMART GRID ANALYTICS MARKET, BY OFFERING, 2019–2023 (USD MILLION)
- TABLE 139 ITALY: SMART GRID ANALYTICS MARKET, BY OFFERING, 2024–2029 (USD MILLION)
- TABLE 140 SPAIN: SMART GRID ANALYTICS MARKET, BY OFFERING, 2019–2023 (USD MILLION)
- TABLE 141 SPAIN: SMART GRID ANALYTICS MARKET, BY OFFERING, 2024–2029 (USD MILLION)
- TABLE 142 REST OF EUROPE: SMART GRID ANALYTICS MARKET, BY OFFERING, 2019–2023 (USD MILLION)
- TABLE 143 REST OF EUROPE: SMART GRID ANALYTICS MARKET, BY OFFERING, 2024–2029 (USD MILLION)
- TABLE 144 ASIA PACIFIC: SMART GRID ANALYTICS MARKET, BY OFFERING, 2019–2023 (USD MILLION)
- TABLE 145 ASIA PACIFIC: SMART GRID ANALYTICS MARKET, BY OFFERING, 2024–2029 (USD MILLION)
- TABLE 146 ASIA PACIFIC: SMART GRID ANALYTICS SOFTWARE MARKET, BY TYPE, 2019–2023 (USD MILLION)
- TABLE 147 ASIA PACIFIC: SMART GRID ANALYTICS SOFTWARE MARKET, BY TYPE, 2024–2029 (USD MILLION)
- TABLE 148 ASIA PACIFIC: SMART GRID ANALYTICS SOFTWARE MARKET, BY DEPLOYMENT MODE, 2019–2023 (USD MILLION)
- TABLE 149 ASIA PACIFIC: SMART GRID ANALYTICS SOFTWARE MARKET, BY DEPLOYMENT MODE, 2024–2029 (USD MILLION)
- TABLE 150 ASIA PACIFIC: SMART GRID ANALYTICS MARKET, BY SERVICE, 2019–2023 (USD MILLION)
- TABLE 151 ASIA PACIFIC: SMART GRID ANALYTICS MARKET, BY SERVICE, 2024–2029 (USD MILLION)
- TABLE 152 ASIA PACIFIC: SMART GRID ANALYTICS MARKET, BY ORGANIZATION SIZE, 2019–2023 (USD MILLION)
- TABLE 153 ASIA PACIFIC: SMART GRID ANALYTICS MARKET, BY ORGANIZATION SIZE, 2024–2029 (USD MILLION)
- TABLE 154 ASIA PACIFIC: SMART GRID ANALYTICS MARKET, BY APPLICATION, 2019–2023 (USD MILLION)
- TABLE 155 ASIA PACIFIC: SMART GRID ANALYTICS MARKET, BY APPLICATION, 2024–2029 (USD MILLION)
- TABLE 156 ASIA PACIFIC: SMART GRID ANALYTICS MARKET, BY ANALYTICS TYPE, 2019–2023 (USD MILLION)
- TABLE 157 ASIA PACIFIC: SMART GRID ANALYTICS MARKET, BY ANALYTICS TYPE, 2024–2029 (USD MILLION)
- TABLE 158 ASIA PACIFIC: SMART GRID ANALYTICS MARKET, BY COUNTRY, 2019–2023 (USD MILLION)
- TABLE 159 ASIA PACIFIC: SMART GRID ANALYTICS MARKET, BY COUNTRY, 2024–2029 (USD MILLION)
- TABLE 160 CHINA: SMART GRID ANALYTICS MARKET, BY OFFERING, 2019–2023 (USD MILLION)
- TABLE 161 CHINA: SMART GRID ANALYTICS MARKET, BY OFFERING, 2024–2029 (USD MILLION)
- TABLE 162 INDIA: SMART GRID ANALYTICS MARKET, BY OFFERING, 2019–2023 (USD MILLION)
- TABLE 163 INDIA: SMART GRID ANALYTICS MARKET, BY OFFERING, 2024–2029 (USD MILLION)
- TABLE 164 JAPAN: SMART GRID ANALYTICS MARKET, BY OFFERING, 2019–2023 (USD MILLION)
- TABLE 165 JAPAN: SMART GRID ANALYTICS MARKET, BY OFFERING, 2024–2029 (USD MILLION)
- TABLE 166 SOUTH KOREA: SMART GRID ANALYTICS MARKET, BY OFFERING, 2019–2023 (USD MILLION)
- TABLE 167 SOUTH KOREA: SMART GRID ANALYTICS MARKET, BY OFFERING, 2024–2029 (USD MILLION)
- TABLE 168 AUSTRALIA & NEW ZEALAND: SMART GRID ANALYTICS MARKET, BY OFFERING, 2019–2023 (USD MILLION)
- TABLE 169 AUSTRALIA & NEW ZEALAND: SMART GRID ANALYTICS MARKET, BY OFFERING, 2024–2029 (USD MILLION)
- TABLE 170 REST OF ASIA PACIFIC: SMART GRID ANALYTICS MARKET, BY OFFERING, 2019–2023 (USD MILLION)
- TABLE 171 REST OF ASIA PACIFIC: SMART GRID ANALYTICS MARKET, BY OFFERING, 2024–2029 (USD MILLION)
- TABLE 172 MIDDLE EAST & AFRICA: SMART GRID ANALYTICS MARKET, BY OFFERING, 2019–2023 (USD MILLION)
- TABLE 173 MIDDLE EAST & AFRICA: SMART GRID ANALYTICS MARKET, BY OFFERING, 2024–2029 (USD MILLION)
- TABLE 174 MIDDLE EAST & AFRICA: SMART GRID ANALYTICS SOFTWARE MARKET, BY TYPE, 2019–2023 (USD MILLION)
- TABLE 175 MIDDLE EAST & AFRICA: SMART GRID ANALYTICS SOFTWARE MARKET, BY TYPE, 2024–2029 (USD MILLION)
- TABLE 176 MIDDLE EAST & AFRICA: SMART GRID ANALYTICS SOFTWARE MARKET, BY DEPLOYMENT MODE, 2019–2023 (USD MILLION)
- TABLE 177 MIDDLE EAST & AFRICA: SMART GRID ANALYTICS SOFTWARE MARKET, BY DEPLOYMENT MODE, 2024–2029 (USD MILLION)
- TABLE 178 MIDDLE EAST & AFRICA: SMART GRID ANALYTICS MARKET, BY SERVICE, 2019–2023 (USD MILLION)
- TABLE 179 MIDDLE EAST & AFRICA: SMART GRID ANALYTICS MARKET, BY SERVICE, 2024–2029 (USD MILLION)
- TABLE 180 MIDDLE EAST & AFRICA: SMART GRID ANALYTICS MARKET, BY ORGANIZATION SIZE, 2019–2023 (USD MILLION)
- TABLE 181 MIDDLE EAST & AFRICA: SMART GRID ANALYTICS MARKET, BY ORGANIZATION SIZE, 2024–2029 (USD MILLION)
- TABLE 182 MIDDLE EAST & AFRICA: SMART GRID ANALYTICS MARKET, BY APPLICATION, 2019–2023 (USD MILLION)
- TABLE 183 MIDDLE EAST & AFRICA: SMART GRID ANALYTICS MARKET, BY APPLICATION, 2024–2029 (USD MILLION)
- TABLE 184 MIDDLE EAST & AFRICA: SMART GRID ANALYTICS MARKET, BY ANALYTICS TYPE, 2019–2023 (USD MILLION)
- TABLE 185 MIDDLE EAST & AFRICA: SMART GRID ANALYTICS MARKET, BY ANALYTICS TYPE, 2024–2029 (USD MILLION)
- TABLE 186 MIDDLE EAST & AFRICA: SMART GRID ANALYTICS MARKET, BY COUNTRY, 2019–2023 (USD MILLION)
- TABLE 187 MIDDLE EAST AND AFRICA: SMART GRID ANALYTICS MARKET, BY COUNTRY, 2024–2029 (USD MILLION)
- TABLE 188 SAUDI ARABIA: SMART GRID ANALYTICS MARKET, BY OFFERING, 2019–2023 (USD MILLION)
- TABLE 189 SAUDI ARABIA: SMART GRID ANALYTICS MARKET, BY OFFERING, 2024–2029 (USD MILLION)
- TABLE 190 UAE: SMART GRID ANALYTICS MARKET, BY OFFERING, 2019–2023 (USD MILLION)
- TABLE 191 UAE: SMART GRID ANALYTICS MARKET, BY OFFERING, 2024–2029 (USD MILLION)
- TABLE 192 SOUTH AFRICA: SMART GRID ANALYTICS MARKET, BY OFFERING, 2019–2023 (USD MILLION)
- TABLE 193 SOUTH AFRICA: SMART GRID ANALYTICS MARKET, BY OFFERING, 2024–2029 (USD MILLION)
- TABLE 194 REST OF MIDDLE EAST & AFRICA: SMART GRID ANALYTICS MARKET, BY OFFERING, 2019–2023 (USD MILLION)
- TABLE 195 REST OF MIDDLE EAST & AFRICA: SMART GRID ANALYTICS MARKET, BY OFFERING, 2024–2029 (USD MILLION)
- TABLE 196 LATIN AMERICA: SMART GRID ANALYTICS MARKET, BY OFFERING, 2019–2023 (USD MILLION)
- TABLE 197 LATIN AMERICA: SMART GRID ANALYTICS MARKET, BY OFFERING, 2024–2029 (USD MILLION)
- TABLE 198 LATIN AMERICA: SMART GRID ANALYTICS SOFTWARE MARKET, BY TYPE, 2019–2023 (USD MILLION)
- TABLE 199 LATIN AMERICA: SMART GRID ANALYTICS SOFTWARE MARKET, BY TYPE, 2024–2029 (USD MILLION)
- TABLE 200 LATIN AMERICA: SMART GRID ANALYTICS SOFTWARE MARKET, BY DEPLOYMENT MODE, 2019–2023 (USD MILLION)
- TABLE 201 LATIN AMERICA: SMART GRID ANALYTICS SOFTWARE MARKET, BY DEPLOYMENT MODE, 2024–2029 (USD MILLION)
- TABLE 202 LATIN AMERICA: SMART GRID ANALYTICS MARKET, BY SERVICE, 2019–2023 (USD MILLION)
- TABLE 203 LATIN AMERICA: SMART GRID ANALYTICS MARKET, BY SERVICE, 2024–2029 (USD MILLION)
- TABLE 204 LATIN AMERICA: SMART GRID ANALYTICS MARKET, BY ORGANIZATION SIZE, 2019–2023 (USD MILLION)
- TABLE 205 LATIN AMERICA: SMART GRID ANALYTICS MARKET, BY ORGANIZATION SIZE, 2024–2029 (USD MILLION)
- TABLE 206 LATIN AMERICA: SMART GRID ANALYTICS MARKET, BY APPLICATION, 2019–2023 (USD MILLION)
- TABLE 207 LATIN AMERICA: SMART GRID ANALYTICS MARKET, BY APPLICATION, 2024–2029 (USD MILLION)
- TABLE 208 LATIN AMERICA: SMART GRID ANALYTICS MARKET, BY ANALYTICS TYPE, 2019–2023 (USD MILLION)
- TABLE 209 LATIN AMERICA: SMART GRID ANALYTICS MARKET, BY ANALYTICS TYPE, 2024–2029 (USD MILLION)
- TABLE 210 LATIN AMERICA: SMART GRID ANALYTICS MARKET, BY COUNTRY, 2019–2023 (USD MILLION)
- TABLE 211 LATIN AMERICA: SMART GRID ANALYTICS MARKET, BY COUNTRY, 2024–2029 (USD MILLION)
- TABLE 212 BRAZIL: SMART GRID ANALYTICS MARKET, BY OFFERING, 2019–2023 (USD MILLION)
- TABLE 213 BRAZIL: SMART GRID ANALYTICS MARKET, BY OFFERING, 2024–2029 (USD MILLION)
- TABLE 214 MEXICO: SMART GRID ANALYTICS MARKET, BY OFFERING, 2019–2023 (USD MILLION)
- TABLE 215 MEXICO: SMART GRID ANALYTICS MARKET, BY OFFERING, 2024–2029 (USD MILLION)
- TABLE 216 REST OF LATIN AMERICA: SMART GRID ANALYTICS MARKET, BY OFFERING, 2019–2023 (USD MILLION)
- TABLE 217 REST OF LATIN AMERICA: SMART GRID ANALYTICS MARKET, BY OFFERING, 2024–2029 (USD MILLION)
- TABLE 218 OVERVIEW OF STRATEGIES ADOPTED BY KEY SMART GRID ANALYTICS VENDORS
- TABLE 219 SMART GRID ANALYTICS MARKET: DEGREE OF COMPETITION
- TABLE 220 REGIONAL FOOTPRINT (13 COMPANIES), 2023
- TABLE 221 OFFERING FOOTPRINT (13 COMPANIES), 2023
- TABLE 222 APPLICATION FOOTPRINT (13 COMPANIES), 2023
- TABLE 223 ANALYTICS TYPE FOOTPRINT (13 COMPANIES), 2023
- TABLE 224 SMART GRID ANALYTICS MARKET: DETAILED LIST OF KEY STARTUPS/SMES, 2023
- TABLE 225 SMART GRID ANALYTICS MARKET: COMPETITIVE BENCHMARKING OF STARTUPS/SMES, 2023
- TABLE 226 SMART GRID ANALYTICS MARKET: PRODUCT LAUNCHES AND ENHANCEMENTS, JANUARY 2021–MAY 2024
- TABLE 227 SMART GRID ANALYTICS MARKET: DEALS, JANUARY 2021–MAY 2024
- TABLE 228 SIEMENS: BUSINESS OVERVIEW
- TABLE 229 SIEMENS: PRODUCTS/SOLUTIONS/SERVICES OFFERED
- TABLE 230 SIEMENS: PRODUCT LAUNCHES AND ENHANCEMENTS
- TABLE 231 SIEMENS: DEALS
- TABLE 232 IBM: BUSINESS OVERVIEW
- TABLE 233 IBM: SOLUTIONS/SERVICES OFFERED
- TABLE 234 IBM: PRODUCT LAUNCHES AND ENHANCEMENTS
- TABLE 235 IBM: DEALS
- TABLE 236 ORACLE: BUSINESS OVERVIEW
- TABLE 237 ORACLE: SOLUTIONS/SERVICES OFFERED
- TABLE 238 ORACLE: PRODUCT LAUNCHES AND ENHANCEMENTS
- TABLE 239 ORACLE: DEALS
- TABLE 240 GE VERNOVA: BUSINESS OVERVIEW
- TABLE 241 GE VERNOVA: PRODUCTS/SOLUTIONS/SERVICES OFFERED
- TABLE 242 GE VERNOVA: PRODUCT LAUNCHES AND ENHANCEMENTS
- TABLE 243 GE VERNOVA: DEALS
- TABLE 244 SCHNEIDER ELECTRIC: BUSINESS OVERVIEW
- TABLE 245 SCHNEIDER ELECTRIC: PRODUCTS/SOLUTIONS/SERVICES OFFERED
- TABLE 246 SCHNEIDER ELECTRIC: PRODUCT LAUNCHES AND ENHANCEMENTS
- TABLE 247 SCHNEIDER ELECTRIC: DEALS
- TABLE 248 LANDIS+GYR: BUSINESS OVERVIEW
- TABLE 249 LANDIS+GYR: SOLUTIONS/SERVICES OFFERED
- TABLE 250 LANDIS+GYR: PRODUCT LAUNCHES AND ENHANCEMENTS
- TABLE 251 LANDIS+GYR: DEALS
- TABLE 252 ITRON: BUSINESS OVERVIEW
- TABLE 253 ITRON: PRODUCTS/SOLUTIONS/SERVICES OFFERED
- TABLE 254 ITRON: PRODUCT LAUNCHES AND ENHANCEMENTS
- TABLE 255 ITRON: DEALS
- TABLE 256 SAP: BUSINESS OVERVIEW
- TABLE 257 SAP: PRODUCTS/SOLUTIONS/SERVICES OFFERED
- TABLE 258 SAP: PRODUCT LAUNCHES AND ENHANCEMENTS
- TABLE 259 SAS INSTITUTE: BUSINESS OVERVIEW
- TABLE 260 SAS INSTITUTE: PRODUCTS/SOLUTIONS/SERVICES OFFERED
- TABLE 261 SAS INSTITUTE: PRODUCT LAUNCHES AND ENHANCEMENTS
- TABLE 262 SAS INSTITUTE: DEALS
- TABLE 263 HONEYWELL: BUSINESS OVERVIEW
- TABLE 264 HONEYWELL: PRODUCTS/SOLUTIONS/SERVICES OFFERED
- TABLE 265 HONEYWELL: PRODUCT LAUNCHES AND ENHANCEMENTS
- TABLE 266 HONEYWELL: DEALS
- TABLE 267 PREDICTIVE MAINTENANCE MARKET, BY COMPONENT, 2019–2023 (USD MILLION)
- TABLE 268 PREDICTIVE MAINTENANCE MARKET, BY COMPONENT, 2024–2029 (USD MILLION)
- TABLE 269 PREDICTIVE MAINTENANCE MARKET, BY TECHNOLOGY, 2019–2023 (USD MILLION)
- TABLE 270 PREDICTIVE MAINTENANCE MARKET, BY TECHNOLOGY, 2024–2029 (USD MILLION)
- TABLE 271 PREDICTIVE MAINTENANCE MARKET, BY TECHNIQUE, 2019–2023 (USD MILLION)
- TABLE 272 PREDICTIVE MAINTENANCE MARKET, BY TECHNIQUE, 2024–2029 (USD MILLION)
- TABLE 273 PREDICTIVE MAINTENANCE MARKET, BY VERTICAL, 2019–2023 (USD MILLION)
- TABLE 274 PREDICTIVE MAINTENANCE MARKET, BY VERTICAL, 2024–2029 (USD MILLION)
- TABLE 275 PREDICTIVE MAINTENANCE MARKET, BY REGION, 2019–2023 (USD MILLION)
- TABLE 276 PREDICTIVE MAINTENANCE MARKET, BY REGION, 2024–2029 (USD MILLION)
- TABLE 277 PRESCRIPTIVE ANALYTICS MARKET, BY COMPONENT, 2015–2020 (USD MILLION)
- TABLE 278 PRESCRIPTIVE ANALYTICS MARKET, BY COMPONENT, 2021–2026 (USD MILLION)
- TABLE 279 PRESCRIPTIVE ANALYTICS MARKET, BY APPLICATION, 2015–2020 (USD MILLION)
- TABLE 280 PRESCRIPTIVE ANALYTICS MARKET, BY APPLICATION, 2021–2026 (USD MILLION)
- TABLE 281 PRESCRIPTIVE ANALYTICS MARKET, BY BUSINESS FUNCTION, 2015–2020 (USD MILLION)
- TABLE 282 PRESCRIPTIVE ANALYTICS MARKET, BY BUSINESS FUNCTION, 2021–2026 (USD MILLION)
- TABLE 283 PRESCRIPTIVE ANALYTICS MARKET, BY VERTICAL, 2015–2020 (USD MILLION)
- TABLE 284 PRESCRIPTIVE ANALYTICS MARKET, BY VERTICAL, 2021–2026 (USD MILLION)
- TABLE 285 PRESCRIPTIVE ANALYTICS MARKET, BY REGION, 2015–2020 (USD MILLION)
- TABLE 286 PRESCRIPTIVE ANALYTICS MARKET, BY REGION, 2021–2026 (USD MILLION)
- FIGURE 1 SMART GRID ANALYTICS MARKET SEGMENTATION
- FIGURE 2 SMART GRID ANALYTICS MARKET SEGMENTATION
- FIGURE 3 STUDY YEARS CONSIDERED
- FIGURE 4 SMART GRID ANALYTICS MARKET: RESEARCH DESIGN
- FIGURE 5 BREAKUP OF PRIMARY PROFILES, BY COMPANY TYPE, DESIGNATION, AND REGION
- FIGURE 6 KEY INSIGHTS FROM INDUSTRY EXPERTS
- FIGURE 7 SMART GRID ANALYTICS MARKET: TOP-DOWN AND BOTTOM-UP APPROACHES
- FIGURE 8 APPROACH 1 (BOTTOM-UP; SUPPLY-SIDE): REVENUE FROM SOLUTIONS/ SERVICES OF SMART GRID ANALYTICS MARKET
- FIGURE 9 APPROACH 1 (BOTTOM-UP; SUPPLY-SIDE): COLLECTIVE REVENUE FROM ALL SOLUTIONS/SERVICES OF SMART GRID ANALYTICS MARKET
- FIGURE 10 APPROACH 1 (BOTTOM-UP; SUPPLY-SIDE): STEP-WISE METHODOLOGY WITH RESPECTIVE SOURCES
- FIGURE 11 APPROACH 2 (BOTTOM-UP; DEMAND-SIDE): SHARE OF SMART GRID ANALYTICS THROUGH OVERALL IT SPENDING OF END USERS
- FIGURE 12 DATA TRIANGULATION
- FIGURE 13 STUDY LIMITATIONS
- FIGURE 14 SMART GRID ANALYTICS SOFTWARE TO ACCOUNT FOR LARGER MARKET THAN SERVICES IN 2024
- FIGURE 15 OPERATIONAL ANALYTICS TO BE LARGEST MARKET AMONG SOFTWARE TYPES IN 2024
- FIGURE 16 CLOUD TO BECOME LEADING SOFTWARE DEPLOYMENT MODE IN 2024
- FIGURE 17 PROFESSIONAL SERVICES TO REGISTER LARGER MARKET SHARE THAN MANAGED SERVICES IN 2024
- FIGURE 18 TRAINING & CONSULTING SERVICES TO BE LARGEST PROFESSIONAL SERVICES SEGMENT IN 2024
- FIGURE 19 LARGE ENTERPRISES TO ACCOUNT FOR MAJORITY MARKET SHARE IN 2024
- FIGURE 20 PREDICTIVE ANALYTICS TO BE LEADING SEGMENT IN 2024
- FIGURE 21 DISTRIBUTED ENERGY RESOURCES MANAGEMENT SYSTEMS TO EMERGE AS FASTEST-GROWING APPLICATION DURING FORECAST PERIOD
- FIGURE 22 ASIA PACIFIC TO REGISTER FASTEST GROWTH RATE BETWEEN 2024 AND 2029
- FIGURE 23 RISE IN DEMAND FOR ENERGY EFFICIENCY & SUSTAINABILITY AND NUMBER OF AGING GRID INFRASTRUCTURES TO DRIVE MARKET GROWTH
- FIGURE 24 DISTRIBUTED ENERGY RESOURCES MANAGEMENT SYSTEMS SEGMENT TO ACCOUNT FOR HIGHEST GROWTH RATE DURING THE FORECAST PERIOD
- FIGURE 25 OPERATIONAL ANALYTICS AND GRID OPTIMIZATION, MONITORING, AND MANAGEMENT TO BE LARGEST SEGMENTS IN NORTH AMERICAN MARKET IN 2024
- FIGURE 26 NORTH AMERICA TO ACCOUNT FOR LARGEST MARKET SHARE IN 2024
- FIGURE 27 SMART GRID ANALYTICS MARKET: DRIVERS, RESTRAINTS, OPPORTUNITIES, AND CHALLENGES
- FIGURE 28 GLOBAL SMART METER (ELECTRICITY, GAS, & WATER) ADOPTION, 2014–2020 (MILLION)
- FIGURE 29 GLOBAL INVESTMENTS IN SMART GRIDS, 2023 (USD BILLION)
- FIGURE 30 ESTIMATED ANNUAL COST OF CYBERCRIME, 2018–2023 (USD TRILLION)
- FIGURE 31 COMMUNICATION NETWORKS OF SMART GRID
- FIGURE 32 SMART GRID ANALYTICS MARKET: SUPPLY CHAIN ANALYSIS
- FIGURE 33 KEY PLAYERS IN SMART GRID ANALYTICS MARKET ECOSYSTEM
- FIGURE 34 NUMBER OF PATENTS GRANTED IN LAST 10 YEARS, 2013–2023
- FIGURE 35 TOP 10 APPLICANTS IN SMART GRID ANALYTICS MARKET, 2013–2023
- FIGURE 36 REGIONAL ANALYSIS OF PATENTS GRANTED, 2013–2023
- FIGURE 37 SMART GRID ANALYTICS MARKET: PORTER’S FIVE FORCES ANALYSIS
- FIGURE 38 SMART GRID ANALYTICS SERVICES TO REGISTER HIGHER CAGR DURING FORECAST PERIOD
- FIGURE 39 OPERATIONAL ANALYTICS TO BE SUBSEGMENT SHARE OF SMART GRID ANALYTICS MARKET FOR SOFTWARE TYPE
- FIGURE 40 CLOUD SEGMENT TO REGISTER HIGHER CAGR DURING FORECAST PERIOD
- FIGURE 41 MANAGED SERVICES SEGMENT TO REGISTER HIGHER CAGR IN SMART GRID ANALYTICS MARKET FOR SERVICES DURING FORECAST PERIOD
- FIGURE 42 SYSTEM INTEGRATION & DEPLOYMENT SUBSEGMENT TO REGISTER HIGHEST CAGR DURING FORECAST PERIOD
- FIGURE 43 SMALL & MEDIUM BUSINESSES TO GROW AT HIGHEST CAGR DURING FORECAST PERIOD
- FIGURE 44 DISTRIBUTED ENERGY RESOURCES MANAGEMENT SYSTEMS TO REGISTER HIGHER CAGR DURING FORECAST PERIOD
- FIGURE 45 PRESCRIPTIVE ANALYTICS SEGMENT TO REGISTER HIGHER CAGR DURING FORECAST PERIOD
- FIGURE 46 ASIA PACIFIC TO REGISTER HIGHEST CAGR DURING FORECAST PERIOD
- FIGURE 47 INDIA TO REGISTER HIGHEST GROWTH RATE IN SMART GRID ANALYTICS MARKET DURING FORECAST PERIOD
- FIGURE 48 NORTH AMERICA: SMART GRID ANALYTICS MARKET SNAPSHOT
- FIGURE 49 ASIA PACIFIC: SMART GRID ANALYTICS MARKET SNAPSHOT
- FIGURE 50 TOP FIVE PUBLIC PLAYERS DOMINATED MARKET OVER FIVE YEARS (USD MILLION)
- FIGURE 51 SHARE OF LEADING COMPANIES IN SMART GRID ANALYTICS MARKET, 2023
- FIGURE 52 SMART GRID ANALYTICS MARKET: COMPANY EVALUATION MATRIX (KEY PLAYERS), 2023
- FIGURE 53 COMPANY FOOTPRINT (13 COMPANIES), 2023
- FIGURE 54 SMART GRID ANALYTICS MARKET: COMPANY EVALUATION MATRIX (STARTUPS/SMES), 2023
- FIGURE 55 SIEMENS: COSMPANY SNAPSHOT
- FIGURE 56 IBM: COMPANY SNAPSHOT
- FIGURE 57 ORACLE: COMPANY SNAPSHOT
- FIGURE 58 GE VERNOVA: COMPANY SNAPSHOT
- FIGURE 59 SCHNEIDER ELECTRIC: COMPANY SNAPSHOT
- FIGURE 60 LANDIS+GYR: COMPANY SNAPSHOT
- FIGURE 61 ITRON: COMPANY SNAPSHOT
- FIGURE 62 SAP: COMPANY SNAPSHOT
- FIGURE 63 HONEYWELL: COMPANY SNAPSHOT
The smart grid analytics market research study involved extensive secondary sources, directories, journals, and paid databases. Primary sources were mainly industry experts from the core and related industries, preferred smart grid analytics providers, third-party service providers, consulting service providers, end users, and other commercial enterprises. In-depth interviews were conducted with various primary respondents, including key industry participants and subject matter experts, to obtain and verify critical qualitative and quantitative information, and assess the market’s prospects.
Secondary Research
In the secondary research process, various sources were referred to, for identifying and collecting information for this study. Secondary sources included annual reports, press releases, and investor presentations of companies; white papers, journals, and certified publications; and articles from recognized authors, directories, and databases. The data was also collected from other secondary sources, such as journals, government websites, blogs, and vendors websites. Additionally, smart grid analytics spending of various countries was extracted from the respective sources. Secondary research was mainly used to obtain key information related to the industry’s value chain and supply chain to identify key players based on solutions, services, market classification, and segmentation according to offerings of major players, industry trends related to software, hardware, services, technology, applications, warehouse sizes, verticals, and regions, and key developments from both market- and technology-oriented perspectives.
Primary Research
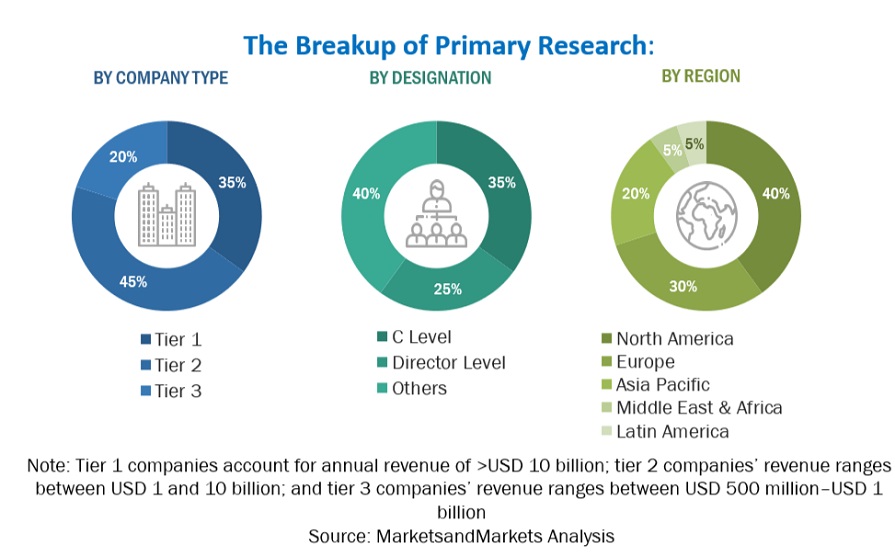
In the primary research process, various primary sources from both supply and demand sides were interviewed to obtain qualitative and quantitative information on the market. The primary sources from the supply side included various industry experts, including Chief Experience Officers (CXOs); Vice Presidents (VPs); directors from business development, marketing, and smart grid analytics expertise; related key executives from smart grid analytics solution vendors, SIs, professional service providers, and industry associations; and key opinion leaders.
Primary interviews were conducted to gather insights, such as market statistics, revenue data collected from solutions and services, market breakups, market size estimations, market forecasts, and data triangulation. Primary research also helped in understanding various trends related to technologies, applications, deployments, and regions. Stakeholders from the demand side, such as Chief Information Officers (CIOs), Chief Technology Officers (CTOs), Chief Strategy Officers (CSOs), and end users using smart grid analytics solutions, were interviewed to understand the buyer’s perspective on suppliers, products, service providers, and their current usage of smart grid analytics solutions and services, which would impact the overall smart grid analytics market.
To know about the assumptions considered for the study, download the pdf brochure
Market Size Estimation
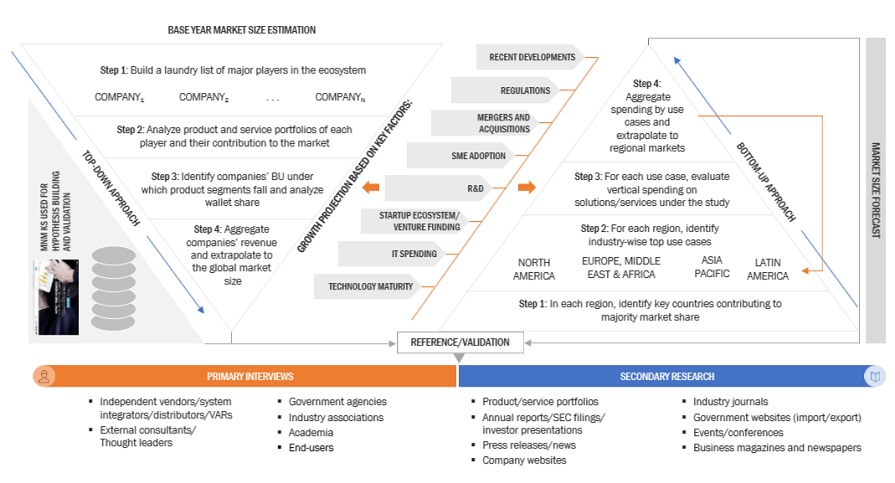
Multiple approaches were adopted for estimating and forecasting the smart grid analytics market. The first approach involves estimating the market size by summation of companies’ revenue generated through the sale of solutions and services.
Market Size Estimation Methodology-Top-down approach
In the top-down approach, an exhaustive list of all the vendors offering solutions and services in the smart grid analytics market was prepared. The revenue contribution of the market vendors was estimated through annual reports, press releases, funding, investor presentations, paid databases, and primary interviews. Each vendor's offerings were evaluated based on breadth of software and services according to analytics type, applications, deployment modes, and organization size. The aggregate of all the companies’ revenue was extrapolated to reach the overall market size. Each subsegment was studied and analyzed for its global market size and regional penetration. The markets were triangulated through both primary and secondary research. The primary procedure included extensive interviews for key insights from industry leaders, such as CIOs, CEOs, VPs, directors, and marketing executives. The market numbers were further triangulated with the existing MarketsandMarkets’ repository for validation.
Market Size Estimation Methodology-Bottom-up approach
In the bottom-up approach, the adoption rate of smart grid analytics solutions and services among different end users in key countries with respect to their regions contributing the most to the market share was identified. For cross-validation, the adoption of smart grid analytics solutions and services among different end users, along with different use cases with respect to their regions, was identified and extrapolated. Weightage was given to use cases identified in different regions for the market size calculation.
Based on the market numbers, the regional split was determined by primary and secondary sources. The procedure included the analysis of the market’s regional penetration. Based on secondary research, the regional spending on Information and Communications Technology (ICT), socio-economic analysis of each country, strategic vendor analysis of major smart grid analytics providers, and organic and inorganic business development activities of regional and global players were estimated. With the data triangulation procedure and data validation through primary interviews, the exact values of the overall smart grid analytics market size and segments’ size were determined and confirmed using the study.
Global Smart grid analytics Market Size: Bottom-Up and Top-Down Approach:
To know about the assumptions considered for the study, Request for Free Sample Report
Data Triangulation
After arriving at the overall market size using the market size estimation processes as explained above, the market was split into several segments and subsegments. To complete the overall market engineering process and arrive at the exact statistics of each market segment and subsegment, data triangulation and market breakup procedures were employed, wherever applicable. The overall market size was then used in the top-down procedure to estimate the size of other individual markets via percentage splits of the market segmentation.
Market Definition
Smart grid analytics refers to the application of advanced data analytics, artificial intelligence, and machine learning techniques to enhance the efficiency, reliability, and sustainability of electric power grids. It involves the analysis of large volumes of data generated by smart meters, sensors, and other grid components to optimize grid operations, predict equipment failures, and manage distributed energy resources effectively. Smart grid analytics enables utilities to improve grid performance, reduce operational costs, and meet regulatory requirements, thereby transforming traditional power grids into more intelligent and responsive systems.
Stakeholders
- Smart grid analytics software developers
- Cybersecurity firms
- Business analysts
- Cloud service providers
- Consulting service providers
- Enterprise end-users
- Distributors and Value-added Resellers (VARs)
- Government agencies
- Independent Software Vendors (ISV)
- Managed service providers
- Market research and consulting firms
- Support & maintenance service providers
- System Integrators (SIs)/migration service providers
- Technology providers
Report Objectives
- To define, describe, and forecast the smart grid analytics market, by offering (software, and services), organization size, application, and analytics type
- To provide detailed information related to major factors (drivers, restraints, opportunities, and industry-specific challenges) influencing the market growth
- To analyze the micro markets with respect to individual growth trends, prospects, and their contribution to the total market
- To analyze the opportunities in the market for stakeholders by identifying the high-growth segments of the market
- To analyze opportunities in the market and provide details of the competitive landscape for stakeholders and market leaders
- To forecast the market size of segments for five main regions: North America, Europe, Asia Pacific, the Middle East & Africa, and Latin America
- To profile the key players and comprehensively analyze their market ranking and core competencies
- To analyze competitive developments, such as partnerships, product launches, and mergers and acquisitions, in the smart grid analytics market
- To analyze the impact of recession in the smart grid analytics market across all the regions
Available customizations
With the given market data, MarketsandMarkets offers customizations as per your company’s specific needs. The following customization options are available for the report:
Product Analysis
- Product quadrant, which gives a detailed comparison of the product portfolio of each company.
Geographic Analysis
- Further breakup of the North American smart grid analytics market
- Further breakup of the European market
- Further breakup of the Asia Pacific smart grid analytics market
- Further breakup of the Middle Eastern & African smart grid analytics market
- Further breakup of the Latin America smart grid analytics market
Company Information
- Detailed analysis and profiling of additional market players (up to five)
Growth opportunities and latent adjacency in Smart Grid Analytics Market