Machine Learning Market by Vertical (BFSI, Healthcare and Life Sciences, Retail, Telecommunication, Government and Defense, Manufacturing, Energy and Utilities), Deployment Mode, Service, Organization Size, and Region - Global Forecast to 2022


[156 Pages Report] The machine learning market expected to grow from USD 1.03 Billion in 2016 to USD 8.81 Billion by 2022, at a Compound Annual Growth Rate (CAGR) of 44.1% during the forecast period. Machine learning enabled solutions are being significantly adopted by organizations worldwide to enhance customer experience, ROI, and to gain a competitive edge in business operations. Moreover, in the coming years, applications of machine learning in various industry verticals is expected to rise exponentially. Technological advancement and proliferation in data generation are some of the major driving factors for the market.
The objective of the study has been carried out to define, describe, and forecast the global market on the basis of vertical (BFSI, energy and utilities, healthcare and life sciences, retail, telecommunication, manufacturing, government and defense, others (transportation, agriculture, media and entertainment, and education), services (professional services and managed services), deployment modes (cloud and on-premises), organization sizes (SMEs and large enterprises), and regions (North America, Europe, APAC, MEA, and Latin America). The report also aims at providing detailed information about the major factors influencing the growth of the machine learning market (drivers, restraints, opportunities, and challenges).
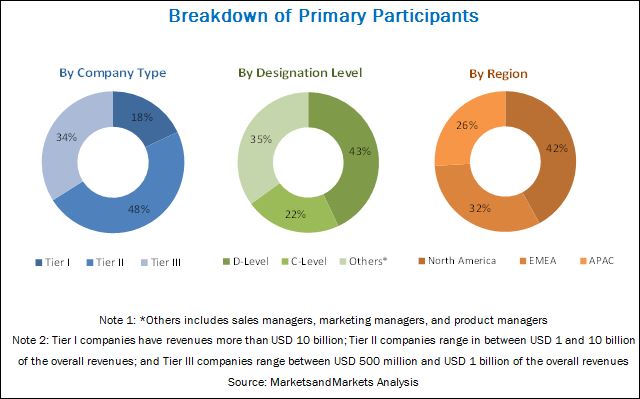
The research methodology used to estimate and forecast the global market size began with the capturing of data on the key vendor revenues through secondary research, annual reports, Institute of Electrical and Electronic Engineers (IEEE), Factiva, Bloomberg, and press releases. The vendor offerings were also taken into consideration to determine the market segmentations. The bottom-up procedure was employed to arrive at the overall market size from the revenues of the key market players. After arriving at the overall market size, the total machine learning market was split into several segments and subsegments, which were then verified through primary research by conducting extensive interviews with key individuals, such as Chief Executive Officers (CEOs), Vice Presidents (VPs), directors, and executives. The data triangulation and market breakdown procedures were employed to complete the overall market engineering process and arrive at the exact statistics for all segments and subsegments. The breakdown of the profiles of the primary participants is depicted in the figure given below:
To know about the assumptions considered for the study, download the pdf brochure
Target Audience of Machine Learning Market
- Machine learning/Artificial Intelligence (AI) solution and service providers
- System integrators
- Enterprise data center professionals
- End-users/consumers/enterprise users
- Telecommunication providers
- Mobile network operators
- Cloud service providers
- Data center software vendors
- IoT device/wearable device manufacturers
- Cognitive and Artificial Intelligence (AI) technology experts/providers
- Analytics service providers
- Managed service providers
- Consultants
- Training and education service providers
Scope of the Machine Learning Market Research Report
|
Report Metrics |
Details |
|
Market size available for years |
2016�2022 |
|
Base year considered |
2016 |
|
Forecast period |
2017�2022 |
|
Forecast units |
Billion (USD) |
|
Segments covered |
Vertical (BFSI, Healthcare and Life Sciences, Retail, Telecommunication, Government and Defense, Manufacturing, Energy and Utilities), Deployment Mode, Service, Organization Size, and Region |
|
Geographies covered |
North America, Europe, APAC, MEA, and Latin America |
|
Companies covered |
Microsoft Corporation (Washington, US), IBM Corporation (New York, US), SAP SE (Walldorf, Germany), SAS Institute Inc. (North Carolina, US), Google, Inc. (California, US), Amazon Web Services Inc. (Washington, US), Baidu, Inc. (Beijing, China), BigML, Inc. (Oregon, US), Fair Isaac Corporation (FICO) (California, US), Hewlett Packard Enterprise Development LP (HPE) (California, US), Intel Corporation (California, US), KNIME.com AG (Zurich, Switzerland), RapidMiner, Inc. (Massachusetts, US) |
The research report categorizes the Machine Learning Market to forecast the revenues and analyze trends in each of the following subsegments:
Machine learning market by Vertical
- Applications in BFSI
- Fraud and Risk Management
- Investment Prediction
- Sales and Marketing Campaign Management
- Customer Segmentation
- Digital Assistance
- Others (compliance management and credit underwriting)
- Applications in Healthcare and Life Sciences
- Disease Identification and Diagnosis
- Image Analytics
- Drug Discovery/Manufacturing
- Personalized Treatment
- Others (clinical trial research and epidemic outbreak prediction)
- Applications in Retail
- Inventory Planning
- Upsell and Cross Channel Marketing
- Segmentation and Targeting
- Recommendation engines
- Others (customer ROI and lifetime value, and customization management)
- Applications in Telecommunication
- Customer Analytics
- Network Optimization
- Network Security
- Others (digital assistance/contact centers analytics and marketing campaign analytics)
- Applications in Government and Defense
- Threat Intelligence
- Autonomous Defense system
- Others (sustainability and operational analytics)
- Applications in Manufacturing
- Predictive Maintenance
- Demand Forecasting
- Revenue Estimation
- Supply Chain Management
- Others (root cause analysis and telematics)
- Applications in Energy and Utilities
- Power/Energy Usage Analytics
- Seismic Data Processing
- Smart Grid Management
- Carbon Emission
- Others (customer specific pricing and renewable energy management)
- Others (Education, Agriculture, Media and Entertainment, and Education)
by Service
- Professional Services
- Managed Services
Machine learning market by Deployment Model:
- Cloud
- On-premises
by Organization Size:
- SMEs
- Large Enterprises
by Region:
- North America
- Europe
- Asia Pacific (APAC)
- Middle East And Africa (MEA)
- Latin America
Available Customizations
With the given market data, MarketsandMarkets offers customizations as per the company�s specific needs. The following customization options are available for the report:
Product Analysis
- Product matrix which gives a detailed comparison of product portfolio of each company
Geographic Analysis
- Further breakdown of the APAC machine learning market
- Further breakdown of the North American market
- Further breakdown of the MEA market
- Further breakdown of the European market
- Further breakdown of the Latin American market
Company Information
- Detailed analysis and profiling of additional market players (Up to 5)
The global machine learning market is expected to grow from USD 1.41 Billion in 2017 to USD 8.81 Billion by 2022, at a Compound Annual Growth Rate (CAGR) of 44.1%. The main driving factors for the market are proliferation in data generation and technological advancement.
In the services segment, the managed service segment is expected to grow at a higher CAGR, whereas professional service segment is expected to be a larger contributor during the forecast period. The managed service is said to be growing faster, as it helps organizations to increase efficiency and save costs for managing on-demand machine learning services. The growth of the professional services segment is mainly governed by the complexity of operations and increasing deployment of machine learning solutions.
In the deployment mode segment, the cloud deployment mode is expected to hold the largest market share and grow at the highest CAGR during the forecast period in machine learning market. Flexibility, automated software updates, disaster recovery through cloud-based backup systems, increased collaboration, monitoring document version control, and data loss prevention with robust cloud storage facilities are some of the crucial benefits that have resulted in the adoption of cloud-based delivery models for machine learning software solutions and services.
In the organization size segment, the large enterprises segment is expected to have the largest market share, whereas the SMEs segment is expected to grow at the highest CAGR during the forecast period in machine learning market. The rapidly emerging and highly active SMEs have increased the adoption of machine learning solutions and services globally, as a result of the growing digitization and increased cyber risks to critical business information and data. Large enterprises have been heavily adopting machine learning to extract the required information from a large amount of data and forecast the outcome of various problems.
In the verticals segment, the Banking, Financial Services, and Insurance (BFSI) vertical is expected to be the highest contributor, whereas the healthcare and life sciences vertical is projected to grow at highest CAGR during the forecast period. Both the verticals generate data in a huge amount every second, and there is accelerated demand for data management technologies such as machine learning and predictive analytics in order to extract business critical insights from this ever-increasing data. The other industry verticals, such as manufacturing, telecommunication, energy and utilities, retail, and government and defense are contributing significantly to the machine learning market. These verticals are also expected to witness significant growth rates during the forecast period due to the increased concerns for managing the complex business processes with improved efficiency and lowering the overall costs.
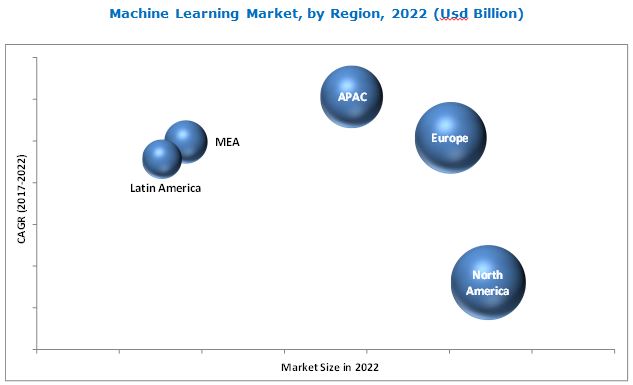
The global machine learning market has been segmented on the basis of regions into North America, Europe, Asia Pacific (APAC), Middle East and Africa (MEA), and Latin America. North America is estimated to be the largest revenue-generating region. This is mainly because, in the developed economies of the US and Canada, there is a high focus on innovations obtained from R&D. These regions have the most competitive and rapidly changing global market in the world. The APAC region is expected to be the fastest-growing region in the market. The increased awareness for business productivity, supplemented with competently designed machine learning solutions offered by vendors present in the APAC region, has led APAC to become a highly potential market.
The major issue faced by most of the organizations while incorporating machine learning in their business process is the lack of skilled employees including analytical talent, and the demand for those who can monitor analytical content is even greater.
The major vendors in machine learning market are Microsoft Corporation (Washington, US), IBM Corporation (New York, US), SAP SE (Walldorf, Germany), SAS Institute Inc. (North Carolina, US), Google, Inc. (California, US), Amazon Web Services Inc. (Washington, US), Baidu, Inc. (Beijing, China), BigML, Inc. (Oregon, US), Fair Isaac Corporation (FICO) (California, US), Hewlett Packard Enterprise Development LP (HPE) (California, US), Intel Corporation (California, US), KNIME.com AG (Zurich, Switzerland), RapidMiner, Inc. (Massachusetts, US), Angoss Software Corporation (Toronto, Canada), H2O.ai (California, US), Alpine Data (California, US), Domino Data Lab, Inc. (California, US), Dataiku (Paris, France), Luminoso Technologies, Inc. (Massachusetts, US), TrademarkVision (Pennsylvania, US), Fractal Analytics Inc. (New Jersey, US), TIBCO Software Inc. (California, US), Teradata (Ohio, US), Dell Inc. (Texas, US), and Oracle Corporation (California, US). These Machine Learning Software Vendors are rated and listed by us on the basis of product quality, reliability, and their business strategy. Please visit 360Quadrants to see the vendor listing of Machine Learning Software.
To speak to our analyst for a discussion on the above findings, click Speak to Analyst
 Exclusive indicates content/data unique to MarketsandMarkets and not available with any competitors.
Table of Contents
1 Introduction (Page No. - 16)
1.1 Objectives of the Machine Learning Market Study
1.2 Market Definition
1.3 Market Scope
1.4 Years Considered for the Study
1.5 Currency
1.6 Stakeholders
2 Research Methodology (Page No. - 20)
2.1 Research Data
2.1.1 Secondary Data
2.1.2 Primary Data
2.1.2.1 Breakdown of Primaries
2.1.2.2 Key Industry Insights
2.2 Machine Learning Market Size Estimation
2.2.1 Bottom-Up Approach
2.2.2 Top-Down Approach
2.3 Microquadrant Research Methodology
2.3.1 Vendor Inclusion Criteria
2.4 Research Assumptions
2.5 Limitations
3 Executive Summary (Page No. - 28)
4 Premium Insights (Page No. - 35)
4.1 Attractive Opportunities in the Market
4.2 Market: Top Three Verticals
4.3 Lifecycle Analysis, By Region, 2017�2022
5 Machine Learning Market Overview and Industry Trends (Page No. - 38)
5.1 Introduction
5.2 Market Dynamics
5.2.1 Drivers
5.2.1.1 Technological Advancements
5.2.1.2 Proliferation in Data Generation
5.2.2 Restraints
5.2.2.1 Lack of Skilled Employees
5.2.3 Opportunities
5.2.3.1 Increasing Demand for Intelligent Business Processes
5.2.3.2 Increasing Adoption in Modern Applications
5.2.4 Challenges
5.2.4.1 Sensitive Data Security
5.2.4.2 Ethical Implications of the Algorithms Deployed
5.3 Industry Trends
5.3.1 Use Cases
5.3.1.1 Introduction
5.3.1.2 Use Case #1: Deliver Analytics Solution
5.3.1.3 Use Case #2: Improve Cross-Selling Capabilities
5.3.1.4 Use Case #3: Increase Revenue and Decrease Customer Incompetence
5.3.1.5 Use Case #4: Market Basket Analysis
5.4 Machine Learning Process
5.5 Regulatory Implications
5.5.1 Introduction
5.5.2 Sarbanes-Oxley Act of 2002
5.5.3 General Data Protection Regulation (GDPR)
5.5.4 Basel
6 Machine Learning Market Analysis, By Vertical (Page No. - 46)
6.1 Introduction
6.1.1 Applications in BFSI
6.1.1.1 Fraud and Risk Management
6.1.1.2 Customer Segmentation
6.1.1.3 Sales and Marketing Campaign Management
6.1.1.4 Investment Prediction
6.1.1.5 Digital Assistance
6.1.1.6 Others
6.1.2 Applications in Healthcare and Life Sciences
6.1.2.1 Disease Identification and Diagnosis
6.1.2.2 Image Analytics
6.1.2.3 Personalized Treatment
6.1.2.4 Drug Discovery/Manufacturing
6.1.2.5 Others
6.1.3 Application in Retail
6.1.3.1 Inventory Planning
6.1.3.2 Recommendation Engines
6.1.3.3 Upsells and Cross Channel Marketing
6.1.3.4 Segmentation and Targeting
6.1.3.5 Others
6.1.4 Applications in Telecommunications
6.1.4.1 Customer Analytics
6.1.4.2 Network Security
6.1.4.3 Network Optimization
6.1.4.4 Others
6.1.5 Applications in Government and Defense
6.1.5.1 Autonomous Defense System
6.1.5.2 Threat Intelligence
6.1.5.3 Others
6.1.6 Applications in Manufacturing
6.1.6.1 Predictive Maintenance
6.1.6.2 Revenue Estimation
6.1.6.3 Demand Forecasting
6.1.6.4 Supply Chain Management
6.1.6.5 Others
6.1.7 Applications in Energy and Utilities
6.1.7.1 Power/Energy Usage Analytics
6.1.7.2 Seismic Data Processing
6.1.7.3 Carbon Emission
6.1.7.4 Smart Grid Management
6.1.7.5 Others
6.1.8 Other Applications
7 Machine Learning Market Analysis, By Deployment Mode (Page No. - 66)
7.1 Introduction
7.2 Cloud
7.3 On-Premises
8 Market Analysis, By Organization Size (Page No. - 69)
8.1 Introduction
8.2 Large Enterprises
8.3 SMEs
9 Machine Learning Market Analysis, By Service (Page No. - 72)
9.1 Introduction
9.2 Professional Services
9.3 Managed Services
10 Geographic Analysis (Page No. - 75)
10.1 Introduction
10.2 North America
10.2.1 By Vertical
10.2.1.1 Applications in BFSI
10.2.1.2 Applications in Healthcare and Life Sciences
10.2.1.3 Applications in Retail
10.2.1.4 Applications in Telecommunications
10.2.1.5 Applications in Government and Defense
10.2.1.6 Applications in Manufacturing
10.2.1.7 Applications in Energy and Utilities
10.2.2 By Organization Size
10.2.3 By Deployment Mode
10.2.4 By Service
10.3 Europe
10.3.1 By Vertical
10.3.1.1 Applications in BFSI
10.3.1.2 Applications in Healthcare and Life Sciences
10.3.1.3 Applications in Retail
10.3.1.4 Applications in Telecommunications
10.3.1.5 Applications in Government and Defense
10.3.1.6 Applications in Manufacturing
10.3.1.7 Applications in Energy and Utilities
10.3.2 By Organization Size
10.3.3 By Deployment Mode
10.3.4 By Service
10.4 APAC
10.4.1 By Vertical
10.4.1.1 Applications in BFSI
10.4.1.2 Applications in Healthcare and Life Sciences
10.4.1.3 Applications in Retail
10.4.1.4 Applications in Telecommunications
10.4.1.5 Applications in Government and Defense
10.4.1.6 Applications in Manufacturing
10.4.1.7 Applications in Energy and Utilities
10.4.2 By Organization Size
10.4.3 By Deployment Mode
10.4.4 By Service
10.5 MEA
10.5.1 By Vertical
10.5.1.1 Applications in BFSI
10.5.1.2 Applications in Healthcare and Life Sciences
10.5.1.3 Applications in Retail
10.5.1.4 Applications in Telecommunications
10.5.1.5 Applications in Government and Defense
10.5.1.6 Applications in Manufacturing
10.5.1.7 Applications in Energy and Utilities
10.5.2 By Organization Size
10.5.3 By Deployment Mode
10.5.4 By Service
10.6 Latin America
10.6.1 By Vertical
10.6.1.1 Applications in BFSI
10.6.1.2 Applications in Healthcare and Life Sciences
10.6.1.3 Applications in Retail
10.6.1.4 Applications in Telecommunications
10.6.1.5 Applications in Government and Defense
10.6.1.6 Applications in Manufacturing
10.6.1.7 Applications in Energy and Utilities
10.6.2 By Organization Size
10.6.3 By Deployment Mode
10.6.4 By Service
11 Competitive Landscape (Page No. - 110)
11.1 Market Ranking for the Machine Learning Market, 2017
12 Company Profiles (Page No. - 111)
(Overview, Strength of Product Portfolio, Business Strategy Excellence, and Recent Developments)*
12.1 International Business Machines Corporation
12.2 Microsoft Corporation
12.3 SAP SE
12.4 SAS Institute Inc.
12.5 Amazon Web Services, Inc.
12.6 BigML, Inc.
12.7 Google Inc.
12.8 Fair Isaac Corporation
12.9 Baidu, Inc.
12.10 Hewlett Packard Enterprise Development LP
12.11 Intel Corporation
12.12 H2o.AI
*Details on Overview, Strength of Product Portfolio, Business Strategy Excellence, and Recent Developments Might Not Be Captured in Case of Unlisted Companies.
13 Appendix (Page No. - 147)
13.1 Discussion Guide
13.2 Knowledge Store: MarketsandMarkets� Subscription Portal
13.3 Introducing RT: Real-Time Market Intelligence
13.4 Available Customizations
13.5 Related Reports
13.6 Author Details
List of Tables (71 Tables)
Table 1 United States Dollar Exchange Rate, 2014�2016
Table 2 Evaluation Criteria
Table 3 Global Market Size and Growth Rate, 2015�2022 (USD Million, Y-O-Y %)
Table 4 Machine Learning Market Size, By Vertical, 2015�2022 (USD Million)
Table 5 BFSI Market Size, By Application, 2015�2022 (USD Million)
Table 6 Healthcare and Life Sciences Market Size, By Application, 2015�2022 (USD Million)
Table 7 Retail Market Size, By Application, 2015�2022 (USD Million)
Table 8 Telecommunications Market Size, By Application, 2015�2022 (USD Million)
Table 9 Government and Defense Machine Learning Market Size, By Application, 2015�2022 (USD Million)
Table 10 Manufacturing Market Size, By Application, 2015�2022 (USD Million)
Table 11 Energy and Utilities Market Size, By Application, 2015�2022 (USD Million)
Table 12 Machine Learning Market Size, By Deployment Mode, 2015�2022 (USD Million)
Table 13 Market Size, By Organization Size, 2015�2022 (USD Million)
Table 14 Market Size, By Service, 2015�2022 (USD Million)
Table 15 Market Size, By Region, 2015�2022 (USD Million)
Table 16 North America: Machine Learning Market Size, By Vertical, 2015�2022 (USD Million)
Table 17 North America: BFSI Market Size, By Application, 2015�2022 (USD Million)
Table 18 North America: Healthcare and Life Sciences Market Size, By Application, 2015�2022 (USD Million)
Table 19 North America: Retail Market Size, By Application, 2015�2022 (USD Million)
Table 20 North America: Telecommunications Market Size, By Application, 2015�2022 (USD Million)
Table 21 North America: Government and Defense Market Size, By Application, 2015�2022 (USD Million)
Table 22 North America: Manufacturing Market Size, By Application, 2015�2022 (USD Million)
Table 23 North America: Energy and Utilities Market Size, By Application, 2015�2022 (USD Million)
Table 24 North America: Market Size, By Organization Size, 2015�2022 (USD Million)
Table 25 North America: Market Size, By Deployment Mode, 2015�2022 (USD Million)
Table 26 North America: Market Size, By Service, 2015�2022 (USD Million)
Table 27 Europe: Machine Learning Market Size, By Vertical, 2015�2022 (USD Million)
Table 28 Europe: BFSI Market Size, By Application, 2015�2022 (USD Million)
Table 29 Europe: Healthcare and Life Sciences Market Size, By Application, 2015�2022 (USD Million)
Table 30 Europe: Retail Market Size, By Application, 2015�2022 (USD Million)
Table 31 Europe: Telecommunications Market Size, By Application, 2015�2022 (USD Million)
Table 32 Europe: Government and Defense Market Size, By Application, 2015�2022 (USD Million)
Table 33 Europe: Manufacturing Market Size, By Application, 2015�2022 (USD Million)
Table 34 Europe: Energy and Utilities Market Size, By Application, 2015�2022 (USD Million)
Table 35 Europe: Market Size, By Organization Size, 2015�2022 (USD Million)
Table 36 Europe: Market Size, By Deployment Mode, 2015�2022 (USD Million)
Table 37 Europe: Market Size, By Service, 2015�2022 (USD Million)
Table 38 APAC: Machine Learning Market Size, By Vertical, 2015�2022 (USD Million)
Table 39 APAC: BFSI Market Size, By Application, 2015�2022 (USD Million)
Table 40 APAC: Healthcare and Life Sciences Market Size, By Application, 2015�2022 (USD Million)
Table 41 APAC: Market Size in Retail, By Application, 2015�2022 (USD Million)
Table 42 APAC: Telecommunications Market Size, By Application, 2015�2022 (USD Million)
Table 43 APAC: Government and Defense Market Size, By Application, 2015�2022 (USD Million)
Table 44 APAC: Manufacturing Market Size, By Application, 2015�2022 (USD Million)
Table 45 APAC: Energy and Utilities Market Size, By Application, 2015�2022 (USD Million)
Table 46 APAC: Market Size, By Organization Size, 2015�2022 (USD Million)
Table 47 APAC: Market Size, By Deployment Mode, 2015�2022 (USD Million)
Table 48 APAC: Market Size, By Service, 2015�2022 (USD Million)
Table 49 MEA: Machine Learning Market Size, By Vertical, 2015�2022 (USD Million)
Table 50 MEA: BFSI Market Size, By Application, 2015�2022 (USD Million)
Table 51 MEA: Healthcare and Life Sciences Market Size, By Application, 2015�2022 (USD Million)
Table 52 MEA: Retail Market Size, By Application, 2015�2022 (USD Million)
Table 53 MEA: Telecommunications Market Size, By Application, 2015�2022 (USD Million)
Table 54 MEA: Government and Defense Market Size, By Application, 2015�2022 (USD Million)
Table 55 MEA: Manufacturing Market Size, By Application, 2015�2022 (USD Million)
Table 56 MEA: Energy and Utilities Market Size, By Application, 2015�2022 (USD Million)
Table 57 MEA: Market Size, By Organization Size, 2015�2022 (USD Million)
Table 58 MEA: Market Size, By Deployment Mode, 2015�2022 (USD Million)
Table 59 MEA: Market Size, By Service, 2015�2022 (USD Million)
Table 60 Latin America: Machine Learning Market Size, By Vertical, 2015�2022 (USD Million)
Table 61 Latin America: BFSI Market Size, By Application, 2015�2022 (USD Million)
Table 62 Latin America: Healthcare and Life Sciences Market Size, By Application, 2015�2022 (USD Million)
Table 63 Latin America: Retail Market Size, By Application, 2015�2022 (USD Million)
Table 64 Latin America: Telecommunications Market Size, By Application, 2015�2022 (USD Million)
Table 65 Latin America: Government and Defense Market Size, By Application, 2015�2022 (USD Million)
Table 66 Latin America: Manufacturing Market Size, By Application, 2015�2022 (USD Million)
Table 67 Latin America: Energy and Utilities Market Size, By Application, 2015�2022 (USD Million)
Table 68 Latin America: Market Size, By Organization Size, 2015�2022 (USD Million)
Table 69 Latin America: Market Size, By Deployment Mode, 2015�2022 (USD Million)
Table 70 Latin America: Market Size, By Service, 2015�2022 (USD Million)
Table 71 Market Ranking for the Machine Learning Market, 2017
List of Figures (54 Figures)
Figure 1 Global Machine Learning Market: Market Segmentation
Figure 2 Global Market: Research Design
Figure 3 Breakdown of Primary Interviews: By Company Size, Designation, and Region
Figure 4 Data Triangulation
Figure 5 Market Size Estimation Methodology: Bottom-Up Approach
Figure 6 Market Size Estimation Methodology: Top-Down Approach
Figure 7 Market, By Vertical, 2017 (USD Million)
Figure 8 Market, By BFSI Application, 2017 (USD Million)
Figure 9 Market Snapshot, By Healthcare and Life Sciences Application, 2017 (USD Million)
Figure 10 Market, By Retail Application, 2017 (USD Million)
Figure 11 Machine Learning Market, By Telecommunications Application, 2017 (USD Million)
Figure 12 Market, By Government and Defense Application, 2017 (USD Million)
Figure 13 Market, By Manufacturing Application, 2017 (USD Million)
Figure 14 Market, By Energy and Utilities Application, 2017 (USD Million)
Figure 15 Market, By Service (Market Share 2017)
Figure 16 Market, By Organization Size (Market Share 2017)
Figure 17 Market, By Deployment Mode (Market Share 2017)
Figure 18 Market, By Region
Figure 19 Proliferation in Data Generation One of the Major Factors Driving the Market During the Forecast Period
Figure 20 Healthcare and Life Sciences Vertical to Record Highest CAGR, 2017-2022 (USD Million)
Figure 21 APAC to Exhibit the Highest Growth Potential During the Forecast Period
Figure 22 APAC to Be the Best Market for Investment in the Next 5 Years
Figure 23 Drivers, Restraints, Opportunities, and Challenges
Figure 24 Machine Learning Process
Figure 25 Healthcare and Life Sciences Vertical to Record Highest CAGR, 2017-2022 (USD Million)
Figure 26 Fraud and Risk Management Application to Hold Largest Market Size, 2017-2022 (USD Million)
Figure 27 Disease Identification and Diagnosis Application to Hold Largest Market Size, 2017-2022 (USD Million)
Figure 28 Inventory Planning Application to Hold Largest Market Size, 2017-2022 (USD Million)
Figure 29 Customer Analytics Application to Hold Largest Market Size, 2017-2022 (USD Million)
Figure 30 Threat Intelligence Application to Hold Largest Market Size, 2017-2022 (USD Million)
Figure 31 Predictive Maintenance Application to Hold Largest Market Size, 2017-2022 (USD Million)
Figure 32 Power/Energy Usage Analytics Application to Hold Largest Market Size, 2017-2022 (USD Million)
Figure 33 Cloud Deployment Mode to Exhibit Higher CAGR, 2017-2022 (USD Million)
Figure 34 SMEs Segment to Exhibit Higher CAGR, 2017-2022 (USD Million)
Figure 35 Managed Services Segment to Exhibit Higher CAGR, 2017-2022 (USD Million)
Figure 36 North America is Expected to Hold the Largest Market Size During the Forecast Period
Figure 37 APAC to Record Highest Growth Rate in the Market, 2017-2022
Figure 38 North America: Market Snapshot
Figure 39 North America: Healthcare and Life Sciences Vertical to Record Highest CAGR, 2017-2022 (USD Million)
Figure 40 Major FinTech Companies in North America Using Machine Learning
Figure 41 Europe: Healthcare and Life Sciences Vertical to Record Highest CAGR, 2017-2022 (USD Million)
Figure 42 APAC: Machine Learning Market Snapshot
Figure 43 APAC: Healthcare and Life Sciences Vertical to Record Highest CAGR, 2017-2022 (USD Million)
Figure 44 MEA: Healthcare and Life Sciences Vertical to Record Highest CAGR, 2017-2022 (USD Million)
Figure 45 Latin America: Healthcare and Life Sciences Vertical to Record Highest CAGR, 2017-2022 (USD Million)
Figure 46 International Business Machines Corporation: Company Snapshot
Figure 47 Microsoft Corporation: Company Snapshot
Figure 48 SAP SE: Company Snapshot
Figure 49 Amazon Web Services, Inc.: Company Snapshot
Figure 50 Google Inc.: Company Snapshot
Figure 51 Fair Isaac Corporation: Company Snapshot
Figure 52 Baidu, Inc.: Company Snapshot
Figure 53 HPE Development LP: Company Snapshot
Figure 54 Intel Corporation: Company Snapshot


Growth opportunities and latent adjacency in Machine Learning Market