Smart Glasses Market Size, Share & Trends

Smart Glasses Market by Monocular & Binocular Glasses, Monochrome, Full-color Display, Photochromic, Electrochromic, Polymer-Dispersed Liquid Crystals (PLD), Suspended Particles Device, Gaming, Remote Inspection, Telemedicine - Global Forecast to 2030

Report Code: SE 9154 Sep, 2024, by marketsandmarkets.com

Updated on : September 16, 2024

Smart Glasses Market Size & Share

[261 Pages Report] The global smart glasses market size is estimated to be USD 878.8 million in 2024 and is projected to reach USD 4,129.3 million by 2030, at a CAGR of 29.4% during the forecast period. Significant factors contributing to the growth of the smart glasses market include rapid technological developments, increased demand for augmented reality  (AR) and mixed reality (MR) smart glasses, and growing adoption in the industrial sector.

Higher resolution displays are being adopted in smart glasses, enabling their use in applications such as AR, wherein enhanced image clarity improves readability and creates a better immersive experience. Advanced sensors such as gesture recognition help users to interact with the device through hand movements, offering an intuitive and hands-free experience. The use of eye-tracking sensors helps analyze eye movements to determine focus, attention, and even emotional responses, helping personalized experiences and applications like gaze-controlled interfaces. Also, increased demand for AR and MR smart glasses due to their ability to offer immersive and interactive experiences enables growth in the market.


Smart Glasses Market


Smart Glasses Market

Smart Glasses Market Forecast to 2030

To know about the assumptions considered for the study, Request for Free Sample Report

Impact of AI/Gen AI on smart glasses market:

Al is revolutionizing the smart glasses market by enabling intuitive user interface, personalization, and contextual awareness, enhancing accessibility, and responsive and adaptive experiences in the smart glasses market. Al smart glasses are being used in gaming, professional, and industrial applications. Gamers can use voice commands to control and navigate virtual worlds while receiving real-time data about their environment. In the manufacturing industry, Al-enabled smart glasses provide workers with real-time data, schematics, and enhance efficiency and safety. Al-enabled smart glasses are being used in machine & part inspection, remote monitoring, maintenance process assistance, and technical training. Meta (US), and EssilorLuxottica (France) offer Ray-Ban Meta smart glasses that are enabled with Meta Al which is an intelligent assistant.

Below diagram illustrates the AI use cases of smart glasses across industries.


Smart Glasses Market

Smart Glasses Market Trends & Dynamics:

Driver: Growing adoption in industrial sector

Industries such as manufacturing and warehousing use smart glasses with camera and audio capabilities for remote assistance. In such industries, smart glasses enable employees to access real-time information and instructions without using their hands. This hands-free capability allows employees to complete tasks more efficiently, as they have access to plans, checklists, and step-by-step instructions as they proceed with other tasks. Safety remains a priority in technology.

Restraint: Regulatory constraints and safety concerns

Regulatory hurdles and security concerns are significant restraints in the smart glasses industry, affecting product development and consumer acceptance. Smart glasses can collect audio and visual information, raising privacy concerns for users and viewers. As a result, regulators in places such as the European Union (EU) and the US emphasize the importance of applying "privacy by design" principles in the development of these devices. This includes integrating privacy from the outset, such as notifications during recording, user control for cameras and microphones. Also, the Consumer Privacy Act (CCPA) requires manufacturers to implement transparent data processing, which can complicate processes and increase costs.

Opportunity: Developments in 5G technology

The development of 5G technology provides a significant opportunity for the smart glasses market. 5G offers high speed, low latency, and high capacity, which is essential for optimal performance in smart glasses. 5G enables seamless and reliable communications, enabling real-time data transfers and seamless applications. This is important for features like augmented reality, live video streaming, and cloud-based processing, which are key functions of smart glasses. With high 5G bandwidth and low latency, smart glasses can provide an exceptional and genuine augmented virtual reality experience. This opens new possibilities for gaming, education, training, and remote working.

Challenge: Technical limitations

The technical limitations of smart glasses encompass several key challenges that hinder their effectiveness and widespread adoption. Designing smart glasses that are attractive and functional is a big challenge. Manufacturers need to build smaller components like camera, sensors, and battery without compromising performance. Glasses needs to be comfortable for a variety of face shapes and sizes and need to be durable and waterproof for everyday use.

The display is critical for presenting information directly to the user’s eyes. Manufacturers are faced with the challenge of choosing an appropriate projection technology (e.g., projection-based, waveguide, or retinal projection) that provides high resolution with limited lens space and low power consumption battery life, which is a major concern for smart glasses. Long battery life requires efficient power sources and handling techniques to balance device size and weight.

Smart glasses market Ecosystem

The prominent players in the smart glasses market are Meta (US), Vuzix (US), Seiko Epson Corporation (Japan), EssilorLuxottica (France), Amazon.com, Inc. (US), TCL Electronics Holdings Limited (China), LUCYD EYEWEAR (US), Lenovo (China), Huawei Investment & Holding Co., Ltd. (China), and Xiaomi (China). These companies not only boast a comprehensive product portfolio but also have a strong geographic footprint.

Smart Glasses Market by Ecosystem

Smart Glasses Market Share

Binocular type smart glasses segment to hold prominent share of smart glasses market during forecast period.

Throughout the forecast period, the binocular segment of the smart glasses market is anticipated to hold a prominent market share. This segment has a significant market share due to the increasing need for binocular smart glasses for immersive AR experiences in consumer and industrial applications. The binocular design is beneficial for applications that require depth perception and a wide field of view, making them suitable for various enterprise and industrial uses. They are used in remote collaborations, and improved workflows in industries such as automotive and education. 

Advanced feature smart glasses segment to grow at significant CAGR during forecast period.

The advanced segment of the smart glasses market is projected to hold the majority share by 2030. Advanced features include audio, camera, sensors, accelerometers, and gyroscopes, which provide users with enhanced capabilities and an immersive experience. Increasing demand in healthcare, gaming, and manufacturing is set to boost segmental growth. They offer an immersive gaming experience by combining high-quality audio, visual displays, and motion sensors. They help doctors to examine patients remotely, view medical images, and provide real-time guidance during procedures.

Consumer industry segment to grow at significant CAGR during forecast period.

In the consumer market, smart glasses enhance personal experiences by integrating digital features into daily life. These devices offer a range of functionalities, such as media consumption, navigation, and social interaction. They have emerged as a versatile tool in the consumer industry, enhancing experiences across various domains such as entertainment, communication, gaming, and navigation. Their ability to overlay digital information onto the real world through AR provides unique applications that cater to diverse consumer needs.

Smart Glasses Market Regional Analysis

Asia Pacific to hold significant market share during forecast period.

The smart glasses market in the Asia Pacific is categorized further into Japan, China, India, South Korea, and Rest of Asia Pacific. Given China's technological prowess, India emerges as the most attractive region for smart wear technology due to its youth increasingly adopting such technologies, which is expected to drive the market's growth in the region. The presence of key technology providers and massive consumer market opportunities in China, innovation in manufacturing and advanced technologies creating high demand in Japan, government support & technological advancements to create opportunities in South Korea, and increasing adoption by the young Indian population are expected to create massive growth opportunities for the smart glasses market.

Smart Glasses Market by Region

Smart Glasses Market by Region

To know about the assumptions considered for the study, download the pdf brochure

Top Smart Glasses Companies: Key players

Meta (US), EssilorLuxottica (France), Vuzix (US), Amazon.com, Inc. (US), Seiko Epson Corporation (Japan), TCL Electronics Holdings Limited (China), Xiaomi (China), Lenovo (China), Huawei Investment & Holding Co., Ltd.  (China), and LUCYD EYEWEAR (US) are among the major players in the smart glasses companies.

Smart Glasses Market Report Scope:

Report Metric

Details

Estimated Market Size  USD 878.8 million in 2024
Projected Market Size USD 4,129.3 million by 2030
Growth Rate CAGR of 29.4%

Market Size Availability for Years

2021–2030

Base Year

2023

Forecast Period

2024–2030

Forecast Units

Value (USD Million)

Segments Covered

By Type, Feature, Industry, and Region

Geographies Covered

North America, Europe, Asia Pacific, and Rest of the World

Companies Covered

The major players include Meta (US), Vuzix (US), Seiko Epson Corporation (Japan), EssilorLuxottica (France), Amazon.com, Inc. (US), TCL Electronics Holdings Limited (China), LUCYD EYEWEAR (US), Lenovo (China), Huawei Investment & Holding Co., Ltd. (China), and Xiaomi (China). 
A total of 25 players are covered.

Smart Glasses Market Highlights

This research report categorizes the smart glasses market by type, feature, industry, and region available at the regional and global level

Segment

Subsegment

Based on Type:

  • Monocular
  • Binocular

Based on Feature:

  • Basic
  • Advanced

Based on Industry:

  • Education & Research
  • Automotive
  • Consumer
  • Manufacturing
  • Warehousing
  • Healthcare
  • Others (Construction, Public Safety, and Agriculture)

Based on the Region:

  • North America
  • Europe
  • Asia Pacific
  • Rest of the World (Middle East, Africa, and South America)

Recent Developments in Smart Glasses Industy :  

  • In April 2024, Meta announced the Ray-Ban Meta smart glasses collection with new styles. It launched new Skyler frames, Headliner frames, and Ray-Ban Meta for Scuderia Limited Edition.
  • In January 2024, Vuzix, a provider of smart glasses and AR solutions, introduced the Vuzix Z100 smart glasses, initially available in a developer edition. Designed on the Vuzix Ultralite OEM Platform, these safety glasses-certified smart glasses offer a sleek design suitable for all-day wear. They enable workers to establish a human-centered connection to AI and work process applications, providing real-time updates, streamlined workflow confirmations, and essential notifications, all within a comfortable eyewear solution.
  • In September 2023, At Meta Connect, in collaboration with EssilorLuxottica, Meta unveiled the next-generation Ray-Ban Meta smart glasses collection. This redesign incorporated significant enhancements to all foundational features of the first generation, complemented by innovative new functionalities previously unprecedented in smart glasses.
  • In July 2022, EssilorLuxottica and Politecnico di Milano established the EssilorLuxottica Smart Eyewear Lab, marking the first collaborative research center dedicated to shaping the future of smart glasses. This initiative, announced by key figures including government officials and university leaders, involved a significant investment. The lab was expected to focus on industrial research and experimental development aimed at advancing a new generation of wearables capable of autonomous network connectivity.

Key Questions Addressed by Report:

To speak to our analyst for a discussion on the above findings, click Speak to Analyst

TABLE OF CONTENTS
 
1 INTRODUCTION (Page No. - 22)
    1.1 STUDY OBJECTIVES 
    1.2 MARKET DEFINITION 
    1.3 STUDY SCOPE 
           1.3.1 INCLUSIONS AND EXCLUSIONS
           1.3.2 YEARS CONSIDERED
           1.3.3 CURRENCY CONSIDERED
           1.3.4 UNITS CONSIDERED
    1.4 LIMITATIONS 
    1.5 STAKEHOLDERS 
 
2 RESEARCH METHODOLOGY (Page No. - 26)
    2.1 RESEARCH DATA 
           2.1.1 SECONDARY DATA
                    2.1.1.1 Major secondary sources
                    2.1.1.2 Key data from secondary sources
           2.1.2 PRIMARY DATA
                    2.1.2.1 Primary interviews with experts
                    2.1.2.2 List of key primary interview participants
                    2.1.2.3 Breakdown of primary interviews
                    2.1.2.4 Key data from primary sources
           2.1.3 SECONDARY AND PRIMARY RESEARCH
                    2.1.3.1 Key industry insights
    2.2 MARKET SIZE ESTIMATION 
           2.2.1 BOTTOM-UP APPROACH
                    2.2.1.1 Approach to arrive at market size using bottom-up analysis
                    2.2.1.2 Approach to obtain company-specific information on smart glasses value chain
           2.2.2 TOP-DOWN APPROACH
                    2.2.2.1 Approach to arrive at market size using top-down analysis
           2.2.3 SUPPLY-SIDE ANALYSIS
    2.3 DATA TRIANGULATION 
    2.4 RESEARCH ASSUMPTIONS 
    2.5 RESEARCH LIMITATIONS 
    2.6 RISK ASSESSMENT 
 
3 EXECUTIVE SUMMARY (Page No. - 39)
 
4 PREMIUM INSIGHTS (Page No. - 43)
    4.1 ATTRACTIVE GROWTH OPPORTUNITIES FOR PLAYERS IN SMART GLASSES MARKET 
    4.2 SMART GLASSES MARKET, BY TYPE 
    4.3 SMART GLASSES MARKET, BY FEATURE 
    4.4 SMART GLASSES MARKET, BY INDUSTRY 
    4.5 SMART GLASSES MARKET, BY COUNTRY 
 
5 MARKET OVERVIEW (Page No. - 46)
    5.1 INTRODUCTION 
    5.2 MARKET DYNAMICS 
           5.2.1 DRIVERS
                    5.2.1.1 Rapid technological advancements enhancing smart glasses
                    5.2.1.2 Increased demand for AR and MR smart glasses
                    5.2.1.3 Rising adoption in industrial sector
           5.2.2 RESTRAINTS
                    5.2.2.1 Regulatory constraints and safety concerns
                    5.2.2.2 Dynamic consumer preferences
           5.2.3 OPPORTUNITIES
                    5.2.3.1 Developments in 5G Technologies
                    5.2.3.2 Consumer Market Expansion
           5.2.4 CHALLENGES
                    5.2.4.1 Technical limitations
    5.3 VALUE CHAIN ANALYSIS 
    5.4 ECOSYSTEM ANALYSIS 
    5.5 PRICING ANALYSIS 
           5.5.1 AVERAGE SELLING PRICING TREND OF KEY PLAYERS, BY FEATURE
           5.5.2 AVERAGE SELLING PRICING TREND, BY FEATURE (USD)
           5.5.3 INDICATIVE PRICING TREND, BY REGION
    5.6 INVESTMENT AND FUNDING SCENARIO 
    5.7 TRENDS/DISRUPTIONS IMPACTING CUSTOMER BUSINESS 
    5.8 TECHNOLOGY ANALYSIS 
           5.8.1 KEY TECHNOLOGIES
                    5.8.1.1 AR and VR
                    5.8.1.2 Display technologies
           5.8.2 COMPLEMENTARY TECHNOLOGIES
                    5.8.2.1 5G
                    5.8.2.2 Artificial intelligence
           5.8.3 ADJACENT TECHNOLOGIES
                    5.8.3.1 Input method technologies
                    5.8.3.2 Integration of smart glasses with internet of things (IoT) and smart home devices
    5.9 PORTER’S FIVE FORCES ANALYSIS 
    5.10 KEY STAKEHOLDERS AND BUYING CRITERIA 
           5.10.1 KEY STAKEHOLDERS IN BUYING PROCESS
           5.10.2 BUYING CRITERIA
    5.11 TRADE ANALYSIS 
           5.11.1 IMPORT SCENARIO (HS CODE) 9004
           5.11.2 EXPORT SCENARIO (HS CODE) 9004
    5.12 PATENT ANALYSIS 
    5.13 CASE STUDIES 
           5.13.1 SMART GLASSES IN CUSTOMER SUPPORT AND OPERATIONS
           5.13.2 SMART GLASSES IN REMOTE SUPPORT
           5.13.3 SMART GLASSES IN HEALTHCARE
           5.13.4 SMART GLASSES IN LOGISTICS
    5.14 REGULATORY LANDSCAPE 
           5.14.1 GLOBAL REGULATIONS
           5.14.2 GOVERNMENT REGULATIONS
    5.15 KEY CONFERENCES AND EVENTS, 2024–2025 
    5.16 IMPACT OF AI/GEN AI ON SMART GLASSES MARKET 
           5.16.1 TOP USE CASES AND MARKET POTENTIAL
           5.16.2 KEY AI USE CASES
                    5.16.2.1 AI smart glasses for gaming
                    5.16.2.2 AI smart glasses for professional and industrial applications
                    5.16.2.3 Best practices: Who is implementing above use cases?
           5.16.3 INTERCONNECT ADJACENT ECOSYSTEM
 
6 OPERATING SYSTEMS IN SMART GLASSES (Page No. - 85)
    6.1 INTRODUCTION 
    6.2 ANDROID 
    6.3 IOS 
    6.4 WINDOWS 
    6.5 OTHER PROPRIETARY OPERATING SYSTEMS 
 
7 CONNECTIVITY IN SMART GLASSES (Page No. - 88)
    7.1 INTRODUCTION 
    7.2 WI-FI 
    7.3 BLUETOOTH 
    7.4 OTHER CONNECTIVITY TECHNOLOGIES 
 
8 TINTING TECHNOLOGY IN SMART GLASSES (Page No. - 90)
    8.1 INTRODUCTION 
    8.2 POLYMER-DISPERSED LIQUID CRYSTALS 
    8.3 ELECTROCHROMIC 
    8.4 PHOTOCHROMIC 
    8.5 SUSPENDED PARTICLE DEVICE TECHNOLOGY 
 
9 APPLICATIONS OF SMART GLASSES (Page No. - 93)
    9.1 INTRODUCTION 
    9.2 GAMING & ENTERTAINMENT 
    9.3 REMOTE INSPECTION 
    9.4 TELEMEDICINE 
    9.5 PRODUCT DESIGN & DEVELOPMENT 
    9.6 3D VISUALIZATION & PROTOTYPING 
    9.7 OTHER APPLICATIONS 
 
10 SMART GLASSES MARKET, BY TYPE (Page No. - 96)
     10.1 INTRODUCTION 
     10.2 MONOCULAR 
             10.2.1 USE FOR ENHANCING EFFICIENCY AND SAFETY TO DRIVE MARKET
     10.3 BINOCULAR 
             10.3.1 USE FOR IMMERSIVE AR EXPERIENCE TO BOOST DEMAND IN CONSUMER INDUSTRY AND INDUSTRIAL SECTOR
     10.4 TYPES OF SMART GLASSES BASED ON COLOR OF DISPLAY 
             10.4.1 MONOCHROME SMART GLASSES
             10.4.2 FULL-COLOR SMART GLASSES
 
11 SMART GLASSES MARKET, BY FEATURE (Page No. - 105)
     11.1 INTRODUCTION 
     11.2 BASIC 
             11.2.1 RAPID GROWTH IN CONSUMER APPLICATIONS TO DRIVE DEMAND
     11.3 ADVANCED 
             11.3.1 ADVANCED SMART GLASSES EMPOWERING INDUSTRIES WITH AUGMENTED INTELLIGENCE TO BOOST SEGMENTAL GROWTH
 
12 SMART GLASSES MARKET, BY INDUSTRY (Page No. - 113)
     12.1 INTRODUCTION 
     12.2 EDUCATION & RESEARCH 
             12.2.1 RISING DEMAND IN TRAINING COURSES AND VIRTUAL FIELD TRIPS TO BOOST SEGMENTAL GROWTH
     12.3 HEALTHCARE 
             12.3.1 USE IN SURGERY, TELEMEDICINE, AND TRAINING TO DRIVE GROWTH
     12.4 CONSUMER 
             12.4.1 RISING DEMAND FOR GAMING, COMMUNICATION AND ENTERTAINMENT TO BOOST GROWTH
     12.5 AUTOMOTIVE 
             12.5.1 USE IN AR-BASED REPAIR ASSISTANCE, ENHANCED VEHICLE ASSEMBLY, AND DESIGN PROTOTYPING TO BOOST DEMAND
     12.6 MANUFACTURING 
             12.6.1 INCREASING DEMAND IN REMOTE ASSISTANCE, WORKFLOW SUPPORT, AND 3D VISUALIZATION TO DRIVE MARKET
     12.7 WAREHOUSING 
             12.7.1 NEED FOR INVENTORY MANAGEMENT TO DRIVE MARKET
     12.8 OTHER INDUSTRIES 
 
13 SMART GLASSES MARKET, BY REGION (Page No. - 132)
     13.1 INTRODUCTION 
     13.2 NORTH AMERICA 
             13.2.1 MACROECONOMIC OUTLOOK FOR NORTH AMERICA
             13.2.2 US
                        13.2.2.1 Presence of leading tech giants and robust technological developments to drive market
             13.2.3 CANADA
                        13.2.3.1 Rapid adoption in enterprise sector to drive market
             13.2.4 MEXICO
                        13.2.4.1 Growing demand from consumer and manufacturing industries to drive market
     13.3 EUROPE 
             13.3.1 MACROECONOMIC OUTLOOK FOR EUROPE
             13.3.2 GERMANY
                        13.3.2.1 Rising adoption in thriving automotive industry to boost market
             13.3.3 UK
                        13.3.3.1 Demand from healthcare and education & research to trigger growth
             13.3.4 FRANCE
                        13.3.4.1 Increasing demand from tourism and presence of smart glass manufacturers to fuel regional growth
             13.3.5 ITALY
                        13.3.5.1 Adoption in hospitality, tourism, and automotive industries to drive regional growth
             13.3.6 REST OF EUROPE
     13.4 ASIA PACIFIC 
             13.4.1 MACROECONOMIC OUTLOOK FOR ASIA PACIFIC
             13.4.2 CHINA
                        13.4.2.1 Large presence of smart glass manufacturers and massive consumer market opportunities to drive market
             13.4.3 JAPAN
                        13.4.3.1 Innovation in manufacturing and advanced technologies to drive market
             13.4.4 SOUTH KOREA
                        13.4.4.1 Government support and technological advancements to offer lucrative growth opportunities
             13.4.5 INDIA
                        13.4.5.1 Rising adoption by large young population to drive market
             13.4.6 REST OF ASIA PACIFIC
     13.5 ROW 
             13.5.1 MACROECONOMIC OUTLOOK FOR ROW
             13.5.2 MIDDLE EAST
                        13.5.2.1 Adoption in oil & gas industry to drive market
                        13.5.2.2 GCC countries
                                     13.5.2.2.1 Rising adoption in consumer and oil & gas industries to create market opportunities
                        13.5.2.3 Rest of the Middle East
             13.5.3 AFRICA
                        13.5.3.1 Adoption in healthcare & education to create opportunities
             13.5.4 SOUTH AMERICA
                        13.5.4.1 Demand in manufacturing and agriculture to drive regional growth
 
14 COMPETITIVE LANDSCAPE (Page No. - 159)
     14.1 OVERVIEW 
     14.2 KEY PLAYER STRATEGIES/RIGHT TO WIN, 2020–2023 
             14.2.1 PRODUCT PORTFOLIO
             14.2.2 REGIONAL FOCUS
             14.2.3 MANUFACTURING FOOTPRINT
             14.2.4 ORGANIC/INORGANIC GROWTH STRATEGIES
     14.3 REVENUE ANALYSIS, 2019–2023 
     14.4 MARKET SHARE ANALYSIS, 2023 
     14.5 COMPANY VALUATION AND FINANCIAL METRICS 
     14.6 BRAND/PRODUCT COMPARISON 
     14.7 COMPANY EVALUATION MATRIX: KEY PLAYERS, 2023 
             14.7.1 STARS
             14.7.2 EMERGING LEADERS
             14.7.3 PERVASIVE PLAYERS
             14.7.4 PARTICIPANTS
             14.7.5 COMPANY FOOTPRINT: KEY PLAYERS, 2023
                        14.7.5.1 Company footprint
                        14.7.5.2 Industry footprint
                        14.7.5.3 Type footprint
                        14.7.5.4 Feature footprint
                        14.7.5.5 Regional footprint
     14.8 COMPANY EVALUATION MATRIX: STARTUPS/SMES, 2023 
             14.8.1 PROGRESSIVE COMPANIES
             14.8.2 RESPONSIVE COMPANIES
             14.8.3 DYNAMIC COMPANIES
             14.8.4 STARTING BLOCKS
             14.8.5 COMPETITIVE BENCHMARKING OF KEY STARTUPS/SMES
                        14.8.5.1 Detailed list of key startups/SMEs
     14.9 COMPETITIVE SCENARIO AND TRENDS 
             14.9.1 PRODUCT LAUNCHES
             14.9.2 DEALS
 
15 COMPANY PROFILES (Page No. - 181)
     15.1 KEY PLAYERS 
             15.1.1 VUZIX
                        15.1.1.1 Business overview
                        15.1.1.2 Products offered
                        15.1.1.3 Recent developments
                                     15.1.1.3.1 Product launches/developments
                                     15.1.1.3.2 Deals
                                     15.1.1.3.3 Expansions
                                     15.1.1.3.4 Other developments
                        15.1.1.4 MnM view
                                     15.1.1.4.1 Right to win
                                     15.1.1.4.2 Strategic choices
                                     15.1.1.4.3 Weaknesses and competitive threats
             15.1.2 META
                        15.1.2.1 Business overview
                        15.1.2.2 Products offered
                        15.1.2.3 Recent developments
                                     15.1.2.3.1 Product launches
                        15.1.2.4 MnM view
                                     15.1.2.4.1 Key strengths/Right to win
                                     15.1.2.4.2 Strategic choices
                                     15.1.2.4.3 Weaknesses and competitive threats
             15.1.3 ESSILORLUXOTTICA
                        15.1.3.1 Business overview
                        15.1.3.2 Products offered
                                     15.1.3.2.1 Product launches
                        15.1.3.3 Recent developments
                                     15.1.3.3.1 Deals
                        15.1.3.4 MnM view
                                     15.1.3.4.1 Key strengths/Right to win
                                     15.1.3.4.2 Strategic choices
                                     15.1.3.4.3 Weaknesses and competitive threats
             15.1.4 SEIKO EPSON CORPORATION
                        15.1.4.1 Business overview
                        15.1.4.2 Products offered
                        15.1.4.3 Recent developments
                                     15.1.4.3.1 Product launches/developments
                                     15.1.4.3.2 Deals
                        15.1.4.4 MnM view
                                     15.1.4.4.1 Key strengths/Right to win
                                     15.1.4.4.2 Strategic choices
                                     15.1.4.4.3 Weaknesses and competitive threats
             15.1.5 TCL ELECTRONICS HOLDINGS LIMITED
                        15.1.5.1 Business overview
                        15.1.5.2 Products offered
                        15.1.5.3 Recent developments
                                     15.1.5.3.1 Product launches
                                     15.1.5.3.2 Deals
                        15.1.5.4 MnM view
                                     15.1.5.4.1 Key strengths/Right to win
                                     15.1.5.4.2 Strategic choices
                                     15.1.5.4.3 Weaknesses and competitive threats
             15.1.6 LENOVO
                        15.1.6.1 Business overview
                        15.1.6.2 Products offered
                        15.1.6.3 Recent developments
                                     15.1.6.3.1 Product launches
             15.1.7 LUCYD EYEWEAR
                        15.1.7.1 Business overview
                        15.1.7.2 Products offered
                        15.1.7.3 Recent developments
                                     15.1.7.3.1 Product launches/developments
                                     15.1.7.3.2 Deals
                                     15.1.7.3.3 Other developments
             15.1.8 AMAZON.COM, INC.
                        15.1.8.1 Business overview
                        15.1.8.2 Products offered
                        15.1.8.3 Recent developments
                                     15.1.8.3.1 Product launches
             15.1.9 HUAWEI INVESTMENT & HOLDING CO., LTD.
                        15.1.9.1 Business overview
                        15.1.9.2 Products offered
             15.1.10 XIAOMI
                        15.1.10.1 Business overview
                        15.1.10.2 Products offered
                        15.1.10.3 Recent developments
                                     15.1.10.3.1 Product launches
     15.2 OTHER PLAYERS 
             15.2.1 SNAP INC.
             15.2.2 RAZER INC.
             15.2.3 DYNABOOK INC.
             15.2.4 THIRDEYE
             15.2.5 REALWEAR INC
             15.2.6 DIGILENS INC.
             15.2.7 SOLOS SMARTGLASSES
             15.2.8 XREAL, INC.
             15.2.9 ROKID
             15.2.10 AMPERE LLC
             15.2.11 MAGIC LEAP, INC.
             15.2.12 BRILLIANT LABS
             15.2.13 EVERYSIGHT
             15.2.14 FAUNA AUDIO GMBH
             15.2.15 OPTINVENT
             15.2.16 OPPO
 
16 ADJACENT AND RELATED MARKETS (Page No. - 251)
     16.1 INTRODUCTION 
     16.2 HEAD-MOUNTED DISPLAY MARKET, BY TECHNOLOGY 
             16.2.1 AUGMENTED REALITY
                        16.2.1.1 Enhanced user perception with AR-enabled devices to drive segment
 
17 APPENDIX (Page No. - 255)
     17.1 DISCUSSION GUIDE 
     17.2 KNOWLEDGESTORE: MARKETSANDMARKETS’ SUBSCRIPTION PORTAL 
     17.3 CUSTOMIZATION OPTIONS 
     17.4 RELATED REPORTS 
     17.5 AUTHOR DETAILS 
 
LIST OF TABLES (181 TABLES)
 
TABLE 1 SMART GLASSES MARKET: ECOSYSTEM
TABLE 2 AVERAGE SELLING PRICES OF SMART GLASSES OFFERED BY KEY PLAYERS, BY FEATURE (USD)
TABLE 3 AVERAGE SELLING PRICING TREND OF SMART GLASSES OFFERED BY KEY PLAYERS, BY ADVANCED FEATURE (USD)
TABLE 4 AVERAGE SELLING PRICING TREND OF SMART GLASSES, BY FEATURE (USD)
TABLE 5 INDICATIVE PRICING TREND OF SMART GLASSES, BY REGION (USD)
TABLE 6 SMART GLASSES MARKET: PORTER’S FIVE FORCES ANALYSIS
TABLE 7 INFLUENCE OF STAKEHOLDERS ON BUYING PROCESS FOR TOP-THREE INDUSTRIES
TABLE 8 KEY BUYING CRITERIA FOR TOP-THREE INDUSTRIES
TABLE 9 IMPORT DATA FOR HS CODE 9004, BY COUNTRY 2019–2023 (USD MILLION)
TABLE 10 EXPORT DATA FOR HS CODE 9004, BY COUNTRY, 2019–2023 (USD MILLION)
TABLE 11 LIST OF KEY PATENTS IN MARKET, 2020–2023
TABLE 12 REALWEAR AND MICROSOFT POWER APPS TRANSFORMED RAYMOND WEST’S CUSTOMER SUPPORT AND OPERATIONS
TABLE 13 MICHELIN UNLOCKS VALUE OF REMOTE SUPPORT WITH REALWEAR
TABLE 14 VUZIX SMART GLASSES ENHANCE PATIENT CARE AND OPERATIONAL EFFICIENCY
TABLE 15 VUZIX SMART GLASSES ENHANCE EFFICIENCY FOR LOGISTICS INDUSTRY
TABLE 16 NORTH AMERICA: LIST OF REGULATORY BODIES, GOVERNMENT AGENCIES, AND OTHER ORGANIZATIONS
TABLE 17 EUROPE: LIST OF REGULATORY BODIES, GOVERNMENT AGENCIES, AND OTHER ORGANIZATIONS
TABLE 18 ASIA PACIFIC: LIST OF REGULATORY BODIES, GOVERNMENT AGENCIES, AND OTHER ORGANIZATIONS
TABLE 19 ROW: LIST OF REGULATORY BODIES, GOVERNMENT AGENCIES, AND OTHER ORGANIZATIONS
TABLE 20 SMART GLASSES MARKET: KEY CONFERENCES AND EVENTS, 2024–2025
TABLE 21 MARKET, BY TYPE, 2021–2023 (USD MILLION)
TABLE 22 MARKET, BY TYPE, 2024–2030 (USD MILLION)
TABLE 23 MONOCULAR: MARKET, BY REGION, 2021–2023 (USD MILLION)
TABLE 24 MONOCULAR: MARKET, BY REGION, 2024–2030 (USD MILLION)
TABLE 25 MONOCULAR: MARKET, BY INDUSTRY, 2021–2023 (USD MILLION)
TABLE 26 MONOCULAR: MARKET, BY INDUSTRY, 2024–2030 (USD MILLION)
TABLE 27 BINOCULAR: MARKET, BY REGION, 2021–2023 (USD MILLION)
TABLE 28 BINOCULAR: MARKET, BY REGION, 2024–2030 (USD MILLION)
TABLE 29 BINOCULAR: MARKET, BY INDUSTRY, 2021–2023 (USD MILLION)
TABLE 30 BINOCULAR: MARKET, BY INDUSTRY, 2024–2030 (USD MILLION)
TABLE 31 MARKET, BY FEATURE, 2021–2023 (USD MILLION)
TABLE 32 MARKET, BY FEATURE, 2024–2030 (USD MILLION)
TABLE 33 MARKET, BY FEATURE, 2021–2023 (THOUSAND UNITS)
TABLE 34 SMART GLASSES MARKET, BY FEATURE, 2024–2030 (THOUSAND UNITS)
TABLE 35 BASIC FEATURE: MARKET, BY INDUSTRY, 2021–2023 (USD MILLION)
TABLE 36 BASIC FEATURE: MARKET, BY INDUSTRY, 2024–2030 (USD MILLION)
TABLE 37 ADVANCED FEATURE: MARKET, BY INDUSTRY, 2021–2023 (USD MILLION)
TABLE 38 ADVANCED: MARKET, BY INDUSTRY, 2024–2030 (USD MILLION)
TABLE 39 MARKET, BY INDUSTRY, 2021–2023 (USD MILLION)
TABLE 40 MARKET, BY INDUSTRY, 2024–2030 (USD MILLION)
TABLE 41 EDUCATION & RESEARCH: MARKET, BY REGION, 2021–2023 (USD MILLION)
TABLE 42 EDUCATION & RESEARCH: SMART GLASSES MARKET, BY REGION, 2024–2030 (USD MILLION)
TABLE 43 EDUCATION & RESEARCH: MARKET, BY FEATURE, 2021–2023 (USD MILLION)
TABLE 44 EDUCATION & RESEARCH: MARKET, BY FEATURE, 2024–2030 (USD MILLION)
TABLE 45 EDUCATION & RESEARCH: SMART GLASSES MARKET, BY TYPE, 2021–2023 (USD MILLION)
TABLE 46 EDUCATION & RESEARCH: MARKET, BY TYPE, 2024–2030 (USD MILLION)
TABLE 47 HEALTHCARE: MARKET, BY REGION, 2021–2023 (USD MILLION)
TABLE 48 HEALTHCARE: MARKET, BY REGION, 2024–2030 (USD MILLION)
TABLE 49 HEALTHCARE: MARKET, BY FEATURE, 2021–2023 (USD MILLION)
TABLE 50 HEALTHCARE: MARKET, BY FEATURE, 2024–2030 (USD MILLION)
TABLE 51 HEALTHCARE: MARKET, BY TYPE, 2021–2023 (USD MILLION)
TABLE 52 HEALTHCARE: MARKET, BY TYPE, 2024–2030 (USD MILLION)
TABLE 53 CONSUMER: MARKET, BY REGION, 2021–2023 (USD MILLION)
TABLE 54 CONSUMER:MARKET, BY REGION, 2024–2030 (USD MILLION)
TABLE 55 CONSUMER: MARKET, BY FEATURE, 2021–2023 (USD MILLION)
TABLE 56 CONSUMER: MARKET, BY FEATURE, 2024–2030 (USD MILLION)
TABLE 57 CONSUMER: MARKET, BY TYPE, 2021–2023 (USD MILLION)
TABLE 58 CONSUMER: MARKET, BY TYPE, 2024–2030 (USD MILLION)
TABLE 59 AUTOMOTIVE: MARKET, BY REGION, 2021–2023 (USD MILLION)
TABLE 60 AUTOMOTIVE: MARKET, BY REGION, 2024–2030 (USD MILLION)
TABLE 61 AUTOMOTIVE: MARKET, BY FEATURE, 2021–2023 (USD MILLION)
TABLE 62 AUTOMOTIVE: MARKET, BY FEATURE, 2024–2030 (USD MILLION)
TABLE 63 AUTOMOTIVE: SMART GLASSES MARKET, BY TYPE, 2021–2023 (USD MILLION)
TABLE 64 AUTOMOTIVE: MARKET, BY TYPE, 2024–2030 (USD MILLION)
TABLE 65 MANUFACTURING: MARKET, BY REGION, 2021–2023 (USD MILLION)
TABLE 66 MANUFACTURING: MARKET, BY REGION, 2024–2030 (USD MILLION)
TABLE 67 MANUFACTURING: MARKET, BY FEATURE, 2021–2023 (USD MILLION)
TABLE 68 MANUFACTURING: SMART GLASSES MARKET, BY FEATURE, 2024–2030 (USD MILLION)
TABLE 69 MANUFACTURING: MARKET, BY TYPE, 2021–2023 (USD MILLION)
TABLE 70 MANUFACTURING: MARKET, BY TYPE, 2024–2030 (USD MILLION)
TABLE 71 WAREHOUSING: MARKET, BY REGION, 2021–2023 (USD MILLION)
TABLE 72 WAREHOUSING: MARKET, BY REGION, 2024–2030 (USD MILLION)
TABLE 73 WAREHOUSING: MARKET, BY FEATURE, 2021–2023 (USD MILLION)
TABLE 74 WAREHOUSING: SMART GLASSES MARKET, BY FEATURE, 2024–2030 (USD MILLION)
TABLE 75 WAREHOUSING: MARKET, BY TYPE, 2021–2023 (USD MILLION)
TABLE 76 WAREHOUSING:MARKET, BY TYPE, 2024–2030 (USD MILLION)
TABLE 77 OTHER INDUSTRIES: MARKET, BY REGION, 2021–2023 (USD MILLION)
TABLE 78 OTHER INDUSTRIES: SMART GLASSES MARKET, BY REGION, 2024–2030 (USD MILLION)
TABLE 79 OTHER INDUSTRIES: MARKET, BY FEATURE, 2021–2023 (USD MILLION)
TABLE 80 OTHER INDUSTRIES: MARKET, BY FEATURE, 2024–2030 (USD MILLION)
TABLE 81 OTHER INDUSTRIES: MARKET, BY TYPE, 2021–2023 (USD MILLION)
TABLE 82 OTHER INDUSTRIES: MARKET, BY TYPE, 2024–2030 (USD MILLION)
TABLE 83 MARKET, BY REGION, 2021–2023 (USD MILLION)
TABLE 84 MARKET, BY REGION, 2024–2030 (USD MILLION)
TABLE 85 NORTH AMERICA: MARKET, BY COUNTRY, 2021–2023 (USD MILLION)
TABLE 86 NORTH AMERICA:MARKET, BY COUNTRY, 2024–2030 (USD MILLION)
TABLE 87 NORTH AMERICA:  MARKET, BY INDUSTRY, 2021–2023 (USD MILLION)
TABLE 88 NORTH AMERICA: MARKET, BY INDUSTRY, 2024–2030 (USD MILLION)
TABLE 89 NORTH AMERICA: MARKET, BY TYPE, 2021–2023 (USD MILLION)
TABLE 90 NORTH AMERICA: MARKET, BY TYPE, 2024–2030 (USD MILLION)
TABLE 91 EUROPE: MARKET, BY COUNTRY, 2021–2023 (USD MILLION)
TABLE 92 EUROPE: MARKET, BY COUNTRY, 2024–2030 (USD MILLION)
TABLE 93 EUROPE: MARKET, BY TYPE, 2021–2023 (USD MILLION)
TABLE 94 EUROPE: MARKET, BY TYPE, 2024–2030 (USD MILLION)
TABLE 95 EUROPE: MARKET, BY INDUSTRY, 2021–2023 (USD MILLION)
TABLE 96 EUROPE: MARKET, BY INDUSTRY, 2024–2030 (USD MILLION)
TABLE 97 ASIA PACIFIC: MARKET, BY COUNTRY, 2021–2023 (USD MILLION)
TABLE 98 ASIA PACIFIC: MARKET, BY COUNTRY, 2024–2030 (USD MILLION)
TABLE 99 ASIA PACIFIC: SMART GLASSES MARKET, BY TYPE, 2021–2023 (USD MILLION)
TABLE 100 ASIA PACIFIC: MARKET, BY TYPE, 2024–2030 (USD MILLION)
TABLE 101 ASIA PACIFIC: MARKET, BY INDUSTRY, 2021–2023 (USD MILLION)
TABLE 102 ASIA PACIFIC: MARKET, BY INDUSTRY, 2024–2030 (USD MILLION)
TABLE 103 ROW: MARKET, BY REGION, 2021–2023 (USD MILLION)
TABLE 104 ROW: MARKET, BY REGION, 2024–2030 (USD MILLION)
TABLE 105 ROW: MARKET, BY TYPE, 2021–2023 (USD MILLION)
TABLE 106 ROW: MARKET, BY TYPE, 2024–2030 (USD MILLION)
TABLE 107 ROW: SMART GLASSES MARKET, BY INDUSTRY, 2021–2023 (USD MILLION)
TABLE 108 ROW: MARKET, BY INDUSTRY, 2024–2030 (USD MILLION)
TABLE 109 MIDDLE EAST:  MARKET, BY REGION, 2021–2023 (USD MILLION)
TABLE 110 MIDDLE EAST: MARKET, BY REGION, 2024–2030 (USD MILLION)
TABLE 111 OVERVIEW OF STRATEGIES ADOPTED BY KEY PLAYERS, 2020–2023
TABLE 112 MARKET: DEGREE OF COMPETITION
TABLE 113 MARKET: INDUSTRY FOOTPRINT
TABLE 114 SMART GLASSES MARKET: TYPE FOOTPRINT
TABLE 115 MARKET: FEATURE FOOTPRINT
TABLE 116 MARKET: REGIONAL FOOTPRINT
TABLE 117 MARKET: COMPETITIVE BENCHMARKING OF KEY STARTUPS/SMES
TABLE 118 MARKET: KEY STARTUPS/SMES
TABLE 119 MARKET: PRODUCT LAUNCHES, JANUARY 2020–JULY 2024
TABLE 120 SMART GLASSES MARKET: DEALS, JANUARY 2020–JULY 2024
TABLE 121 VUZIX: COMPANY OVERVIEW
TABLE 122 VUZIX: PRODUCTS OFFERED
TABLE 123 VUZIX: PRODUCT LAUNCHES/DEVELOPMENTS
TABLE 124 VUZIX.: DEALS
TABLE 125 VUZIX.: EXPANSIONS
TABLE 126 VUZIX.: OTHER DEVELOPMENTS
TABLE 127 META: COMPANY OVERVIEW
TABLE 128 META: PRODUCTS OFFERED
TABLE 129 META: PRODUCT LAUNCHES
TABLE 130 ESSILORLUXOTTICA: COMPANY OVERVIEW
TABLE 131 ESSILORLUXOTTICA: PRODUCTS OFFERED
TABLE 132 ESSILORLUXOTTICA: PRODUCT LAUNCHES
TABLE 133 ESSILORLUXOTTICA: DEALS
TABLE 134 SEIKO EPSON CORPORATION: COMPANY OVERVIEW
TABLE 135 SEIKO EPSON CORPORATION: PRODUCTS OFFERED
TABLE 136 SEIKO EPSON CORPORATION: PRODUCT LAUNCHES/DEVELOPMENTS
TABLE 137 SEIKO EPSON CORPORATION: DEALS
TABLE 138 TCL ELECTRONICS HOLDINGS LIMITED: COMPANY OVERVIEW
TABLE 139 TCL ELECTRONICS HOLDINGS LIMITED: PRODUCTS OFFERED
TABLE 140 TCL ELECTRONICS HOLDINGS LIMITED: PRODUCT LAUNCHES
TABLE 141 TCL ELECTRONICS HOLDINGS LIMITED: DEALS
TABLE 142 LENOVO: COMPANY OVERVIEW
TABLE 143 LENOVO: PRODUCTS OFFERED
TABLE 144 LENOVO: PRODUCT LAUNCHES
TABLE 145 LUCYD EYEWEAR: COMPANY OVERVIEW
TABLE 146 LUCYD EYEWEAR: PRODUCTS OFFERED
TABLE 147 LUCYD EYEWEAR: PRODUCT LAUNCHES/DEVELOPMENTS
TABLE 148 LUCYD EYEWEAR: DEALS
TABLE 149 LUCYD EYEWEAR: OTHER DEVELOPMENTS
TABLE 150 AMAZON.COM, INC.: COMPANY OVERVIEW
TABLE 151 AMAZON.COM, INC.: PRODUCTS OFFERED
TABLE 152 AMAZON.COM, INC.: PRODUCT LAUNCHES
TABLE 153 HUAWEI INVESTMENT & HOLDING CO., LTD.: COMPANY OVERVIEW
TABLE 154 HUAWEI INVESTMENT & HOLDING CO., LTD.: PRODUCTS OFFERED
TABLE 155 XIAOMI: COMPANY OVERVIEW
TABLE 156 XIAOMI: PRODUCTS OFFERED
TABLE 157 XIAOMI: PRODUCT LAUNCHES
TABLE 158 SNAP INC.: COMPANY OVERVIEW
TABLE 159 RAZER INC.: COMPANY OVERVIEW
TABLE 160 DYNABOOK INC.: COMPANY OVERVIEW
TABLE 161 THIRDEYE: COMPANY OVERVIEW
TABLE 162 REALWEAR INC: COMPANY OVERVIEW
TABLE 163 DIGILENS INC.: COMPANY OVERVIEW
TABLE 164 SOLOS SMARTGLASSES: COMPANY OVERVIEW
TABLE 165 XREAL, INC.: COMPANY OVERVIEW
TABLE 166 ROKID: COMPANY OVERVIEW
TABLE 167 AMPERE LLC: COMPANY OVERVIEW
TABLE 168 MAGIC LEAP, INC.: COMPANY OVERVIEW
TABLE 169 BRILLIANT LABS: COMPANY OVERVIEW
TABLE 170 EVERYSIGHT: COMPANY OVERVIEW
TABLE 171 FAUNA AUDIO GMBH: COMPANY OVERVIEW
TABLE 172 OPTINVENT: COMPANY OVERVIEW
TABLE 173 OPPO: COMPANY OVERVIEW
TABLE 174 HEAD-MOUNTED DISPLAY MARKET, BY TECHNOLOGY, 2020–2023 (USD MILLION)
TABLE 175 HEAD-MOUNTED DISPLAY MARKET, BY TECHNOLOGY, 2024–2029 (USD MILLION)
TABLE 176 HEAD-MOUNTED DISPLAY MARKET, BY TECHNOLOGY, 2020–2023 (MILLION UNITS)
TABLE 177 HEAD-MOUNTED DISPLAY MARKET, BY TECHNOLOGY, 2024–2029 (MILLION UNITS)
TABLE 178 AUGMENTED REALITY: HEAD-MOUNTED DISPLAY MARKET, BY CONNECTIVITY, 2020–2023 (USD MILLION)
TABLE 179 AUGMENTED REALITY: HEAD-MOUNTED DISPLAY MARKET, BY CONNECTIVITY, 2024–2029 (USD MILLION)
TABLE 180 AUGMENTED REALITY: HEAD-MOUNTED DISPLAY MARKET, BY CONNECTIVITY, 2020–2023 (THOUSAND UNITS)
TABLE 181 AUGMENTED REALITY: HEAD-MOUNTED DISPLAY MARKET, BY CONNECTIVITY, 2024–2029 (THOUSAND UNITS)
 
 
LIST OF FIGURES (75 FIGURES)
 
FIGURE 1 SMART GLASSES MARKET SEGMENTATION
FIGURE 2  MARKET: PROCESS FLOW OF MARKET SIZE ESTIMATION
FIGURE 3 MARKET: RESEARCH DESIGN
FIGURE 4 MARKET SIZE ESTIMATION METHODOLOGY: BOTTOM-UP APPROACH
FIGURE 5 MARKET SIZE ESTIMATION METHODOLOGY: TOP-DOWN APPROACH
FIGURE 6 SMART GLASSES MARKET: MARKET SIZE ESTIMATION METHODOLOGY (SUPPLY SIDE)
FIGURE 7 MARKET SIZE ESTIMATION METHODOLOGY (SUPPLY SIDE): REVENUE GENERATED FROM SALE OF SMART GLASSES
FIGURE 8 MARKET: DATA TRIANGULATION
FIGURE 9 MARKET: KEY RESEARCH ASSUMPTIONS
FIGURE 10 MARKET SIZE, 2021–2030 (USD MILLION)
FIGURE 11 ADVANCED FEATURE SEGMENT TO DOMINATE MARKET IN 2030
FIGURE 12 BINOCULAR SEGMENT TO LEAD MARKET IN 2030
FIGURE 13 CONSUMER INDUSTRY SEGMENT TO ACCOUNT FOR LARGEST SHARE OF MARKET BY 2030
FIGURE 14 MARKET IN ASIA PACIFIC TO REGISTER HIGHEST CAGR DURING FORECAST PERIOD
FIGURE 15 INCREASING DEMAND FOR AR AND MR SMART GLASSES AND RAPID TECHNOLOGICAL DEVELOPMENTS TO DRIVE MARKET
FIGURE 16 BINOCULAR SEGMENT TO ACCOUNT FOR LARGER MARKET SHARE BY 2030
FIGURE 17 ADVANCED FEATURE SMART GLASSES TO DOMINATE MARKET, BY 2030
FIGURE 18 CONSUMER INDUSTRY TO ACCOUNT FOR MAJORITY MARKET SHARE BY 2030
FIGURE 19 CHINA TO REGISTER HIGHEST CAGR DURING FORECAST PERIOD
FIGURE 20 DRIVERS, RESTRAINTS, OPPORTUNITIES, AND CHALLENGES IN SMART GLASSES MARKET
FIGURE 21 MARKET: IMPACT ANALYSIS OF DRIVERS
FIGURE 22 SMART GLASSES MARKET: IMPACT ANALYSIS OF RESTRAINTS
FIGURE 23 MARKET: IMPACT ANALYSIS OF OPPORTUNITIES
FIGURE 24 MARKET: IMPACT ANALYSIS OF CHALLENGES
FIGURE 25 MARKET: VALUE CHAIN ANALYSIS
FIGURE 26 MARKET: ECOSYSTEM ANALYSIS
FIGURE 27 AVERAGE SELLING PRICES OF SMART GLASSES OFFERED BY KEY PLAYERS, BY FEATURE (USD)
FIGURE 28 PRICING TREND OF SMART GLASSES, BY FEATURE, 2020–2023 (USD)
FIGURE 29 INDICATIVE PRICING TREND OF SMART GLASSES, BY REGION, 2020–2023 (USD)
FIGURE 30 SMART GLASSES MARKET: INVESTMENT AND FUNDING SCENARIO
FIGURE 31 TRENDS/DISRUPTIONS IMPACTING CUSTOMER BUSINESS
FIGURE 32 SMART GLASSES MARKET: PORTER’S FIVE FORCES ANALYSIS
FIGURE 33 INFLUENCE OF STAKEHOLDERS ON BUYING PROCESS FOR TOP-THREE INDUSTRIES
FIGURE 34 KEY BUYING CRITERIA FOR TOP-THREE INDUSTRIES
FIGURE 35 IMPORT DATA FOR HS CODE 9004, 2019-2023
FIGURE 36 EXPORT DATA FOR HS CODE 9004, 2019-2023
FIGURE 37 PATENT ANALYSIS, 2014–2023
FIGURE 38 SMART GLASSES: KEY AI USE CASES
FIGURE 39 MARKET, BY APPLICATION (2023)
FIGURE 40 MARKET, BY TYPE
FIGURE 41 BINOCULAR SMART GLASSES TO RECORD HIGHER CAGR DURING FORECAST PERIOD
FIGURE 42 ASIA PACIFIC TO EXHIBIT FASTEST GROWTH IN MONOCULAR MARKET DURING FORECAST PERIOD
FIGURE 43 NORTH AMERICA TO HOLD LARGEST SHARE OF BINOCULAR MARKET IN 2030
FIGURE 44 MARKET, BY FEATURE
FIGURE 45 ADVANCED FEATURE SMART GLASSES TO RECORD HIGHER CAGR DURING FORECAST PERIOD
FIGURE 46 CONSUMER INDUSTRY TO HOLD LARGEST MARKET SHARE OF BASIC FEATURE SMART GLASSES MARKET DURING FORECAST PERIOD
FIGURE 47 MANUFACTURING INDUSTRY TO GROW AT HIGHEST CAGR IN ADVANCED FEATURE SEGMENT DURING FORECAST PERIOD
FIGURE 48 MARKET, BY INDUSTRY
FIGURE 49 CONSUMER INDUSTRY TO DOMINATE MARKET BY 2030
FIGURE 50 MARKET, BY REGION
FIGURE 51 CHINA TO EXPAND AT HIGHEST CAGR IN MARKET DURING FORECAST PERIOD
FIGURE 52 NORTH AMERICA: MARKET SNAPSHOT
FIGURE 53 US TO DOMINATE MARKET DURING FORECAST PERIOD
FIGURE 54 EUROPE: MARKET SNAPSHOT
FIGURE 55 GERMANY TO HOLD LARGEST SHARE IN EUROPEAN MARKET
FIGURE 56 ASIA PACIFIC: MARKET SNAPSHOT
FIGURE 57 CHINA TO DOMINATE ASIA PACIFIC MARKET DURING FORECAST PERIOD
FIGURE 58 MIDDLE EAST TO HOLD MAJOR SHARE IN MARKET IN ROW DURING FORECAST PERIOD
FIGURE 59 REVENUE ANALYSIS OF FIVE KEY PLAYERS, 2019–2023
FIGURE 60 MARKET SHARE ANALYSIS, 2023
FIGURE 61 COMPANY VALUATION (USD MILLION), 2023
FIGURE 62 FINANCIAL METRICS (ENTERPRISE VALUE/EBITDA), 2023
FIGURE 63 MARKET: BRAND/PRODUCT COMPARISON
FIGURE 64 MARKET: COMPANY EVALUATION MATRIX: KEY PLAYERS, 2023
FIGURE 65 MARKET: COMPANY FOOTPRINT
FIGURE 66 MARKET: COMPANY EVALUATION MATRIX (STARTUPS/SMES), 2023
FIGURE 67 VUZIX: COMPANY SNAPSHOT
FIGURE 68 META: COMPANY SNAPSHOT
FIGURE 69 ESSILORLUXOTTICA: COMPANY SNAPSHOT
FIGURE 70 SEIKO EPSON CORPORATION: COMPANY SNAPSHOT
FIGURE 71 TCL ELECTRONICS HOLDINGS LIMITED: COMPANY SNAPSHOT
FIGURE 72 LENOVO: COMPANY SNAPSHOT
FIGURE 73 LUCYD EYEWEAR: COMPANY SNAPSHOT
FIGURE 74 AMAZON.COM, INC.: COMPANY SNAPSHOT
FIGURE 75 XIAOMI: COMPANY SNAPSHOT
 

The study involved four major activities for estimating the smart glasses market size. Exhaustive secondary research has been conducted to collect information relevant to the market, its peer markets, and its child market. Primary research has been undertaken to validate key findings, assumptions, and sizing with industry experts across the value chain of the smart glasses market. Both top-down and bottom-up approaches have been employed to estimate the complete market size. It has been followed by the market breakdown and data triangulation methods to estimate the size of different segments and subsegments of the market.

Secondary Research

The research methodology used to estimate and forecast the size of the smart glasses market began with the acquisition of data related to the revenues of key vendors in the market through secondary research. Various secondary sources have been referred to in the secondary research process for identifying and collecting information for this study. Secondary sources include annual reports, press releases, and investor presentations of companies; white papers, journals, certified publications, and articles by recognized authors; websites; directories; and databases. Secondary research has mainly been used to obtain key information about the value chain of the smart glasses market, key players, market classification, and segmentation according to the industry trends to the bottom-most level, geographic markets, and key developments from both market and technology-oriented perspectives. Secondary data has been collected and analyzed to determine the overall market size, further validated through primary research. The secondary research referred to for this research study involves the VR/AR Association (VRARA), Institute of Electrical and Electronics Engineers (IEEE), and Consumer Technology Association, National Institute of Standard and Technology, and Augmented Reality for Enterprise Alliance. Moreover, the study involved extensive use of secondary sources, directories, and databases, such as Hoovers, Bloomberg Businessweek, Factiva, and OneSource, to identify and collect valuable information for a technical, market-oriented, and commercial study of the smart glasses market. Vendor offerings have been taken into consideration to determine market segmentation.

Primary Research

In the primary research, various primary sources from both the supply and demand sides have been interviewed to obtain the qualitative and quantitative information relevant to this report. Primary sources from the supply side include the key industry participants, subject-matter experts (SMEs), and C-level executives and consultants from various key companies and organizations in the smart glasses ecosystem. After the complete market engineering (including calculations for the market statistics, the market breakdown, the market size estimations, the market forecasting, and the data triangulation), extensive primary research has been conducted to verify and validate the critical market numbers obtained. Extensive qualitative and quantitative analyses have been performed during the market engineering process to list key information/insights throughout the report. Extensive primary research has been conducted after understanding the smart glasses market scenario through secondary research. Several primary interviews have been conducted with market experts from the demand and supply-side players across key regions, namely, North America, Europe, Asia Pacific, and the Rest of the World (Middle East, Africa, and South America). Various primary sources from both the supply and demand sides of the market have been interviewed to obtain qualitative and quantitative information. Following is the breakdown of the primary respondents.

Primary data has been collected through questionnaires, emails, and telephonic interviews. In the canvassing of primaries, various departments within organizations, such as sales, operations, and administration, were covered to provide a holistic viewpoint in our report. After interacting with industry experts, brief sessions were conducted with highly experienced independent consultants to reinforce the findings from our primaries. This and the in-house subject matter experts’ opinions have led us to the findings described in the remainder of this report.

Smart Glasses Market Size, and Share

To know about the assumptions considered for the study, download the pdf brochure

Market Size Estimation

The total size of the smart glasses market has been estimated and validated using both top-down and bottom-up approaches. Furthermore, these methods have also been used extensively to estimate the size of various subsegments in the market. The research methodology used to estimate the market size is as follows:

  • Identifying various entities influencing the value chain of the smart glasses market
  • Identifying major companies, components manufacturers, system integrators, and OS providers operating in the market
  • Estimating segment-level revenue of individual key players operating in the smart glasses market
  • Estimating the size of the smart glasses market for each industry segment, such as education & research, healthcare, automotive, consumer, manufacturing, warehousing, and other industries (construction, public safety, and agriculture)
  • Estimating the size of the smart glasses market for each region based on the demand for smart glasses
  • Tracking the ongoing and upcoming smart glasses product launches to forecast the market size based on these developments and other critical parameters
  • Estimating the size of the global smart glasses market and growth rate at the segment and sub-segment levels

Global Smart Glasses Market Size: Bottom-Up Approach

Smart Glasses Market Size, and Bottom-Up Approach

Global Smart Glasses Market Size: Top-Down Approach

Smart Glasses Market Size, and Top-Down Approach

Data Triangulation

After arriving at the overall size of the smart glasses market from the market size estimation process explained above, the total market has been split into several segments and subsegments. Data triangulation and market breakdown procedures have been employed, wherever applicable, to complete the overall market engineering process and arrive at the exact statistics for all segments and subsegments of the market. The data has been triangulated by studying various factors and trends from both the demand and supply sides. Along with this, the market size has been validated using both top-down and bottom-up approaches.

Market Definition

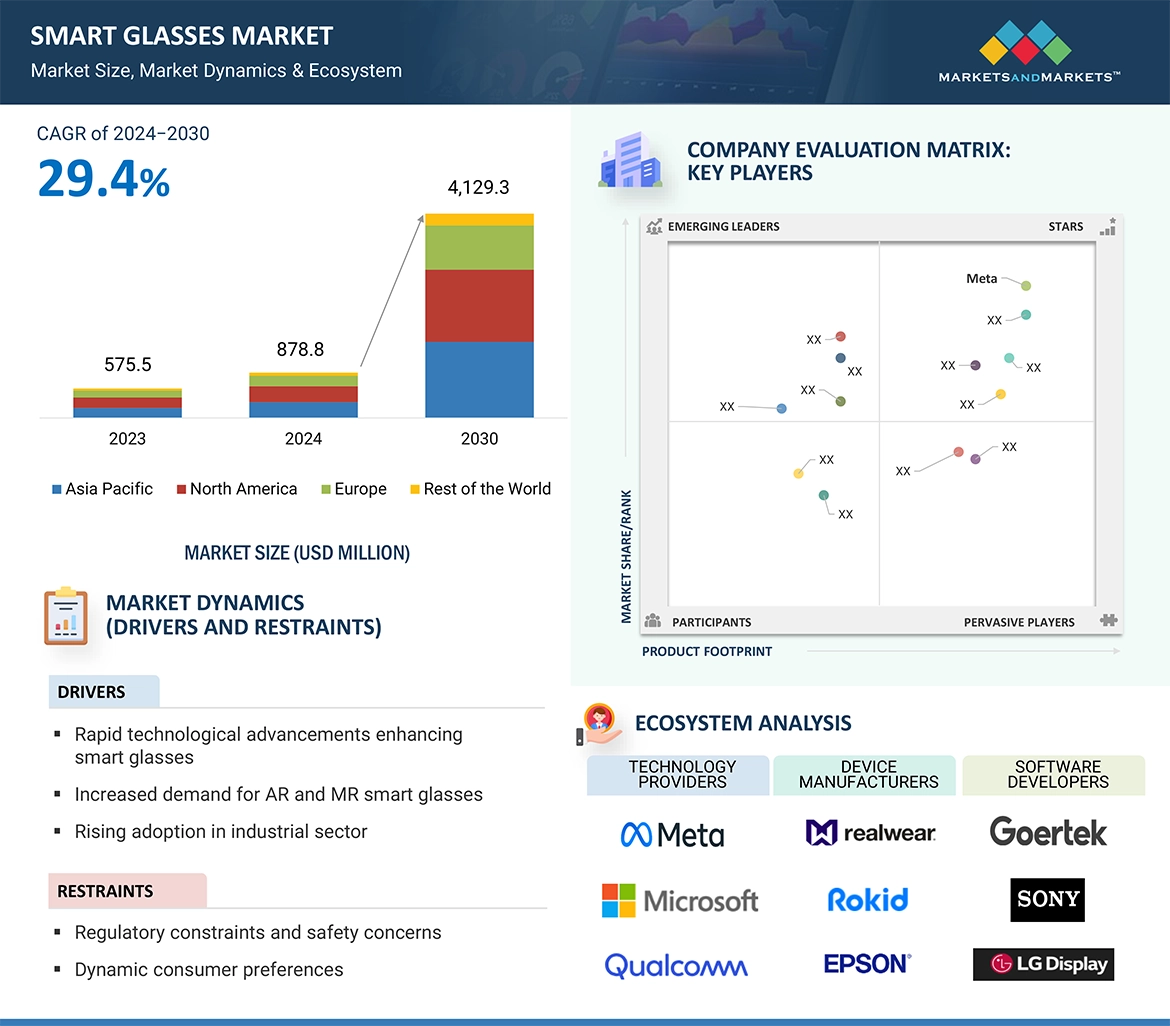
Smart glasses are wearable devices that combine a small computer display with traditional glasses, helping users interact with digital content while maintaining awareness of their surroundings. As compared to traditional glasses, smart glasses typically feature augmented reality or mixed reality capabilities, enhancing the user experience by overlaying the digital information in the real-world using camera, sensors, processors, and wireless technology.

Some smart glasses only have audio capability while others can have display. In case of smart glasses with a display, they deliver digital content such as text, images, or 3D objects directly into the user’s vision.
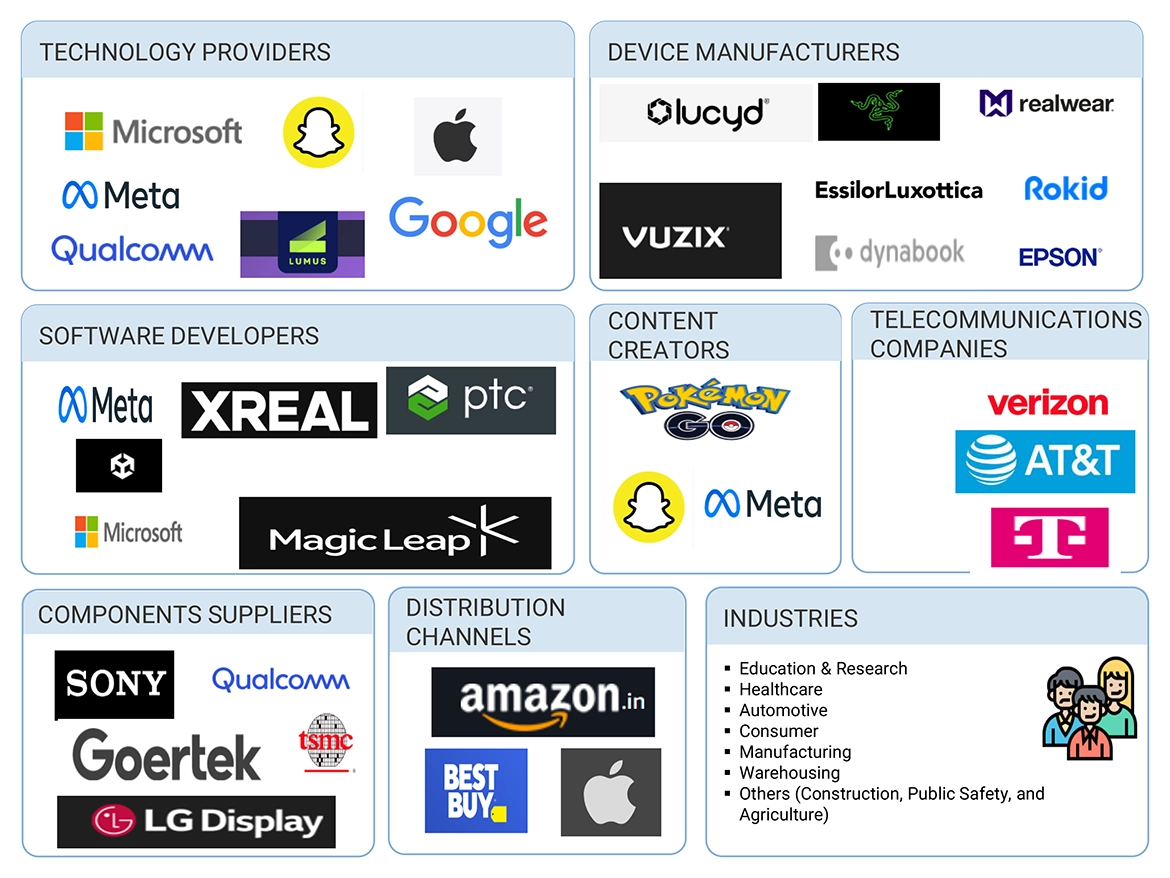
Stakeholders:

  • Raw material suppliers and smart glasses developers
  • Operating systems developers
  • Technology developers
  • Augmented reality device manufacturers
  • Industrial and consumer industries
  • Industries utilizing smart glasses such as education and research, automotive, healthcare, manufacturing, warehousing, and other industries (public safety, agriculture, construction)
  • Research organizations
  • Technology investors
  • Governments, financial institutions, and investment communities
  • Analysts and strategic business planners
  • Technology standard organizations, forums, alliances, and associations
  • Venture capitalists, private equity firms, and startups
  • Technology standard organizations, forums, alliances, and associations
  • Venture capitalists, private equity firms, and startups

Report Objectives

  • To define, describe, segment, and forecast the size of the smart glasses market, by type, feature, and industry, in terms of value
  • To describe the various connectivity technologies and operating systems in smart glasses
  • To forecast the market size for various segments with respect to four main regions—the North America, Europe, Asia Pacific, and Rest of the World (RoW)—in terms of value
  • To provide detailed information regarding the drivers, restraints, opportunities, and challenges influencing the growth of the smart glasses market
  • To study the complete value chain analysis of the smart glasses market landscape
  • To strategically analyze macro and micromarkets1 with respect to growth trends, prospects, and their contributions to the overall market
  • To analyze industry trends, pricing data, patents and innovations, and trade data (export and import data) in the smart glasses market
  • To analyze opportunities in the market for stakeholders and provide a detailed competitive landscape
  • To strategically profile key players in the market and comprehensively analyze their market share/ranking and core competencies2
  • To analyze competitive developments by players in the smart glasses market, such as contracts, product launches/developments, expansions, and research and development (R&D) activities

1. Micromarkets are defined as the further segments and subsegments of the smart glasses market included in the report.

2. Core competencies of companies are defined in terms of their key developments and key strategies adopted to sustain their positions in the market.

Available Customizations:

With the given market data, MarketsandMarkets offers customizations according to the company’s specific needs. The following customization options are available for the report:

Company Information:

  • Detailed analysis and profiling of additional market players based on various blocks of the value chain.
Custom Market Research Services

We will customize the research for you, in case the report listed above does not meet with your exact requirements. Our custom research will comprehensively cover the business information you require to help you arrive at strategic and profitable business decisions.

Request Customization
Report Code
SE 9154
Published ON
Sep, 2024
Choose License Type
BUY NOW
  • SHARE
X
Request Customization
Speak to Analyst
Speak to Analyst
OR FACE-TO-FACE MEETING
PERSONALIZE THIS RESEARCH
  • Triangulate with your Own Data
  • Get Data as per your Format and Definition
  • Gain a Deeper Dive on a Specific Application, Geography, Customer or Competitor
  • Any level of Personalization
REQUEST A FREE CUSTOMIZATION
LET US HELP YOU!
  • What are the Known and Unknown Adjacencies Impacting the Smart Glasses Market
  • What will your New Revenue Sources be?
  • Who will be your Top Customer; what will make them switch?
  • Defend your Market Share or Win Competitors
  • Get a Scorecard for Target Partners
CUSTOMIZED WORKSHOP REQUEST
  • Call Us
  • +1-888-600-6441 (Corporate office hours)
  • +1-888-600-6441 (US/Can toll free)
  • +44-800-368-9399 (UK office hours)
CONNECT WITH US
ABOUT TRUST ONLINE
©2024 MarketsandMarkets Research Private Ltd. All rights reserved
DMCA.com Protection Status Website Feedback