Sleep Apnea Oral Appliances Market Size, Share & Trends

Report Code MD 6285
Published in Sep, 2024, By MarketsandMarkets™
Download PDF

Choose License Type

Buy Report Now Inquire Before Buying

Sleep Apnea Oral Appliances Market by Product (Mandibular Advancement Devices, Tongue-Retaining Devices), Purchase Type (Physician-prescribed), Gender (Male, Female), Age Group, Distribution Channel (Online, Retail) & Region - Global Forecast to 2029

Overview

The global sleep apnea oral appliances market is projected to reach USD 746.6 million by 2029 from USD 471.2 million in 2024, at a CAGR of 9.6% during the forecast period. Growth in the sleep apnea oral appliances market is primarily driven by growing awareness about effects of untreated sleep apnea among patients. Also, the growing opportunities in emerging economies as more new oral appliances are introduced in the market majorly contribute to growth of the market. There is a rising number of companies in sleep apnea appliances market which is facilitating the growth of the market.

Attractive Opportunities in the Sleep Apnea Oral Appliances Market

Asia Pacific

The key factors driving market include rising prevalence of sleep apnea, higher rate of obesity and increasing number of sleep and dental clinics.

Growth in this market can be attributed to the large pool of undiagnosed sleep apnea patients and growing awareness of the effects of untreated sleep apnea.

The growing demand for home sleep tests and poor compliance with CPAP are expected to offer lucrative growth opportunities for market players.

The North American sleep apnea oral appliances market is projected to reach USD 350.8 million by 2029, growing at a CAGR of 9.9% during the forecast period.

The Asia Pacific market is expected to grow at the highest CAGR of 10.4% during the forecast period.

Global Sleep Apnea Oral Appliances Market Dynamics

DRIVER: Large pool of undiagnosed sleep apnea patients globally

As the geriatric population and obesity is increasing in most of the countries the prevalence of sleep apnea is also increasing but there are quite a few of sleep apnea patients who are undiagnosed and have not seaked any help for it. The change is lifestyle can be one of the major factors affecting it. It remains undiagnosed because of the insufficient screening practices, the low awareness of the disease and the limited access to healthcare. Studies have shown that around a billion people aged from 30-69 have mild to severe obstructive sleep apnea, but the patients for sleep apnea registered is lesser than that number. It shows that this condition is underdiagnosed and not recognized that much as of now. Studies have also shown that sleep apnea may also be varied by race, the African American might show a relatively higher prevalence of sleep apnea than a white American with similar features and age. Sleep apnea is linked with other health conditions such as high blood pressure and ischemic heart disease, thus proper diagnosis of sleep apnea is necessary to provide proper treatment to the patient.

Restraint: Risks associated with oral appliance therapy for obstructive sleep apnea

Proper fittied oral appliance for sleep apnea therapy is required for comfort and gaining more customers towards it. The oral appliance therapy might come with some risks associated with it if the fitting is not proper for the patient. The patient may feel discomfort which includes the positioning of teeth may change over time, and can also feel lower mandibular pain. There can be some discomfort and sleep disturbance noted for the patients if the appliance is not fitted properly, and if the appliance is not fitted for the patient it can cause more harm than cure as it might lead to persistent daytime sleepiness and similar complications. If a patient has been wearing the sleep apnea oral appliance for a long duration of time it can alter the oral flora and increase the risk of infections and cavities. To avoid the risks associated with oral appliance therapy the patient has to have a proper fitted appliance with regular follow ups with the specialist to keep the oral health and sleep apnea disease under control.


Opportunity: Poor compliance associated with CPAP

Studies report that approximately 30-80% of the patients are not compatible with the CPAP therapy. Even though the CPAP devices are more efficient mode for sleep apnea treatment it is costlier and much bigger in size than the oral appliances. The patients feel discomfort wearing the CPAP mask while sleeping and can also experince skin irritation, difficulty to adjust the nose in the machine and feel claustrophobic. The CPAP machines also generate a disturbing noise with might affect the sleep of the user and anyone sleeping near them, due to these factors it has been noticed that the users do not use the machine regularly which can have serious health problems. On the other hand the sleep apnea oral appliances are cost efficient, less intrusive and easier to use than the CPAP devices. This difference shows how important it is to have a treatment plan that considers each persons aesthetics and lifestyle for better adaptation of the appliances. In the end customers comfort and satisfaction defines the acceptability of the product in the market for the healthcare devices.

Challenges: Complex referral pathways and long waiting periods

The referral process from the primary care physicians to the sleep specialists and then to the durable medical equipment providers often cause delay in identifying and treating obstructive sleep apnea . Many patients become frustrated with the lengthy process and give up before reaching a sleep specialist, leading to delays in getting the help they need. This inefficiency not only discourages patients but also increases the risk of complications from untreated OSA. Simplifying the referral pathway is essential for improving patient care and ensuring timely access to treatment. There is also lack of trained sleep specialist in the dental field, there is a very low number of well-equipped sleep centers. As the specialist are not properly trained there is a higher rate of misdiagnosis. Due to the misdiagnosis the expenditure for medical trips to the clinics increases and it is a significant hurdle for the patients.

Global Sleep Apnea Oral Appliances Market Ecosystem Analysis

The ecosystem analysis describes the element present in the sleep apnea oral appliances market which helps us to understand the particular market thoroughly. Manufacturers of sleep apnea oral appliances include companies that focus on research, product development, improvement, and launching new products. These organizations work to create effective and user-friendly solutions for patients and healthcare providers. This market is divided into six segments namely product, purchase type, gender, age group, distribution channel and end user.


By product, mandibular advancement devices segment is projected to register the highest CAGR in the forecasted period.

Based on product, the global sleep apnea oral appliances market is segmented into mandibular advancement devices (MADs), tongue-retaining devices (TRDs), and daytime-nighttime appliances (DNAs). They are oral device for the oral apnea therapy which is placed between the upper and lower teeth which helps in snoring and obstructive sleep apnea. The device is designed in such a way that it positions the lower jaw forward and downwards to keep the airway open. Mandibular advancement devices is usually made from durable plastic and can also be customised from patient to patient to give a better fit for a better treatment. They are easier to use and are handy, it is also more pocket friendly than the CPAP which attracts more customers. For a better efficiency of this device a regular check up with the dental professionals is required. Overall, MADs offer a comfortable and effective option for people looking for relief from sleep apnea and similar issues.

By end user, the home care settings/individuals segment is projected to register the highest CAGR in the forecasted period.

Based on end user, the sleep apnea oral appliances market is into home care settings/individuals, hospitals, and dental clinics. Home care settings/individuals is expected to register the highest CAGR during the forecasted period. This segment caters to the individuals who get the appliance for themselves or the home care nurses. This segment is popular as these oral appliances are pescribes as the first line of treatment for sleep apnea. The oral apliances are readily available and easy to use for a home care setting. It is also comparatively cheaper for the customers to try at home which saves them money for the clinic visits and extra charges that are required. Many patients who find CPAP therapy uncomfortable turn to oral appliances as a helpful alternative, showing the different needs these devices fulfill in home care settings.

In 2023, North America accounted for the largest share of the sleep apnea oral appliances market, followed by Asia Pacific , by region

The global sleep apnea oral appliances market is segmented into six major regions namely, North America, Europe, the Asia Pacific, Middle East & Africa, Latin America, and the GCC Countries. In 2023, North America was the largest segment of the sleep apnea oral appliances market. There is a rise in awareness for sleep apnea in this region. The reimbursement scenario is also less complicated for the sleep apnea oral appliances. There is a support of oral appliance therapy by the patients, physicians, insurance companies and dentists in North America. The revalance of this disease is also affected by aging population, rising obesity rates and sedentary lifestyles. The majority of the key companies providing sleep apnea oral appliances is located in this region. The daytime nighttime appliance for sleep apnea treatment is only available in North America. Thus, this region shows higher acceptability towards innovation for the sleep apnea oral appliance market.

HIGHEST CAGR MARKET IN 2023
US FASTEST GROWING MARKET IN THE REGION

Recent Developments of Sleep Apnea Oral Appliances Market

  • In May 2023, ResMed (US) acquired Somnoware (US), a US leader in sleep and respiratory care diagnostics software.
  • In May 2022, ProSomnus Sleep Technologies (US) and Lakeshore Acquisition I Corp. (US) reached an agreement to merge and operate as ProSomnus, Inc. The new company will specialize in sleep apnea therapy and will be listed on NASDAQ through a business combination.
  • In December 2022, Vivos Therapeutis, Inc. (US) obtained 510(k) clearence from the US FDA for Modified Mandibular Repositioning Nighttime Appliance device for treating mild-to-moderate obstructive sleep apnea.
  • In May 2022, Panthera Dental (Canada) collaborated with Preat Corporation (US) to develop exceptional metal implant bars for the dental industry for new innovations in the sleep apnea oral appliances market.

Key Market Players

KEY PLAYERS IN THE SLEEP APNEA ORAL APPLIANCES MARKET INCLUDE

Want to explore hidden markets that can drive new revenue in Sleep Apnea Oral Appliances Market?

Scope of the Report

Report Metric Details
Market size available for years 2022-2029
Base Year Considered 2023
Forecast period 2024-2029
Forecast units Value (USD Million)
Segments covered Product, purchase type, gender, age group, distribution channel, and end user.
Geographies covered North America, Europe, Asia Pacific, Middle East & Africa, Latin America, and the GCC Countries


Key Questions Addressed by the Report

What are the recent trends driving the sleep apnea oral appliances market?
The recent trends include the growing prevalence of sleep apnea, growing awareness about effects of untreated sleep apnea, growing usage of oral appliance and rising number of companies in sleep apnea devices and oral appliances market.
How big is the sleep apnea oral appliances market worldwide?
As the sleep apnea oral appliances market grows at a CAGR of 9.6% over the forecast period, it is expected to reach USD 746.6 million by 2029 from USD 471.2 million in 2024.
Which product categories are included in the sleep apnea oral appliances? Which category of product is the market leader?
The sleep apnea oral appliances market is divided into sthree segments: mandibular advancement devices (MADs), tongue-retaining devices (TRDs), and daytime-nighttime appliances (DNAs). In 2023, mandibular advancement devices (MADs) product is the market leader. 
Who are the end users of the sleep apnea oral appliances? Which end-user is dominating the market?
The sleep apnea oral appliances market is segmented into home care settings/individuals, hospitals, and dental clinics. In 2023, the home care settings/individuals segment accounted for the largest share of the sleep apnea oral appliances market.
Who are the key players in the sleep apnea oral appliances market?
The key players in the sleep apnea oral appliances market are SomnoMed (Australia), ResMed (US), ProSomnus Sleep Technologies (US), DynaFlex (US), Vivos Therapeutics, Inc. (US), Openairway (Canada), Panthera Dental (Canada), Airway management (US), Apnea Sciences (US), OravanOSA (US), Myerson LLC. (US), Braebon Medical Corporation (Canada).
Which region is lucrative for the sleep apnea oral appliances market?
The Asia Pacific market is expected to witness the highest growth during the forecast period. The Asia Pacific market is expected to witness the highest growth during the forecast period due to factors such as increasing number of dental clinics and sleep clinics in this region, and growing medical tourism in the Asia Pacific countries. 


Personalize This Research

  • Triangulate with your Own Data
  • Get Data as per your Format and Definition
  • Gain a Deeper Dive on a Specific Application, Geography, Customer or Competitor
  • Any level of Personalization
Request A Free Customisation

Let Us Help You

  • What are the Known and Unknown Adjacencies Impacting the Sleep Apnea Oral Appliances Market
  • What will your New Revenue Sources be?
  • Who will be your Top Customer; what will make them switch?
  • Defend your Market Share or Win Competitors
  • Get a Scorecard for Target Partners
Customized Workshop Request

Table of Contents

Exclusive indicates content/data unique to MarketsandMarkets and not available with any competitors.

TITLE
PAGE NO
INTRODUCTION
28
RESEARCH METHODOLOGY
33
EXECUTIVE SUMMARY
46
PREMIUM INSIGHTS
53
MARKET OVERVIEW
57
  • 5.1 INTRODUCTION
  • 5.2 MARKET DYNAMICS
    DRIVERS
    - Large pool of undiagnosed sleep apnea patients globally
    - Growing awareness about effects of untreated sleep apnea among patients
    - Growing usage of oral appliances among patients with mild-to-moderate sleep apnea
    - Rising number of companies in sleep apnea devices and oral appliances market
    RESTRAINTS
    - High prices of customized oral appliances
    - Alternative therapies and medications for sleep apnea
    - Risks associated with oral appliance therapy for obstructive sleep apnea
    OPPORTUNITIES
    - Growing demand for home sleep apnea tests as cost-saving measure
    - Increasing focus on telemedicine, mHealth, and AI
    - Poor compliance associated with CPAP
    CHALLENGES
    - Complex referral pathways and long waiting periods
  • 5.3 PRICING ANALYSIS
    AVERAGE SELLING PRICE TREND OF KEY PLAYERS, BY REGION, 2021–2023
    AVERAGE SELLING PRICE TREND, BY PRODUCT TYPE, 2021–2023
  • 5.4 VALUE CHAIN ANALYSIS
  • 5.5 SUPPLY CHAIN ANALYSIS
  • 5.6 ECOSYSTEM ANALYSIS
    SLEEP APNEA ORAL APPLIANCES MARKET: ROLE IN ECOSYSTEM
  • 5.7 PORTER’S FIVE FORCES ANALYSIS
    THREAT OF NEW ENTRANTS
    THREAT OF SUBSTITUTES
    BARGAINING POWER OF SUPPLIERS
    BARGAINING POWER OF BUYERS
    INTENSITY OF COMPETITIVE RIVALRY
  • 5.8 REGULATORY ANALYSIS
    REGULATORY LANDSCAPE
    - North America
    - Europe
    - Asia Pacific
    REGULATORY BODIES, GOVERNMENT AGENCIES, AND OTHER ORGANIZATIONS
    - North America
    - Europe
    - Asia Pacific
    - Latin America
    - Middle East & Africa
  • 5.9 TECHNOLOGY ANALYSIS
    KEY TECHNOLOGIES
    - Mandibular advancement devices
    ADJACENT TECHNOLOGIES
    - Daytime-nighttime appliances
  • 5.10 TRADE ANALYSIS
    IMPORT DATA FOR HS CODE 901849, BY COUNTRY, 2019–2023 (USD MILLION)
    EXPORT DATA FOR HS CODE 901849, BY COUNTRY, 2019–2023 (USD MILLION)
  • 5.11 PATENT ANALYSIS
  • 5.12 KEY CONFERENCES & EVENTS, 2024−2025
  • 5.13 TRENDS/DISRUPTIONS IMPACTING CUSTOMERS’ BUSINESSES
  • 5.14 KEY STAKEHOLDERS & BUYING CRITERIA
    KEY STAKEHOLDERS IN BUYING PROCESS
    BUYING CRITERIA
  • 5.15 IMPACT OF GENERATIVE AI ON SLEEP APNEA ORAL APPLIANCES MARKET
  • 5.16 INVESTMENT & FUNDING SCENARIO
  • 5.17 END-USER PERCEPTION ANALYSIS
  • 5.18 PURCHASING DECISION-MAKING PROCESS
    INTRODUCTION
    - Need recognition
    - Gathering information
    - Evaluating alternatives
SLEEP APNEA ORAL APPLIANCES MARKET, BY PRODUCT
96
  • 6.1 INTRODUCTION
  • 6.2 MANDIBULAR ADVANCEMENT DEVICES
    READY-MADE MANDIBULAR ADVANCEMENT DEVICES
    - Low cost of readymade MADs to drive demand
    CUSTOM-MADE MANDIBULAR ADVANCEMENT DEVICES
    - High efficacy of custom-made MADs to support market demand
  • 6.3 TONGUE-RETAINING DEVICES
    LOWER SUCCESS RATE OF TRDS TO CHALLENGE MARKET GROWTH
  • 6.4 DAYTIME-NIGHTTIME APPLIANCES
    HIGHER COMFORT OF DNAS TO DRIVE ADOPTION
SLEEP APNEA ORAL APPLIANCES MARKET, BY GENDER
110
  • 7.1 INTRODUCTION
  • 7.2 MALE PATIENTS
    HIGHER PREVALENCE OF OSA IN MALES TO BOOST MARKET GROWTH
  • 7.3 FEMALE PATIENTS
    OSA UNDERDIAGNOSIS IN FEMALES TO RESTRICT MARKET GROWTH
SLEEP APNEA ORAL APPLIANCES MARKET, BY PURCHASE TYPE
117
  • 8.1 INTRODUCTION
  • 8.2 PHYSICIAN-PRESCRIBED/CUSTOMIZED ORAL APPLIANCES
    FAILURE OF CPAP THERAPY TO DRIVE DEMAND FOR PHYSICIAN-PRESCRIBED ORAL APPLIANCES
  • 8.3 ONLINE OTC ORAL APPLIANCES
    LACK OF REGULATORY APPROVAL TO HINDER MARKET GROWTH
SLEEP APNEA ORAL APPLIANCES MARKET, BY AGE GROUP
124
  • 9.1 INTRODUCTION
  • 9.2 BELOW 40 YEARS
    LOWER PREVALENCE OF SLEEP APNEA IN YOUNGER AGE GROUPS TO RESTRICT MARKET GROWTH
  • 9.3 BETWEEN 40–60 YEARS
    LIFESTYLE FACTORS TO CONTRIBUTE TO MARKET GROWTH
  • 9.4 ABOVE 60 YEARS
    INCREASING BREATHING DISTURBANCES AND SLEEP APNEA TO SUPPORT MARKET GROWTH
SLEEP APNEA ORAL APPLIANCES MARKET, BY DISTRIBUTION CHANNEL
132
  • 10.1 INTRODUCTION
  • 10.2 ONLINE PHARMACIES
    GROWING PREFERENCE FOR DIRECT DISTRIBUTION CHANNELS TO DRIVE MARKET
  • 10.3 RETAIL PHARMACIES
    EASY ACCESS TO PRODUCTS WITH RETAIL PHARMACIES TO BOOST MARKET
  • 10.4 HOSPITAL PHARMACIES & DENTAL CLINICS
    HIGH PATIENT CONVENIENCE IN HOSPITAL PHARMACIES TO DRIVE DEMAND
SLEEP APNEA ORAL APPLIANCES MARKET, BY END USER
140
  • 11.1 INTRODUCTION
  • 11.2 HOME CARE SETTINGS/INDIVIDUALS
    RISING PATIENT PREFERENCE FOR ADVANCED HOME SLEEP CARE DEVICES TO DRIVE MARKET
  • 11.3 HOSPITALS
    RAPID DEVELOPMENT IN HEALTHCARE INFRASTRUCTURE TO DRIVE DEMAND FOR ORAL APPLIANCES IN HOSPITALS
  • 11.4 DENTAL CLINICS
    RISING NUMBER OF DENTAL CLINICS TO BOOST MARKET GROWTH
SLEEP APNEA ORAL APPLIANCES MARKET, BY REGION
150
  • 12.1 INTRODUCTION
  • 12.2 NORTH AMERICA
    MACROECONOMIC OUTLOOK FOR NORTH AMERICA
    US
    - Rising availability of grants and funds and increasing trend of home sleep testing to drive market
    CANADA
    - Increasing number of research grants and health programs to propel market
  • 12.3 EUROPE
    MACROECONOMIC OUTLOOK FOR EUROPE
    GERMANY
    - High prevalence of obstructive sleep apnea primarily due to smoking to fuel market
    UK
    - Rising awareness among patients and increasing number of sleep service groups to support market
    FRANCE
    - Rising geriatric population to increase incidence of sleep apnea
    ITALY
    - Growing prevalence of sleep apnea and increasing awareness among patients regarding ill effects of disease to aid market
    SPAIN
    - Increasing initiatives for social awareness regarding illness and treatment by regional organizations to drive market
    REST OF EUROPE
  • 12.4 ASIA PACIFIC
    MACROECONOMIC OUTLOOK FOR ASIA PACIFIC
    CHINA
    - Growing adult obesity rates and expanding geriatric population to propel market
    JAPAN
    - Changing reimbursement scenario and increasing demand for cloud-connected sleep apnea therapeutic devices to aid market
    AUSTRALIA
    - High prevalence of sleep apnea and increased number of awareness programs to drive market
    REST OF ASIA PACIFIC
  • 12.5 LATIN AMERICA
    POOR HEALTHCARE INFRASTRUCTURE AND LACK OF PUBLIC HEALTH INITIATIVES TO LIMIT MARKET GROWTH
    MACROECONOMIC OUTLOOK FOR LATIN AMERICA
  • 12.6 MIDDLE EAST & AFRICA
    PRESENCE OF KEY INTERNATIONAL PLAYERS AND HIGH INCIDENCE OF CHRONIC DISEASES TO DRIVE MARKET
    MACROECONOMIC OUTLOOK FOR MIDDLE EAST & AFRICA
  • 12.7 GCC COUNTRIES
    HIGH OBESITY RATE AMONG WOMEN TO PROPEL MARKET GROWTH
    MACROECONOMIC OUTLOOK FOR GCC COUNTRIES
COMPETITIVE LANDSCAPE
228
  • 13.1 OVERVIEW
  • 13.2 KEY PLAYER STRATEGY/RIGHT TO WIN
    OVERVIEW OF STRATEGIES ADOPTED BY KEY PLAYERS IN SLEEP APNEA ORAL APPLIANCES MARKET
  • 13.3 REVENUE ANALYSIS, 2019–2023
  • 13.4 MARKET SHARE ANALYSIS, 2023
    RANKING OF KEY MARKET PLAYERS
  • 13.5 COMPANY EVALUATION MATRIX: KEY PLAYERS, 2023
    STARS
    EMERGING LEADERS
    PERVASIVE PLAYERS
    PARTICIPANTS
    COMPANY FOOTPRINT: KEY PLAYERS, 2023
    - Company footprint
    - Product footprint
    - Purchase type footprint
    - Region footprint
  • 13.6 COMPANY EVALUATION MATRIX: START-UPS/SMES, 2023
    PROGRESSIVE COMPANIES
    RESPONSIVE COMPANIES
    DYNAMIC COMPANIES
    STARTING BLOCKS
    COMPETITIVE BENCHMARKING: START-UPS/SMES, 2023
  • 13.7 COMPANY VALUATION & FINANCIAL METRICS
  • 13.8 BRAND/PRODUCT COMPARISON
  • 13.9 COMPETITIVE SCENARIO
    PRODUCT LAUNCHES & APPROVALS
    DEALS
    EXPANSIONS
    OTHER DEVELOPMENTS
COMPANY PROFILES
248
  • 14.1 KEY PLAYERS
    SOMNOMED
    - Business overview
    - Products offered
    - MnM view
    RESMED
    - Business overview
    - Products offered
    - MnM view
    PROSOMNUS SLEEP TECHNOLOGIES
    - Business overview
    - Products offered
    - Recent developments
    - MnM view
    DYNAFLEX
    - Business overview
    - Products offered
    - Recent developments
    VIVOS THERAPEUTICS, INC.
    - Business overview
    - Products offered
    - Recent developments
    OPENAIRWAY
    - Business overview
    - Products offered
    - Recent developments
    PANTHERA DENTAL
    - Business overview
    - Products offered
    - Recent developments
    AIRWAY MANAGEMENT
    - Business overview
    - Products offered
    - Recent developments
    APNEA SCIENCES
    - Business overview
    - Products offered
    ORAVANOSA
    - Business overview
    - Products offered
    MYERSON LLC.
    - Business overview
    - Products offered
    BRAEBON MEDICAL CORPORATION
    - Business overview
    - Products offered
  • 14.2 OTHER PLAYERS
    MPOWRX HEALTH & WELLNESS PRODUCTS
    THE SNORE RELIEVER COMPANY, LLC
    TOMED GMBH
    THE AURUM GROUP
    ERKODENT ENRICH KOPP GMBH
    OSCIMED SA
    SICAT GMBH & CO. KG
    GLIDEWELL
    APNOMED, INC.
    ZQUIET
    DREAM SYSTEMS DENTAL SLEEP LAB
    ALIVE MEDICAL SURGICAL EQUIPMENT TRADING LLC
    ORTHOAPNEA
    DOC BRANDS, INC.
APPENDIX
279
  • 15.1 DISCUSSION GUIDE
  • 15.2 KNOWLEDGESTORE: MARKETSANDMARKETS’ SUBSCRIPTION PORTAL
  • 15.3 CUSTOMIZATION OPTIONS
  • 15.4 RELATED REPORTS
  • 15.5 AUTHOR DETAILS
LIST OF TABLES
 
  • TABLE 1 SLEEP APNEA ORAL APPLIANCES MARKET: INCLUSIONS & EXCLUSIONS
  • TABLE 2 SLEEP APNEA ORAL APPLIANCES MARKET: RISK ASSESSMENT ANALYSIS
  • TABLE 3 PREVALENCE OF SLEEP APNEA, BY COUNTRY, 2022–2024
  • TABLE 4 INITIATIVES TO PROMOTE AWARENESS ABOUT EFFECTS OF UNTREATED SLEEP APNEA
  • TABLE 5 LIST OF ADVANCED ORAL APPLIANCES AVAILABLE FOR TREATING SLEEP APNEA
  • TABLE 6 SLEEP APNEA ORAL APPLIANCES MARKET: PORTER’S FIVE FORCES ANALYSIS
  • TABLE 7 US: MEDICAL DEVICE REGULATORY APPROVAL PROCESS
  • TABLE 8 CANADA: MEDICAL DEVICE REGULATORY APPROVAL PROCESS
  • TABLE 9 JAPAN: MEDICAL DEVICE CLASSIFICATION UNDER PMDA
  • TABLE 10 CHINA: CLASSIFICATION OF MEDICAL DEVICES
  • TABLE 11 NORTH AMERICA: REGULATORY BODIES, GOVERNMENT AGENCIES, AND OTHER ORGANIZATIONS
  • TABLE 12 EUROPE: REGULATORY BODIES, GOVERNMENT AGENCIES, AND OTHER ORGANIZATIONS
  • TABLE 13 ASIA PACIFIC: REGULATORY BODIES, GOVERNMENT AGENCIES, AND OTHER ORGANIZATIONS
  • TABLE 14 LATIN AMERICA: REGULATORY BODIES, GOVERNMENT AGENCIES, AND OTHER ORGANIZATIONS
  • TABLE 15 MIDDLE EAST & AFRICA: REGULATORY BODIES, GOVERNMENT AGENCIES, AND OTHER ORGANIZATIONS
  • TABLE 16 SLEEP APNEA ORAL APPLIANCES MARKET: DETAILED LIST OF CONFERENCES & EVENTS, 2024−2025
  • TABLE 17 INFLUENCE OF STAKEHOLDERS ON BUYING PROCESS OF SLEEP APNEA ORAL APPLIANCES (%)
  • TABLE 18 KEY BUYING CRITERIA FOR END USERS OF SLEEP APNEA ORAL APPLIANCES
  • TABLE 19 BENEFITS AND LIMITATIONS OF CURRENT PRODUCT TYPES
  • TABLE 20 PRODUCT FEATURES: COMPARATIVE ASSESSMENT
  • TABLE 21 NEED GAP ANALYSIS
  • TABLE 22 ORAL APPLIANCES OFFERED BY KEY PLAYERS
  • TABLE 23 SLEEP APNEA ORAL APPLIANCES MARKET, BY PRODUCT, 2022–2029 (USD MILLION)
  • TABLE 24 MANDIBULAR ADVANCEMENT DEVICES OFFERED BY KEY PLAYERS
  • TABLE 25 MANDIBULAR ADVANCEMENT DEVICES MARKET, BY TYPE, 2022–2029 (USD MILLION)
  • TABLE 26 MANDIBULAR ADVANCEMENT DEVICES MARKET, BY REGION, 2022–2029 (USD MILLION)
  • TABLE 27 NORTH AMERICA: MANDIBULAR ADVANCEMENT DEVICES MARKET, BY COUNTRY, 2022–2029 (USD MILLION)
  • TABLE 28 EUROPE: MANDIBULAR ADVANCEMENT DEVICES MARKET, BY COUNTRY, 2022–2029 (USD MILLION)
  • TABLE 29 ASIA PACIFIC: MANDIBULAR ADVANCEMENT DEVICES MARKET, BY COUNTRY, 2022–2029 (USD MILLION)
  • TABLE 30 READY-MADE MANDIBULAR ADVANCEMENT DEVICES OFFERED BY KEY PLAYERS
  • TABLE 31 READY-MADE MANDIBULAR ADVANCEMENT DEVICES MARKET, BY REGION, 2022–2029 (USD MILLION)
  • TABLE 32 NORTH AMERICA: READY-MADE MANDIBULAR ADVANCEMENT DEVICES MARKET, BY COUNTRY, 2022–2029 (USD MILLION)
  • TABLE 33 EUROPE: READY-MADE MANDIBULAR ADVANCEMENT DEVICES MARKET, BY COUNTRY, 2022–2029 (USD MILLION)
  • TABLE 34 ASIA PACIFIC: READY-MADE MANDIBULAR ADVANCEMENT DEVICES MARKET, BY COUNTRY, 2022–2029 (USD MILLION)
  • TABLE 35 CUSTOM-MADE MANDIBULAR ADVANCEMENT DEVICES OFFERED BY KEY PLAYERS
  • TABLE 36 CUSTOM-MADE MANDIBULAR ADVANCEMENT DEVICES MARKET, BY REGION, 2022–2029 (USD MILLION)
  • TABLE 37 NORTH AMERICA: CUSTOM-MADE MANDIBULAR ADVANCEMENT DEVICES MARKET, BY COUNTRY, 2022–2029 (USD MILLION)
  • TABLE 38 EUROPE: CUSTOM-MADE MANDIBULAR ADVANCEMENT DEVICES MARKET, BY COUNTRY, 2022–2029 (USD MILLION)
  • TABLE 39 ASIA PACIFIC: CUSTOM-MADE MANDIBULAR ADVANCEMENT DEVICES MARKET, BY COUNTRY, 2022–2029 (USD MILLION)
  • TABLE 40 TONGUE-RETAINING DEVICES OFFERED BY KEY PLAYERS
  • TABLE 41 TONGUE-RETAINING DEVICES MARKET, BY REGION, 2022–2029 (USD MILLION)
  • TABLE 42 NORTH AMERICA: TONGUE-RETAINING DEVICES MARKET, BY COUNTRY, 2022–2029 (USD MILLION)
  • TABLE 43 EUROPE: TONGUE-RETAINING DEVICES MARKET, BY COUNTRY, 2022–2029 (USD MILLION)
  • TABLE 44 ASIA PACIFIC: TONGUE-RETAINING DEVICES MARKET, BY COUNTRY, 2022–2029 (USD MILLION)
  • TABLE 45 DAYTIME-NIGHTTIME APPLIANCES MARKET, BY REGION, 2022–2029 (USD MILLION)
  • TABLE 46 NORTH AMERICA: DAYTIME-NIGHTTIME APPLIANCES MARKET, BY COUNTRY, 2022–2029 (USD MILLION)
  • TABLE 47 PREVALENCE OF SLEEP APNEA, BY AGE GROUP AND GENDER
  • TABLE 48 SLEEP APNEA ORAL APPLIANCES MARKET, BY GENDER, 2022–2029 (USD MILLION)
  • TABLE 49 SLEEP APNEA ORAL APPLIANCES MARKET FOR MALE PATIENTS, BY REGION, 2022–2029 (USD MILLION)
  • TABLE 50 NORTH AMERICA: SLEEP APNEA ORAL APPLIANCES MARKET FOR MALE PATIENTS, BY COUNTRY, 2022–2029 (USD MILLION)
  • TABLE 51 EUROPE: SLEEP APNEA ORAL APPLIANCES MARKET FOR MALE PATIENTS, BY COUNTRY, 2022–2029 (USD MILLION)
  • TABLE 52 ASIA PACIFIC: SLEEP APNEA ORAL APPLIANCES MARKET FOR MALE PATIENTS, BY COUNTRY, 2022–2029 (USD MILLION)
  • TABLE 53 SLEEP APNEA ORAL APPLIANCES MARKET FOR FEMALE PATIENTS, BY REGION, 2022–2029 (USD MILLION)
  • TABLE 54 NORTH AMERICA: SLEEP APNEA ORAL APPLIANCES MARKET FOR FEMALE PATIENTS, BY COUNTRY, 2022–2029 (USD MILLION)
  • TABLE 55 EUROPE: SLEEP APNEA ORAL APPLIANCES MARKET FOR FEMALE PATIENTS, BY COUNTRY, 2022–2029 (USD MILLION)
  • TABLE 56 ASIA PACIFIC: SLEEP APNEA ORAL APPLIANCES MARKET FOR FEMALE PATIENTS, BY COUNTRY, 2022–2029 (USD MILLION)
  • TABLE 57 SLEEP APNEA ORAL APPLIANCES MARKET, BY PURCHASE TYPE, 2022–2029 (USD MILLION)
  • TABLE 58 PHYSICIAN-PRESCRIBED/CUSTOMIZED ORAL APPLIANCES OFFERED BY KEY PLAYERS
  • TABLE 59 PHYSICIAN-PRESCRIBED/CUSTOMIZED ORAL APPLIANCES MARKET, BY REGION, 2022–2029 (USD MILLION)
  • TABLE 60 NORTH AMERICA: PHYSICIAN-PRESCRIBED/CUSTOMIZED ORAL APPLIANCES MARKET, BY COUNTRY, 2022–2029 (USD MILLION)
  • TABLE 61 EUROPE: PHYSICIAN-PRESCRIBED/CUSTOMIZED ORAL APPLIANCES MARKET, BY COUNTRY, 2022–2029 (USD MILLION)
  • TABLE 62 ASIA PACIFIC: PHYSICIAN-PRESCRIBED/CUSTOMIZED ORAL APPLIANCES MARKET, BY COUNTRY, 2022–2029 (USD MILLION)
  • TABLE 63 ONLINE OTC ORAL APPLIANCES OFFERED BY KEY PLAYERS
  • TABLE 64 ONLINE OTC ORAL APPLIANCES MARKET, BY REGION, 2022–2029 (USD MILLION)
  • TABLE 65 NORTH AMERICA: ONLINE OTC ORAL APPLIANCES MARKET, BY COUNTRY, 2022–2029 (USD MILLION)
  • TABLE 66 EUROPE: ONLINE OTC ORAL APPLIANCES MARKET, BY COUNTRY, 2022–2029 (USD MILLION)
  • TABLE 67 ASIA PACIFIC: ONLINE OTC ORAL APPLIANCES MARKET, BY COUNTRY, 2022–2029 (USD MILLION)
  • TABLE 68 PREVALENCE OF SLEEP APNEA, BY AGE GROUP, 2021
  • TABLE 69 SLEEP APNEA ORAL APPLIANCES MARKET, BY AGE GROUP, 2022–2029 (USD MILLION)
  • TABLE 70 SLEEP APNEA ORAL APPLIANCES MARKET FOR INDIVIDUALS BELOW 40 YEARS, BY REGION, 2022–2029 (USD MILLION)
  • TABLE 71 NORTH AMERICA: SLEEP APNEA ORAL APPLIANCES MARKET FOR INDIVIDUALS BELOW 40 YEARS, BY COUNTRY, 2022–2029 (USD MILLION)
  • TABLE 72 EUROPE: SLEEP APNEA ORAL APPLIANCES MARKET FOR INDIVIDUALS BELOW 40 YEARS, BY COUNTRY, 2022–2029 (USD MILLION)
  • TABLE 73 ASIA PACIFIC: SLEEP APNEA ORAL APPLIANCES MARKET FOR INDIVIDUALS BELOW 40 YEARS, BY COUNTRY, 2022–2029 (USD MILLION)
  • TABLE 74 SLEEP APNEA ORAL APPLIANCES MARKET FOR INDIVIDUALS BETWEEN 40–60 YEARS, BY REGION, 2022–2029 (USD MILLION)
  • TABLE 75 NORTH AMERICA: SLEEP APNEA ORAL APPLIANCES MARKET FOR INDIVIDUALS BETWEEN 40–60 YEARS, BY COUNTRY, 2022–2029 (USD MILLION)
  • TABLE 76 EUROPE: SLEEP APNEA ORAL APPLIANCES MARKET FOR INDIVIDUALS BETWEEN 40–60 YEARS, BY COUNTRY, 2022–2029 (USD MILLION)
  • TABLE 77 ASIA PACIFIC: SLEEP APNEA ORAL APPLIANCES MARKET FOR INDIVIDUALS BETWEEN 40–60 YEARS, BY COUNTRY, 2022–2029 (USD MILLION)
  • TABLE 78 SLEEP APNEA ORAL APPLIANCES MARKET FOR INDIVIDUALS ABOVE 60 YEARS, BY REGION, 2022–2029 (USD MILLION)
  • TABLE 79 NORTH AMERICA: SLEEP APNEA ORAL APPLIANCES MARKET FOR INDIVIDUALS ABOVE 60 YEARS, BY COUNTRY, 2022–2029 (USD MILLION)
  • TABLE 80 EUROPE: SLEEP APNEA ORAL APPLIANCES MARKET FOR INDIVIDUALS ABOVE 60 YEARS, BY COUNTRY, 2022–2029 (USD MILLION)
  • TABLE 81 ASIA PACIFIC: SLEEP APNEA ORAL APPLIANCES MARKET FOR INDIVIDUALS ABOVE 60 YEARS, BY COUNTRY, 2022–2029 (USD MILLION)
  • TABLE 82 SLEEP APNEA ORAL APPLIANCES MARKET, BY DISTRIBUTION CHANNEL, 2022–2029 (USD MILLION)
  • TABLE 83 SLEEP APNEA ORAL APPLIANCES MARKET FOR ONLINE PHARMACIES, BY REGION, 2022–2029 (USD MILLION)
  • TABLE 84 NORTH AMERICA: SLEEP APNEA ORAL APPLIANCES MARKET FOR ONLINE PHARMACIES, BY COUNTRY, 2022–2029 (USD MILLION)
  • TABLE 85 EUROPE: SLEEP APNEA ORAL APPLIANCES MARKET FOR ONLINE PHARMACIES, BY COUNTRY, 2022–2029 (USD MILLION)
  • TABLE 86 ASIA PACIFIC: SLEEP APNEA ORAL APPLIANCES MARKET FOR ONLINE PHARMACIES, BY COUNTRY, 2022–2029 (USD MILLION)
  • TABLE 87 SLEEP APNEA ORAL APPLIANCES MARKET FOR RETAIL PHARMACIES, BY REGION, 2022–2029 (USD MILLION)
  • TABLE 88 NORTH AMERICA: SLEEP APNEA ORAL APPLIANCES MARKET FOR RETAIL PHARMACIES, BY COUNTRY, 2022–2029 (USD MILLION)
  • TABLE 89 EUROPE: SLEEP APNEA ORAL APPLIANCES MARKET FOR RETAIL PHARMACIES, BY COUNTRY, 2022–2029 (USD MILLION)
  • TABLE 90 ASIA PACIFIC: SLEEP APNEA ORAL APPLIANCES MARKET FOR RETAIL PHARMACIES, BY COUNTRY, 2022–2029 (USD MILLION)
  • TABLE 91 SLEEP APNEA ORAL APPLIANCES MARKET FOR HOSPITAL PHARMACIES & DENTAL CLINICS, BY REGION, 2022–2029 (USD MILLION)
  • TABLE 92 NORTH AMERICA: SLEEP APNEA ORAL APPLIANCES MARKET FOR HOSPITAL PHARMACIES & DENTAL CLINICS, BY COUNTRY, 2022–2029 (USD MILLION)
  • TABLE 93 EUROPE: SLEEP APNEA ORAL APPLIANCES MARKET FOR HOSPITAL PHARMACIES & DENTAL CLINICS, BY COUNTRY, 2022–2029 (USD MILLION)
  • TABLE 94 ASIA PACIFIC: SLEEP APNEA ORAL APPLIANCES MARKET FOR HOSPITAL PHARMACIES & DENTAL CLINICS, BY COUNTRY, 2022–2029 (USD MILLION)
  • TABLE 95 SLEEP APNEA ORAL APPLIANCES MARKET, BY END USER, 2022–2029 (USD MILLION)
  • TABLE 96 SLEEP APNEA ORAL APPLIANCES MARKET FOR HOME CARE SETTINGS/INDIVIDUALS, BY REGION, 2022–2029 (USD MILLION)
  • TABLE 97 NORTH AMERICA: SLEEP APNEA ORAL APPLIANCES MARKET FOR HOME CARE SETTINGS/INDIVIDUALS, BY COUNTRY, 2022–2029 (USD MILLION)
  • TABLE 98 EUROPE: SLEEP APNEA ORAL APPLIANCES MARKET FOR HOME CARE SETTINGS/INDIVIDUALS, BY COUNTRY, 2022–2029 (USD MILLION)
  • TABLE 99 ASIA PACIFIC: SLEEP APNEA ORAL APPLIANCES MARKET FOR HOME CARE SETTINGS/INDIVIDUALS, BY COUNTRY, 2022–2029 (USD MILLION)
  • TABLE 100 SLEEP APNEA ORAL APPLIANCES MARKET FOR HOSPITALS, BY REGION, 2022–2029 (USD MILLION)
  • TABLE 101 NORTH AMERICA: SLEEP APNEA ORAL APPLIANCES MARKET FOR HOSPITALS, BY COUNTRY, 2022–2029 (USD MILLION)
  • TABLE 102 EUROPE: SLEEP APNEA ORAL APPLIANCES MARKET FOR HOSPITALS, BY COUNTRY, 2022–2029 (USD MILLION)
  • TABLE 103 ASIA PACIFIC: SLEEP APNEA ORAL APPLIANCES MARKET FOR HOSPITALS, BY COUNTRY, 2022–2029 (USD MILLION)
  • TABLE 104 SLEEP APNEA ORAL APPLIANCES MARKET FOR DENTAL CLINICS, BY REGION, 2022–2029 (USD MILLION)
  • TABLE 105 NORTH AMERICA: SLEEP APNEA ORAL APPLIANCES MARKET FOR DENTAL CLINICS, BY COUNTRY, 2022–2029 (USD MILLION)
  • TABLE 106 EUROPE: SLEEP APNEA ORAL APPLIANCES MARKET FOR DENTAL CLINICS, BY COUNTRY, 2022–2029 (USD MILLION)
  • TABLE 107 ASIA PACIFIC: SLEEP APNEA ORAL APPLIANCES MARKET FOR DENTAL CLINICS, BY COUNTRY, 2022–2029 (USD MILLION)
  • TABLE 108 SLEEP APNEA ORAL APPLIANCES MARKET, BY REGION, 2022–2029 (USD MILLION)
  • TABLE 109 NORTH AMERICA: MACROECONOMIC INDICATORS
  • TABLE 110 NORTH AMERICA: SLEEP APNEA ORAL APPLIANCES MARKET, BY COUNTRY, 2022–2029 (USD MILLION)
  • TABLE 111 NORTH AMERICA: SLEEP APNEA ORAL APPLIANCES MARKET, BY COUNTRY, 2022–2029 (THOUSAND UNITS)
  • TABLE 112 NORTH AMERICA: SLEEP APNEA ORAL APPLIANCES MARKET, BY PRODUCT, 2022–2029 (USD MILLION)
  • TABLE 113 NORTH AMERICA: MANDIBULAR ADVANCEMENT DEVICES MARKET, BY TYPE, 2022–2029 (USD MILLION)
  • TABLE 114 NORTH AMERICA: SLEEP APNEA ORAL APPLIANCES MARKET, BY GENDER, 2022–2029 (USD MILLION)
  • TABLE 115 NORTH AMERICA: SLEEP APNEA ORAL APPLIANCES MARKET, BY PURCHASE TYPE, 2022–2029 (USD MILLION)
  • TABLE 116 NORTH AMERICA: SLEEP APNEA ORAL APPLIANCES MARKET, BY AGE GROUP, 2022–2029 (USD MILLION)
  • TABLE 117 NORTH AMERICA: SLEEP APNEA ORAL APPLIANCES MARKET, BY DISTRIBUTION CHANNEL, 2022–2029 (USD MILLION)
  • TABLE 118 NORTH AMERICA: SLEEP APNEA ORAL APPLIANCES MARKET, BY END USER, 2022–2029 (USD MILLION)
  • TABLE 119 KEY SLEEP APNEA PRODUCTS PROVIDED BY MAJOR PLAYERS IN US
  • TABLE 120 US: SLEEP APNEA ORAL APPLIANCES MARKET, BY PRODUCT, 2022–2029 (USD MILLION)
  • TABLE 121 US: MANDIBULAR ADVANCEMENT DEVICES MARKET, BY TYPE, 2022–2029 (USD MILLION)
  • TABLE 122 US: SLEEP APNEA ORAL APPLIANCES MARKET, BY GENDER, 2022–2029 (USD MILLION)
  • TABLE 123 US: SLEEP APNEA ORAL APPLIANCES MARKET, BY PURCHASE TYPE, 2022–2029 (USD MILLION)
  • TABLE 124 US: SLEEP APNEA ORAL APPLIANCES MARKET, BY AGE GROUP, 2022–2029 (USD MILLION)
  • TABLE 125 US: SLEEP APNEA ORAL APPLIANCES MARKET, BY DISTRIBUTION CHANNEL, 2022–2029 (USD MILLION)
  • TABLE 126 US: SLEEP APNEA ORAL APPLIANCES MARKET, BY END USER, 2022–2029 (USD MILLION)
  • TABLE 127 KEY SLEEP APNEA PRODUCTS PROVIDED BY MAJOR PLAYERS IN CANADA
  • TABLE 128 CANADA: SLEEP APNEA ORAL APPLIANCES MARKET, BY PRODUCT, 2022–2029 (USD MILLION)
  • TABLE 129 CANADA: MANDIBULAR ADVANCEMENT DEVICES MARKET, BY TYPE, 2022–2029 (USD MILLION)
  • TABLE 130 CANADA: SLEEP APNEA ORAL APPLIANCES MARKET, BY GENDER, 2022–2029 (USD MILLION)
  • TABLE 131 CANADA: SLEEP APNEA ORAL APPLIANCES MARKET, BY PURCHASE TYPE, 2022–2029 (USD MILLION)
  • TABLE 132 CANADA: SLEEP APNEA ORAL APPLIANCES MARKET, BY AGE GROUP, 2022–2029 (USD MILLION)
  • TABLE 133 CANADA: SLEEP APNEA ORAL APPLIANCES MARKET, BY DISTRIBUTION CHANNEL, 2022–2029 (USD MILLION)
  • TABLE 134 CANADA: SLEEP APNEA ORAL APPLIANCES MARKET, BY END USER, 2022–2029 (USD MILLION)
  • TABLE 135 EUROPE: MACROECONOMIC INDICATORS
  • TABLE 136 EUROPE: SLEEP APNEA ORAL APPLIANCES MARKET, BY COUNTRY, 2022–2029 (USD MILLION)
  • TABLE 137 EUROPE: SLEEP APNEA ORAL APPLIANCES MARKET, BY PRODUCT, 2022–2029 (USD MILLION)
  • TABLE 138 EUROPE: MANDIBULAR ADVANCEMENT DEVICES MARKET, BY TYPE, 2022–2029 (USD MILLION)
  • TABLE 139 EUROPE: SLEEP APNEA ORAL APPLIANCES MARKET, BY GENDER, 2022–2029 (USD MILLION)
  • TABLE 140 EUROPE: SLEEP APNEA ORAL APPLIANCES MARKET, BY PURCHASE TYPE, 2022–2029 (USD MILLION)
  • TABLE 141 EUROPE: SLEEP APNEA ORAL APPLIANCES MARKET, BY AGE GROUP, 2022–2029 (USD MILLION)
  • TABLE 142 EUROPE: SLEEP APNEA ORAL APPLIANCES MARKET, BY DISTRIBUTION CHANNEL, 2022–2029 (USD MILLION)
  • TABLE 143 EUROPE: SLEEP APNEA ORAL APPLIANCES MARKET, BY END USER, 2022–2029 (USD MILLION)
  • TABLE 144 SLEEP APNEA PRODUCTS PROVIDED BY MAJOR PLAYERS IN GERMANY
  • TABLE 145 GERMANY: SLEEP APNEA ORAL APPLIANCES MARKET, BY PRODUCT, 2022–2029 (USD MILLION)
  • TABLE 146 GERMANY: MANDIBULAR ADVANCEMENT DEVICES MARKET, BY TYPE, 2022–2029 (USD MILLION)
  • TABLE 147 GERMANY: SLEEP APNEA ORAL APPLIANCES MARKET, BY GENDER, 2022–2029 (USD MILLION)
  • TABLE 148 GERMANY: SLEEP APNEA ORAL APPLIANCES MARKET, BY PURCHASE TYPE, 2022–2029 (USD MILLION)
  • TABLE 149 GERMANY: SLEEP APNEA ORAL APPLIANCES MARKET, BY AGE GROUP, 2022–2029 (USD MILLION)
  • TABLE 150 GERMANY: SLEEP APNEA ORAL APPLIANCES MARKET, BY DISTRIBUTION CHANNEL, 2022–2029 (USD MILLION)
  • TABLE 151 GERMANY: SLEEP APNEA ORAL APPLIANCES MARKET, BY END USER, 2022–2029 (USD MILLION)
  • TABLE 152 UK: SLEEP APNEA ORAL APPLIANCES MARKET, BY PRODUCT, 2022–2029 (USD MILLION)
  • TABLE 153 UK: MANDIBULAR ADVANCEMENT DEVICES MARKET, BY TYPE, 2022–2029 (USD MILLION)
  • TABLE 154 UK: SLEEP APNEA ORAL APPLIANCES MARKET, BY GENDER, 2022–2029 (USD MILLION)
  • TABLE 155 UK: SLEEP APNEA ORAL APPLIANCES MARKET, BY PURCHASE TYPE, 2022–2029 (USD MILLION)
  • TABLE 156 UK: SLEEP APNEA ORAL APPLIANCES MARKET, BY AGE GROUP, 2022–2029 (USD MILLION)
  • TABLE 157 UK: SLEEP APNEA ORAL APPLIANCES MARKET, BY DISTRIBUTION CHANNEL, 2022–2029 (USD MILLION)
  • TABLE 158 UK: SLEEP APNEA ORAL APPLIANCES MARKET, BY END USER, 2022–2029 (USD MILLION)
  • TABLE 159 FRANCE: SLEEP APNEA ORAL APPLIANCES MARKET, BY PRODUCT, 2022–2029 (USD MILLION)
  • TABLE 160 FRANCE: MANDIBULAR ADVANCEMENT DEVICES MARKET, BY TYPE, 2022–2029 (USD MILLION)
  • TABLE 161 FRANCE: SLEEP APNEA ORAL APPLIANCES MARKET, BY GENDER, 2022–2029 (USD MILLION)
  • TABLE 162 FRANCE: SLEEP APNEA ORAL APPLIANCES MARKET, BY PURCHASE TYPE, 2022–2029 (USD MILLION)
  • TABLE 163 FRANCE: SLEEP APNEA ORAL APPLIANCES MARKET, BY AGE GROUP, 2022–2029 (USD MILLION)
  • TABLE 164 FRANCE: SLEEP APNEA ORAL APPLIANCES MARKET, BY DISTRIBUTION CHANNEL, 2022–2029 (USD MILLION)
  • TABLE 165 FRANCE: SLEEP APNEA ORAL APPLIANCES MARKET, BY END USER, 2022–2029 (USD MILLION)
  • TABLE 166 ITALY: SLEEP APNEA ORAL APPLIANCES MARKET, BY PRODUCT, 2022–2029 (USD MILLION)
  • TABLE 167 ITALY: MANDIBULAR ADVANCEMENT DEVICES MARKET, BY TYPE, 2022–2029 (USD MILLION)
  • TABLE 168 ITALY: SLEEP APNEA ORAL APPLIANCES MARKET, BY GENDER, 2022–2029 (USD MILLION)
  • TABLE 169 ITALY: SLEEP APNEA ORAL APPLIANCES MARKET, BY PURCHASE TYPE, 2022–2029 (USD MILLION)
  • TABLE 170 ITALY: SLEEP APNEA ORAL APPLIANCES MARKET, BY AGE GROUP, 2022–2029 (USD MILLION)
  • TABLE 171 ITALY: SLEEP APNEA ORAL APPLIANCES MARKET, BY DISTRIBUTION CHANNEL, 2022–2029 (USD MILLION)
  • TABLE 172 ITALY: SLEEP APNEA ORAL APPLIANCES MARKET, BY END USER, 2022–2029 (USD MILLION)
  • TABLE 173 SPAIN: SLEEP APNEA ORAL APPLIANCES MARKET, BY PRODUCT, 2022–2029 (USD MILLION)
  • TABLE 174 SPAIN: MANDIBULAR ADVANCEMENT DEVICES MARKET, BY TYPE, 2022–2029 (USD MILLION)
  • TABLE 175 SPAIN: SLEEP APNEA ORAL APPLIANCES MARKET, BY GENDER, 2022–2029 (USD MILLION)
  • TABLE 176 SPAIN: SLEEP APNEA ORAL APPLIANCES MARKET, BY PURCHASE TYPE, 2022–2029 (USD MILLION)
  • TABLE 177 SPAIN: SLEEP APNEA ORAL APPLIANCES MARKET, BY AGE GROUP, 2022–2029 (USD MILLION)
  • TABLE 178 SPAIN: SLEEP APNEA ORAL APPLIANCES MARKET, BY DISTRIBUTION CHANNEL, 2022–2029 (USD MILLION)
  • TABLE 179 SPAIN: SLEEP APNEA ORAL APPLIANCES MARKET, BY END USER, 2022–2029 (USD MILLION)
  • TABLE 180 REST OF EUROPE: SLEEP APNEA ORAL APPLIANCES MARKET, BY PRODUCT, 2022–2029 (USD MILLION)
  • TABLE 181 REST OF EUROPE: MANDIBULAR ADVANCEMENT DEVICES MARKET, BY TYPE, 2022–2029 (USD MILLION)
  • TABLE 182 REST OF EUROPE: SLEEP APNEA ORAL APPLIANCES MARKET, BY GENDER, 2022–2029 (USD MILLION)
  • TABLE 183 REST OF EUROPE: SLEEP APNEA ORAL APPLIANCES MARKET, BY PURCHASE TYPE, 2022–2029 (USD MILLION)
  • TABLE 184 REST OF EUROPE: SLEEP APNEA ORAL APPLIANCES MARKET, BY AGE GROUP, 2022–2029 (USD MILLION)
  • TABLE 185 REST OF EUROPE: SLEEP APNEA ORAL APPLIANCES MARKET, BY DISTRIBUTION CHANNEL, 2022–2029 (USD MILLION)
  • TABLE 186 REST OF EUROPE: SLEEP APNEA ORAL APPLIANCES MARKET, BY END USER, 2022–2029 (USD MILLION)
  • TABLE 187 ASIA PACIFIC: MACROECONOMIC INDICATORS
  • TABLE 188 ASIA PACIFIC: SLEEP APNEA ORAL APPLIANCES MARKET, BY COUNTRY, 2022–2029 (USD MILLION)
  • TABLE 189 ASIA PACIFIC: SLEEP APNEA ORAL APPLIANCES MARKET, BY PRODUCT, 2022–2029 (USD MILLION)
  • TABLE 190 ASIA PACIFIC: MANDIBULAR ADVANCEMENT DEVICES MARKET, BY TYPE, 2022–2029 (USD MILLION)
  • TABLE 191 ASIA PACIFIC: SLEEP APNEA ORAL APPLIANCES MARKET, BY GENDER, 2022–2029 (USD MILLION)
  • TABLE 192 ASIA PACIFIC: SLEEP APNEA ORAL APPLIANCES MARKET, BY PURCHASE TYPE, 2022–2029 (USD MILLION)
  • TABLE 193 ASIA PACIFIC: SLEEP APNEA ORAL APPLIANCES MARKET, BY AGE GROUP, 2022–2029 (USD MILLION)
  • TABLE 194 ASIA PACIFIC: SLEEP APNEA ORAL APPLIANCES MARKET, BY DISTRIBUTION CHANNEL, 2022–2029 (USD MILLION)
  • TABLE 195 ASIA PACIFIC: SLEEP APNEA ORAL APPLIANCES MARKET, BY END USER, 2022–2029 (USD MILLION)
  • TABLE 196 CHINA: SLEEP APNEA ORAL APPLIANCES MARKET, BY PRODUCT, 2022–2029 (USD MILLION)
  • TABLE 197 CHINA: MANDIBULAR ADVANCEMENT DEVICES MARKET, BY TYPE, 2022–2029 (USD MILLION)
  • TABLE 198 CHINA: SLEEP APNEA ORAL APPLIANCES MARKET, BY GENDER, 2022–2029 (USD MILLION)
  • TABLE 199 CHINA: SLEEP APNEA ORAL APPLIANCES MARKET, BY PURCHASE TYPE, 2022–2029 (USD MILLION)
  • TABLE 200 CHINA: SLEEP APNEA ORAL APPLIANCES MARKET, BY AGE GROUP, 2022–2029 (USD MILLION)
  • TABLE 201 CHINA: SLEEP APNEA ORAL APPLIANCES MARKET, BY DISTRIBUTION CHANNEL, 2022–2029 (USD MILLION)
  • TABLE 202 CHINA: SLEEP APNEA ORAL APPLIANCES MARKET, BY END USER, 2022–2029 (USD MILLION)
  • TABLE 203 JAPAN: SLEEP APNEA ORAL APPLIANCES MARKET, BY PRODUCT, 2022–2029 (USD MILLION)
  • TABLE 204 JAPAN: MANDIBULAR ADVANCEMENT DEVICES MARKET, BY TYPE, 2022–2029 (USD MILLION)
  • TABLE 205 JAPAN: SLEEP APNEA ORAL APPLIANCES MARKET, BY GENDER, 2022–2029 (USD MILLION)
  • TABLE 206 JAPAN: SLEEP APNEA ORAL APPLIANCES MARKET, BY PURCHASE TYPE, 2022–2029 (USD MILLION)
  • TABLE 207 JAPAN: SLEEP APNEA ORAL APPLIANCES MARKET, BY AGE GROUP, 2022–2029 (USD MILLION)
  • TABLE 208 JAPAN: SLEEP APNEA ORAL APPLIANCES MARKET, BY DISTRIBUTION CHANNEL, 2022–2029 (USD MILLION)
  • TABLE 209 JAPAN: SLEEP APNEA ORAL APPLIANCES MARKET, BY END USER, 2022–2029 (USD MILLION)
  • TABLE 210 AUSTRALIA: SLEEP APNEA ORAL APPLIANCES MARKET, BY PRODUCT, 2022–2029 (USD MILLION)
  • TABLE 211 AUSTRALIA: MANDIBULAR ADVANCEMENT DEVICES MARKET, BY TYPE, 2022–2029 (USD MILLION)
  • TABLE 212 AUSTRALIA: SLEEP APNEA ORAL APPLIANCES MARKET, BY GENDER, 2022–2029 (USD MILLION)
  • TABLE 213 AUSTRALIA: SLEEP APNEA ORAL APPLIANCES MARKET, BY PURCHASE TYPE, 2022–2029 (USD MILLION)
  • TABLE 214 AUSTRALIA: SLEEP APNEA ORAL APPLIANCES MARKET, BY AGE GROUP, 2022–2029 (USD MILLION)
  • TABLE 215 AUSTRALIA: SLEEP APNEA ORAL APPLIANCES MARKET, BY DISTRIBUTION CHANNEL, 2022–2029 (USD MILLION)
  • TABLE 216 AUSTRALIA: SLEEP APNEA ORAL APPLIANCES MARKET, BY END USER, 2022–2029 (USD MILLION)
  • TABLE 217 REST OF ASIA PACIFIC: SLEEP APNEA ORAL APPLIANCES MARKET, BY PRODUCT, 2022–2029 (USD MILLION)
  • TABLE 218 REST OF ASIA PACIFIC: MANDIBULAR ADVANCEMENT DEVICES MARKET, BY TYPE, 2022–2029 (USD MILLION)
  • TABLE 219 REST OF ASIA PACIFIC: SLEEP APNEA ORAL APPLIANCES MARKET, BY GENDER, 2022–2029 (USD MILLION)
  • TABLE 220 REST OF ASIA PACIFIC: SLEEP APNEA ORAL APPLIANCES MARKET, BY PURCHASE TYPE, 2022–2029 (USD MILLION)
  • TABLE 221 REST OF ASIA PACIFIC: SLEEP APNEA ORAL APPLIANCES MARKET, BY AGE GROUP, 2022–2029 (USD MILLION)
  • TABLE 222 REST OF ASIA PACIFIC: SLEEP APNEA ORAL APPLIANCES MARKET, BY DISTRIBUTION CHANNEL, 2022–2029 (USD MILLION)
  • TABLE 223 REST OF ASIA PACIFIC: SLEEP APNEA ORAL APPLIANCES MARKET, BY END USER, 2022–2029 (USD MILLION)
  • TABLE 224 LATIN AMERICA: MACROECONOMIC INDICATORS
  • TABLE 225 LATIN AMERICA: SLEEP APNEA ORAL APPLIANCES MARKET, BY PRODUCT, 2022–2029 (USD MILLION)
  • TABLE 226 LATIN AMERICA: MANDIBULAR ADVANCEMENT DEVICES MARKET, BY TYPE, 2022–2029 (USD MILLION)
  • TABLE 227 LATIN AMERICA: SLEEP APNEA ORAL APPLIANCES MARKET, BY GENDER, 2022–2029 (USD MILLION)
  • TABLE 228 LATIN AMERICA: SLEEP APNEA ORAL APPLIANCES MARKET, BY PURCHASE TYPE, 2022–2029 (USD MILLION)
  • TABLE 229 LATIN AMERICA: SLEEP APNEA ORAL APPLIANCES MARKET, BY AGE GROUP, 2022–2029 (USD MILLION)
  • TABLE 230 LATIN AMERICA: SLEEP APNEA ORAL APPLIANCES MARKET, BY DISTRIBUTION CHANNEL, 2022–2029 (USD MILLION)
  • TABLE 231 LATIN AMERICA: SLEEP APNEA ORAL APPLIANCES MARKET, BY END USER, 2022–2029 (USD MILLION)
  • TABLE 232 MIDDLE EAST & AFRICA: MACROECONOMIC INDICATORS
  • TABLE 233 MIDDLE EAST & AFRICA: SLEEP APNEA ORAL APPLIANCES MARKET, BY PRODUCT, 2022–2029 (USD MILLION)
  • TABLE 234 MIDDLE EAST & AFRICA: MANDIBULAR ADVANCEMENT DEVICES MARKET, BY TYPE, 2022–2029 (USD MILLION)
  • TABLE 235 MIDDLE EAST & AFRICA: SLEEP APNEA ORAL APPLIANCES MARKET, BY GENDER, 2022–2029 (USD MILLION)
  • TABLE 236 MIDDLE EAST & AFRICA: SLEEP APNEA ORAL APPLIANCES MARKET, BY PURCHASE TYPE, 2022–2029 (USD MILLION)
  • TABLE 237 MIDDLE EAST & AFRICA: SLEEP APNEA ORAL APPLIANCES MARKET, BY AGE GROUP, 2022–2029 (USD MILLION)
  • TABLE 238 MIDDLE EAST & AFRICA: SLEEP APNEA ORAL APPLIANCES MARKET, BY DISTRIBUTION CHANNEL, 2022–2029 (USD MILLION)
  • TABLE 239 MIDDLE EAST & AFRICA: SLEEP APNEA ORAL APPLIANCES MARKET, BY END USER, 2022–2029 (USD MILLION)
  • TABLE 240 GCC COUNTRIES: MACROECONOMIC INDICATORS
  • TABLE 241 GCC COUNTRIES: SLEEP APNEA ORAL APPLIANCES MARKET, BY PRODUCT, 2022–2029 (USD MILLION)
  • TABLE 242 GCC COUNTRIES: MANDIBULAR ADVANCEMENT DEVICES MARKET, BY TYPE, 2022–2029 (USD MILLION)
  • TABLE 243 GCC COUNTRIES: SLEEP APNEA ORAL APPLIANCES MARKET, BY GENDER, 2022–2029 (USD MILLION)
  • TABLE 244 GCC COUNTRIES: SLEEP APNEA ORAL APPLIANCES MARKET, BY PURCHASE TYPE, 2022–2029 (USD MILLION)
  • TABLE 245 GCC COUNTRIES: SLEEP APNEA ORAL APPLIANCES MARKET, BY AGE GROUP, 2022–2029 (USD MILLION)
  • TABLE 246 GCC COUNTRIES: SLEEP APNEA ORAL APPLIANCES MARKET, BY DISTRIBUTION CHANNEL, 2022–2029 (USD MILLION)
  • TABLE 247 GCC COUNTRIES: SLEEP APNEA ORAL APPLIANCES MARKET, BY END USER, 2022–2029 (USD MILLION)
  • TABLE 248 OVERVIEW OF STRATEGIES ADOPTED BY KEY PLAYERS IN SLEEP APNEA ORAL APPLIANCES MARKET
  • TABLE 249 SLEEP APNEA ORAL APPLIANCES MARKET: DEGREE OF COMPETITION
  • TABLE 250 SLEEP APNEA ORAL APPLIANCES MARKET: PRODUCT FOOTPRINT
  • TABLE 251 SLEEP APNEA ORAL APPLIANCES MARKET: PURCHASE TYPE FOOTPRINT
  • TABLE 252 SLEEP APNEA ORAL APPLIANCES MARKET: REGION FOOTPRINT
  • TABLE 253 SLEEP APNEA ORAL APPLIANCES MARKET: DETAILED LIST OF KEY START-UPS/SME PLAYERS
  • TABLE 254 SLEEP APNEA ORAL APPLIANCES MARKET: COMPETITIVE BENCHMARKING OF KEY START-UPS/SMES
  • TABLE 255 SLEEP APNEA ORAL APPLIANCES MARKET: PRODUCT LAUNCHES & APPROVALS, JANUARY 2021–MARCH 2024
  • TABLE 256 SLEEP APNEA ORAL APPLIANCES MARKET: DEALS, JANUARY 2021–MARCH 2024
  • TABLE 257 SLEEP APNEA ORAL APPLIANCES MARKET: EXPANSIONS, J ANUARY 2021–MARCH 2024
  • TABLE 258 SLEEP APNEA ORAL APPLIANCES MARKET: OTHER DEVELOPMENTS, JANUARY 2021–MARCH 2024
  • TABLE 259 SOMNOMED: COMPANY OVERVIEW
  • TABLE 260 SOMNOMED: PRODUCTS OFFERED
  • TABLE 261 RESMED: COMPANY OVERVIEW
  • TABLE 262 RESMED: PRODUCTS OFFERED
  • TABLE 263 RESMED: DEALS, JANUARY 2021–MARCH 2024
  • TABLE 264 RESMED: EXPANSIONS, JANUARY 2021–MARCH 2024
  • TABLE 265 PROSOMNUS SLEEP TECHNOLOGIES: COMPANY OVERVIEW
  • TABLE 266 PROSOMNUS SLEEP TECHNOLOGIES: PRODUCTS OFFERED
  • TABLE 267 PROSOMNUS SLEEP TECHNOLOGIES: DEALS, JANUARY 2021–MARCH 2024
  • TABLE 268 DYNAFLEX: COMPANY OVERVIEW
  • TABLE 269 DYNAFLEX: PRODUCTS OFFERED
  • TABLE 270 DYNAFLEX: DEALS, JANUARY 2021–MARCH 2024
  • TABLE 271 VIVOS THERAPEUTICS, INC.: COMPANY OVERVIEW
  • TABLE 272 VIVOS THERAPEUTICS, INC.: PRODUCTS OFFERED
  • TABLE 273 VIVOS THERAPEUTICS, INC.: PRODUCT APPROVALS, JANUARY 2021–MARCH 2024
  • TABLE 274 VIVOS THERAPEUTICS, INC.: DEALS, JANUARY 2021–MARCH 2024
  • TABLE 275 VIVOS THERAPEUTICS, INC.: EXPANSIONS, JANUARY 2021–MARCH 2024
  • TABLE 276 VIVOS THERAPEUTICS, INC.: OTHER DEVELOPMENTS, JANUARY 2021–MARCH 2024
  • TABLE 277 OPENAIRWAY: COMPANY OVERVIEW
  • TABLE 278 OPENAIRWAY: PRODUCTS OFFERED
  • TABLE 279 OPENAIRWAY: DEALS, JANUARY 2021–MARCH 2024
  • TABLE 280 PANTHERA DENTAL: COMPANY OVERVIEW
  • TABLE 281 PANTHERA DENTAL: PRODUCTS OFFERED
  • TABLE 282 PANTHERA DENTAL: PRODUCT LAUNCHES, JANUARY 2021–MARCH 2024
  • TABLE 283 PANTHERA DENTAL: DEALS, JANUARY 2021–MARCH 2024
  • TABLE 284 PANTHERA DENTAL: OTHER DEVELOPMENTS, JANUARY 2021–MARCH 2024
  • TABLE 285 AIRWAY MANAGEMENT: COMPANY OVERVIEW
  • TABLE 286 AIRWAY MANAGEMENT: PRODUCTS OFFERED
  • TABLE 287 AIRWAY MANAGEMENT: PRODUCT LAUNCHES, JANUARY 2021–MARCH 2024
  • TABLE 288 APNEA SCIENCES: COMPANY OVERVIEW
  • TABLE 289 APNEA SCIENCES: PRODUCTS OFFERED
  • TABLE 290 ORAVANOSA: COMPANY OVERVIEW
  • TABLE 291 ORAVANOSA: PRODUCTS OFFERED
  • TABLE 292 MYERSON LLC.: COMPANY OVERVIEW
  • TABLE 293 MYERSON LLC.: PRODUCTS OFFERED
  • TABLE 294 BRAEBON MEDICAL CORPORATION: COMPANY OVERVIEW
  • TABLE 295 BRAEBON MEDICAL CORPORATION: PRODUCTS OFFERED
LIST OF FIGURES
 
  • FIGURE 1 SLEEP APNEA ORAL APPLIANCES MARKET: MARKET SEGMENTS COVERED
  • FIGURE 2 SLEEP APNEA ORAL APPLIANCES MARKET: RESEARCH DESIGN
  • FIGURE 3 BREAKDOWN OF PRIMARY INTERVIEWS: BY COMPANY TYPE, DESIGNATION, AND REGION
  • FIGURE 4 BOTTOM-UP APPROACH: COMPANY REVENUE ESTIMATION APPROACH
  • FIGURE 5 BOTTOM-UP APPROACH: PATIENT-BASED ANALYSIS
  • FIGURE 6 CAGR PROJECTIONS: SUPPLY-SIDE ANALYSIS
  • FIGURE 7 SLEEP APNEA ORAL APPLIANCES MARKET: TOP-DOWN APPROACH
  • FIGURE 8 DATA TRIANGULATION METHODOLOGY
  • FIGURE 9 SLEEP APNEA ORAL APPLIANCES MARKET: STUDY ASSUMPTIONS
  • FIGURE 10 SLEEP APNEA ORAL APPLIANCES MARKET, BY PRODUCT, 2024 VS. 2029 (USD MILLION)
  • FIGURE 11 SLEEP APNEA ORAL APPLIANCES MARKET, BY PURCHASE TYPE, 2024 VS. 2029 (USD MILLION)
  • FIGURE 12 SLEEP APNEA ORAL APPLIANCES MARKET, BY GENDER, 2024 VS. 2029 (USD MILLION)
  • FIGURE 13 SLEEP APNEA ORAL APPLIANCES MARKET, BY AGE GROUP, 2024 VS. 2029 (USD MILLION)
  • FIGURE 14 SLEEP APNEA ORAL APPLIANCES MARKET, BY DISTRIBUTION CHANNEL, 2024 VS. 2029 (USD MILLION)
  • FIGURE 15 SLEEP APNEA ORAL APPLIANCES MARKET, BY END USER, 2024 VS. 2029 (USD MILLION)
  • FIGURE 16 SLEEP APNEA ORAL APPLIANCES MARKET, BY REGION, 2024 VS. 2029 (USD MILLION)
  • FIGURE 17 LARGE POOL OF UNDIAGNOSED SLEEP APNEA PATIENTS TO DRIVE MARKET FOR SLEEP APNEA ORAL APPLIANCES
  • FIGURE 18 CHINA TO REGISTER HIGHEST CAGR DURING FORECAST PERIOD
  • FIGURE 19 US ACCOUNTED FOR LARGEST SHARE OF NORTH AMERICAN SLEEP APNEA ORAL APPLIANCES MARKET IN 2023
  • FIGURE 20 COUNTRIES IN ASIA PACIFIC TO GROW AT HIGHER RATES DURING FORECAST PERIOD
  • FIGURE 21 SLEEP APNEA ORAL APPLIANCES MARKET: DRIVERS, RESTRAINTS, OPPORTUNITIES, AND CHALLENGES
  • FIGURE 22 VALUE CHAIN ANALYSIS: MAJOR VALUE ADDED DURING MANUFACTURING AND ASSEMBLY PHASES
  • FIGURE 23 SUPPLY CHAIN ANALYSIS: DIRECT DISTRIBUTION TO BE PREFERRED STRATEGY OF PROMINENT COMPANIES
  • FIGURE 24 SLEEP APNEA ORAL APPLIANCES MARKET: ECOSYSTEM ANALYSIS
  • FIGURE 25 SLEEP APNEA ORAL APPLIANCES MARKET: PORTER’S FIVE FORCES ANALYSIS
  • FIGURE 26 TOP APPLICANTS & OWNERS (COMPANIES/INSTITUTIONS) FOR SLEEP APNEA ORAL APPLIANCE PATENTS, JANUARY 2014—MARCH 2024
  • FIGURE 27 SLEEP APNEA ORAL APPLIANCES MARKET: TRENDS/DISRUPTIONS IMPACTING CUSTOMERS’ BUSINESSES
  • FIGURE 28 INFLUENCE OF STAKEHOLDERS ON BUYING PROCESS OF SLEEP APNEA ORAL APPLIANCES
  • FIGURE 29 KEY BUYING CRITERIA FOR END USERS OF SLEEP APNEA ORAL APPLIANCES
  • FIGURE 30 SLEEP APNEA ORAL APPLIANCES MARKET: INVESTMENT & FUNDING SCENARIO FOR KEY PLAYERS (2019−2024)
  • FIGURE 31 NORTH AMERICA: SLEEP APNEA ORAL APPLIANCES MARKET SNAPSHOT
  • FIGURE 32 ASIA PACIFIC: SLEEP APNEA ORAL APPLIANCES MARKET SNAPSHOT
  • FIGURE 33 REVENUE ANALYSIS OF KEY PLAYERS IN SLEEP APNEA ORAL APPLIANCES MARKET, 2019−2023 (USD MILLION)
  • FIGURE 34 MARKET SHARE ANALYSIS OF KEY PLAYERS IN SLEEP APNEA ORAL APPLIANCES MARKET (2023)
  • FIGURE 35 RANKING OF KEY PLAYERS IN SLEEP APNEA ORAL APPLIANCES MARKET, 2023
  • FIGURE 36 SLEEP APNEA ORAL APPLIANCES MARKET: COMPANY EVALUATION MATRIX (KEY PLAYERS), 2023
  • FIGURE 37 SLEEP APNEA ORAL APPLIANCES MARKET: COMPANY FOOTPRINT
  • FIGURE 38 SLEEP APNEA ORAL APPLIANCES MARKET: COMPANY EVALUATION MATRIX (START-UPS/SMES), 2023
  • FIGURE 39 EV/EBITDA OF KEY VENDORS
  • FIGURE 40 YEAR-TO-DATE (YTD) PRICE TOTAL RETURN AND 5-YEAR STOCK BETA OF KEY VENDORS
  • FIGURE 41 SLEEP APNEA ORAL APPLIANCES MARKET: BRAND/PRODUCT COMPARATIVE ANALYSIS
  • FIGURE 42 SOMNOMED: COMPANY SNAPSHOT (2023)
  • FIGURE 43 RESMED: COMPANY SNAPSHOT (2024)
  • FIGURE 44 PROSOMNUS SLEEP TECHNOLOGIES: COMPANY SNAPSHOT (2023)
  • FIGURE 45 VIVOS THERAPEUTICS, INC.: COMPANY SNAPSHOT (2023)

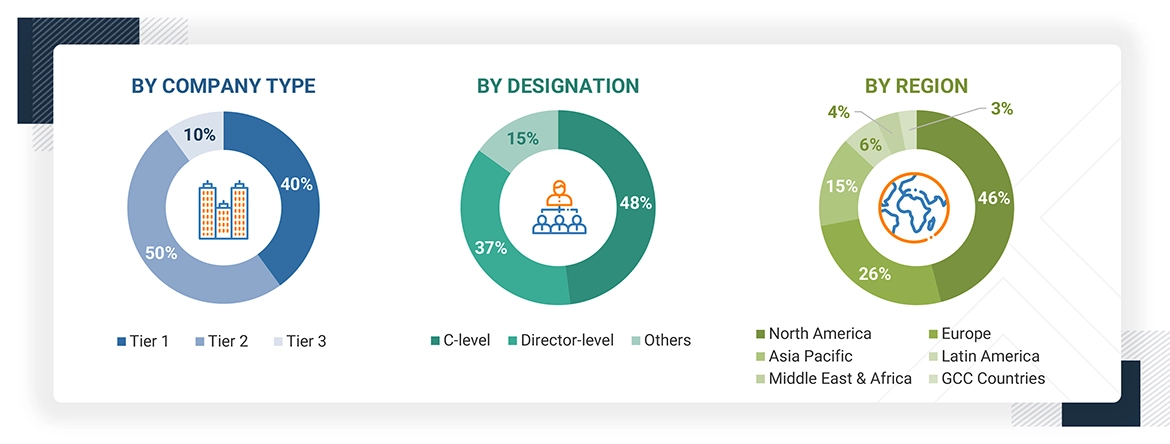
To determine the current size of the sleep apnea oral appliances market, this study engaged in four main activities. A comprehensive study was conducted using secondary research methods to gather data about the market, its parent market, and its peer markets. The next stage involved conducting primary research to confirm these conclusions, assumptions, and sizing with industry experts throughout the value chain. A combination of top-down and bottom-up methods was used to assess the overall market size. The market sizes of segments and subsegments were then estimated using data triangulation techniques and market breakdown.

The four steps involved in estimating the market size are

Secondary Research

Within the secondary data collection process, a range of secondary sources were reviewed so as to identify and gather data for this study, including regulatory bodies, databases (World Bank, World Health Organization, Centers for Disease Control and Prevention, and the US Food and Drug Administration); corporate filings (annual reports, SEC filings, investor presentations, and financial statements); research journals; press releases; and trade, business, and professional associations.

Primary Research

A thorough method was used in the primary research phase, which involved interviewing a wide range of sources from the supply and demand sides. The purpose of these interviews was to obtain the quantitative and qualitative information needed to put up this report. The main sources of information were industry experts from both core and related sectors, as well as preferred service provider, pioneers in technology, and organizations involved in every aspect of this industry's value chain. A variety of primary respondents, including important industry stakeholders, subject-matter experts, C-level executives from crucial market companies, and industry advisers, were carefully questioned in-depth. The goal was to gather and validate important qualitative and quantitative insights and to conduct a thorough assessment of future possibilities.

Note 1: Other designations include sales, marketing, and product managers.

Note 2: Tiers are defined based on a company’s total revenue. As of 2024, Tier 1= >USD 1 billion, Tier 2 = USD 500 million to USD 1 billion, and Tier 3 = < USD 500 million.

To know about the assumptions considered for the study, download the pdf brochure

COMPANY NAME DESIGNATION
ResMed Territory Manager
SOMNOmedics Country Manager
Breas Medical Product Application Specialist

Market Size Estimation

All major product providers offering various products and services were identified at the global/regional level. Revenue mapping was done for the major players and was extrapolated to arrive at the global market value of each type of segment. The market value of the sterilization services market was also split into various segments and subsegments at the region and country level based on:

  • Offering mapping of various service provider for each type in the sleep apnea oral appliances market at the regional and country level
  • Relative adoption pattern of each sleep apnea oral appliances market among key application segments at the regional and/or country-level
  • Detailed primary research to gather qualitative and quantitative information related to segments and subsegments at the regional and/or country level.
  • Detailed secondary research to gauge the prevailing market trends at the regional and/or country level

Data Triangulation

After arriving at the overall market size applying the process mentioned above, the total market was split into several segments and subsegments. To complete the overall market engineering process and arrive at the exact statistics for all segments and subsegments, data triangulation and market breakdown procedures were employed, wherever applicable. The data was triangulated by studying various factors and trends from both the demand and supply sides.

Market Definition

Sleep apnea is a common sleep disorder that often goes unnoticed, but it can have serious and life-threatening effects. The most common type of sleep apnea is obstructive sleep apnea. Because some patients struggle with using positive airway pressure (PAP) devices, oral appliances are becoming more popular for treating sleep apnea. Oral appliance therapy (OAT) is used to treat patients with snoring and obstructive sleep apnea (OSA). OAT can be an effective treatment for patients who prefer oral appliances over continuous positive airway pressure (CPAP) or those who cannot tolerate CPAP.

Stakeholders

  • Manufacturers and distributors of sleep apnea oral appliances
  • Hospitals
  • Dental clinics
  • Healthcare corporations
  • Medical service providers
  • Ambulatory surgical centers
  • Appliance suppliers
  • Consulting firms
  • Government associations
  • Venture capitalists and investors

Report Objectives

  • To define, describe, segment, and forecast the global sleep apnea oral appliances market by product, purchase type, gender, age group, distribution channel, end user, and region
  • To provide detailed information regarding the major factors influencing the market growth (such as drivers, restraints, opportunities, and challenges)
  • To analyze the micro markets with respect to individual growth trends, prospects, and contributions to the overall sleep apnea oral appliances market
  • To analyze market opportunities for stakeholders and provide details of the competitive landscape for key players
  • To forecast the size of the market segments with respect to six regions: North America, Europe, the Asia Pacific, Latin America, the Middle East & Africa, and the GCC Countries
  • To profile the key players and comprehensively analyze their product portfolios, market positions, and core competencies
  • To benchmark players within the market using the proprietary Company Evaluation Matrix framework, which analyzes market players on various parameters within the broad categories of business and product excellence

Previous Versions of this Report

Sleep Apnea Oral Appliances Market by Product (Mandibular Advancement Devices, Tongue-Retaining Devices), Purchase Type (Physician-prescribed), Gender (Male, Female), Age Group, Distribution Channel (Online, Retail) & Region - Global Forecast to 2029

Report Code MD 6285
Published in Sep, 2024, By MarketsandMarkets™

Sleep Apnea Oral Appliances Market by Product (Mandibular Advancement Devices & Tongue-Retaining Devices), Purchase Type (Physician-prescribed/Customized Oral Appliances & Online OTC Oral Appliances), End User (Homecare, Hospital) & Region - Global Forecasts to 2027

Report Code MD 6285
Published in Dec, 2023, By MarketsandMarkets™

Sleep Apnea Oral Appliances Market by Product (Mandibular Advancement Devices & Tongue-Retaining Devices), Purchase Type (Physician-prescribed/Customized Oral Appliances & Online OTC Oral Appliances), End User (Homecare,Hospital) - Global Forecast to 2027

Report Code MD 6285
Published in Aug, 2022, By MarketsandMarkets™

Sleep Apnea Oral Appliances Market by Product (Mandibular Advancement Devices (Mad) & Tongue-Retaining Devices (TRD)), Type (Physician Prescribed/Customized Oral Appliances & Online OTC Oral Appliances) - Global Forecasts to 2023

Report Code MD 6285
Published in May, 2018, By MarketsandMarkets™

Custom Market Research Services

We Will Customise The Research For You, In Case The Report Listed Above Does Not Meet With Your Requirements

Get 10% Free Customisation

Growth opportunities and latent adjacency in Sleep Apnea Oral Appliances Market

DMCA.com Protection Status