Savory Ingredients Market

Savory Ingredients Market by Type ((Monosodium Glutamate, Yeast Extracts, HVPs, HAPs, Nucleotides, and Other Types), Form (Powder, Liquid, and Others), Origin (Natural and Synthetic), Application (Food and Feed), and Region - Global Forecast to 2025

Market Segmentation

Report Metrics Details

Market size available for years

2020 - 2025

CAGR %

5.2

READ MORE...

Competitive Analysis

READ MORE...

Top 10 companies in Savory Ingredients Market

Report Code: FB 2604 Apr, 2020, by marketsandmarkets.com

The global savory ingredients market size & share in terms of monetary terms is anticipated to reach USD 9.3 billion by 2025, recording a CAGR of 5.2%. The research study consists of an industry trend analysis of the market. The research study consists of pricing analysis, patent analysis, conference and webinar materials, key stakeholders, and buying behaviour in the market. The demand for flavor enhancers witnessed a significant increase due to the availability of a variety of food choices for consumers. The demand for food consisting of different flavors is increasing at an exponential rate across the world. To meet this demand, highly cost-effective and innovative ways of producing flavors, which are added as flavor enhancers, are expected to propel the growth of the market.

The rapid urbanization, influence of Western food habits, and an increase in the purchasing power parity of consumers in the developing countries of the Asia Pacific region, such as China, India, and Indonesia, also propel the demand for flavor enhancer-based products, such as convenience foods, meat- & fish-based food products, beverages, snack products, and others such as confectionery products, bakery, and dairy products.  However, the growing awareness regarding the ill-effects of synthetic savory ingredients, such as MSG, is one of the key factors restricting the growth of this market in developed regions, where the consumers are more inclined toward natural ingredients such as yeast extracts.

Savory Ingredients Market

To know about the assumptions considered for the study, Request for Free Sample Report

By type, the monosodium glutamate segment is projected to account for a larger share in the savory ingredients market

The monosodium glutamate segment is projected to dominate the market, on the basis of type, during the forecast period. This is attributed to the cost-effectiveness and wide application areas of MSG in food and feed applications. MSG is a sodium salt of glutamic acid and is the most widely used savory ingredient. It is generally added to food to enhance the salty or sugary flavor, even though it is tasteless. MSG is widely used in frozen foods, spice mixes, canned & dry soups, salad dressings, and meat or fish-based products.

By application, the food segment is expected to account for a larger share in the market during the forecast period

Based on application, the savory ingredients market is segmented into food and feed. The food segment is estimated to account for a larger share because of the high consumption of savory ingredients, such as MSG and yeast extracts, in various food applications, such as prepared meals and snacks. The rising consumption of natural savory ingredients with the growing demand for clean label and free-from products drives the market for savory ingredients in the food industry.

Savory Ingredients Market by Region

To know about the assumptions considered for the study, download the pdf brochure

Asia Pacific is projected to account for the largest market share during the forecast period

In 2019, Asia Pacific accounted for the largest market share in the market. The processed food industry in the Asia Pacific region is experiencing fast growth owing to changes in lifestyles and an increase in disposable income levels. The processed food market in the region is currently undergoing dynamic changes in response to rapid urbanization, diet diversification, and liberalization in the food sector.

Increase in the number of end-use applications of savory ingredients is one of the major drivers for the growth of market

Savory ingredients are finding applications in various food segments such as in soups & sauces, dehydrated noodles, ready-to-eat meals, and pet food. They are also used as seasonings and as salt replacements. To deliver the background richness and roundness, yeast extracts are increasingly used to provide both umami and kokumi tastes that add levels of flavor complexity to foods. The increase in consumption and usage of sauces, soups, and other seasonings in various countries is expected to bolster the demand for savory ingredients, such as MSG and nucleotides.

Key Market Players:

The key players in this market include Givaudan (Switzerland), Lesaffre Group (France), ADM (US), Ajinomoto Co., Inc. (Japan), Koninklijke DSM N.V. (Netherlands), Kerry Group PLC (Ireland), Tate & Lyle PLC (UK), and AngelYeast Co., Ltd. (China).

Scope of the Market Report

Report Metric

Details

Revenue 2020: US $7.2 Billion
Revenue 2025: US $9.3 Billion

Market size estimation

2018–2025

Base year considered

2019

Forecast period considered

2020–2025

Units considered

Value (USD), Volume (Kilo Tons)

Segments covered

Type, origin, form, application, and region

Regions covered

North America, Asia Pacific, Europe, South America, and RoW

Companies studied

  • Ajinomoto Co., Inc. (Japan)
  • Koninklijke DSM N.V. (Netherlands)
  • Kerry Group PLC (Ireland)
  • Tate & Lyle PLC (UK)
  • AngelYeast Co., Ltd. (China)
  • Cargill (US)
  • Sensient Technologies Corporation (US)
  •  ABF Ingredients (OHLY) (Germany)
  •  Vinayak Ingredients India Pvt Ltd. (India)
  •  Vedan International (Holdings) Limited (Hong Kong)
  • Givaudan (Switzerland)
  • Lesaffre Group (France)
  • ADM (US)
  • Symrise (Germany)
  • Synergy Flavors (US)
  • Halcyon Proteins Pvy. Ltd. (Australia)
  • Novozymes (Denmark)
  • Food Chem International (China)
  • The Fufeng Group (China)
  • Meihua Holdings Group Co., Ltd. (China)

Target Audience

  • Raw material manufacturers and suppliers
  • Research institutions
  • Government bodies
  • Distributors
  • End users (food & beverage industry)

This report categorizes the savory ingredients market to forecast revenue and analyze trends in each of the following submarkets:

Market by Type

  • Monosodium glutamate
  • Hydrolyzed vegetable proteins
  • Hydrolyzed animal proteins
  • Nucleotides
  • Other types

Market by Origin

  • Synthetic
  • Natural

Market by Form

  • Powder
  • Liquid
  • Other forms

Market by Application

  • Food
  • Prepared meals
  • Snacks
  • Other food applications
  • Feed

Market by Region

  • North America
  • Europe
  • Asia Pacific
  • South America
  • Rest of the World (RoW)

Recent Developments

  • In March 2020, Kerry Group set up a new regional development and food manufacturing facility in Georgia, Rome. This new establishment would help the company to serve its customer base in Europe, increase its production capacity, and expand its geographic reach.
  • In August 2019, Ajinomoto Malaysia, a subsidiary of Ajinomoto Co., Inc., invested approximately USD 80 million to build a new manufacturing plant for the production of menu-specific seasonings, umami seasonings, and flavor seasonings. This expansion would increase the capacity of its existing plant.
  • In December 2019, AngelYeast Co., Ltd. launched a new natural flavor-enhancing solution for plant-based food and beverages in Europe. This product launch will help the company to strengthen its portfolio and increase its customer base in Europe.
  • In November 2019, DSM launched MaxaGourmet, a solution, in the savory ingredient category. It was launched in Europe to help DSM strengthen its product portfolio and company presence in Europe.  

Key Questions Addressed by the Market Report

  • What are the growth opportunities in the savory ingredients market?
  • What are the major food application areas for savory ingredients?
  • What are the key factors affecting market dynamics?
  • What are some of the significant challenges and restraints that the industry faces?
  • Which are the key players operating in the market, and what initiatives have they undertaken over the past few years?

Frequently Asked Questions (FAQ):

To speak to our analyst for a discussion on the above findings, click Speak to Analyst

TABLE OF CONTENTS

1 INTRODUCTION (Page No. - 18)
    1.1 OBJECTIVES OF THE STUDY
    1.2 MARKET DEFINITION
    1.3 STUDY SCOPE
           FIGURE 1 SAVORY INGREDIENTS MARKET SEGMENTATION
    1.4 REGIONAL SEGMENTATION
    1.5 PERIODIZATION CONSIDERED
    1.6 CURRENCY CONSIDERED
           TABLE 1 USD EXCHANGE RATE, 2014–2018
    1.7 UNIT CONSIDERED
    1.8 STAKEHOLDERS

2 RESEARCH METHODOLOGY (Page No. - 23)
    2.1 RESEARCH DATA
           FIGURE 2 SAVORY INGREDIENTS MARKET: RESEARCH DESIGN
           2.1.1 SECONDARY DATA
                    2.1.1.1 Key Data from Secondary Sources
           2.1.2 PRIMARY DATA
                    2.1.2.1 Breakdown of Primaries
    2.2 MARKET SIZE ESTIMATION
           2.2.1 MARKET SIZE ESTIMATION: METHOD 1
           2.2.2 MARKET SIZE ESTIMATION: METHOD 2
           2.2.3 MARKET SIZE NOTES
    2.3 DATA TRIANGULATION
           FIGURE 3 DATA TRIANGULATION METHODOLOGY
    2.4 ASSUMPTIONS FOR THE STUDY
    2.5 LIMITATIONS OF THE STUDY

3 EXECUTIVE SUMMARY (Page No. - 31)
    TABLE 2 MARKET SNAPSHOT, 2020 VS. 2025
    FIGURE 4 MARKET SIZE, BY APPLICATION, 2020 VS. 2025 (USD MILLION)
    FIGURE 5 MARKET SIZE, BY ORIGIN, 2020 VS. 2025 (USD MILLION)
    FIGURE 6 MARKET SHARE AND GROWTH (VALUE), BY REGION

4 PREMIUM INSIGHTS (Page No. - 34)
    4.1 OVERVIEW OF THE MARKET
           FIGURE 7 GROWING DEMAND FOR SAVORY-FLAVORED PROCESSED & CONVENIENCE FOOD PRODUCTS TO DRIVE THE MARKET FOR SAVORY INGREDIENTS
    4.2 MARKET FOR SAVORY INGREDIENTS, BY ORIGIN, 2019
           FIGURE 8 SYNTHETIC SEGMENT ACCOUNTED FOR A LARGER SHARE IN THE MARKET
    4.3 ASIA PACIFIC: MARKET FOR SAVORY INGREDIENTS, BY APPLICATION AND KEY COUNTRY
           FIGURE 9 ASIA PACIFIC: CHINA DOMINATED THE MARKET DUE TO THE HIGH CONSUMPTION OF FLAVOR-ENHANCED SAVORY PRODUCTS AND LARGE PRODUCTION BY KEY PLAYERS IN THE COUNTRY
    4.4 MARKET FOR SAVORY INGREDIENTS, BY APPLICATION AND REGION, 2019
           FIGURE 10 ASIA PACIFIC ACCOUNTED FOR THE LARGEST SHARE IN THE MARKET FOR FOOD IN 2019
    4.5 MARKET FOR SAVORY INGREDIENTS, BY KEY COUNTRY/REGION, 2019
           FIGURE 11 CHINA ACCOUNTED FOR THE LARGEST MARKET SHARE IN 2019

5 MARKET OVERVIEW (Page No. - 38)
    5.1 INTRODUCTION
    5.2 MARKET DYNAMICS
           FIGURE 12 MARKET FOR SAVORY INGREDIENTS: DRIVERS, RESTRAINTS, OPPORTUNITIES, AND CHALLENGES
           5.2.1 DRIVERS
                    5.2.1.1 Increasing popularity of convenience food products
                    5.2.1.2 Growing government intervention toward the reduction of salt intake in developed countries
                    5.2.1.3 Increase in the number of end-use applications of savory ingredients
                    5.2.1.4 Changing consumer food preferences in developing regions
           5.2.2 RESTRAINTS
                    5.2.2.1 Stringent regulations on international quality standards
                    5.2.2.2 High cost of processing and raw materials
           5.2.3 OPPORTUNITIES
                    5.2.3.1 Rising demand for natural and healthy flavor ingredients
                    5.2.3.2 Growing need for the replacement of MSG
           5.2.4 CHALLENGES
                    5.2.4.1 Consumer awareness about the ill-effects of flavor enhancers
                    5.2.4.2 Growing demand for clean labels
    5.3 REGULATIONS
           5.3.1 US & CANADA
           5.3.2 INDIA
           5.3.3 AUSTRALIA & NEW ZEALAND
           5.3.4 EUROPE
    5.4 YC-YCC SHIFT

6 SAVORY INGREDIENTS MARKET, BY TYPE (Page No. - 48)
    6.1 INTRODUCTION
           FIGURE 13 MARKET SIZE, BY TYPE, 2020 VS. 2025 (USD MILLION)
           FIGURE 14 MARKET SIZE, BY TYPE, 2020 VS. 2025 (KT)
           TABLE 3 MARKET SIZE, BY TYPE, 2018–2025 (USD MILLION)
           TABLE 4 MARKET SIZE, BY TYPE, 2018–2025 (KT)
    6.2 YEAST EXTRACTS
           6.2.1 GROWING DEMAND FOR NATURAL INGREDIENTS SUPPORTS THE GROWTH OF YEAST EXTRACTS
                    TABLE 5 YEAST EXTRACTS MARKET SIZE, BY REGION, 2018–2025 (USD MILLION)
                    TABLE 6 YEAST EXTRACTS MARKET SIZE, BY REGION, 2018–2025 (KT)
    6.3 HYDROLYZED VEGETABLE PROTEINS
           6.3.1 THE GROWING DEMAND FOR CONVENIENCE FOOD AND PREPARED MEALS DRIVES THE MARKET FOR HYDROLYZED VEGETABLE PROTEINS
                    TABLE 7 HYDROLYZED VEGETABLE PROTEINS MARKET SIZE, BY REGION, 2018–2025 (USD MILLION)
                    TABLE 8 HYDROLYZED VEGETABLE PROTEINS MARKET SIZE, BY REGION, 2018–2025 (KT)
    6.4 HYDROLYZED ANIMAL PROTEINS
           6.4.1 HYDROLYZED ANIMAL PROTEINS (HAPS) ARE MAJORLY USED IN THE FEED SECTOR
                    TABLE 9 HYDROLYZED ANIMAL PROTEINS MARKET SIZE, BY REGION, 2018–2025 (USD MILLION)
                    TABLE 10 HYDROLYZED ANIMAL PROTEINS MARKET SIZE, BY REGION, 2018–2025 (KT)
    6.5 MONOSODIUM GLUTAMATE (MSG)
           6.5.1 MSG IS THE MOST CONSUMED SAVORY INGREDIENT IN DEVELOPING COUNTRIES
                    TABLE 11 MONOSODIUM GLUTAMATE MARKET SIZE, BY REGION, 2018–2025 (USD MILLION)
                    TABLE 12 MONOSODIUM GLUTAMATE MARKET SIZE, BY REGION, 2018–2025 (KT)
    6.6 NUCLEOTIDES
           6.6.1 NUCLEOTIDES ARE EXPECTED TO HAVE A HIGH POTENTIAL TO ENHANCE THE PROFITABILITY OF LIVESTOCK
                    TABLE 13 NUCLEOTIDES MARKET SIZE, BY REGION, 2018–2025 (USD MILLION)
                    TABLE 14 NUCLEOTIDES MARKET SIZE, BY REGION, 2018–2025 (KT)
    6.7 OTHER TYPES
           TABLE 15 OTHER TYPES MARKET SIZE, BY REGION, 2018–2025 (USD MILLION)
           TABLE 16 OTHER TYPES MARKET SIZE, BY REGION, 2018–2025 (KT)

7 SAVORY INGREDIENTS MARKET, BY ORIGIN (Page No. - 58)
    7.1 INTRODUCTION
           FIGURE 15 MARKET SIZE, BY ORIGIN, 2020 VS. 2025 (USD MILLION)
           FIGURE 16 MARKET SIZE, BY ORIGIN, 2020 VS. 2025 (KT)
           TABLE 17 MARKET SIZE, BY ORIGIN, 2018–2025 (USD MILLION)
           TABLE 18 MARKET SIZE, BY ORIGIN, 2018–2025 (KT)
    7.2 NATURAL
           7.2.1 RISING HEALTH CONCERNS AMONG CONSUMERS RESULT IN THE GROWTH IN DEMAND FOR NATURALLY SOURCED INGREDIENTS IN FOOD PRODUCTS
                    TABLE 19 NATURAL SAVORY INGREDIENTS MARKET SIZE, BY REGION, 2018–2025 (USD MILLION)
                    TABLE 20 NATURAL SAVORY INGREDIENTS MARKET SIZE, BY REGION, 2018–2025 (KT)
    7.3 SYNTHETIC
           7.3.1 LOW-COST MANUFACTURING PROCESS FOR SYNTHETIC SAVORY INGREDIENTS DRIVES THE MARKET GROWTH
                    TABLE 21 SYNTHETIC MARKET SIZE, BY REGION, 2018–2025 (USD MILLION)
                    TABLE 22 SYNTHETIC SAVORY INGREDIENTS MARKET SIZE, BY REGION, 2018–2025 (KT)

8 SAVORY INGREDIENTS MARKET, BY FORM (Page No. - 64)
    8.1 INTRODUCTION
           FIGURE 17 MARKET SIZE, BY FORM, 2020 VS. 2025 (USD MILLION)
           FIGURE 18 MARKET SIZE, BY FORM, 2020 VS. 2025 (KT)
           TABLE 23 MARKET SIZE, BY FORM, 2018–2025 (USD MILLION)
           TABLE 24 MARKET SIZE, BY FORM, 2018–2025 (KT)
    8.2 POWDER
           8.2.1 WIDE USAGE OF POWDERED SAVORY INGREDIENTS IN FOODSERVICE OUTLETS AND HOUSEHOLDS DRIVES THE MARKET GROWTH
    8.3 LIQUID
           8.3.1 HIGH SOLUBILITY OF THE LIQUID FORM SUPPORTS ITS USAGE IN BEVERAGES
    8.4 OTHER FORMS

9 SAVORY INGREDIENTS MARKET, BY APPLICATION (Page No. - 68)
    9.1 INTRODUCTION
           FIGURE 19 SAVORY INGREDIENTS MARKET SIZE, BY APPLICATION, 2020 VS. 2025 (USD MILLION)
           FIGURE 20 MARKET SIZE, BY APPLICATION, 2020 VS. 2025 (KT)
           TABLE 25 MARKET SIZE, BY APPLICATION, 2018–2025 (USD MILLION)
           TABLE 26 MARKET SIZE, BY APPLICATION, 2018–2025 (KT)
    9.2 FOOD
           9.2.1 GROWING DEMAND FOR CONVENIENCE AND READY-TO-EAT FOOD WITH UMAMI FLAVOR DRIVES THE GROWTH OF SAVORY INGREDIENTS IN THE FOOD SEGMENT
                    TABLE 27 SAVORY INGREDIENTS MARKET SIZE, BY FOOD APPLICATION, 2018–2025 (USD MILLION)
                    TABLE 28 MARKET SIZE, BY FOOD APPLICATION, 2018–2025 (KT)
                    TABLE 29 MARKET SIZE FOR SNACKS APPLICATION, BY TYPE, 2018–2025 (USD MILLION)
                    TABLE 30 FOOD: MARKET SIZE, BY REGION, 2018–2025 (USD MILLION)
                    TABLE 31 FOOD: MARKET SIZE, BY REGION, 2018–2025 (KT)
    9.3 FEED
           9.3.1 DEMAND FOR NATURAL SAVORY INGREDIENTS, SUCH AS YEAST EXTRACTS AND HVP, IN FEED SUPPORTS THE GROWTH OF THE SAVORY INGREDIENT MARKET
                    TABLE 32 FEED: MARKET SIZE, BY REGION, 2018–2025 (USD MILLION)
                    TABLE 33 FEED: MARKET SIZE, BY REGION, 2018–2025 (KT)

10 SAVORY INGREDIENTS MARKET, BY REGION (Page No. - 75)
     10.1 INTRODUCTION
               FIGURE 21 ASIA PACIFIC SAVORY INGREDIENTS MARKET TO WITNESS SIGNIFICANT GROWTH DURING 2020–2025
               TABLE 34 MARKET SIZE, BY REGION, 2018–2025 (USD MILLION)
               TABLE 35 MARKET SIZE, BY REGION, 2018–2025 (KT)
     10.2 NORTH AMERICA
               FIGURE 22 NORTH AMERICA: SAVORY INGREDIENTS MARKET SNAPSHOT
               TABLE 36 NORTH AMERICA: MARKET SIZE, BY COUNTRY, 2018–2025 (USD MILLION)
               TABLE 37 NORTH AMERICA: MARKET SIZE, BY COUNTRY, 2018–2025 (KT)
               TABLE 38 NORTH AMERICA: MARKET SIZE, BY TYPE, 2018–2025 (USD MILLION)
               TABLE 39 NORTH AMERICA: MARKET SIZE, BY TYPE, 2018–2025 (KT)
               TABLE 40 NORTH AMERICA: MARKET SIZE, BY ORIGIN, 2018–2025 (USD MILLION)
               TABLE 41 NORTH AMERICA: MARKET SIZE, BY ORIGIN, 2018–2025 (KT)
               TABLE 42 NORTH AMERICA: MARKET SIZE, BY FORM, 2018–2025 (USD MILLION)
               TABLE 43 NORTH AMERICA: MARKET SIZE, BY FORM, 2018–2025 (KT)
               TABLE 44 NORTH AMERICA: MARKET SIZE, BY APPLICATION, 2018–2025 (USD MILLION)
               TABLE 45 NORTH AMERICA: MARKET SIZE, BY APPLICATION, 2018–2025 (KT)
             10.2.1 US
                       10.2.1.1 Increasing demand for savory flavors in packaged and ready-to-eat food products to drive the US market
                                   TABLE 46 US: SAVORY INGREDIENT MARKET SIZE, BY APPLICATION, 2018–2025 (USD MILLION)
                                   TABLE 47 US: MARKET SIZE, BY APPLICATION, 2018–2025 (KT)
             10.2.2 CANADA
                       10.2.2.1 Varied regulations by the government for synthetic ingredients create opportunities for market players to produce natural savory food ingredients
                                   TABLE 48 CANADA: SAVORY INGREDIENT MARKET SIZE, BY APPLICATION, 2018–2025 (USD MILLION)
                                   TABLE 49 CANADA: MARKET SIZE, BY APPLICATION, 2018–2025 (KT)
             10.2.3 MEXICO
                       10.2.3.1 Challenge for manufacturers to produce plant-based food products with a blend of savory flavors
                                   TABLE 50 MEXICO: SAVORY INGREDIENT MARKET SIZE, BY APPLICATION, 2018–2025 (USD MILLION)
                                   TABLE 51 MEXICO: MARKET SIZE, BY APPLICATION, 2018–2025 (KT)
     10.3 EUROPE
               FIGURE 23 EUROPE: SAVORY INGREDIENTS MARKET SNAPSHOT
               TABLE 52 EUROPE: MARKET SIZE, BY COUNTRY, 2018–2025 (USD MILLION)
               TABLE 53 EUROPE: MARKET SIZE, BY COUNTRY, 2018–2025 (KT)
               TABLE 54 EUROPE: MARKET SIZE, BY TYPE, 2018–2025 (USD MILLION)
               TABLE 55 EUROPE: MARKET SIZE, BY TYPE, 2018–2025 (KT)
               TABLE 56 EUROPE: MARKET SIZE, BY ORIGIN, 2018–2025 (USD MILLION)
               TABLE 57 EUROPE: MARKET SIZE, BY ORIGIN, 2018–2025 (KT)
               TABLE 58 EUROPE: MARKET SIZE, BY APPLICATION, 2018–2025 (USD MILLION)
               TABLE 59 EUROPE: MARKET SIZE, BY APPLICATION, 2018–2025 (KT)
             10.3.1 UK
                       10.3.1.1 Growing trend of free-from products drives the natural savory ingredient market growth
                                   TABLE 60 UK: SAVORY INGREDIENTS MARKET SIZE, BY APPLICATION, 2018–2025 (USD MILLION)
                                   TABLE 61 UK: MARKET SIZE, BY APPLICATION, 2018–2025 (KT)
             10.3.2 GERMANY
                       10.3.2.1 Inclination toward healthy snacking supports the demand for savory ingredients in snacks
                                   TABLE 62 GERMANY: SAVORY INGREDIENTS MARKET SIZE, BY APPLICATION, 2018–2025 (USD MILLION)
                                   TABLE 63 GERMANY: MARKET SIZE, BY APPLICATION, 2018–2025 (KT)
             10.3.3 SPAIN
                       10.3.3.1 Growth in applications such as cheese, cured meat, and bakery & confectionery products drives the market for savory ingredients
                                   TABLE 64 SPAIN: SAVORY INGREDIENTS MARKET SIZE, BY APPLICATION, 2018–2025 (USD MILLION)
                                   TABLE 65 SPAIN: MARKET SIZE, BY APPLICATION, 2018–2025 (KT)
             10.3.4 ITALY
                       10.3.4.1 Adoption of umami taste in traditional Italian food drives the market growth
                                   TABLE 66 ITALY: SAVORY INGREDIENT MARKET SIZE, BY APPLICATION, 2018–2025 (USD MILLION)
                                   TABLE 67 ITALY: MARKET SIZE, BY APPLICATION, 2018–2025 (KT)
             10.3.5 FRANCE
                       10.3.5.1 Demand for convenience food with savory flavors in the country drives the market growth
                                   TABLE 68 FRANCE: SAVORY INGREDIENTS MARKET SIZE, BY APPLICATION, 2018–2025 (USD MILLION)
                                   TABLE 69 FRANCE: MARKET SIZE, BY APPLICATION, 2018–2025 (KT)
             10.3.6 REST OF EUROPE
                       TABLE 70 REST OF EUROPE: SAVORY INGREDIENTS MARKET SIZE, BY APPLICATION, 2018–2025 (USD MILLION)
                       TABLE 71 REST OF EUROPE: MARKET SIZE, BY APPLICATION, 2018–2025 (KT)
     10.4 ASIA PACIFIC
               FIGURE 24 ASIA PACIFIC: SAVORY INGREDIENTS MARKET SNAPSHOT
               TABLE 72 ASIA PACIFIC: MARKET SIZE, BY COUNTRY, 2018–2025 (USD MILLION)
               TABLE 73 ASIA PACIFIC: MARKET SIZE, BY COUNTRY, 2018–2025 (KT)
               TABLE 74 ASIA PACIFIC: MARKET SIZE, BY TYPE, 2018–2025 (USD MILLION)
               TABLE 75 ASIA PACIFIC: MARKET SIZE, BY TYPE, 2018–2025 (KT)
               TABLE 76 ASIA PACIFIC: MARKET SIZE, BY ORIGIN, 2018–2025 (USD MILLION)
               TABLE 77 ASIA PACIFIC: MARKET SIZE, BY ORIGIN, 2018–2025 (KT)
               TABLE 78 ASIA PACIFIC: MARKET SIZE, BY APPLICATION, 2018–2025 (USD MILLION)
               TABLE 79 ASIA PACIFIC: MARKET SIZE, BY APPLICATION, 2018–2025 (KT)
             10.4.1 CHINA
                       10.4.1.1 Growth potential of yeast extracts in bakery and brewing industries
                                   TABLE 80 CHINA: SAVORY INGREDIENTS MARKET SIZE, BY APPLICATION, 2018–2025 (USD MILLION)
                                   TABLE 81 CHINA: MARKET SIZE, BY APPLICATION, 2018–2025 (KT)
             10.4.2 JAPAN
                       10.4.2.1 Change in lifestyles and rising disposable incomes of consumers influence the growth of savory ingredients
                                   TABLE 82 JAPAN: SAVORY INGREDIENTS MARKET SIZE, BY APPLICATION, 2018–2025 (USD MILLION)
                                   TABLE 83 JAPAN: MARKET SIZE, BY APPLICATION, 2018–2025 (KT)
             10.4.3 INDIA
                       10.4.3.1 Favorable government policies for savory-flavored processed food support the growth of savory ingredients
                                   TABLE 84 INDIA: SAVORY INGREDIENTS MARKET SIZE, BY APPLICATION, 2018–2025 (USD MILLION)
                                   TABLE 85 INDIA: MARKET SIZE, BY APPLICATION, 2018–2025 (KT)
             10.4.4 INDONESIA
                       10.4.4.1 Use of monosodium glutamate (MSG) as a flavor enhancer in food products supports the market growth for savory ingredients
                                   TABLE 86 INDONESIA: SAVORY INGREDIENTS MARKET SIZE, BY APPLICATION, 2018–2025 (USD MILLION)
                                   TABLE 87 INDONESIA: MARKET SIZE, BY APPLICATION, 2018–2025 (KT)
             10.4.5 THAILAND
                       10.4.5.1 Extensive use of umami-flavored seasonings in food products drive the market growth
                                   TABLE 88 THAILAND: SAVORY INGREDIENTS MARKET SIZE, BY APPLICATION, 2018–2025 (USD MILLION)
                                   TABLE 89 THAILAND: MARKET SIZE, BY APPLICATION, 2018–2025 (KT)
             10.4.6 VIETNAM
                       10.4.6.1 Well-established presence of savory manufacturers and suppliers drives the market significantly in the country
                                   TABLE 90 VIETNAM: SAVORY INGREDIENTS MARKET SIZE, BY APPLICATION, 2018–2025 (USD MILLION)
                                   TABLE 91 VIETNAM: MARKET SIZE, BY APPLICATION, 2018–2025 (KT)
             10.4.7 REST OF ASIA PACIFIC
                                   TABLE 92 REST OF ASIA PACIFIC: SAVORY INGREDIENTS MARKET SIZE, BY APPLICATION, 2018–2025 (USD MILLION)
                                   TABLE 93 REST OF ASIA PACIFIC: MARKET SIZE, BY APPLICATION, 2018–2025 (KT)
     10.5 SOUTH AMERICA
               FIGURE 25 SOUTH AMERICA: SAVORY INGREDIENTS MARKET SNAPSHOT
               TABLE 94 SOUTH AMERICA: MARKET SIZE, BY COUNTRY, 2018–2025 (USD MILLION)
               TABLE 95 SOUTH AMERICA: MARKET SIZE, BY COUNTRY, 2018–2025 (KT)
               TABLE 96 SOUTH AMERICA: MARKET SIZE, BY TYPE, 2018–2025 (USD MILLION)
               TABLE 97 SOUTH AMERICA: MARKET SIZE, BY TYPE, 2018–2025 (KT)
               TABLE 98 SOUTH AMERICA: MARKET SIZE, BY ORIGIN, 2018–2025 (USD MILLION)
               TABLE 99 SOUTH AMERICA: MARKET SIZE, BY ORIGIN, 2018–2025 (KT)
               TABLE 100 SOUTH AMERICA: MARKET SIZE, BY APPLICATION, 2018–2025 (USD MILLION)
               TABLE 101 SOUTH AMERICA: MARKET SIZE, BY APPLICATION, 2018–2025 (KT)
             10.5.1 BRAZIL
                       10.5.1.1 High growth in the demand for packed food with blends of savory flavors drives the market for savory ingredients
                                   TABLE 102 BRAZIL: SAVORY INGREDIENTS MARKET SIZE, BY APPLICATION, 2018–2025 (USD MILLION)
                                   TABLE 103 BRAZIL: MARKET SIZE, BY APPLICATION, 2018–2025 (KT)
             10.5.2 ARGENTINA
                       10.5.2.1 Rise in the domestic consumption for processed food and snacks made with natural ingredients supports the growth of the savory ingredients market
                                   TABLE 104 ARGENTINA: SAVORY INGREDIENTS MARKET SIZE, BY APPLICATION, 2018–2025 (USD MILLION)
                                   TABLE 105 ARGENTINA: MARKET SIZE, BY APPLICATION, 2018–2025 (KT)
             10.5.3 REST OF SOUTH AMERICA
                       TABLE 106 REST OF SOUTH AMERICA: SAVORY INGREDIENTS MARKET SIZE, BY APPLICATION, 2018–2025 (USD MILLION)
                       TABLE 107 REST OF SOUTH AMERICA: MARKET SIZE, BY APPLICATION, 2018–2025 (KT)
     10.6 REST OF THE WORLD (ROW)
               FIGURE 26 REST OF THE WORLD: SAVORY INGREDIENTS MARKET SNAPSHOT
               TABLE 108 ROW: SAVORY INGREDIENTS MARKET SIZE, BY REGION, 2018–2025 (USD MILLION)
               TABLE 109 ROW: MARKET SIZE, BY REGION, 2018–2025 (KT)
               TABLE 110 ROW: MARKET SIZE, BY TYPE, 2018–2025 (USD MILLION)
               TABLE 111 ROW: MARKET SIZE, BY TYPE, 2018–2025 (KT)
               TABLE 112 ROW: MARKET SIZE, BY ORIGIN, 2018–2025 (USD MILLION)
               TABLE 113 ROW: MARKET SIZE, BY ORIGIN, 2018–2025 (KT)
               TABLE 114 ROW: MARKET SIZE, BY APPLICATION, 2018–2025 (USD MILLION)
               TABLE 115 ROW: MARKET SIZE, BY APPLICATION, 2018–2025 (KT)
             10.6.1 MIDDLE EAST
                       10.6.1.1 Increasing consumer trend of opting for snacks and ready-to-eat food products presents growth potential for savory products
                                   TABLE 116 MIDDLE EAST: SAVORY INGREDIENTS MARKET SIZE, BY APPLICATION, 2018–2025 (USD MILLION)
                                   TABLE 117 MIDDLE EAST: MARKET SIZE, BY APPLICATION, 2018–2025 (KT)
             10.6.2 AFRICA
                       10.6.2.1 Rapid urbanization and changes in consumer trends for natural flavored food & beverages to drive the market for savory ingredients
                                   TABLE 118 AFRICA: SAVORY INGREDIENTS MARKET SIZE, BY APPLICATION, 2018–2025 (USD MILLION)
                                   TABLE 119 AFRICA: MARKET SIZE, BY APPLICATION, 2018–2025 (KT)

11 COMPETITIVE LANDSCAPE (Page No. - 117)
     11.1 OVERVIEW
     11.2 RANKING OF KEY PLAYERS, 2019
               FIGURE 27 AJINOMOTO CO., INC. COMPANY LED THE SAVORY INGREDIENTS MARKET IN 2019
     11.3 COMPETITIVE LEADERSHIP MAPPING
             11.3.1 DYNAMIC DIFFERENTIATORS
             11.3.2 INNOVATORS
             11.3.3 VISIONARY LEADERS
             11.3.4 EMERGING COMPANIES
                       FIGURE 28 SAVORY INGREDIENTS MARKET (GLOBAL): COMPETITIVE LEADERSHIP MAPPING, 2019
                       FIGURE 29 KEY DEVELOPMENTS OF LEADING PLAYERS IN THE SAVORY INGREDIENTS MARKET, 2017–2020
     11.4 PRODUCT PORTFOLIO ANALYSIS (GLOBAL)
               FIGURE 30 PRODUCT PORTFOLIO ANALYSIS OF TOP PLAYERS IN THE MARKET (GLOBAL)
     11.5 BUSINESS STRATEGY EXCELLENCE (GLOBAL)
               FIGURE 31 BUSINESS STRATEGY EXCELLENCE OF TOP PLAYERS IN THE MARKET (GLOBAL)
     11.6 COMPETITIVE SCENARIO
             11.6.1 EXPANSIONS & INVESTMENTS
                       TABLE 120 EXPANSIONS & INVESTMENTS, 2018–2020
             11.6.2 NEW PRODUCT LAUNCHES
                       TABLE 121 NEW PRODUCT LAUNCHES, 2018–2020
             11.6.3 AGREEMENTS, JOINT VENTURES, AND PARTNERSHIPS
                       TABLE 122 AGREEMENTS, JOINT VENTURES, AND PARTNERSHIPS, 2018–2020
     11.7 COMPETITIVE LEADERSHIP MAPPING (START-UP/SME)
             11.7.1 PROGRESSIVE COMPANIES
             11.7.2 STARTING BLOCKS
             11.7.3 RESPONSIVE COMPANIES
             11.7.4 DYNAMIC COMPANIES
                       FIGURE 32 SAVORY INGREDIENTS MARKET: COMPETITIVE LEADERSHIP MAPPING, 2019 (START-UP/SME)
     11.8 STRENGTH OF PRODUCT PORTFOLIO (START-UP/SME)
               FIGURE 33 PRODUCT PORTFOLIO ANALYSIS OF TOP PLAYERS IN SAVORY INGREDIENTS MARKET (START-UP/SME)
     11.9 BUSINESS STRATEGY EXCELLENCE (START-UP/SME)
               FIGURE 34 BUSINESS STRATEGY EXCELLENCE OF TOP PLAYERS IN THE MARKET (START-UP/SME)

12 COMPANY PROFILES (Page No. - 129)
(Business overview, Products offered, Recent Developments, SWOT analysis, Right to win)*
     12.1 AJINOMOTO CO., INC.
               FIGURE 35 AJINOMOTO CO., INC.: COMPANY SNAPSHOT
               FIGURE 36 AJINOMOTO CO., INC.: SWOT ANALYSIS
     12.2 KONINKLIJKE DSM N.V.
               FIGURE 37 KONINKLIJKE DSM N.V.: COMPANY SNAPSHOT
               FIGURE 38 KONINKLIJKE DSM N.V.: SWOT ANALYSIS
     12.3 KERRY GROUP PLC
               FIGURE 39 KERRY GROUP PLC: COMPANY SNAPSHOT
               FIGURE 40 KERRY GROUP PLC: SWOT ANALYSIS
     12.4 TATE & LYLE PLC
               FIGURE 41 TATE & LYLE PLC: COMPANY SNAPSHOT
               FIGURE 42 TATE & LYLE PLC: SWOT ANALYSIS
     12.5 GIVAUDAN
               FIGURE 43 GIVAUDAN: COMPANY SNAPSHOT
               FIGURE 44 GIVAUDAN: SWOT ANALYSIS
     12.6 SYMRISE
               FIGURE 45 SYMRISE: COMPANY SNAPSHOT
     12.7 LESAFFRE GROUP
     12.8 SENSIENT TECHNOLOGIES CORPORATION
               FIGURE 46 SENSIENT TECHNOLOGIES CORPORATION: COMPANY SNAPSHOT
     12.9 ANGELYEAST CO., LTD.
     12.10 VEDAN INTERNATIONAL (HOLDINGS) LIMITED
               FIGURE 47 VEDAN INTERNATIONAL (HOLDINGS) LTD.: COMPANY SNAPSHOT
     12.11 SYNERGY FLAVORS
     12.12 VINAYAK INGREDIENTS INDIA PVT LTD.
     12.13 HALCYON PROTEINS PVY. LTD.
     12.14 NOVOZYMES
     12.15 ADM
                       FIGURE 48 ADM: COMPANY SNAPSHOT
     12.16 CARGILL
     12.17 FOOD CHEM INTERNATIONAL CORPORATION
     12.18 ABF INGREDIENTS (OHLY)
                       FIGURE 49 ABF INGREDIENTS (OHLY): COMPANY SNAPSHOT
     12.19 THE FUFENG GROUP
                       FIGURE 50 THE FUFENG GROUP: COMPANY SNAPSHOT
     12.20 MEIHUA HOLDINGS GROUP CO. LTD

*Details on Business overview, Products offered, Recent Developments, SWOT analysis, Right to win might not be captured in case of unlisted companies.

13 APPENDIX (Page No. - 162)
     13.1 DISCUSSION GUIDE
     13.2 KNOWLEDGE STORE: MARKETSANDMARKETS’ SUBSCRIPTION PORTAL
     13.3 AVAILABLE CUSTOMIZATIONS
     13.4 RELATED REPORTS
     13.5 AUTHOR DETAILS

The study involved four major activities in estimating the market size for savory ingredients. Exhaustive secondary research was conducted to collect information on the market, peer market, and parent market. The next step was to validate these findings, assumptions, and sizing with industry experts across the value chain through primary research. Both the top-down and bottom-up approaches were employed to estimate the complete market size. Thereafter, market breakdown and data triangulation were used to estimate the market size of segments and subsegments.

Secondary Research

In the secondary research process, various secondary sources such as Hoovers, Bloomberg BusinessWeek, and Dun & Bradstreet were referred to, in order to identify and collect information for this study. These secondary sources included annual reports, press releases & investor presentations of companies, white papers, certified publications, articles by recognized authors, gold & silver standard websites, food safety organizations, regulatory bodies, trade directories, and databases.

Primary Research

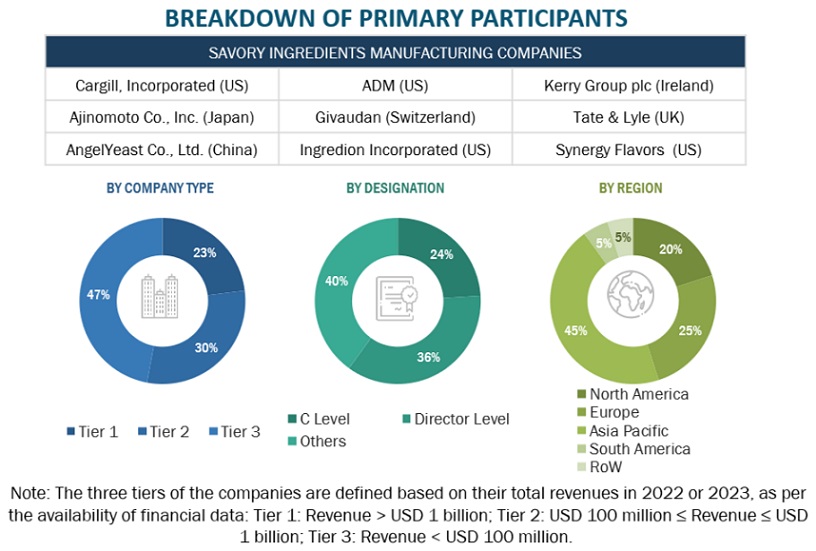
The market comprises several stakeholders, such as raw material suppliers, processors, end-product manufacturers, and regulatory organizations in the supply chain. The demand-side of the market is characterized by the presence of various industrial product processors of food & beverages, which include meat and seafood processors, alcoholic drinks processors and carbonated drinks processors, and research institutions. The supply side is characterized by the presence of raw material manufacturers, suppliers, distributors, researchers, and service providers. Various primary sources from both the supply and demand sides of the market were interviewed to obtain qualitative and quantitative information. Given below is the breakdown of the primary respondents.

Savory Ingredients Market by Region, Company, & Designation

To know about the assumptions considered for the study, download the pdf brochure

Market Size Estimation

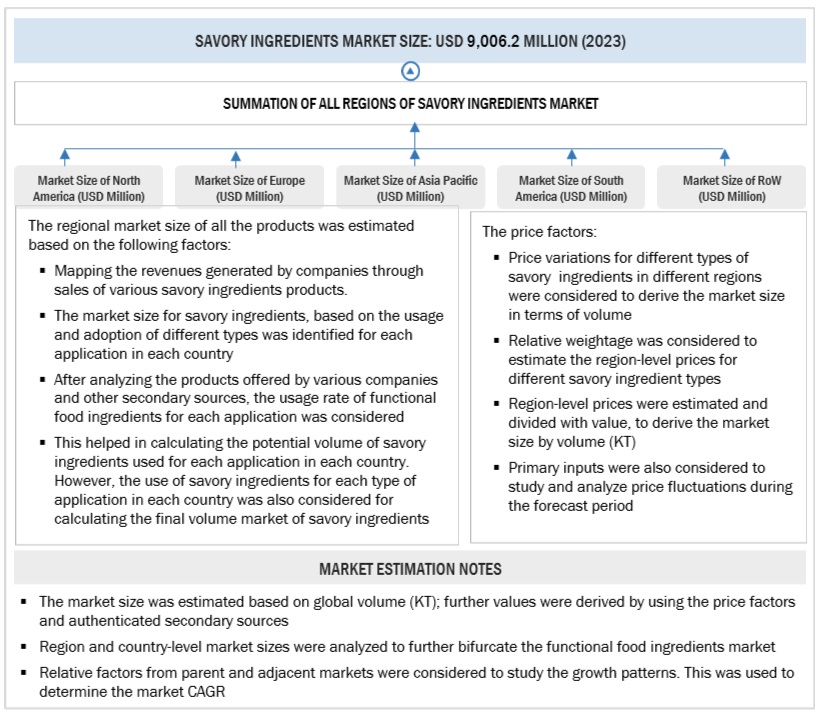
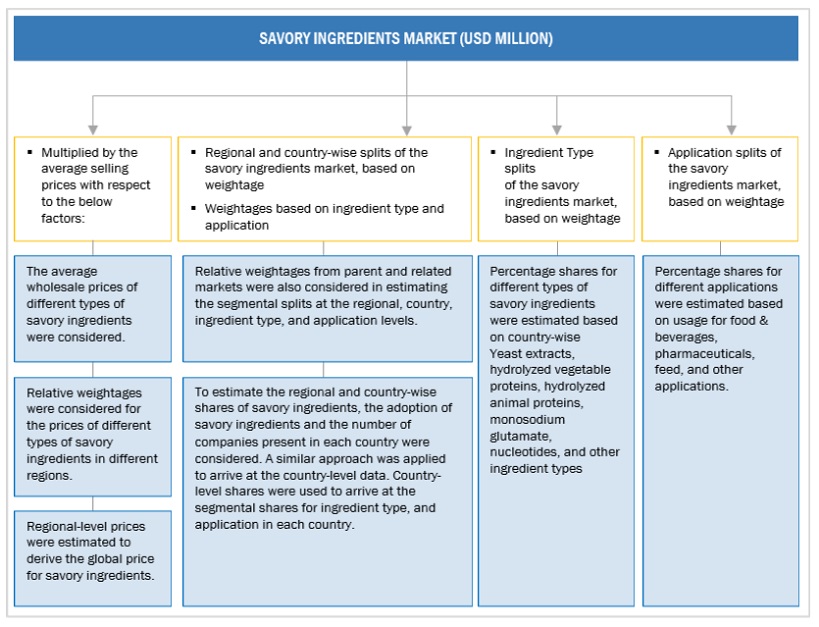
Both the top-down and bottom-up approaches were used to estimate and validate the total size of the savory ingredients market. These methods were also used extensively to estimate the sizes of various subsegments in the market. The research methodology used to estimate the market size includes the following:

  • The key players were identified through extensive primary and secondary research.
  • The value chain and market size of the savory ingredient market, in terms of value, were determined through primary and secondary research.
  • All percentage shares, splits, and breakdowns were determined using secondary sources and verified through primary sources.
  • All possible parameters that affect the market covered in this research study were accounted for, viewed in extensive detail, verified through primary research, and analyzed to obtain the final quantitative and qualitative data.
  • The research included the study of reports, reviews, newsletters of top market players, along with extensive interviews for opinions from key leaders, such as CEOs, directors, and marketing executives.

Data Triangulation

After arriving at the overall market size from the estimation process described above, the total market was split into several segments. To complete the overall market engineering process and arrive at the exact statistics for all segments, the data triangulation and market breakdown procedures were employed, wherever applicable. The data was triangulated by studying various factors and trends from both the demand and supply sides. In addition, the market size was validated using both top-down and bottom-up approaches. It was then verified through primary interviews. Hence, three approaches were adopted—top-down approach, bottom-up approach, and the one involving expert interviews. Only when the values arrived at from the three points match, the data is assumed to be correct.

Report Objectives

  • To describe and forecast the global market, in terms of type, origin, form,  application, and region
  • To describe and forecast the market for savory ingredients, in terms of value, by region–Asia Pacific, Europe, North America, South America, and the Rest of the World—along with their respective countries
  • To provide detailed information regarding the major factors influencing the market growth (drivers, restraints, opportunities, and challenges)
  • To strategically analyze micromarkets with respect to individual growth trends, prospects, and contributions to the overall market
  • To study the complete value chain of the market
  • To analyze opportunities in the market for stakeholders by identifying the high-growth segments of the market
  • To strategically profile the key players and comprehensively analyze their market position, in terms of ranking and core competencies, along with details on the competitive landscape of market leaders
  • To analyze strategic approaches such as acquisitions & divestments, expansions, product launches & approvals, and agreements in the market

Available Customizations

Based on the given market data, MarketsandMarkets offers customizations in the reports according to client-specific requirements. The available customization options are as follows:

Geographic Analysis

  • Further breakdown of the Rest of the World savory ingredient market into Africa and the Middle East
  • Further breakdown of the Rest of Asia Pacific savory ingredient market into Australia & New Zealand, Singapore, Malaysia, and the Philippines
  • Further breakdown of the Rest of European savory ingredient market into Denmark, Poland, and Norway

Segmental Analysis

  • Further breakdown of the savory ingredient application market, by country
Custom Market Research Services

We will customize the research for you, in case the report listed above does not meet with your exact requirements. Our custom research will comprehensively cover the business information you require to help you arrive at strategic and profitable business decisions.

Request Customization
Report Code
FB 2604
Published ON
Apr, 2020
Choose License Type
BUY NOW
  • SHARE
X
Request Customization
Speak to Analyst
Speak to Analyst
OR FACE-TO-FACE MEETING
PERSONALIZE THIS RESEARCH
  • Triangulate with your Own Data
  • Get Data as per your Format and Definition
  • Gain a Deeper Dive on a Specific Application, Geography, Customer or Competitor
  • Any level of Personalization
REQUEST A FREE CUSTOMIZATION
LET US HELP YOU!
  • What are the Known and Unknown Adjacencies Impacting the Savory Ingredients Market
  • What will your New Revenue Sources be?
  • Who will be your Top Customer; what will make them switch?
  • Defend your Market Share or Win Competitors
  • Get a Scorecard for Target Partners
CUSTOMIZED WORKSHOP REQUEST
+1-888-600-6441
  • Call Us
  • +1-888-600-6441 (Corporate office hours)
  • +1-888-600-6441 (US/Can toll free)
  • +44-800-368-9399 (UK office hours)
CONNECT WITH US
ABOUT TRUST ONLINE
©2024 MarketsandMarkets Research Private Ltd. All rights reserved
DMCA.com Protection Status Website Feedback