Integrated Food Ingredients Market by Function (Taste Enhancers, Form, Texture, Preservation, and Coloring), Integrated Solutions (Dairy, Beverage, Bakery & confectionary, Snacks & Savory and Meat & Meat Products), and Region - Global Forecast to 2023


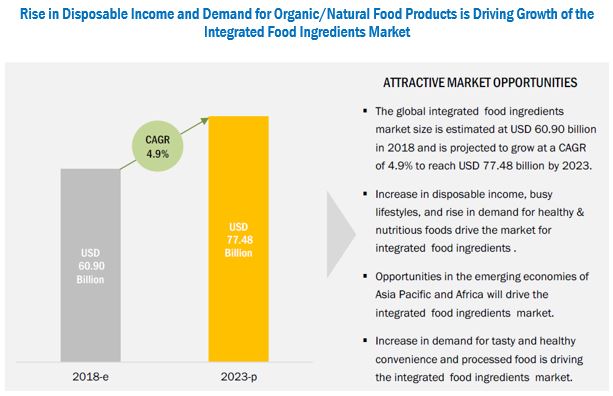
[172 Pages Report] The integrated food ingredients market was valued at USD 56.66 billion in 2017 and is projected to grow at a CAGR of 4.9% from 2018, to reach USD 77.48 billion by 2023. The basic objective of the report is to define, segment, and project the global market size of the market on the basis of function, integrated solutions, and region. It will also help to understand the structure of the market by identifying its various segments. The other objectives include analyzing the opportunities in the market for the stakeholders, providing the competitive landscape of the market trends, and projecting the size of the integrated food ingredients market and its submarkets, in terms of value.
For more details on this research, Request Free Sample Report
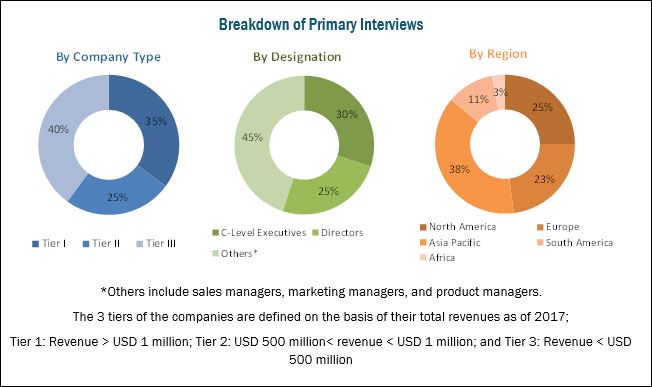
This research study involved the extensive use of secondary sources, which included directories and databases such as Hoovers, Forbes, Bloomberg Businessweek, and Factiva, to identify and collect information useful for a technical, market-oriented, and commercial study of the market. The primary sources that have been involved include industry experts from the core and related industries and preferred suppliers, dealers, manufacturers, alliances, standards & certification organizations from companies; and organizations related to all the segments of this industry’s value chain. In-depth interviews have been conducted with various primary respondents such as key industry participants, subject matter experts, C-level executives of key market players, and industry consultants to obtain and verify critical qualitative and quantitative information as well as to assess future prospects. The following figure depicts the market research methodology applied in drafting this report on the integrated food ingredients market.
To know about the assumptions considered for the study, download the pdf brochure
Key participants in the integrated food ingredients market are the integrated food ingredients manufacturers, suppliers, and regulatory bodies. The key players that are profiled in the report include CARGILL (US), ADM (US), DUPONT (US), ABF (UK), BASF (Germany), Kerry (Ireland), DSM (Netherland), Tate & Lyle (UK), Symrise (Germany), IFF (US), Dohler (Germany), Northwest Naturals (US), GAT Foods (Israel), and FIRMENICH (Switzerland).
This report is targeted at the existing players in the industry, which include the following:
- Integrated food ingredients manufacturers
- Regulatory bodies
- Intermediary suppliers
- End Users
“The study answers several questions for the stakeholders; primarily, which market segments to focus on in the next 2 to 5 years for prioritizing efforts and investments.”
Scope of the Report
On the basis of Function, the market has been segmented as follows:
- Taste enhancers
- Form
- Texture
- Preservation
- Coloring
On the basis of Integrated solutions, the market has been segmented as follows:
- Dairy
- Beverage
- Bakery & confectionery
- Snacks & savory
- Meat products
On the basis of Region, the market has been segmented as follows:
- North America
- Europe
- Asia Pacific
- Africa
- South America
Available Customizations
With the given market data, MarketsandMarkets offers customizations according to a company’s specific needs.
The following customization options are available for the report:
Segment Analysis
- Product matrix, which gives a detailed comparison of the product portfolio of each company
Regional Analysis
- Further breakdown of the Asia Pacific integrated food ingredients market, by country
Company Information
- Detailed analysis and profiling of additional market players (up to 5)
The integrated food ingredients market is estimated at USD 60.90 billion in 2018 and is projected to reach USD 77.48 billion by 2023, growing at a CAGR of 4.9% during the forecast period. The increasing disposable incomes, growing population, busy lifestyles, and a shift in the focus for highly convenient processed food are some of the key trends influencing the growth of this market.
Based on function, taste enhancers dominated the market in terms of value. The application of these integrated food ingredients in various applications such as dairy products, beverages, savories, and meat products enhance the taste of food products.
The ingredients segment, by application in beverages, accounted for the largest share of the global market in 2017. The increasing consumption of fruit juices, vegetable juices, and energy drinks has spurred the growth of natural integrated food ingredients.
The meat products segment, by flavors, accounted for the largest share of the global market in 2017. Integrated food ingredients are highly used in this industry to preserve meat for a longer period of time, which augments the growth of the meat export business of the country. These meat products are most widely consumed in North America, thus affecting the processed meat market in this region.
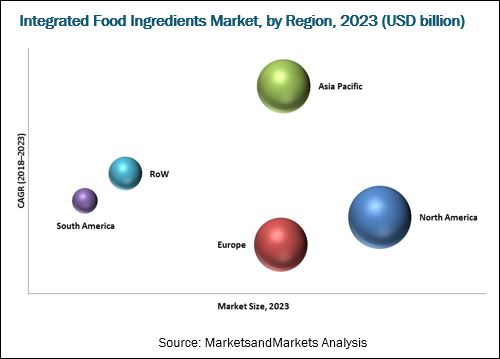
Asia Pacific is projected to be the fastest-growing market for integrated food ingredients during the forecast period. The processed food industry in the Asia Pacific region is experiencing growth, owing to the changing lifestyles of customers. Additionally, the processed food market in the region is also highly dynamic in nature. Consumer preferences are constantly changing in response to rapid urbanization, diet diversification, and liberalization of foreign direct investment in the food sector. The rise in incomes, increase in purchasing power, and significant consumer demand for nutritional & healthy products are expected to provide promising prospects for the growth and diversification of the integrated food ingredient sector in this region. Food items such as breakfast snacks & savories, infant formula, confectionery products, and bakery & confectionery products are widely consumed in this region. They have intrinsic properties of integrated foods, which makes the consumers receptive to these products.
The challenges faced by the integrated food ingredient processors/wholesalers require them to maximize the available space, manage different storage temperatures, and respond to a high turnover of stock while maintaining hygiene levels and product traceability. In developing countries such as China, India, and South Africa, development in the infrastructure of manufacturing units is less, which hampers the production process. The storage facilities in these countries are not technologically developed, which impacts the shelf life of products.
Players such as Cargill (US), Archer Daniels Midland (ADM) (US), Associated British Foods (UK), and Tate & Lyle (UK) have been actively strategizing their growth plans to expand in the integrated food ingredients market. These companies have a strong presence in Europe and North America, and also have manufacturing facilities and a strong distribution network across these regions.
To speak to our analyst for a discussion on the above findings, click Speak to Analyst
 Exclusive indicates content/data unique to MarketsandMarkets and not available with any competitors.
Table of Contents
1 Introduction (Page No. - 15)
1.1 Objectives of the Study
1.2 Market Definition
1.3 Study Scope
1.4 Periodization Considered
1.5 Currency Considered
1.6 Stakeholders
2 Research Methodology (Page No. - 19)
2.1 Research Data
2.1.1 Secondary Data
2.1.2 Primary Data
2.1.2.1 Key Industry Insights
2.1.2.2 Breakdown of Primaries
2.2 Market Size Estimation
2.3 Data Triangulation
2.4 Research Assumptions & Limitations
2.4.1 Assumptions
2.4.2 Limitations
3 Executive Summary (Page No. - 27)
4 Premium Insights (Page No. - 32)
4.1 Attractive Growth Opportunities in this Market
4.2 Asia Pacific: Integrated Food Ingredients Market, By Function
4.3 Integrated Food Ingredients Market, By Beverage Application
4.4 Market, By Function
4.5 Market, By Ingredient
4.6 Market, By Region
5 Market Overview (Page No. - 38)
5.1 Introduction
5.2 Market Dynamics
5.2.1 Drivers
5.2.1.1 R&D and Technological Advancements
5.2.1.1.1 Increasing Prevalence of Food Encapsulation Technologies
5.2.1.1.2 Development of High Efficiency Equipment for Mixing Integrated Food Ingredients
5.2.1.2 Increasing Demand for Convenience and Processed Food
5.2.1.3 Nutrition & Taste Convergence
5.2.1.4 Growing Number of End-Use Applications
5.2.1.5 Increasing Demand for Natural Flavors and Fragrances
5.2.1.6 Multi-Functionality of Hydrocolloids Leads to Their Widespread Applications
5.2.2 Restraints
5.2.2.1 Raw Material Availability, Storage Management, and Lack of Infrastructure in Developing Countries
5.2.2.2 Higher Cost for Developing Innovative Integrated Food Products
5.2.3 Opportunities
5.2.3.1 Tapping the Markets in Emerging Economies
5.2.3.2 Growing Demand for Clean Label Products in Developed Economies
5.2.3.3 Growing Trends in Functional Flavors
5.2.4 Challenges
5.2.4.1 Food Safety Concerns & Regulations
5.2.4.2 Complexities Related to the Integration and Adulteration of Integrated Food Ingredients
6 Regulations (Page No. - 47)
6.1 Regulations for Preservatives
6.1.1 US: Food and Drug Administration (FDA)
6.1.2 European Union: European Food Safety Authority (EFSA)
6.1.3 The Codex Alimentarius Commission (CAC)
6.2 Regulations for Functional Food Ingredients
6.2.1 Canada
6.2.1.1 Food and Drug Regulations (FDR)
6.2.2 Us
6.2.2.1 Food Safety Modernization Act (FSMA)
6.2.2.2 Food and Drug Administration (FDA)
6.2.3 European Union
6.2.4 Japan
6.2.4.1 Foods With Nutrient Function Claims (FNFC) & Foods for Specified Health Uses (FOSHU)
6.2.5 India
6.2.5.1 Ministry of Health and Family Welfare
6.2.6 Australia & New Zealand
6.2.6.1 Food Standards Australia New Zealand (FSANZ)
6.2.7 Brazil
6.2.7.1 National Health Surveillance Agency (ANVISA)
7 Integrated Food Ingredients Market, By Function (Page No. - 49)
7.1 Introduction
7.2 Taste Enhancers
7.3 Form
7.4 Texture
7.5 Preservation
7.6 Coloring
8 Integrated Food Ingredients Market, By Integrated Solutions (Page No. - 56)
8.1 Introduction
8.2 Beverages
8.2.1 Integrated Food Ingredients: Beverages
8.2.1.1 Concentrates (Juice)
8.2.1.2 Sweeteners
8.2.1.3 Flavors
8.2.1.4 Colors
8.2.1.5 Preservatives
8.2.1.6 Emulsifiers
8.2.1.7 Acidulants
8.2.2 By Application
8.2.2.1 Liquid Key Mixes
8.2.2.2 Juice-Based Compounds (JBCS)
8.2.2.3 Dry Key Mixes
8.2.2.4 Others
8.3 Snacks & Savories
8.3.1 Integrated Food Ingredients: Snacks and Savories
8.3.1.1 Flavors
8.3.1.2 Preservatives
8.3.1.3 Fats & Oils
8.3.1.4 Sweeteners
8.3.2 By Application
8.3.2.1 Sauces, Dressings & Condiments (SDC)
8.3.2.2 Soups & Bouillon
8.3.2.3 Others
8.4 Dairy
8.4.1 Integrated Food Ingredients: Dairy
8.4.1.1 Concentrate (Milk)
8.4.1.2 Sweeteners
8.4.1.3 Flavors
8.4.1.4 Starch
8.4.1.5 Acidulants
8.5 Meat Products
8.5.1 Integrated Food Ingredients: Meat Products
8.5.1.1 Binders
8.5.1.2 Emulsifiers
8.5.1.3 Preservatives
8.5.1.4 Colors
8.5.1.5 Flavors
8.5.1.6 Salts
8.5.2 By Application
8.5.2.1 Processed Meat
8.5.2.2 Processed Seafood
8.6 Bakery & Confectionery
8.6.1 Integrated Food Ingredients: Bakery & Confectionery
8.6.1.1 Flavors
8.6.1.2 Hydrocolloids
8.6.1.3 Starch
9 Integrated Food Ingredients Market, By Region (Page No. - 84)
9.1 Introduction
9.2 North America
9.3 Europe
9.4 Asia Pacific
9.5 South America
9.6 Africa
10 Competitive Landscape (Page No. - 111)
10.1 Overview
10.2 Market Share
10.2.1 Key Market Strategies
10.3 Competitive Scenario
10.3.1 Expansions
10.3.2 Acquisitions
10.3.3 New Product Launches
10.3.4 Agreements, Partnerships, and Collaborations
11 Company Profiles (Page No. - 122)
(Business Overview, Products Offered, Recent Developments, SWOT Analysis, MnM View)*
11.1 Cargill
11.2 Archer Daniels Midland
11.3 Dowdupont
11.4 Associated British Foods
11.5 BASF
11.6 Kerry Group
11.7 DSM
11.8 Tate & Lyle
11.9 Symrise
11.10 International Flavors & Fragrances
11.11 Döhler
11.12 Firmenich Sa
11.13 Northwest Naturals (Tree Top, Inc.)
11.14 Gat Foods (The Central Bottling Company)
*Details on Business Overview, Products Offered, Recent Developments, SWOT Analysis, MnM View Might Not Be Captured in Case of Unlisted Companies.
12 Appendix (Page No. - 164)
12.1 Discussion Guide
12.2 Knowledge Store: Marketsandmarkets’ Subscription Portal
12.3 Available Customizations
12.4 Related Reports
12.5 Author Details
List of Tables (65 Tables)
Table 1 Currency Conversion
Table 2 Major Exporters of Processed Food (USD Billion)
Table 3 Integrated Food Ingredients Market Size, By Function, 2016–2023 (USD Billion)
Table 4 Taste Enhancers: Integrated Food Ingredients Market Size, By Region, 2016–2023 (USD Billion)
Table 5 Form: Integrated Food Ingredient Market Size, By Region, 2016–2023 (USD Billion)
Table 6 Texture: Integrated Food Ingredient Market Size, By Region, 2016–2023 (USD Billion)
Table 7 Preservation: Integrated Food Ingredients Market Size, By Region, 2016–2023 (USD Billion)
Table 8 Coloring: Integrated Food Ingredients Market Size, By Region, 2016–2023 (USD Billion)
Table 9 Integrated Food Ingredient Market Size, By Ingredient, 2016–2023 (USD Billion)
Table 10 Beverages: Integrated Food Ingredient Market Size, By Ingredient, 2016–2023 (USD Billion)
Table 11 Market Size, By Beverage Application, 2016–2023 (USD Billion)
Table 12 Liquid Key Mixes: Integrated Food Ingredient Market Size, By Region, 2016–2023 (USD Million)
Table 13 Juice-Based Compounds: Integrated Food Ingredient Market Size, By Region, 2016–2023 (USD Million)
Table 14 Dry Key Mixes: Integrated Food Ingredients Market Size, By Region, 2016–2023 (USD Million)
Table 15 Others: Market Size, By Region, 2016–2023 (USD Billion)
Table 16 Snacks & Savories: Market Size, By Ingredient, 2016–2023 (USD Million)
Table 17 Market Size, By Snacks & Savories Application, 2016–2023 (USD Billion)
Table 18 Sauces, Dressings & Condiments: Integrated Food Ingredient Market Size, By Region, 2016–2023 (USD Million)
Table 19 Soups & Bouillon: Integrated Food Ingredient Market Size, By Region, 2016–2023 (USD Million)
Table 20 Others: Integrated Food Ingredient Market Size, By Region, 2016–2023 (USD Million)
Table 21 Market Size in Dairy, By Ingredient, 2016–2023 (USD Million)
Table 22 Market Size in Meat Products, By Ingredient, 2016–2023 (USD Billion)
Table 23 Market Size in Meat Products, By Meat Products Application, 2016–2023 (USD Billion)
Table 24 Market Size in Processed Meat, By Region, 2016–2023 (USD Billion)
Table 25 Market Size in Processed Seafood, By Region, 2016–2023 (USD Billion)
Table 26 Bakery & Confectionery Integrated Food Ingredients Market Size, By Ingredient, 2016–2023 (USD Billion)
Table 27 Market Size, By Region, 2016–2023 (USD Billion)
Table 28 North America: Integrated Food Ingredients Market Size, By Function, 2016–2023 (USD Billion)
Table 29 North America: Market Size, By Application, 2016–2023 (USD Billion)
Table 30 North America: Market Size for Beverages, By Ingredient, 2016–2023 (USD Million)
Table 31 North America: Market Size for Snacks & Savories, By Ingredient, 2016–2023 (USD Million)
Table 32 North America: Market Size for Dairy, By Ingredient, 2016–2023 (USD Million)
Table 33 North America: Market Size for Bakery & Confectionery, By Ingredient, 2016–2023 (USD Million)
Table 34 North America: Market Size for Meat Products, By Ingredient, 2016–2023 (USD Million)
Table 35 Europe: Integrated Food Ingredients Market Size, By Function, 2016–2023 (USD Billion)
Table 36 Europe: Market Size, By Application, 2016–2023 (USD Billion)
Table 37 Europe: Market Size in Beverages, By Ingredient, 2016–2023 (USD Million)
Table 38 Europe: Market Size in Snacks & Savories, By Ingredient, 2016–2023 (USD Million)
Table 39 Europe: Market Size in Dairy, By Ingredient, 2016–2023 (USD Million)
Table 40 Europe: Market Size in Bakery & Confectionery, By Ingredient, 2016–2023 (USD Million)
Table 41 Europe: Market Size in Meat Products, By Ingredient, 2016–2023 (USD Million)
Table 42 Asia Pacific: Integrated Food Ingredients Market Size, By Application, 2016–2023 (USD Billion)
Table 43 Asia Pacific: Market Size in Beverages, By Ingredient, 2016–2023 (USD Million)
Table 44 Asia Pacific: Market Size in Snacks & Savories, By Ingredient, 2016–2023 (USD Million)
Table 45 Asia Pacific: Market Size in Dairy, By Ingredient, 2016–2023 (USD Million)
Table 46 Asia Pacific: Market Size in Bakery & Confectionery, By Ingredient, 2016–2023 (USD Million)
Table 47 Asia Pacific: Market Size in Meat Products, By Ingredient, 2016–2023 (USD Million)
Table 48 South America: Market Size, By Function, 2016–2023 (USD Billion)
Table 49 South America: Market Size, By Application, 2016–2023 (USD Billion)
Table 50 South America: Market Size for Beverages, By Ingredient, 2016–2023 (USD Million)
Table 51 South America: Market Size for Snacks & Savories, By Ingredient, 2016–2023 (USD Million)
Table 52 South America: Market Size for Dairy, By Ingredient, 2016–2023 (USD Million)
Table 53 South America: Market Size for Bakery & Confectionery, By Ingredient, 2016–2023 (USD Million)
Table 54 South America: Market Size for Meat Products, By Ingredient, 2016–2023 (USD Million)
Table 55 Africa: Market Size, By Function, 2016–2023 (USD Billion)
Table 56 Africa: Market Size, By Application, 2016–2023 (USD Billion)
Table 57 Africa: Market Size for Beverages, By Ingredient, 2016–2023 (USD Million)
Table 58 Africa: Market Size for Snacks & Savories, By Ingredient, 2016–2023 (USD Million)
Table 59 Africa: Market Size for Dairy, By Ingredient, 2016–2023 (USD Million)
Table 60 Africa: Market Size for Bakery & Confectionery, By Ingredient, 2016–2023 (USD Million)
Table 61 Africa: Market Size for Meat Products, By Ingredient, 2016–2023 (USD Million)
Table 62 Expansions, 2014–2018
Table 63 Acquisitions, 2014–2018
Table 64 New Product Launches, 2014–2018
Table 65 Agreements, Partnerships and Collaborations, 2014–2018
List of Figures (47 Figures)
Figure 1 Market Segmentation
Figure 2 Integrated Food Ingredients Market: Ingredients Considered
Figure 3 Market: Regional Scope
Figure 4 Market: Research Design
Figure 5 Breakdown of Primary Interviews: By Company Type, Designation, and Region
Figure 6 Market Size Estimation: Bottom-Up Approach
Figure 7 Market Size Estimation Methodology: Top-Down Approach
Figure 8 Data Triangulation
Figure 9 Market Snapshot For Integrated Food Ingredients, By Function, 2018 vs 2023 (USD Billion)
Figure 10 Market Size For Integrated Food Ingredients, By Ingredient, 2018 vs 2023 (USD Billion)
Figure 11 Market Share (Value) For Integrated Food Ingredients, By Region, 2018
Figure 12 Strategies Adopted By Key Players in the Integrated Food Ingredient Market: A Snapshot
Figure 13 Rise in Disposable Income and Demand for Organic/Natural Food Products is Driving Growth of this Market
Figure 14 Taste Enhancers Accounted for the Largest Segment in the Asia Pacific Integrated Food Ingredient Market
Figure 15 Dry Key Mixes to Dominate the Market During the Forecast Period
Figure 16 Taste Enhancers Dominated the Integrated Food Ingredients Market Across All Regions in 2017
Figure 17 Flavors to Dominate the Integrated Food Ingredients Market Between 2018 and 2023
Figure 18 North America Accounted for the Largest Share of the Global Integrated Food Ingredient Market in 2017
Figure 19 Market Dynamics For Integrated Food Ingredients
Figure 20 Processed Food Exports From Canada to the US
Figure 21 Diverse Protein Food Formulators to Grow at A High Rate in the Near Future (Protein vs Percentage of Respondents)
Figure 22 Reported Frauds, By Ingredient Type
Figure 23 Preservation to Witness the Highest CAGR During the Forecast Period
Figure 24 Market For Integrated Food Ingredients, By Ingredient, 2018 vs 2023 (USD Billion)
Figure 25 Beverages: Integrated Food Ingredients Market, By Ingredient, 2018 vs 2023 (USD Billion)
Figure 26 Market For Integrated Food Ingredients, By Beverage Application, 2018 vs 2023 (USD Billion)
Figure 27 Market, By Snacks & Savories, 2018 vs 2023 (USD Billion)
Figure 28 Snacks & Savories: Integrated Food Ingredient Market, By Application, 2018 vs 2023 (USD Billion)
Figure 29 Market For Integrated Food Ingredients, By Dairy (USD Billion)
Figure 30 Market in Meat Products, By Application, 2018 vs 2023 (USD Billion)
Figure 31 Market in Processed Meat, By Application, 2018 vs 2023 (USD Billion)
Figure 32 Market, By Bakery & Confectionery (USD Billion)
Figure 33 Market Size, By Region, 2018 vs 2023 (USD Billion)
Figure 34 Asia Pacific: Market Snapshot
Figure 35 Key Developments of the Leading Players in the Integrated Food Ingredient Market for 2014–2018
Figure 36 Market Share of the Key Players in the Global Market, 2017
Figure 37 Integrated Food Ingredients Market Developments, By Growth Strategy, 2014–2018
Figure 38 Cargill: Company Snapshot
Figure 39 Archer Daniels Midland: Company Snapshot
Figure 40 Dowdupont: Company Snapshot
Figure 41 Associated British Foods: Company Snapshot
Figure 42 BASF: Company Snapshot
Figure 43 Kerry Group: Company Snapshot
Figure 44 DSM: Company Snapshot
Figure 45 Tate & Lyle: Company Snapshot
Figure 46 Symrise: Company Snapshot
Figure 47 International Flavors & Fragrances: Company Snapshot


Growth opportunities and latent adjacency in Integrated Food Ingredients Market