Recycled Terephthalic Acid Market

Report Code CH 9206
Published in Oct, 2024, By MarketsandMarkets™
Download PDF

Choose License Type

Buy Report Now Inquire Before Buying

Recycled Terephthalic Acid Market by Process (Hydrolysis, Pyrolysis), Application (Fiber, Films, Resins), End-Use Industry (Textiles, Automotive, Construction, Packaging) - Global Forecast to 2029

Overview

The global Recycled terephthalic acid (rTPA) market is valued at USD 2.34 billion in 2024 and is projected to reach USD 2.90 billion by 2029, growing at 4.4% cagr from 2024 to 2029. Recycled terephthalic acid, is derived chemically from a wide range of PET products, including bottles, textiles, and many other forms of packaging. It therefore represents the green alternative to virgin TPA which is traditionally produced from petrochemical sources.

This market is mainly driven by rising environmental awareness, coupled with the regulatory frameworks encouraging plastic recycling, and the growing shift towards sustainable materials across industries like textiles, packaging, construction, and automotive. Additionally, a large number of nationwide campaigns for waste reduction and sustainability and the corporate initiatives to achieve circular economy goals have been promoting Recycled terephthalic acid consumption. The use of recycled content also assists manufacturers in meeting environmental targets and attracts the attention of consumers looking for environment-friendly products.

Attractive Opportunities in the Recycled Terephthalic Acid (rTPA) Market

Asia Pacific

The market in Asia Pacific is expected to witness high growth during the forecast period due to increasing environmental regulations, rising awareness of recycled terephthalic acid from industries such as textiles, and packaging.

Recycled TPA enables production of biodegradable plastics and PET, driving sustainable chemical innovation and circular economy

Advances in chemical recycling technologies present an opportunity for producing high purity rTPA that is comparable to virgin TPA

The Asia Pacific recycled terephthalic acid market is expected to be worth USD 1.24 billion by 2029, growing at CAGR of 4.7% during the forecast period.

Challenges in current recycling technologies limit efficient processing of colored and blended plastics.

Global Recycled Terephthalic Acid (rTPA) Market Dynamics

DRIVER: Increasing focus on environmental sustainability and the need to reduce reliance on fossil resources

Environmental sustainability and a need to reduce fossil resources are some of the key drivers that are boosting demand for recycled terephthalic acid. Governments and consumers seek out solutions that are sustainable, aimed at combatting climate change and reducing the plastic waste footprint in the environment. Since virgin PET production largely depends on fossil-based raw material origin, such as crude oil, a shift to Recycled terephthalic acid would allow for a reduction in carbon emissions and increase resource efficiency. Many of these companies are embracing recycled terephthalic acid worldwide, such as those packaging-related, textile, and automotive sectors, due to their agreements with sustainability and possible campaigns worldwide.

It is adopted widely as it enables the implementation of circular economy applications, hence materials can be recycled instead of being sent to landfills or to the ocean. It helps businesses reduce non-renewable resources usage and minimize the environmental footprint. Rising regulations that increase usage of recycled content within the products, especially in Europe and North America, are also driving the usage of Recycled terephthalic acid. This is also because companies are using Recycled terephthalic acid based products to meet consumer demand for eco-friendly alternatives, as customers increasingly prefer brands with strong environmental commitments. Business now utilizes it as an alternative source since fossil resources will not be economically viable in the years ahead due to price volatility and environmental regulations.

RESTRAINT: High Capital Costs of Advanced Recycling Technologies Limit Scalability of Chemical Recycling Processes

The main constraint for the scale-up of chemical recycling processes is the high capital cost of such advanced recycling technologies, which restricts the growth of rTPA market. Chemical recycling breaks down post-consumer PET waste back to its original monomers in order to produce high purity rTPA which requires advanced equipment, high amounts of energy input, and specific infrastructures. Such facilities require a significant amount of the initial investment to be established and operational, and by this reason, even companies of small and medium size find it difficult to adopt the technologies at an industrial scale.

Furthermore, required maintenance and upgrading continuously raise the up costs for operation and decrease the economic viability of chemical recycling. Chemical recycling plants in addition have to comply with strict environmental norms that increase compliance costs. Permitting, safety requirements, and emissions control complicate the process and slow down the deployment of new plants. These financial and regulatory challenges discourage many manufacturers from investing in chemical recycling, thereby limiting availability of high-quality rTPA in the market. Disintegrated collection systems in most regions combined with difficulties in sorting contaminated waste also reduce the efficiency in chemical recycling, reducing the supply of rTPA.


OPPORTUNITY: Rising Demand for rPET in fashion and textiles presents opportunities for sustainable rTPA production

The demand for rPET in the fashion as well as in the textile industries opens tremendous opportunities towards sustainable production of rTPA. As most consumers are becoming environmentally conscious, brands opt for recycled polyester fibers from rTPA to meet sustainability goals. Most fashion houses, sportswear brands, and fast fashion companies have started adopting rPET fabrics as a response to the need to curb the carbon footprint. This conversion supports a circular economy by rejuvenating post-consumer PET waste to become high-quality fibers used in textiles for clothing, shoes, and home furnishings.

The fashion industry also responds to regulatory pressures by encouraging regions like the European Union to use recycled content in textiles, thereby reducing plastic waste and promoting resource efficiency. Leading brands are setting public commitments to increase the proportion of recycled material in their collections, and thus are further accelerating demand for rTPA-based rPET fibers. Textile manufacturers are subsequently looking for reliable sources of rTPA in order to make sustainable polyester yarns that do not compromise durability, comfort, and performance of the fabrics. Furthermore, the collaboration between the fashion businesses and recycling industries may also enable these industries to establish closed-loop systems, thereby ensuring successful collection, recycling, and reuse of PET-based products.

CHALLENGES: Challenges in Current Recycling Technologies Limit Efficient Processing of Coloured and blended PET Plastics

Current recycling technologies face challenges in the efficient processing of coloured and blended PET plastics. Consequently, coloured and mixed PETs are an important barrier to the growth of the rTPA market. Mechanical recycling techniques work efficiently for clear PET but face challenges with the coloured and mixed plastics since dyes and additives normally degrade the quality of the recycled product. In any case, such impurities in rPET may affect its transparency and properties; the possibility of applicability in certain industries might be affected, where high-purity grade products are required, like food packaging or technical textile applications. In other words, the colored PET waste is mostly downcycled into lower-value products or ends up in a landfill and decreases feedstock availability for the production of high-quality rTPA. These materials cannot easily be separated with current technologies, so recovery of pure PET for conversion into rTPA is a challenging process. Chemical recycling methods, which can cleave PET to its monomers regardless of color or blend, look very promising but are still costly and difficult to scale. High operation costs and energy consumption in chemical recycling make chemical recycling not economically feasible for many recycling facilities, thereby limiting the availability of rTPA generated from these complex waste streams.

Global Recycled Terephthalic Acid (rTPA) Market Ecosystem Analysis

Prominent companies in this market include well-established, financially stable manufacturers of the Recycled terephthalic acid (rTPA) market. The profiled companies have been operating in the market for several years and possess a diversified product portfolio and strong global sales and marketing networks. Analyzing the ecosystem reveals how many entities collaborate or compete to address the worldwide issue of microplastic contamination. The value of ecosystem analysis in the Recycled terephthalic acid (rTPA) market is its ability to uncover essential relationships among key stakeholders. It identifies the variables driving technological innovation, regulatory pressures, and market demand.


Pyrolysis to be the fastest growing process segment of Recycled terephthalic acid (rTPA) market during forecast period

The pyrolysis segment is the fastest growing in the rTPA market because it can process contaminated and mixed PET waste that could not be processed economically by conventional recycling processes. Furthermore, with increasing global efforts to reduce plastic waste, various industries and governments are opting for pyrolysis to turn PET into valuable chemical feedstocks, including rTPA. This method is flexible since it accommodates mixed plastics with minimal sorting. The second reason pyrolysis is considered to be an attractive process is that it yields several byproducts, including oils and gases, which can be used as alternative fuels, thus making the process more economic. Pyrolysis plants are also scalable and thus appealing to large recycling operators who are wanting to increase their capacity and thus, henceforth, meet regulatory mandates for recycling plastics. Technological advances catalyze this growth too since new pyrolysis systems can offer advantages over others, depending on energy efficiency, emissions reduction, and better control of output. The investments in the pyrolysis-based recycling facilities have increased as global awareness on plastic pollution grows. Companies are now looking for partnerships and collaborations for building large-scale PET-waste-processing pyrolysis plants, particularly in Asia, which is challenged with managing huge plastic volumes in the country.

Fiber to be fastest growing application segment during forecast period

The fastest-growing application in the rTPA market is the fiber segment. This is due to the growing demand for sustainable textiles and the shift towards circular fashion models. The fiber, obtained from rTPA, has become a new substitute for virgin polyester that contributes to a lesser environmental impact on the textile industry. Major fashion brands are incorporating rPET fibers in their product lines to meet consumers' needs for sustainable clothing as part of the global initiatives adopted toward sustainable development. The production of rPET fibers conserves natural resources since it avoids reliance on non-renewable resources such as petroleum-based raw material sources while reducing carbon emissions as compared to traditional materials.

On the other hand, demand from the fiber segment would also come from the growing pressure of regulations and the voluntary commitment of companies to use recycled content in their products. Government campaigns and pressure from environmental organizations are demanding circularity in fashion, which is encouraging both consumers and companies towards recycled textiles and fewer textile wastes. The other significant factor is the increased consumer awareness of microplastic pollution and environmental degradation. Because of this, brands are focusing on incorporating recycled rTPA as a responsible alternative.

Textile industry to be fastest growing end-use industry during forecast period

The fastest-growing segment in the rTPA market is the textile industry, driven by significant demand for sustainable fibers, as well as increasing awareness of environmental impacts by consumers and brands. rTPA fiber, textile material derived from PET, offers a sustainable alternative to virgin polymers. Fast-fashion and sportswear companies are being pressurized by regulatory frameworks and consumer demands for transparency and circularity to become more environmentally conscious.

Extended producer responsibility (EPS) schemes have further supported the recycled content utilization process, hence ensuring companies in this sector comply with rTPA requirements. This move toward global circular economy models requires recycling the discarded textiles and plastic wastes to produce new products and creating a feedback loop cycle that sustains demand for rTPA. Also, the rTPA has the benefit of reducing the carbon footprint of virgin polyester, thus enabling companies to achieve their set sustainability targets. The increasing trend of consumer behaviour toward eco-conscious purchasing, and regulatory measures becoming increasingly strict, is driving the demand for recycled polyester. Increasingly, the rTPA market for textile applications is expected to experience rapid growth, thus making it the fastest-growing end-use segment in the rTPA market.

Asia- Pacific to be the fastest growing region during forecast period

Asia-Pacific is the fastest growing region for recycled terephthalic acid, or rTPA, primarily due to strict environment regulations, growing corporate commitments to sustainability, rapid industrialization, and increasing investments in high-tech recycling technologies. Governments are enforcing stringent recycling mandates at both federal and state levels, which compels manufacturers to use rTPA in their products. Countries such as China, India, Indonesia, and Vietnam have been the major drivers for the exponentially rising textile and packaging sectors, thereby increasing the demand for sustainable polyester-based products, such as PET fibers and packaging.

Higher pressure on manufacturers for eco-friendly production are also driving up the need for rTPA as consumers become more conscious about using eco-friendly products. Multinational companies and local players are gradually switching over to recycled alternatives to meet global ESG standards in the textile and packaging industries. A strong emphasis on the development of innovative technology within the region is another factor that fuels growth in the rTPA market. Companies are significantly investing in chemical recycling technologies such as pyrolysis and hydrolysis to commercially scale up rTPA production. Large investments from private and public actors further strengthen prospects for rapid growth in the Asia-Pacifc rTPA market.

HIGHEST CAGR MARKET IN (2024-2029)
CHINA FASTEST GROWING MARKET IN THE REGION

Recent Developments of Recycled Terephthalic Acid (rTPA) Market

  • In May 2024, Plastipak Packaging, Inc. joined Kraft Heinz to change the packaging of KRAFT® Real Mayo and MIRACLE WHIP completely to rPET material.
  • In July 2023, ALPLA invested eight million euros in increasing recycling activities at the Radomsko, Poland facility by adding a third extrusion line.
  • Far Eastern New Century Corporation (FENC) recently completed the expansion of its green PET resin production facility, FE GREEN PET (M) SDN BHD, in Malacca, Malaysia in April 2023.
  • In January 2023, ALPLA inaugurated a new PET recycling plant in Târgu Mures, Romania, with Ecohelp and United Polymer Trading (UPT). The facility will annually recycle up to 18,000 tons of high-quality food-grade rPET from household waste.
  • In January 2023, Biffa strengthened its position within the recycled plastics market by signing an agreement with Esterform Packaging. The former will supply Esterform Packaging with recycled PET produced at the Seaham County Durham facility of Biffa which can recycle over two billion bottles yearly.
  • In January 2022, Plastipak increased its PET recycling capacity at the Bascharage, Luxembourg, facility by 136%
  • In June 2021, Indorama Ventures Public Company Limited completed the acquisition of CarbonLite Holdings' PET recycling facility in Texas to recycle over 3 billion PET plastic beverage bottles yearly.
  • In June 2021, Alpek, S.A.B. de C.V. acquired the state-of-the-art PET recycling and pelletization plant of CarbonLite Recycling LLC based in Pennsylvania for USD 96 million cash and debt-free.
  • In September 2020, Loop Industries and SUEZ announced a strategic partnership to set up the first Infinite Loop facility in Europe to manufacture 100% recycled infinitely recyclable PET plastic.
  • In September 2020, Biffa and Nestlé Waters UK collaborated to deliver 100% recycled polyethylene terephthalate (PET) bottles created exclusively from British recycled plastic.

Key Market Players

KEY PLAYERS IN THE RECYCLED TEREPHTHALIC ACID (RTPA) MARKET INCLUDE

Want to explore hidden markets that can drive new revenue in Recycled Terephthalic Acid Market?

Scope of the Report

Report Metric Details
Market size available for years 2021-2029
Base Year Considered 2023
Forecast period 2024-2029
Forecast units Value (USD Million/Billion)
Segments covered Process, application, end-use industry, and Region
Geographies covered Asia Pacific, North America, Europe, Middle East & Africa, and South America


Key Questions Addressed by the Report

Which factors influence the growth of the Recycled terephthalic acid (rTPA) market?
The growth of this market can be attributed to increasing concerns regarding plastic pollution and focus on environmental sustainability. The broadening use of Recycled terephthalic acid (rTPA) in packaging, textiles, and automotive ensures sustained demand, further fueling market growth.
Which key factors drive the Recycled terephthalic acid (rTPA) market?
Increasing focus on environmental sustainability, production of biodegradable plastics, economic incentives, and the emphasis on the circular economy.
Who are the major manufacturers?
Major market players Indorama Ventures Public Company Limited. (Thailand), Alpek S.A.B. de C.V. (Mexico), SUEZ (France), ALPLA (Austria), Unifi, Inc. (US), SK chemicals (South Korea), Krones AG (Germany), Far Eastern New Century Corporation (Taiwan), Biffa (England), and Plastipak Holdings, Inc. (US) among others.
What will be the growth prospects of the Recycled terephthalic acid (rTPA) market?
Rising demand in fashion and textiles, and advances in chemical recycling technologies, are further bolstering the market.
Which end-use industry has the largest market share in the Recycled terephthalic acid (rTPA) market?
Packaging end-use industry covers the largest market share.


Personalize This Research

  • Triangulate with your Own Data
  • Get Data as per your Format and Definition
  • Gain a Deeper Dive on a Specific Application, Geography, Customer or Competitor
  • Any level of Personalization
Request A Free Customisation

Let Us Help You

  • What are the Known and Unknown Adjacencies Impacting the Recycled Terephthalic Acid Market
  • What will your New Revenue Sources be?
  • Who will be your Top Customer; what will make them switch?
  • Defend your Market Share or Win Competitors
  • Get a Scorecard for Target Partners
Customized Workshop Request

Table of Contents

Exclusive indicates content/data unique to MarketsandMarkets and not available with any competitors.

TITLE
PAGE NO
INTRODUCTION
25
RESEARCH METHODOLOGY
29
EXECUTIVE SUMMARY
40
PREMIUM INSIGHTS
44
MARKET OVERVIEW
46
  • 5.1 INTRODUCTION
  • 5.2 MARKET DYNAMICS
    DRIVERS
    - Increasing focus on environmental sustainability and need to reduce reliance on fossil resources
    - Recycled TPA enables production of biodegradable plastics and PET, driving sustainable chemical innovation and circular economy
    RESTRAINTS
    - High capital cost of advanced recycling technologies limits scalability of chemical recycling process
    - Absence of global standards for rTPA quality affects product performance
    OPPORTUNITIES
    - Rising demand for rPET in fashion and textile industries presents opportunities for sustainable rTPA production
    - Advances in chemical recycling technologies present opportunity for producing high-purity rTPA comparable to virgin TPA
    CHALLENGES
    - Challenges in current recycling technologies limit efficient processing of colored and blended plastics
  • 5.3 GENERATIVE AI
    INTRODUCTION
  • 5.4 IMPACT OF GENERATIVE AI ON RECYCLED TEREPHTHALIC ACID MARKET
INDUSTRY TRENDS
52
  • 6.1 INTRODUCTION
  • 6.2 TRENDS/DISRUPTIONS IMPACTING CUSTOMER BUSINESS
  • 6.3 SUPPLY CHAIN ANALYSIS
  • 6.4 INVESTMENT AND FUNDING SCENARIO
  • 6.5 PRICING ANALYSIS
    AVERAGE SELLING PRICE TREND, BY REGION
    AVERAGE SELLING PRICE TREND, BY PROCESS
    AVERAGE SELLING PRICE TREND OF KEY PLAYERS, BY PROCESS
  • 6.6 ECOSYSTEM ANALYSIS
  • 6.7 TECHNOLOGY ANALYSIS
    KEY TECHNOLOGIES
    COMPLEMENTARY TECHNOLOGIES
    ADJACENT TECHNOLOGIES
  • 6.8 PATENT ANALYSIS
    METHODOLOGY
    GRANTED PATENTS
    - Patent publication trends
    INSIGHTS
    LEGAL STATUS
    JURISDICTION ANALYSIS
    TOP APPLICANTS
  • 6.9 TRADE ANALYSIS
    IMPORT SCENARIO (HS CODES 2917360)
    EXPORT SCENARIO (HS CODES 2917360)
  • 6.10 KEY CONFERENCES AND EVENTS, 2024–2025
  • 6.11 TARIFFS, STANDARDS, AND REGULATORY LANDSCAPE
    TARIFF ANALYSIS
    REGULATORY BODIES, GOVERNMENT AGENCIES, AND OTHER ORGANIZATIONS
    STANDARDS
  • 6.12 PORTER’S FIVE FORCES ANALYSIS
    THREAT OF NEW ENTRANTS
    THREAT OF SUBSTITUTES
    BARGAINING POWER OF SUPPLIERS
    BARGAINING POWER OF BUYERS
    INTENSITY OF COMPETITIVE RIVALRY
  • 6.13 KEY STAKEHOLDERS AND BUYING CRITERIA
    KEY STAKEHOLDERS IN BUYING PROCESS
    BUYING CRITERIA
  • 6.14 MACROECONOMIC OUTLOOK
    GDP TRENDS AND FORECASTS, BY COUNTRY
  • 6.15 CASE STUDY ANALYSIS
    CASE STUDY 1: CHARACTERIZATION OF TEREPHTHALIC ACID MONOMER RECYCLED FROM POST-CONSUMER PET POLYMER BOTTLES
    CASE STUDY 2: ACIDIC HYDROLYSIS OF RECYCLED POLYETHYLENE TEREPHTHALATE PLASTIC FOR PRODUCTION OF MONOMER TEREPHTHALIC ACID
RECYCLED TEREPHTHALIC ACID MARKET, BY PROCESS
81
  • 7.1 INTRODUCTION
  • 7.2 HYDROLYSIS
    ADVANCEMENTS IN TECHNOLOGY FOR EFFICIENT AND SUSTAINABLE RECOVERY OF TEREPHTHALIC ACID FROM PET WASTE TO PROPEL MARKET
  • 7.3 PYROLYSIS
    ENABLES EFFECTIVE RECYCLING OF MIXED AND CONTAMINATED PET
  • 7.4 OTHER PROCESSES
    GLYCOLYSIS
    ACETOLYSIS
RECYCLED TEREPHTHALIC ACID MARKET, BY APPLICATION
86
  • 8.1 INTRODUCTION
  • 8.2 FIBERS
    APPLICATION IN SUSTAINABLE POLYESTER FIBER PRODUCTION FOR TEXTILES AND INDUSTRIAL USES TO DRIVE MARKET
  • 8.3 RESINS
    UTILIZATION OF RTPA IN SUSTAINABLE POLYESTER RESIN PRODUCTION ACROSS MULTIPLE INDUSTRIES TO PROPEL MARKET
  • 8.4 FILMS
    UTILIZATION OF RTPA IN HIGH-PERFORMANCE FILM PRODUCTION TO SUPPORT MARKET GROWTH
  • 8.5 OTHER APPLICATIONS
    SHEETS
    BOTTLES
RECYCLED TEREPHTHALIC ACID MARKET, BY END-USE INDUSTRY
91
  • 9.1 INTRODUCTION
  • 9.2 TEXTILE
    NEED FOR SUSTAINABILITY IN FASHION INDUSTRY TO DRIVE MARKET
  • 9.3 AUTOMOTIVE
    DEMAND FOR LIGHTWEIGHT MATERIALS AND IMPROVED VEHICLE PERFORMANCE TO PROPEL MARKET
  • 9.4 CONSTRUCTION
    RISING DEMAND FOR ECO-FRIENDLY CONSTRUCTION MATERIALS TO DRIVE MARKET
  • 9.5 PACKAGING
    DEMAND FOR SUSTAINABLE PACKAGING TO MINIMIZE PLASTIC WASTE
  • 9.6 OTHER END-USE INDUSTRIES
    CONSUMER GOODS
    ELECTRONICS
RECYCLED TEREPHTHALIC ACID MARKET, BY REGION
97
  • 10.1 INTRODUCTION
  • 10.2 ASIA PACIFIC
    CHINA
    - Increased regulatory requirements and public awareness of pollution and waste management to drive market
    JAPAN
    - Advanced waste management and recycling technologies to encourage use of rTPA
    INDIA
    - Large-scale polyester production amplifies need for rTPA
    SOUTH KOREA
    - Significant investment in R&D for high-quality materials to support market growth
    REST OF ASIA PACIFIC
  • 10.3 NORTH AMERICA
    US
    - Increasing demand for eco-friendly plastic bottles to propel market
    CANADA
    - Government mandates for plastic recycling encourage adoption of rTPA in food & beverage packaging
    MEXICO
    - Government initiatives aimed at promoting recycling and sustainability to propel market
  • 10.4 EUROPE
    GERMANY
    - Strong recycling infrastructure and EU regulations enforcing rTPA use to support market growth
    ITALY
    - Large fashion and textile industries to drive market
    FRANCE
    - Large-scale investments in circular economy practices to reduce plastic waste
    UK
    - Strong regulatory frameworks to curb plastic pollution to drive use of rTPA
    SPAIN
    - Adoption of sustainable construction products incorporating rTPA for energy-efficient buildings to propel market
    RUSSIA
    - Growing market for sustainable, high-performance consumer goods materials to drive market
    REST OF EUROPE
  • 10.5 MIDDLE EAST & AFRICA
    GCC COUNTRIES
    - Saudi Arabia
    - UAE
    - Rest of GCC countries
    SOUTH AFRICA
    - Growing use of rTPA in lightweight automotive components to fuel efficiency regulations
    REST OF MIDDLE EAST & AFRICA
  • 10.6 SOUTH AMERICA
    ARGENTINA
    - National campaigns to reduce environmental impact to encourage adoption of recycled materials
    BRAZIL
    - Shift toward circular fashion and upcycled textile manufacturing for global brands to propel market
    REST OF SOUTH AMERICA
COMPETITIVE LANDSCAPE
165
  • 11.1 INTRODUCTION
  • 11.2 KEY PLAYER STRATEGIES/RIGHT TO WIN
  • 11.3 MARKET SHARE ANALYSIS
  • 11.4 REVENUE ANALYSIS
  • 11.5 COMPANY EVALUATION MATRIX: KEY PLAYERS, 2023
    STARS
    EMERGING LEADERS
    PERVASIVE PLAYERS
    PARTICIPANTS
    COMPANY FOOTPRINT: KEY PLAYERS, 2023
    - Company footprint
    - Process footprint
    - Application footprint
    - End-use industry footprint
    - Region footprint
  • 11.6 COMPANY EVALUATION MATRIX: STARTUPS/SMES, 2023
    PROGRESSIVE COMPANIES
    RESPONSIVE COMPANIES
    DYNAMIC COMPANIES
    STARTING BLOCKS
    COMPETITIVE BENCHMARKING: STARTUPS/SMES, 2023
    - Detailed list of key startups/SMEs
    - Competitive benchmarking of key startups/SMEs
  • 11.7 BRAND/PRODUCT COMPARATIVE ANALYSIS
  • 11.8 COMPANY VALUATION AND FINANCIAL METRICS
    COMPANY VALUATION
    FINANCIAL METRICS
  • 11.9 COMPETITIVE SCENARIO
    DEALS
    EXPANSIONS
COMPANY PROFILES
186
  • 12.1 KEY PLAYERS
    INDORAMA VENTURES PUBLIC COMPANY LIMITED
    - Business overview
    - Products offered
    - Recent developments
    - MnM view
    ALPEK S.A.B. DE C.V.
    - Business overview
    - Products offered
    - Recent developments
    - MnM view
    SUEZ
    - Business overview
    - Products offered
    - Recent developments
    - MnM view
    ALPLA
    - Business overview
    - Products offered
    - Recent developments
    - MnM view
    UNIFI, INC.
    - Business overview
    - Products offered
    - MnM view
    SK CHEMICALS
    - Business overview
    - Products offered
    - Recent developments
    - MnM view
    FAR EASTERN NEW CENTURY CORPORATION
    - Business overview
    - Products offered
    - Recent developments
    - MnM view
    BIFFA
    - Business overview
    - Products offered
    - Recent developments
    - MnM view
    PLASTIPAK HOLDINGS, INC.
    - Business overview
    - Products offered
    - Recent developments
    - MnM view
    VISY
    - Business overview
    - Products offered
    - MnM view
  • 12.2 OTHER PLAYERS
    MARGLEN INDUSTRIES
    CARBIOS
    POLYQUEST, INC.
    EVERGREEN
    DEPOLY
    REVALYU RESOURCES GMBH
    EKOPET
    LOOP INDUSTRIES, INC.
    TERRACLE
    INTCO
    GOREWISE
APPENDIX
229
  • 13.1 DISCUSSION GUIDE
  • 13.2 KNOWLEDGESTORE: MARKETSANDMARKETS’ SUBSCRIPTION PORTAL
  • 13.3 CUSTOMIZATION OPTIONS
  • 13.4 RELATED REPORTS
  • 13.5 AUTHOR DETAILS
LIST OF TABLES
 
  • TABLE 1 AVERAGE SELLING PRICE TREND OF RECYCLED TEREPHTHALIC ACID, BY REGION, 2021–2023 (USD/TON)
  • TABLE 2 AVERAGE SELLING PRICE TREND OF RECYCLED TEREPHTHALIC ACID, BY PROCESS, 2020–2023 (USD/TON)
  • TABLE 3 AVERAGE SELLING PRICE TREND OF RECYCLED TEREPHTHALIC ACID PROCESSES, BY KEY PLAYER, 2023 (USD/TON)
  • TABLE 4 RECYCLED TEREPHTHALIC ACID MARKET: ROLE OF COMPANIES IN ECOSYSTEM
  • TABLE 5 RECYCLED TEREPHTHALIC ACID MARKET: KEY TECHNOLOGIES
  • TABLE 6 RECYCLED TEREPHTHALIC ACID MARKET: COMPLEMENTARY TECHNOLOGIES
  • TABLE 7 RECYCLED TEREPHTHALIC ACID MARKET: ADJACENT TECHNOLOGIES
  • TABLE 8 TOTAL NUMBER OF PATENTS, 2013–2023
  • TABLE 9 TOP OWNERS OF PATENTS RELATED TO RECYCLED TEREPHTHALIC ACID, 2013–2023
  • TABLE 10 LIST OF KEY PATENTS RELATED TO RECYCLED TEREPHTHALIC ACID, 2013–2023
  • TABLE 11 RECYCLED TEREPHTHALIC ACID MARKET: LIST OF KEY CONFERENCES AND EVENTS, 2024–2025
  • TABLE 12 TARIFF DATA RELATED TO HS CODE 29173600-COMPLIANT PRODUCTS, BY COUNTRY, 2023
  • TABLE 13 NORTH AMERICA: REGULATORY BODIES, GOVERNMENT AGENCIES, AND OTHER ORGANIZATIONS
  • TABLE 14 EUROPE: REGULATORY BODIES, GOVERNMENT AGENCIES, AND OTHER ORGANIZATIONS
  • TABLE 15 ASIA PACIFIC: REGULATORY BODIES, GOVERNMENT AGENCIES, AND OTHER ORGANIZATIONS
  • TABLE 16 MIDDLE EAST & AFRICA: REGULATORY BODIES, GOVERNMENT AGENCIES, AND OTHER ORGANIZATIONS
  • TABLE 17 SOUTH AMERICA: REGULATORY BODIES, GOVERNMENT AGENCIES, AND OTHER ORGANIZATIONS
  • TABLE 18 STANDARDS AND REGULATIONS FOR PLAYERS IN RECYCLED TEREPHTHALIC ACID MARKET
  • TABLE 19 IMPACT OF PORTER’S FIVE FORCES ON RECYCLED TEREPHTHALIC ACID MARKET
  • TABLE 20 INFLUENCE OF STAKEHOLDERS ON BUYING PROCESS, BY END-USE INDUSTRY (%)
  • TABLE 21 KEY BUYING CRITERIA, BY END-USE INDUSTRY
  • TABLE 22 GDP TRENDS AND FORECASTS, BY COUNTRY, 2023–2025 (USD MILLION)
  • TABLE 23 RECYCLED TEREPHTHALIC ACID MARKET, BY PROCESS, 2021–2023 (USD MILLION)
  • TABLE 24 RECYCLED TEREPHTHALIC ACID MARKET, BY PROCESS, 2024–2029 (USD MILLION)
  • TABLE 25 RECYCLED TEREPHTHALIC ACID MARKET, BY PROCESS, 2021–2023 (TON)
  • TABLE 26 RECYCLED TEREPHTHALIC ACID MARKET, BY PROCESS, 2024–2029 (TON)
  • TABLE 27 RECYCLED TEREPHTHALIC ACID MARKET, BY APPLICATION, 2021–2023 (USD MILLION)
  • TABLE 28 RECYCLED TEREPHTHALIC ACID MARKET, BY APPLICATION, 2024–2029 (USD MILLION)
  • TABLE 29 RECYCLED TEREPHTHALIC ACID MARKET, BY END-USE INDUSTRY, 2021–2023 (USD MILLION)
  • TABLE 30 RECYCLED TEREPHTHALIC ACID MARKET, BY END-USE INDUSTRY, 2024–2029 (USD MILLION)
  • TABLE 31 RECYCLED TEREPHTHALIC ACID MARKET, BY END-USE INDUSTRY, 2021–2023 (TON)
  • TABLE 32 RECYCLED TEREPHTHALIC ACID MARKET, BY END-USE INDUSTRY, 2024–2029 (TON)
  • TABLE 33 RECYCLED TEREPHTHALIC ACID MARKET, BY REGION, 2021–2023 (USD MILLION)
  • TABLE 34 RECYCLED TEREPHTHALIC ACID MARKET, BY REGION, 2024–2029 (USD MILLION)
  • TABLE 35 RECYCLED TEREPHTHALIC ACID MARKET, BY REGION, 2021–2023 (TON)
  • TABLE 36 RECYCLED TEREPHTHALIC ACID MARKET, BY REGION, 2024–2029 (TON)
  • TABLE 37 ASIA PACIFIC: RECYCLED TEREPHTHALIC ACID MARKET, BY COUNTRY, 2021–2023 (USD MILLION)
  • TABLE 38 ASIA PACIFIC: RECYCLED TEREPHTHALIC ACID MARKET, BY COUNTRY, 2024–2029 (USD MILLION)
  • TABLE 39 ASIA PACIFIC: RECYCLED TEREPHTHALIC ACID MARKET, BY COUNTRY, 2021–2023 (TON)
  • TABLE 40 ASIA PACIFIC: RECYCLED TEREPHTHALIC ACID MARKET, BY COUNTRY, 2024–2029 (TON)
  • TABLE 41 ASIA PACIFIC: RECYCLED TEREPHTHALIC ACID MARKET, BY PROCESS, 2021–2023 (USD MILLION)
  • TABLE 42 ASIA PACIFIC: RECYCLED TEREPHTHALIC ACID MARKET, BY PROCESS, 2024–2029 (USD MILLION)
  • TABLE 43 ASIA PACIFIC: RECYCLED TEREPHTHALIC ACID MARKET, BY PROCESS, 2021–2023 (TON)
  • TABLE 44 ASIA PACIFIC: RECYCLED TEREPHTHALIC ACID MARKET, BY PROCESS, 2024–2029 (TON)
  • TABLE 45 ASIA PACIFIC: RECYCLED TEREPHTHALIC ACID MARKET, APPLICATION, 2021–2023 (USD MILLION)
  • TABLE 46 ASIA PACIFIC: RECYCLED TEREPHTHALIC ACID MARKET, BY APPLICATION, 2024–2029 (USD MILLION)
  • TABLE 47 ASIA PACIFIC: RECYCLED TEREPHTHALIC ACID MARKET, BY END-USE INDUSTRY, 2021–2023 (USD MILLION)
  • TABLE 48 ASIA PACIFIC: RECYCLED TEREPHTHALIC ACID MARKET, BY END-USE INDUSTRY, 2024–2029 (USD MILLION)
  • TABLE 49 ASIA PACIFIC: RECYCLED TEREPHTHALIC ACID MARKET, BY END-USE INDUSTRY, 2021–2023 (TON)
  • TABLE 50 ASIA PACIFIC: RECYCLED TEREPHTHALIC ACID MARKET, BY END-USE INDUSTRY, 2024–2029 (TON)
  • TABLE 51 CHINA: RECYCLED TEREPHTHALIC ACID MARKET, BY END-USE INDUSTRY, 2021–2023 (USD MILLION)
  • TABLE 52 CHINA: RECYCLED TEREPHTHALIC ACID MARKET, BY END-USE INDUSTRY, 2024–2029 (USD MILLION)
  • TABLE 53 CHINA: RECYCLED TEREPHTHALIC ACID MARKET, BY END-USE INDUSTRY, 2021–2023 (TON)
  • TABLE 54 CHINA: RECYCLED TEREPHTHALIC ACID MARKET, BY END-USE INDUSTRY, 2024–2029 (TON)
  • TABLE 55 JAPAN: RECYCLED TEREPHTHALIC ACID MARKET, BY END-USE INDUSTRY, 2021–2023 (USD MILLION)
  • TABLE 56 JAPAN: RECYCLED TEREPHTHALIC ACID MARKET, BY END-USE INDUSTRY, 2024–2029 (USD MILLION)
  • TABLE 57 JAPAN: RECYCLED TEREPHTHALIC ACID MARKET, BY END-USE INDUSTRY, 2021–2023 (TON)
  • TABLE 58 JAPAN: RECYCLED TEREPHTHALIC ACID MARKET, BY END-USE INDUSTRY, 2024–2029 (TON)
  • TABLE 59 INDIA: RECYCLED TEREPHTHALIC ACID MARKET, BY END-USE INDUSTRY, 2021–2023 (USD MILLION)
  • TABLE 60 INDIA: RECYCLED TEREPHTHALIC ACID MARKET, BY END-USE INDUSTRY, 2024–2029 (USD MILLION)
  • TABLE 61 INDIA: RECYCLED TEREPHTHALIC ACID MARKET, BY END-USE INDUSTRY, 2021–2023 (TON)
  • TABLE 62 INDIA: RECYCLED TEREPHTHALIC ACID MARKET, BY END-USE INDUSTRY, 2024–2029 (TON)
  • TABLE 63 SOUTH KOREA: RECYCLED TEREPHTHALIC ACID MARKET, BY END-USE INDUSTRY, 2021–2023 (USD MILLION)
  • TABLE 64 SOUTH KOREA: RECYCLED TEREPHTHALIC ACID MARKET, BY END-USE INDUSTRY, 2024–2029 (USD MILLION)
  • TABLE 65 SOUTH KOREA: RECYCLED TEREPHTHALIC ACID MARKET, BY END-USE INDUSTRY, 2021–2023 (TON)
  • TABLE 66 SOUTH KOREA: RECYCLED TEREPHTHALIC ACID MARKET, BY END-USE INDUSTRY, 2024–2029 (TON)
  • TABLE 67 REST OF ASIA PACIFIC: RECYCLED TEREPHTHALIC ACID MARKET, BY END-USE INDUSTRY, 2021–2023 (USD MILLION)
  • TABLE 68 REST OF ASIA PACIFIC: RECYCLED TEREPHTHALIC ACID MARKET, BY END-USE INDUSTRY, 2024–2029 (USD MILLION)
  • TABLE 69 REST OF ASIA PACIFIC: RECYCLED TEREPHTHALIC ACID MARKET, BY END-USE INDUSTRY, 2021–2023 (TON)
  • TABLE 70 REST OF ASIA PACIFIC: RECYCLED TEREPHTHALIC ACID MARKET, BY END-USE INDUSTRY, 2024–2029 (TON)
  • TABLE 71 NORTH AMERICA: RECYCLED TEREPHTHALIC ACID MARKET, BY COUNTRY, 2021–2023 (USD MILLION)
  • TABLE 72 NORTH AMERICA: RECYCLED TEREPHTHALIC ACID MARKET, BY COUNTRY, 2024–2029 (USD MILLION)
  • TABLE 73 NORTH AMERICA: RECYCLED TEREPHTHALIC ACID MARKET, BY COUNTRY, 2021–2023 (TON)
  • TABLE 74 NORTH AMERICA: RECYCLED TEREPHTHALIC ACID MARKET, BY COUNTRY, 2024–2029 (TON)
  • TABLE 75 NORTH AMERICA: RECYCLED TEREPHTHALIC ACID MARKET, BY PROCESS, 2021–2023 (USD MILLION)
  • TABLE 76 NORTH AMERICA: RECYCLED TEREPHTHALIC ACID MARKET, BY PROCESS, 2024–2029 (USD MILLION)
  • TABLE 77 NORTH AMERICA: RECYCLED TEREPHTHALIC ACID MARKET, BY PROCESS, 2021–2023 (TON)
  • TABLE 78 NORTH AMERICA: RECYCLED TEREPHTHALIC ACID MARKET, BY PROCESS, 2024–2029 (TON)
  • TABLE 79 NORTH AMERICA: RECYCLED TEREPHTHALIC ACID MARKET, BY APPLICATION, 2021–2023 (USD MILLION)
  • TABLE 80 NORTH AMERICA: RECYCLED TEREPHTHALIC ACID MARKET, BY APPLICATION, 2024–2029 (USD MILLION)
  • TABLE 81 NORTH AMERICA: RECYCLED TEREPHTHALIC ACID MARKET, BY END-USE INDUSTRY, 2021–2023 (USD MILLION)
  • TABLE 82 NORTH AMERICA: RECYCLED TEREPHTHALIC ACID MARKET, BY END-USE INDUSTRY, 2024–2029 (USD MILLION)
  • TABLE 83 NORTH AMERICA: RECYCLED TEREPHTHALIC ACID MARKET, BY END-USE INDUSTRY, 2021–2023 (TON)
  • TABLE 84 NORTH AMERICA: RECYCLED TEREPHTHALIC ACID MARKET, BY END-USE INDUSTRY, 2024–2029 (TON)
  • TABLE 85 US: RECYCLED TEREPHTHALIC ACID MARKET, BY END-USE INDUSTRY, 2021–2023 (USD MILLION)
  • TABLE 86 US: RECYCLED TEREPHTHALIC ACID MARKET, BY END-USE INDUSTRY, 2024–2029 (USD MILLION)
  • TABLE 87 US: RECYCLED TEREPHTHALIC ACID MARKET, BY END-USE INDUSTRY, 2021–2023 (TON)
  • TABLE 88 US: RECYCLED TEREPHTHALIC ACID MARKET, BY END-USE INDUSTRY, 2024–2029 (TON)
  • TABLE 89 CANADA: RECYCLED TEREPHTHALIC ACID MARKET, BY END-USE INDUSTRY, 2021–2023 (USD MILLION)
  • TABLE 90 CANADA: RECYCLED TEREPHTHALIC ACID MARKET, BY END-USE INDUSTRY, 2024–2029 (USD MILLION)
  • TABLE 91 CANADA: RECYCLED TEREPHTHALIC ACID MARKET, BY END-USE INDUSTRY, 2021–2023 (TON)
  • TABLE 92 CANADA: RECYCLED TEREPHTHALIC ACID MARKET, BY END-USE INDUSTRY, 2024–2029 (TON)
  • TABLE 93 MEXICO: RECYCLED TEREPHTHALIC ACID MARKET, BY END-USE INDUSTRY, 2021–2023 (USD MILLION)
  • TABLE 94 MEXICO: RECYCLED TEREPHTHALIC ACID MARKET, BY END-USE INDUSTRY, 2024–2029 (USD MILLION)
  • TABLE 95 MEXICO: RECYCLED TEREPHTHALIC ACID MARKET, BY END-USE INDUSTRY, 2021–2023 (TON)
  • TABLE 96 MEXICO: RECYCLED TEREPHTHALIC ACID MARKET, BY END-USE INDUSTRY, 2024–2029 (TON)
  • TABLE 97 EUROPE: RECYCLED TEREPHTHALIC ACID MARKET, BY COUNTRY, 2021–2023 (USD MILLION)
  • TABLE 98 EUROPE: RECYCLED TEREPHTHALIC ACID MARKET, BY COUNTRY, 2024–2029 (USD MILLION)
  • TABLE 99 EUROPE: RECYCLED TEREPHTHALIC ACID MARKET, BY COUNTRY, 2021–2023 (TON)
  • TABLE 100 EUROPE: RECYCLED TEREPHTHALIC ACID MARKET, BY COUNTRY, 2024–2029 (TON)
  • TABLE 101 EUROPE: RECYCLED TEREPHTHALIC ACID MARKET, BY PROCESS, 2021–2023 (USD MILLION)
  • TABLE 102 EUROPE: RECYCLED TEREPHTHALIC ACID MARKET, BY PROCESS, 2024–2029 (USD MILLION)
  • TABLE 103 EUROPE: RECYCLED TEREPHTHALIC ACID MARKET, BY PROCESS, 2021–2023 (TON)
  • TABLE 104 EUROPE: RECYCLED TEREPHTHALIC ACID MARKET, BY PROCESS, 2024–2029 (TON)
  • TABLE 105 EUROPE: RECYCLED TEREPHTHALIC ACID MARKET, BY APPLICATION, 2021–2023 (USD MILLION)
  • TABLE 106 EUROPE: RECYCLED TEREPHTHALIC ACID MARKET, BY APPLICATION, 2024–2029 (USD MILLION)
  • TABLE 107 EUROPE: RECYCLED TEREPHTHALIC ACID MARKET, BY END-USE INDUSTRY, 2021–2023 (USD MILLION)
  • TABLE 108 EUROPE: RECYCLED TEREPHTHALIC ACID MARKET, BY END-USE INDUSTRY, 2024–2029 (USD MILLION)
  • TABLE 109 EUROPE: RECYCLED TEREPHTHALIC ACID MARKET, BY END-USE INDUSTRY, 2021–2023 (TON)
  • TABLE 110 EUROPE: RECYCLED TEREPHTHALIC ACID MARKET, BY END-USE INDUSTRY, 2024–2029 (TON)
  • TABLE 111 GERMANY: RECYCLED TEREPHTHALIC ACID MARKET, BY END-USE INDUSTRY, 2021–2023 (USD MILLION)
  • TABLE 112 GERMANY: RECYCLED TEREPHTHALIC ACID MARKET, BY END-USE INDUSTRY, 2024–2029 (USD MILLION)
  • TABLE 113 GERMANY: RECYCLED TEREPHTHALIC ACID MARKET, BY END-USE INDUSTRY, 2021–2023 (TON)
  • TABLE 114 GERMANY: RECYCLED TEREPHTHALIC ACID MARKET, BY END-USE INDUSTRY, 2024–2029 (TON)
  • TABLE 115 ITALY: RECYCLED TEREPHTHALIC ACID MARKET, BY END-USE INDUSTRY, 2021–2023 (USD MILLION)
  • TABLE 116 ITALY: RECYCLED TEREPHTHALIC ACID MARKET, BY END-USE INDUSTRY, 2024–2029 (USD MILLION)
  • TABLE 117 ITALY: RECYCLED TEREPHTHALIC ACID MARKET, BY END-USE INDUSTRY, 2021–2023 (TON)
  • TABLE 118 ITALY: RECYCLED TEREPHTHALIC ACID MARKET, BY END-USE INDUSTRY, 2024–2029 (TON)
  • TABLE 119 FRANCE: RECYCLED TEREPHTHALIC ACID MARKET, BY END-USE INDUSTRY, 2021–2023 (USD MILLION)
  • TABLE 120 FRANCE: RECYCLED TEREPHTHALIC ACID MARKET, BY END-USE INDUSTRY, 2024–2029 (USD MILLION)
  • TABLE 121 FRANCE: RECYCLED TEREPHTHALIC ACID MARKET, BY END-USE INDUSTRY, 2021–2023 (TON)
  • TABLE 122 FRANCE: RECYCLED TEREPHTHALIC ACID MARKET, BY END-USE INDUSTRY, 2024–2029 (TON)
  • TABLE 123 UK: RECYCLED TEREPHTHALIC ACID MARKET, BY END-USE INDUSTRY, 2021–2023 (USD MILLION)
  • TABLE 124 UK: RECYCLED TEREPHTHALIC ACID MARKET, BY END-USE INDUSTRY, 2024–2029 (USD MILLION)
  • TABLE 125 UK: RECYCLED TEREPHTHALIC ACID MARKET, BY END-USE INDUSTRY, 2021–2023 (TON)
  • TABLE 126 UK: RECYCLED TEREPHTHALIC ACID MARKET, BY END-USE INDUSTRY, 2024–2029 (TON)
  • TABLE 127 SPAIN: RECYCLED TEREPHTHALIC ACID MARKET, BY END-USE INDUSTRY, 2021–2023 (USD MILLION)
  • TABLE 128 SPAIN: RECYCLED TEREPHTHALIC ACID MARKET, BY END-USE INDUSTRY, 2024–2029 (USD MILLION)
  • TABLE 129 SPAIN: RECYCLED TEREPHTHALIC ACID MARKET, BY END-USE INDUSTRY, 2021–2023 (TON)
  • TABLE 130 SPAIN: RECYCLED TEREPHTHALIC ACID MARKET, BY END-USE INDUSTRY, 2024–2029 (TON)
  • TABLE 131 RUSSIA: RECYCLED TEREPHTHALIC ACID MARKET, BY END-USE INDUSTRY, 2021–2023 (USD MILLION)
  • TABLE 132 RUSSIA: RECYCLED TEREPHTHALIC ACID MARKET, BY END-USE INDUSTRY, 2024–2029 (USD MILLION)
  • TABLE 133 RUSSIA: RECYCLED TEREPHTHALIC ACID MARKET, BY END-USE INDUSTRY, 2021–2023 (TON)
  • TABLE 134 RUSSIA: RECYCLED TEREPHTHALIC ACID MARKET, BY END-USE INDUSTRY, 2024–2029 (TON)
  • TABLE 135 REST OF EUROPE: RECYCLED TEREPHTHALIC ACID MARKET, BY END-USE INDUSTRY, 2021–2023 (USD MILLION)
  • TABLE 136 REST OF EUROPE: RECYCLED TEREPHTHALIC ACID MARKET, BY END-USE INDUSTRY, 2024–2029 (USD MILLION)
  • TABLE 137 REST OF EUROPE: RECYCLED TEREPHTHALIC ACID MARKET, BY END-USE INDUSTRY, 2021–2023 (TON)
  • TABLE 138 REST OF EUROPE: RECYCLED TEREPHTHALIC ACID MARKET, BY END-USE INDUSTRY, 2024–2029 (TON)
  • TABLE 139 MIDDLE EAST & AFRICA: RECYCLED TEREPHTHALIC ACID MARKET, BY COUNTRY, 2021–2023 (USD MILLION)
  • TABLE 140 MIDDLE EAST & AFRICA: RECYCLED TEREPHTHALIC ACID MARKET, BY COUNTRY, 2024–2029 (USD MILLION)
  • TABLE 141 MIDDLE EAST & AFRICA: RECYCLED TEREPHTHALIC ACID MARKET, BY COUNTRY, 2021–2023 (TON)
  • TABLE 142 MIDDLE EAST & AFRICA: RECYCLED TEREPHTHALIC ACID MARKET, BY COUNTRY, 2024–2029 (TON)
  • TABLE 143 MIDDLE EAST & AFRICA: RECYCLED TEREPHTHALIC ACID MARKET, BY PROCESS, 2021–2023 (USD MILLION)
  • TABLE 144 MIDDLE EAST & AFRICA: RECYCLED TEREPHTHALIC ACID MARKET, BY PROCESS, 2024–2029 (USD MILLION)
  • TABLE 145 MIDDLE EAST & AFRICA: RECYCLED TEREPHTHALIC ACID MARKET, BY PROCESS, 2021–2023 (TON)
  • TABLE 146 MIDDLE EAST & AFRICA: RECYCLED TEREPHTHALIC ACID MARKET, BY PROCESS, 2024–2029 (TON)
  • TABLE 147 MIDDLE EAST & AFRICA: RECYCLED TEREPHTHALIC ACID MARKET, BY APPLICATION, 2021–2023 (USD MILLION)
  • TABLE 148 MIDDLE EAST & AFRICA: RECYCLED TEREPHTHALIC ACID MARKET, BY APPLICATION, 2024–2029 (USD MILLION)
  • TABLE 149 MIDDLE EAST & AFRICA: RECYCLED TEREPHTHALIC ACID MARKET, BY END-USE INDUSTRY, 2021–2023 (USD MILLION)
  • TABLE 150 MIDDLE EAST & AFRICA: RECYCLED TEREPHTHALIC ACID MARKET, BY END-USE INDUSTRY, 2024–2029 (USD MILLION)
  • TABLE 151 MIDDLE EAST & AFRICA: RECYCLED TEREPHTHALIC ACID MARKET, BY END-USE INDUSTRY, 2021–2023 (TON)
  • TABLE 152 MIDDLE EAST & AFRICA: RECYCLED TEREPHTHALIC ACID MARKET, BY END-USE INDUSTRY, 2024–2029 (TON)
  • TABLE 153 SAUDI ARABIA: RECYCLED TEREPHTHALIC ACID MARKET, BY END-USE INDUSTRY, 2021–2023 (USD MILLION)
  • TABLE 154 SAUDI ARABIA: RECYCLED TEREPHTHALIC ACID MARKET, BY END-USE INDUSTRY, 2024–2029 (USD MILLION)
  • TABLE 155 SAUDI ARABIA: RECYCLED TEREPHTHALIC ACID MARKET, BY END-USE INDUSTRY, 2021–2023 (TON)
  • TABLE 156 SAUDI ARABIA: RECYCLED TEREPHTHALIC ACID MARKET, BY END-USE INDUSTRY, 2024–2029 (TON)
  • TABLE 157 UAE: RECYCLED TEREPHTHALIC ACID MARKET, BY END-USE INDUSTRY, 2021–2023 (USD MILLION)
  • TABLE 158 UAE: RECYCLED TEREPHTHALIC ACID MARKET, BY END-USE INDUSTRY, 2024–2029 (USD MILLION)
  • TABLE 159 UAE: RECYCLED TEREPHTHALIC ACID MARKET, BY END-USE INDUSTRY, 2021–2023 (TON)
  • TABLE 160 UAE: RECYCLED TEREPHTHALIC ACID MARKET, BY END-USE INDUSTRY, 2024–2029 (TON)
  • TABLE 161 REST OF GCC COUNTRIES: RECYCLED TEREPHTHALIC ACID MARKET, BY END-USE INDUSTRY, 2021–2023 (USD MILLION)
  • TABLE 162 REST OF GCC COUNTRIES: RECYCLED TEREPHTHALIC ACID MARKET, BY END-USE INDUSTRY, 2024–2029 (USD MILLION)
  • TABLE 163 REST OF GCC COUNTRIES: RECYCLED TEREPHTHALIC ACID MARKET, BY END-USE INDUSTRY, 2021–2023 (TON)
  • TABLE 164 REST OF GCC COUNTRIES: RECYCLED TEREPHTHALIC ACID MARKET, BY END-USE INDUSTRY, 2024–2029 (TON)
  • TABLE 165 SOUTH AFRICA: RECYCLED TEREPHTHALIC ACID MARKET, BY END-USE INDUSTRY, 2021–2023 (USD MILLION)
  • TABLE 166 SOUTH AFRICA: RECYCLED TEREPHTHALIC ACID MARKET, BY END-USE INDUSTRY, 2024–2029 (USD MILLION)
  • TABLE 167 SOUTH AFRICA: RECYCLED TEREPHTHALIC ACID MARKET, BY END-USE INDUSTRY, 2021–2023 (TON)
  • TABLE 168 SOUTH AFRICA: RECYCLED TEREPHTHALIC ACID MARKET, BY END-USE INDUSTRY, 2024–2029 (TON)
  • TABLE 169 REST OF MIDDLE EAST & AFRICA: RECYCLED TEREPHTHALIC ACID MARKET, BY END-USE INDUSTRY, 2021–2023 (USD MILLION)
  • TABLE 170 REST OF MIDDLE EAST & AFRICA: RECYCLED TEREPHTHALIC ACID MARKET, BY END-USE INDUSTRY, 2024–2029 (USD MILLION)
  • TABLE 171 REST OF MIDDLE EAST & AFRICA: RECYCLED TEREPHTHALIC ACID MARKET, BY END-USE INDUSTRY, 2021–2023 (TON)
  • TABLE 172 REST OF MIDDLE EAST & AFRICA: RECYCLED TEREPHTHALIC ACID MARKET, BY END-USE INDUSTRY, 2024–2029 (TON)
  • TABLE 173 SOUTH AMERICA: RECYCLED TEREPHTHALIC ACID MARKET, BY COUNTRY, 2021–2023 (USD MILLION)
  • TABLE 174 SOUTH AMERICA: RECYCLED TEREPHTHALIC ACID MARKET, BY COUNTRY, 2024–2029 (USD MILLION)
  • TABLE 175 SOUTH AMERICA: RECYCLED TEREPHTHALIC ACID MARKET, BY COUNTRY, 2021–2023 (TON)
  • TABLE 176 SOUTH AMERICA: RECYCLED TEREPHTHALIC ACID MARKET, BY COUNTRY, 2024–2029 (TON)
  • TABLE 177 SOUTH AMERICA: RECYCLED TEREPHTHALIC ACID MARKET, BY PROCESS, 2021–2023 (USD MILLION)
  • TABLE 178 SOUTH AMERICA: RECYCLED TEREPHTHALIC ACID MARKET, BY PROCESS, 2024–2029 (USD MILLION)
  • TABLE 179 SOUTH AMERICA: RECYCLED TEREPHTHALIC ACID MARKET, BY PROCESS, 2021–2023 (TON)
  • TABLE 180 SOUTH AMERICA: RECYCLED TEREPHTHALIC ACID MARKET, BY PROCESS, 2024–2029 (TON)
  • TABLE 181 SOUTH AMERICA: RECYCLED TEREPHTHALIC ACID MARKET, BY APPLICATION, 2021–2023 (USD MILLION)
  • TABLE 182 SOUTH AMERICA: RECYCLED TEREPHTHALIC ACID MARKET, BY APPLICATION, 2024–2029 (USD MILLION)
  • TABLE 183 SOUTH AMERICA: RECYCLED TEREPHTHALIC ACID MARKET, BY END-USE INDUSTRY, 2021–2023 (USD MILLION)
  • TABLE 184 SOUTH AMERICA: RECYCLED TEREPHTHALIC ACID MARKET, BY END-USE INDUSTRY, 2024–2029 (USD MILLION)
  • TABLE 185 SOUTH AMERICA: RECYCLED TEREPHTHALIC ACID MARKET, BY END-USE INDUSTRY, 2021–2023 (TON)
  • TABLE 186 SOUTH AMERICA: RECYCLED TEREPHTHALIC ACID MARKET, BY END-USE INDUSTRY, 2024–2029 (TON)
  • TABLE 187 ARGENTINA: RECYCLED TEREPHTHALIC ACID MARKET, BY END-USE INDUSTRY, 2021–2023 (USD MILLION)
  • TABLE 188 ARGENTINA: RECYCLED TEREPHTHALIC ACID MARKET, BY END-USE INDUSTRY, 2024–2029 (USD MILLION)
  • TABLE 189 ARGENTINA: RECYCLED TEREPHTHALIC ACID MARKET, BY END-USE INDUSTRY, 2021–2023 (TON)
  • TABLE 190 ARGENTINA: RECYCLED TEREPHTHALIC ACID MARKET, BY END-USE INDUSTRY, 2024–2029 (TON)
  • TABLE 191 BRAZIL: RECYCLED TEREPHTHALIC ACID MARKET, BY END-USE INDUSTRY, 2021–2023 (USD MILLION)
  • TABLE 192 BRAZIL: RECYCLED TEREPHTHALIC ACID MARKET, BY END-USE INDUSTRY, 2024–2029 (USD MILLION)
  • TABLE 193 BRAZIL: RECYCLED TEREPHTHALIC ACID MARKET, BY END-USE INDUSTRY, 2021–2023 (TON)
  • TABLE 194 BRAZIL: RECYCLED TEREPHTHALIC ACID MARKET, BY END-USE INDUSTRY, 2024–2029 (TON)
  • TABLE 195 REST OF SOUTH AMERICA: RECYCLED TEREPHTHALIC ACID MARKET, BY END-USE INDUSTRY, 2021–2023 (USD MILLION)
  • TABLE 196 REST OF SOUTH AMERICA: RECYCLED TEREPHTHALIC ACID MARKET, BY END-USE INDUSTRY, 2024–2029 (USD MILLION)
  • TABLE 197 REST OF SOUTH AMERICA: RECYCLED TEREPHTHALIC ACID MARKET, BY END-USE INDUSTRY, 2021–2023 (TON)
  • TABLE 198 REST OF SOUTH AMERICA: RECYCLED TEREPHTHALIC ACID MARKET, BY END-USE INDUSTRY, 2024–2029 (TON)
  • TABLE 199 OVERVIEW OF STRATEGIES ADOPTED BY KEY RECYCLED TEREPHTHALIC ACID MANUFACTURERS, JANUARY 2020–SEPTEMBER 2024
  • TABLE 200 RECYCLED TEREPHTHALIC ACID MARKET: DEGREE OF COMPETITION
  • TABLE 201 RECYCLED TEREPHTHALIC ACID MARKET: PROCESS FOOTPRINT
  • TABLE 202 RECYCLED TEREPHTHALIC ACID MARKET: APPLICATION FOOTPRINT
  • TABLE 203 RECYCLED TEREPHTHALIC ACID MARKET: END-USE INDUSTRY FOOTPRINT
  • TABLE 204 RECYCLED TEREPHTHALIC ACID MARKET: REGION FOOTPRINT
  • TABLE 205 RECYCLED TEREPHTHALIC ACID MARKET: DETAILED LIST OF KEY STARTUPS/SMES
  • TABLE 206 RECYCLED TEREPHTHALIC ACID MARKET: COMPETITIVE BENCHMARKING OF KEY STARTUPS/SMES
  • TABLE 207 RECYCLED TEREPHTHALIC ACID MARKET: DEALS, JANUARY 2020–SEPTEMBER 2024
  • TABLE 208 RECYCLED TEREPHTHALIC ACID MARKET: EXPANSIONS, JANUARY 2020–SEPTEMBER 2024
  • TABLE 209 INDORAMA VENTURES PUBLIC COMPANY LIMITED: COMPANY OVERVIEW
  • TABLE 210 INDORAMA VENTURES PUBLIC COMPANY LIMITED: PRODUCTS OFFERED
  • TABLE 211 INDORAMA VENTURES PUBLIC COMPANY LIMITED: DEALS, JANUARY 2020–SEPTEMBER 2024
  • TABLE 212 INDORAMA VENTURES PUBLIC COMPANY LIMITED: EXPANSIONS, JANUARY 2020–SEPTEMBER 2024
  • TABLE 213 INDORAMA VENTURES PUBLIC COMPANY LIMITED: OTHER DEVELOPMENTS, JANUARY 2020–SEPTEMBER 2024
  • TABLE 214 ALPEK S.A.B. DE C.V.: COMPANY OVERVIEW
  • TABLE 215 ALPEK S.A.B. DE C.V.: PRODUCTS OFFERED
  • TABLE 216 ALPEK S.A.B. DE C.V.: DEALS, JANUARY 2020–SEPTEMBER 2024
  • TABLE 217 ALPEK S.A.B. DE C.V.: OTHER DEVELOPMENTS, JANUARY 2020–SEPTEMBER 2024
  • TABLE 218 SUEZ: COMPANY OVERVIEW
  • TABLE 219 SUEZ: PRODUCTS OFFERED
  • TABLE 220 SUEZ: DEALS, JANUARY 2020–SEPTEMBER 2024
  • TABLE 221 SUEZ: OTHER DEVELOPMENTS, JANUARY 2020–SEPTEMBER 2024
  • TABLE 222 ALPLA: COMPANY OVERVIEW
  • TABLE 223 ALPLA: PRODUCTS OFFERED
  • TABLE 224 ALPLA: EXPANSIONS, JANUARY 2020–SEPTEMBER 2024
  • TABLE 225 UNIFI, INC.: COMPANY OVERVIEW
  • TABLE 226 UNIFI, INC.: PRODUCTS OFFERED
  • TABLE 227 SK CHEMICALS: COMPANY OVERVIEW
  • TABLE 228 SK CHEMICALS: PRODUCTS OFFERED
  • TABLE 229 SK CHEMICALS: DEALS, JANUARY 2020–SEPTEMBER 2024
  • TABLE 230 FAR EASTERN NEW CENTURY CORPORATION: COMPANY OVERVIEW
  • TABLE 231 FAR EASTERN NEW CENTURY CORPORATION: PRODUCTS OFFERED
  • TABLE 232 FAR EASTERN NEW CENTURY CORPORATION: EXPANSIONS, JANUARY 2020–SEPTEMBER 2024
  • TABLE 233 FAR EASTERN NEW CENTURY CORPORATION: OTHER DEVELOPMENTS, JANUARY 2020–SEPTEMBER 2024
  • TABLE 234 BIFFA: COMPANY OVERVIEW
  • TABLE 235 BIFFA: PRODUCTS OFFERED
  • TABLE 236 BIFFA: DEALS, JANUARY 2020–SEPTEMBER 2024
  • TABLE 237 PLASTIPAK HOLDINGS, INC.: COMPANY OVERVIEW
  • TABLE 238 PLASTIPAK HOLDINGS, INC.: PRODUCTS OFFERED
  • TABLE 239 PLASTIPAK HOLDINGS, INC.: DEALS, JANUARY 2020–SEPTEMBER 2024
  • TABLE 240 PLASTIPAK HOLDINGS, INC.: EXPANSIONS, JANUARY 2020–SEPTEMBER 2024
  • TABLE 241 VISY: COMPANY OVERVIEW
  • TABLE 242 VISY: PRODUCTS OFFERED
  • TABLE 243 MARGLEN INDUSTRIES: COMPANY OVERVIEW
  • TABLE 244 CARBIOS: COMPANY OVERVIEW
  • TABLE 245 POLYQUEST, INC.: COMPANY OVERVIEW
  • TABLE 246 EVERGREEN: COMPANY OVERVIEW
  • TABLE 247 DEPOLY: COMPANY OVERVIEW
  • TABLE 248 REVALYU RESOURCES GMBH: COMPANY OVERVIEW
  • TABLE 249 EKOPET: COMPANY OVERVIEW
  • TABLE 250 LOOP INDUSTRIES, INC.: COMPANY OVERVIEW
  • TABLE 251 TERRACLE: COMPANY OVERVIEW
  • TABLE 252 INTCO: COMPANY OVERVIEW
  • TABLE 253 GOREWISE: COMPANY OVERVIEW
LIST OF FIGURES
 
  • FIGURE 1 RECYCLED TEREPHTHALIC ACID MARKET SEGMENTATION
  • FIGURE 2 RECYCLED TEREPHTHALIC ACID MARKET: RESEARCH DESIGN
  • FIGURE 3 MARKET SIZE ESTIMATION METHODOLOGY: SUPPLY-SIDE APPROACH
  • FIGURE 4 MARKET SIZE ESTIMATION METHODOLOGY: DEMAND-SIDE APPROACH
  • FIGURE 5 MARKET SIZE ESTIMATION METHODOLOGY: REVENUE OF MARKET PLAYERS
  • FIGURE 6 MARKET SIZE ESTIMATION METHODOLOGY: BOTTOM-UP APPROACH
  • FIGURE 7 MARKET SIZE ESTIMATION METHODOLOGY: TOP-DOWN APPROACH
  • FIGURE 8 RECYCLED TEREPHTHALIC ACID MARKET: DATA TRIANGULATION
  • FIGURE 9 HYDROLYSIS SEGMENT TO DOMINATE MARKET DURING FORECAST PERIOD
  • FIGURE 10 RESINS SEGMENT TO REGISTER HIGHEST GROWTH DURING FORECAST PERIOD
  • FIGURE 11 PACKAGING SEGMENT TO DOMINATE MARKET DURING FORECAST PERIOD
  • FIGURE 12 ASIA PACIFIC ACCOUNTED FOR LARGEST MARKET SHARE IN 2023
  • FIGURE 13 GROWING USE OF RECYCLED TEREPHTHALIC ACID IN PACKAGING CREATES LUCRATIVE OPPORTUNITIES FOR MARKET PLAYERS
  • FIGURE 14 HYDROLYSIS—FASTEST-GROWING SEGMENT DURING FORECAST PERIOD
  • FIGURE 15 PACKAGING SEGMENT TO REGISTER HIGHEST GROWTH DURING FORECAST PERIOD
  • FIGURE 16 CHINA TO REGISTER HIGHEST GROWTH DURING FORECAST PERIOD
  • FIGURE 17 RECYCLED TEREPHTHALIC ACID MARKET: DRIVERS, RESTRAINTS, OPPORTUNITIES, AND CHALLENGES
  • FIGURE 18 USE OF GENERATIVE AI IN RECYCLED TEREPHTHALIC ACID MARKET
  • FIGURE 19 TRENDS/DISRUPTIONS INFLUENCING CUSTOMER BUSINESS
  • FIGURE 20 RECYCLED TEREPHTHALIC ACID MARKET: SUPPLY CHAIN ANALYSIS
  • FIGURE 21 RECYCLED TEREPHTHALIC ACID MARKET: INVESTMENT AND FUNDING SCENARIO, 2020–2024 (USD MILLION)
  • FIGURE 22 AVERAGE SELLING PRICE TREND OF RECYCLED TEREPHTHALIC ACID, BY REGION, 2021–2023 (USD/TON)
  • FIGURE 23 AVERAGE SELLING PRICE TREND OF RECYCLED TEREPHTHALIC ACID PROCESSES, BY KEY PLAYER, 2023 (USD/TON)
  • FIGURE 24 RECYCLED TEREPHTHALIC ACID MARKET: ECOSYSTEM ANALYSIS
  • FIGURE 25 PATENTS GRANTED OVER LAST 10 YEARS, 2013–2023
  • FIGURE 26 PATENT ANALYSIS, BY LEGAL STATUS, 2013–2023
  • FIGURE 27 REGIONAL ANALYSIS OF PATENTS GRANTED RELATED TO RECYCLED TEREPHTHALIC ACID, 2013–2023
  • FIGURE 28 TOP COMPANIES WITH SUBSTANTIAL NUMBER OF PATENTS, 2013–2023
  • FIGURE 29 IMPORT DATA RELATED TO HS CODE 2917360-COMPLIANT PRODUCTS, BY COUNTRY, 2020–2023 (USD THOUSAND)
  • FIGURE 30 EXPORT DATA RELATED TO HS CODE 2917360-COMPLIANT PRODUCTS, BY COUNTRY, 2020–2023 (USD THOUSAND)
  • FIGURE 31 RECYCLED TEREPHTHALIC ACID MARKET: PORTER’S FIVE FORCES ANALYSIS
  • FIGURE 32 INFLUENCE OF STAKEHOLDERS ON BUYING PROCESS, BY END-USE INDUSTRY
  • FIGURE 33 KEY BUYING CRITERIA, BY END-USE INDUSTRY
  • FIGURE 34 HYDROLYSIS SEGMENT TO REGISTER HIGHEST GROWTH DURING FORECAST PERIOD
  • FIGURE 35 RESINS TO BE FASTEST-GROWING SEGMENT DURING FORECAST PERIOD
  • FIGURE 36 PACKAGING SEGMENT TO REGISTER HIGHEST CAGR DURING FORECAST PERIOD
  • FIGURE 37 ASIA PACIFIC TO REGISTER HIGHEST GROWTH DURING FORECAST PERIOD
  • FIGURE 38 ASIA PACIFIC: RECYCLED TEREPHTHALIC ACID MARKET SNAPSHOT
  • FIGURE 39 NORTH AMERICA: RECYCLED TEREPHTHALIC ACID MARKET SNAPSHOT
  • FIGURE 40 EUROPE: RECYCLED TEREPHTHALIC ACID MARKET SNAPSHOT
  • FIGURE 41 RECYCLED TEREPHTHALIC ACID MARKET SHARE ANALYSIS, 2023
  • FIGURE 42 RECYCLED TEREPHTHALIC ACID MARKET: REVENUE ANALYSIS OF KEY PLAYERS, 2020–2024 (USD BILLION)
  • FIGURE 43 RECYCLED TEREPHTHALIC ACID MARKET: COMPANY EVALUATION MATRIX (KEY PLAYERS), 2023
  • FIGURE 44 RECYCLED TEREPHTHALIC ACID MARKET: COMPANY FOOTPRINT
  • FIGURE 45 RECYCLED TEREPHTHALIC ACID MARKET: COMPANY EVALUATION MATRIX (STARTUPS/SMES), 2023
  • FIGURE 46 RECYCLED TEREPHTHALIC ACID MARKET: BRAND/PRODUCT COMPARATIVE ANALYSIS
  • FIGURE 47 EV/EBITDA OF KEY MANUFACTURERS OF RECYCLED TEREPHTHALIC ACID
  • FIGURE 48 YEAR-TO-DATE (YTD) PRICE TOTAL RETURN
  • FIGURE 49 INDORAMA VENTURES PUBLIC COMPANY LIMITED: COMPANY SNAPSHOT
  • FIGURE 50 ALPEK S.A.B. DE C.V.: COMPANY SNAPSHOT
  • FIGURE 51 SUEZ: COMPANY SNAPSHOT
  • FIGURE 52 UNIFI, INC.: COMPANY SNAPSHOT
  • FIGURE 53 SK CHEMICALS: COMPANY SNAPSHOT
  • FIGURE 54 FAR EASTERN NEW CENTURY CORPORATION: COMPANY SNAPSHOT

The study involved four major activities in estimating the market size of the recycled terephthalic acids market. Exhaustive secondary research was done to collect information on the market, the peer market, and the parent market. The next step was to validate these findings, assumptions, and sizing with industry experts across the value chain through primary research. Both top-down and bottom-up approaches were employed to estimate the complete market size. Thereafter, the market breakdown and data triangulation procedures were used to estimate the market size of the segments and subsegments.

Secondary Research

In the secondary research process, various secondary sources have been referred to for identifying and collecting information for this study. These secondary sources include annual reports, press releases, investor presentations of companies, white papers, certified publications, trade directories, certified publications, articles from recognized authors, gold standard and silver standard websites, and databases.

Secondary research has been used to obtain key information about the value chain of the industry, monetary chain of the market, the total pool of key recycled terephthalic acids, market classification and segmentation according to industry trends to the bottom-most level, and regional markets. It was also used to obtain information about the key developments from a market-oriented perspective.


Primary Research

The Recycled terephthalic acids market comprises several stakeholders in the value chain, which include raw material suppliers, manufacturers, and end users. Various primary sources from the supply and demand sides of the Recycled terephthalic acids market have been interviewed to obtain qualitative and quantitative information. The primary interviewees from the demand side include key opinion leaders in end-use sectors. The primary sources from the supply side include manufacturers, associations, and institutions involved in the Recycled terephthalic acids industry.

Primary interviews were conducted to gather insights such as market statistics, data of revenue collected from the products and services, market breakdowns, market size estimations, market forecasting, and data triangulation. Primary research also helped in understanding the various trends related to chemistry, application, and region. Stakeholders from the demand side, such as CIOs, CTOs, and CSOs were interviewed to understand the buyer’s perspective on the suppliers, products, component providers, and their current usage of Recycled terephthalic acids and future outlook of their business which will affect the overall market.

The breakdown of profiles of the primary interviewees is illustrated in the figure below:
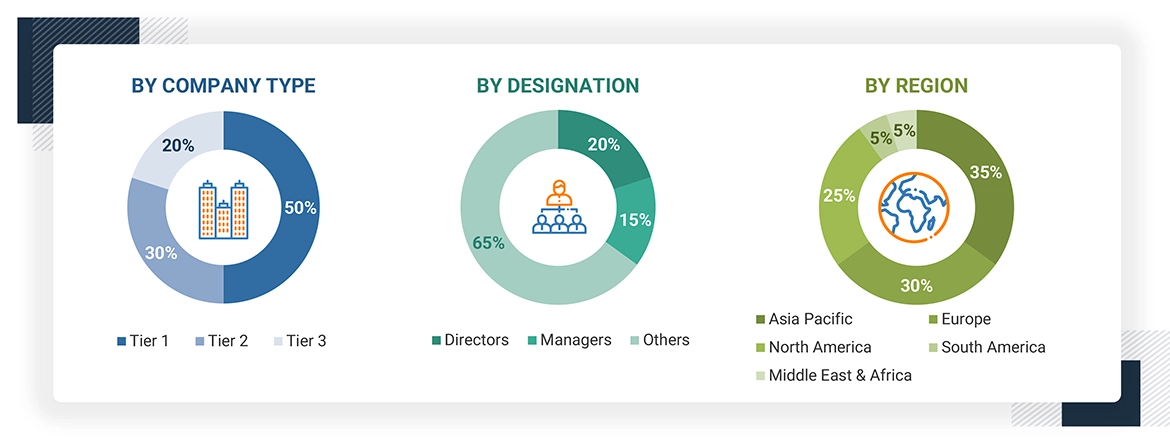
Note: Tier 1, Tier 2, and Tier 3 companies are classified based on their market revenue in 2023 available in the public domain, product portfolios, and geographical presence.

Other designations include sales representatives, production heads, and technicians.

To know about the assumptions considered for the study, download the pdf brochure

Market Size Estimation

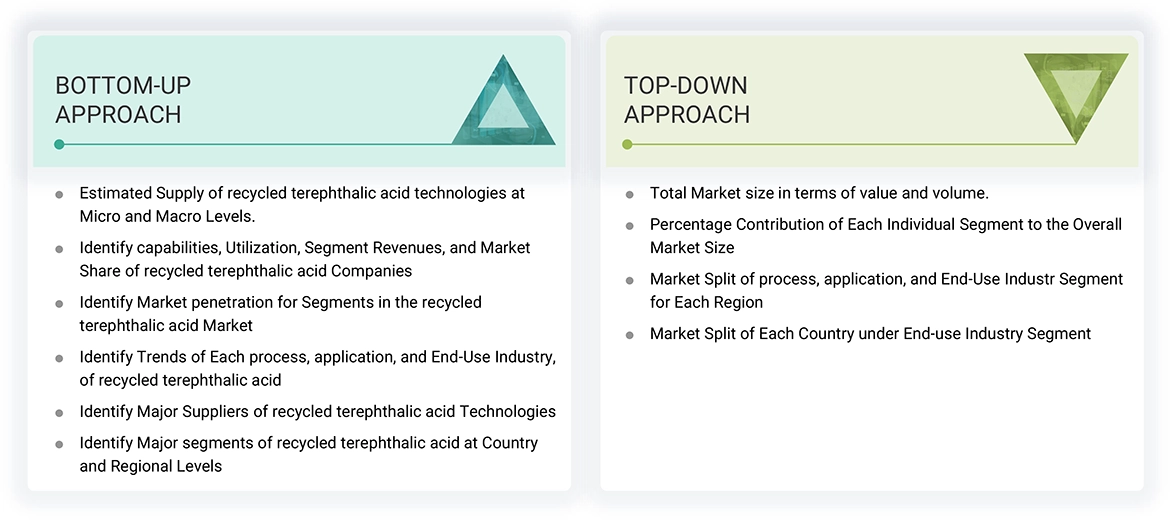
The top-down approach was used to estimate and validate the size of various submarkets for Recycled terephthalic acids for each region. The research methodology used to estimate the market size included the following steps:

  • The key players in the industry have been identified through extensive secondary research.
  • The supply chain of the industry has been determined through primary and secondary research.
  • The global market was then segmented into five major regions and validated by industry experts.
  • All percentage shares, splits, and breakdowns based on process, application, end-use industry, and regions were determined using secondary sources and verified through primary sources.
  • All possible parameters that affect the markets covered in this research study were accounted for, viewed in extensive detail, verified through primary research, and analyzed to get the final quantitative and qualitative data. This data was consolidated and added with detailed inputs and analysis and presented in this report.
Data Triangulation

After arriving at the total market size from the estimation process Recycled terephthalic acids above, the overall market has been split into several segments and sub-segments. To complete the overall market engineering process and arrive at the exact statistics for all the segments and sub-segments, the data triangulation and market breakdown procedures have been employed, wherever applicable. The data has been triangulated by studying various factors and trends from both the demand and supply sides. Along with this, the market size has been validated by using both the top-down and bottom-up approaches and primary interviews. Hence, for every data segment, there have been three sources—top-down approach, bottom-up approach, and expert interviews. The data was assumed correct when the values arrived from the three sources matched.

Market Definition

recycled terephthalic acid is a chemical product acquired by chemical decomposition of waste PET, which are either post-consumer or post-industrial with the objective of reduction in plastic wastes and virgin material reliance. The three steps involved are hydrolysis, glycolysis, and methanolysis, that decompose PET into its two primary monomers, ethylene glycol (EG) and terephthalic acid (TPA). Hydrolysis Hydrolysis is preferred because under specific reaction conditions, water with some catalysts operates well in terms of the yield of high purity TPA. Glycolysis Involves the reaction of PET with ethylene glycol, and methanolysis involves methanol. The recycled terephthalic acid is the most important raw material used to produce rPET commonly applied for bottling packaging containers, and other commodities. Some other uses of recycled terephthalic acid include its use in making recycled polyester fibers for clothing, home furnishings, and industrial textiles. Automotive companies employ recycled terephthalic acid in the production of interior components, and also in the fabrication of durable consumer goods such as products from recycled plastics. Recycling process; it will contribute to the circular economy, that promotes sustainability from a reduced environmental footprint and uphold regulations that support recycling and waste management in making this recycled terephthalic acid a central participant in international efforts toward sustainability on a multicon-textual level that cuts across varied industries.

Stakeholders

  • Recycled terephthalic acids Manufacturers
  • Recycled terephthalic acids Traders, Distributors, and Suppliers
  • Raw Type Suppliers
  • Government and Private Research Organizations
  • Associations and Industrial Bodies
  • R&D Institutions
  • Environmental Support Agencies

Report Objectives

  • To define, describe, and forecast the size of the Recycled terephthalic acids market, in terms of value and volume.
  • To provide detailed information regarding the major factors (drivers, opportunities, restraints, and challenges) influencing the growth of the market.
  • To estimate and forecast the market size based on process, application, end-use industry, and region.
  • To forecast the size of the market with respect to major regions, namely, Europe, North America, Asia Pacific, Middle East & Africa, and South America, along with their key countries.
  • To strategically analyze micromarkets1 with respect to individual growth trends, prospects, and their contribution to the overall market.
  • To analyze opportunities in the market for stakeholders and provide a competitive landscape of market leaders.
  • To track and analyze recent development such as announcement in the market.
  • To strategically profile key market players and comprehensively analyze their core competencies.

Previous Versions of this Report

"Our USP is "providing game-changing business opportunities reports with free customization" - so please feel free to provide us with your specific areas of interest / business challenges in much greater detail !!"

We appreciate your interest in this report. Once you fill out the form, you'll be immediately directed to an exclusive solution tailored to your needs. This high-value offering can help boost your revenue by 30% - a must-see opportunity for anyone looking to maximize growth.


By clicking the "Submit" button, you are agreeing to the Terms of Use and Privacy Policy.

Custom Market Research Services

We Will Customise The Research For You, In Case The Report Listed Above Does Not Meet With Your Requirements

Get 10% Free Customisation

Growth opportunities and latent adjacency in Recycled Terephthalic Acid Market

DMCA.com Protection Status