Power Electronic Market Size, Share & Analysis

Report Code SE 9175
Published On Oct, 2024, By MarketsandMarkets™
Download PDF

Choose License Type

Buy Report Now Inquire Before Buying

Power Electronic Market by Power Discrete (Diode, Transistor, Thyristor), Power Module, Power Integrated Circuit (IC); Electromagnetic Compatibility (EMC) Testing, Radio Frequency (RF) Testing, Energy Efficiency Testing - Global Forecast to 2029

Power Electronic Market Size, Share & Growth

The global power electronic testing market was valued at USD 5.7 billion in 2024 and is projected to reach USD 9.3 billion by 2029; it is estimated to register a CAGR of 10.2% during the forecast period. The demand for power electronics testing is influenced by the rise in electric vehicles (EVs). Renewable sources and smart grids are raising the need for testing in power management systems across various sectors. The evolution of semiconductor technology has led to the evaluation of advanced devices such as SiC and GaN, resulting in increased power electronics testing demand.

Attractive Opportunities in the Power Electronic Market

ASIA PACIFIC

The market in Asia Pacific is driven by rapid industrialization, the consumer electronics industry, and the booming automotive sector, especially electric vehicles. The region’s aggressive investment in 5G infrastructure, smart grids, and industrial automation further bolsters demand for testing solutions

As power modules become integral to improving energy efficiency and system performance, manufacturers prioritize rigorous testing to ensure reliability and compliance with safety standards.

The key drivers for power electronics testing in North America include the growing demand for electric vehicles, renewable energy integration, and the need for high-efficiency power systems in industrial applications.

The growing adoption of electric vehicles (EVs), advancements in renewable energy systems, the rise of 5G networks, and the need for reliable power electronics in consumer electronics and smart grids are key factors driving market growth.

The complexity of emerging technologies, which require advanced and specialized testing, and high testing costs are expected to restrain the growth of this market.

IMPACT OF AI/GEN AI ON THE POWER ELECTRONICS TESTING MARKET

Generative AI (Gen Al) automates power electronic testing by generating realistic and diverse test data. It enables labs to simulate extreme or uncontrollable power system conditions, making products more reliable. It allows virtual testing of power systems in extreme settings, improving product reliability. Gen Al creates custom scenarios that can improve testing workflow efficiency, lessening the requirement for physical prototypes and speeding up development. Also, it facilitates adaptive testing by adjusting test conditions according to current performance data. This enhances precision and efficiency in warning of early issues. Gen Al/Al disrupts the power electronics testing market by facilitating more intelligent, faster, and more effective testing methodologies.

AIoT Market

Power Electronic Market Trends & Dynamics

Driver: Surge in EV adoption increasing need for testing services

The growing demand for electric vehicles requires stable power electronics components, leading to a need for efficient, durable, and safe testing services with detailed evaluation to ensure compliance with regulations. Motor vehicles have numerous parts that depend on power electronics, including the ignition switch, wiper control, adaptive front lighting, interior lighting, and automatic power steering. The rise of electric and plug-in hybrid vehicles means that power electronics will play a key role in managing energy. In these vehicles, power electronics predominantly control the flow of electrical energy and regulate motor speed and torque. Due to environmental concerns and emissions regulations, advanced countries, especially in Europe, aim to reduce vehicle emissions. Automotive designers are investing more in electric vehicles to avoid penalties. In addition, charging large batteries in fully electric vehicles requires 800-volt power chargers since most stations designed for EV cars run at 400 V. Also, predictions about advances in power electronics for vehicles include progress in several important sectors, including the packaging of devices, novel power module designs, and high-temperature capacitors to reduce inverter costs and size and allow operation at higher temperatures.

Restraint: The rapid evolution of semiconductor materials such as SiC and GaN increases the complexity of testing

Increasingly, the complexity of technology in the power electronics testing market is influenced by the emergence of wide-bandgap semiconductors such as silicon carbide (SiC) and gallium nitride (GaN). These materials present substantial advantages over conventional silicon, including higher voltages, temperatures, and switching frequencies. The result is that these power electronic devices are both more efficient and compact. The importance of these lies in their criticality for advanced applications, including electric vehicles, renewable energy systems, and high-frequency telecommunications. These performance developments generate serious testing obstacles. High power levels, fast transient movements, and severe thermal loads require detailed engineering and advances in test equipment. In the subsequent breakdown, it is necessary to investigate the SiC and GaN devices in terms of their switching speed, power losses, and thermal behavior when temperature and voltage increase to achieve both reliability and maximum performance. In addition, the relevance of addressing parasitic effects and electromagnetic interference (EMI) in these high-frequency settings raises the complexity of the testing methodology. As a result, cost and complexity increase because testing equipment must evolve quickly to keep up with the maturing complexity of wide-bandgap semiconductor technologies, complicating manufacturers’ work to develop affordable and scalable testing options.


Opportunity: Increase in reliance on high-efficiency power electronics for avionics and defense systems

The aerospace & defense sectors depend on power electronics with high efficiency to satisfy the needs of modern avionics and UAVs. In order to function appropriately in severely harsh environments, these fields demand trustworthy and efficient power conversion and control technologies. For these applications, power components should be resilient and lightweight, offering maximum efficiency for ideal operations and minimizing energy waste and heat production, which are vital for mission success and system sustainability. The expanding reliance on power electronics features a significant prospect for specialized instrumentation suitable for aerospace and defense applications. In these sectors, testing extends past conventional power performance evaluations and necessitates careful assessments of components’ reliability and adaptability to severe conditions. To capture genuine operating conditions, including EMI and temperature cycles, as well as radiation impact, equipment needs to be capable of simulation. To guarantee adherence to rigorous military and aviation standards, precise testing of power management systems and inverters becomes essential. Developing defense and aerospace systems into electrification, such as electric aircraft and space missions, will heighten the requirement for trustworthy and specialized testing opportunities for power electronics device makers.

Challenge: Adhering to various global safety, efficiency, and quality standards can be complex and resource-intensive for manufacturers

Manufacturers face a crucial hurdle in meeting global safety, efficiency, and quality standards in the power electronics testing market. The safety and functionality of power electronic products depend on standards that change among diverse markets. Achieving compliance requires a solid awareness of many regulations like ISO and UL, which typically include precise details for design and test procedures. The demanding nature of these standards necessitates extensive documentation and strict testing methods, which push manufacturers to commit considerable time and resources to research and development while also building comprehensive testing protocols. To serve automotive applications, power electronics must conform to separate regulations regarding safety and include the EMC and functional safety requirements such as ISO 26262. Equipment for aerospace applications needs to adhere to stringent standards because of their importance for reliability and environmental performance. Additionally, managing compliance becomes tiresome since regulations tend to fluctuate in reaction to technological innovations and changes in the market. It is important to maintain training and advancement for employees, which increases the financial burden on operations. Guaranteeing compliance requires a lot of effort and financial resources, which can delay the launch of new power electronics solutions.

Global Power Electronic Market Ecosystem Analysis

The companies in the market offer comprehensive testing solutions and services suitable for a wide range of applications. Prominent power electronic testing equipment provider stakeholders include Advantest Corporation (Japan), Teradyne Inc. (US), Rohde & Schwarz (Germany), Chroma ATE Inc. (Taiwan), and Cohu, Inc. (US). Meanwhile, SGS SA (Switzerland), Bureau Veritas (France), TÜV SÜD (Germany), Intertek Group plc (UK), and TÜV RHEINLAND (Germany) were major power electronic testing service providers.

Top Companies in AIoT Market
 

Transistors to maintain leading market position by power discrete throughout the forecast period

In the market power discrete device type segment, transistors play a critical part and constitute over 70% of the total market. In many applications, such as power transformation and signal boosting, transistors are vital. These devices are essential for advancing industries that depend on efficient power regulation, including renewable energy and consumer electronics. Multiple industries need improved transistors due to the ongoing shift toward electrification. The introduction and usage of wide bandgap semiconductors such as SiC and GaN increase the requirement for transistors. Advanced semiconductors provide better efficiency and thermal performance, which boosts the need for extensive testing to comply with industry requirements. The evolution of 5G networks and smart power systems elevates the purchase of power transistors since they are necessary for consistent switchable components. Efficient management of high-frequency signals relies on the vital role of transistors in constructing reliable networks. As data transmission speeds grow faster and response times fail to meet 5G system demands, the integrity suffers. Solving the increased power and thermal challenges posed by 5G devices and network infrastructure depends on power transistors. Together, these factors will ensure that transistors remain the leading segment in power discrete testing over the foreseeable period.

Automotive & transportation vertical to experience the most rapid growth throughout the forecast period

As electric and hybrid vehicles rise quickly, the automotive and transportation industry is expected to lead in power electronics testing. The efficiency and safety of EVs depend on the testing of power electronics that handle battery management and energy conversion. Efforts globally to decrease carbon emissions and embrace cleaner energy have led to an upward surge in the demand for top-notch power electronics that fulfill strict regulatory benchmarks. Advances in charging technology and vehicle-to-grid (V2G) concepts enhance the urgency for testing power converters and inverters in the automotive sector. Rigorous testing is necessary to guarantee the reliability and longevity of these systems. Additionally, shifting attention toward autonomous driving and advanced driver assistance systems (ADAS) systems has intensified the demand for advanced power electronics testing. With the evolution of charging infrastructure and fast-charging stations, as well as V2G technologies, the complexity of power electronics is growing, causing an increase in the demand for testing components such as power converters and inverters. The automotive and transportation sector will likely capture the biggest market segment in the power electronics testing segment. This industry depends extensively on powerful electronics with strict regulations and demands high-quality testing services, making it an essential force for market growth.

During the Forecast Period, Asia Pacific is Projected to Record the Highest Growth Rate of the Overall Power Electronics Testing Market

It is projected that Asia Pacific will dominate the power electronics sector and achieve the highest growth during the anticipated timeframe. China, Japan, and South Korea possess extensive industries in consumer electronics ICT and industry verticals, resulting in Asia Pacific’s market development. The heightened demand for electrical energy and state initiatives to enhance renewable infrastructure are influencing the market growth in Asia Pacific. The increase in population in countries such as China and India will result in the higher deployment of communication systems, which will drive growth in the power electronics sector.

Across various sectors in Asia Pacific, the use of industrial automation is increasing. In sectors such as manufacturing and logistics, automation systems benefit greatly from power electronics that regulate and improve their performance. Improving energy management and distribution in smart cities and transportation systems requires state-of-the-art power electronics. As a result, the requirement for parts and systems in the power electronics area has risen. The regional market expands due to the contributions of significant power electronics firms such as Renesas Electronics Corporation and Mitsubishi Electric Corporation. These conditions are projected to boost the growth of the power electronics sector in the Asia Pacific region.

HIGHEST CAGR MARKET IN 2024
CHANIA FASTEST-GROWING MARKET IN THE REGION
AIoT Market

Recent Developments of Power Electronic Market

  • In May 2024, Advantest Corporation launched an Ultra-high Current Power Supply for its V93000 EXA Scale SoC test system. The new DC Scale XHC32 powers up to 32 channels and has a current of up to 640A to serve the higher power requirements of AI accelerators, HPC chips, GPUs, Network Switch, and High-end application processors.
  • In March 2024, Keysight Technologies acquired Riscure, an established device security testing and tool development provider. This allows Riscure to expand its capabilities under the brand name Riscure Security Solutions at Keysight, bolstering Keysight’s security portfolio and improving the firm’s knowledge in the process. This acquisition targets the application and security test market, which complements Keysight’s offering.
  • In December 2023, Advantest Corporation teamed up with Amarisoft to improve 5G and loT device testing. This partnership enabled the users of Amarisoft’s 4G Internet and 5G AMARI Callboxes to access Advantest’s Micro Line Test (MLT) management.
  • In November 2023, Intertek collaborated with the Emitech Group, a testing and engineering independent firm from France, to boost electrical testing services in Europe. Certified to EN 17025 and EN 17065 standards, Emitech is a notified body and active within the CB scheme, currently offering training, testing, and engineering support services to organizations in consumer goods, medical devices, transport, and infrastructure industries.
  • In September 2023, National Instruments Corp. introduced the NHR 4800 high-density battery cycler and emulator, the latest addition to its high-power test systems for battery testing and simulation. The product is designed for modularity, versatility, and safety, offering high power in a compact form factor. It is intended for research, validation, production, and second-life applications within the automotive, aerospace, and energy verticals.

Key Market Players

Scope of the Power Electronic Market Report

Report Attribute Details
Market size available for years 2020–2029
Forecast units Value (USD Million/Billion)
Segments Covered By Offering, Device Type, Vertical, and Region
Geographies covered North America, Europe, Asia Pacific, and RoW

Key Questions Addressed by the Report

Which are the major companies in the power electronic testing market? What are their significant strategies to strengthen their market presence?
The major companies in the power electronics testing market are SGS SA (Switzerland), Bureau Veritas (France), Intertek Group plc (UK), Advantest Corporation (Japan), Teradyne Inc. (US), DEKRA (Germany), TÜV SÜD (Germany), National Instruments Corp. (US), TÜV RHEINLAND (Germany), TÜV NORD Group (Germany), and UL LLC (US), Cohu, Inc. (US), Rohde & Schwarz (Germany), Keysight Technologies (US), and Chroma ATE Inc. (Taiwan). Each player has expansive solution and service portfolios, focuses on strategic mergers & acquisitions, and a drive for innovation. They compete by diversifying offerings, targeting emerging markets, and investing in digitalization and sustainability solutions while focusing on expertise in key sectors like automotive, aerospace & defense, consumer electronics, and ICT. Adapting to client needs and embracing innovation remains crucial for success in this dynamic market.
Which vertical of the power electronic testing market is likely to have the most significant impact in the coming years?
The automotive and transportation vertical will exhibit the highest market growth in the power electronics testing market in the future. The fundamental reason behind this growth is the increasing usage of EVs, HEVs, and the emergence of self-driving cars. Power electronics are used to manage batteries, energy conversion, and motor control in electric vehicles; hence, they need to be tested thoroughly to meet safety, performance, and efficiency standards. Moreover, the global push for the adoption of clean energy, such as renewable energy, in an endeavor to reduce carbon footprints is also increasing the move towards electrification in the automotive industry and hence increasing the need for high–performance power electronics in the market, which have to meet certain levels of regulatory compliance. The advancement of charging technologies, particularly fast charging, V2G, and charging systems, will also propel the need for power electronics testing in this segment.
How are testing services likely to drive market growth in coming years?
Testing services offer huge potential for growth for the power electronics testing market because of the growing importance and sophistication of power electronics in a broad range of industries. Due to new trends in high voltage, high temperature, and high-frequency devices and new materials such as wide band gap material (including SiC and GaN), testing services play a crucial role in safety, reliability, and performance. Also, the constantly increasing electrification in the car industry, aerospace, energy, and consumer electronics sections, especially electric vehicles, renewable energy systems, and smart grids, require intensive testing of modules, including inverters, converters, and battery management systems. As for these industries, adherence to strict legislation and the necessity to achieve high reliability will cause the need for effective testing services to increase persistently, thus promoting the steady development of the market.
What are the drivers and opportunities for the power electronic testing market?
The power electronics testing market is fueled by the increasing trend of sales of electric vehicles, the rising installation of renewable energy systems, and the development of wide-bandgap semiconductors for effectiveness in high-voltage and high-temperature applications. Also, industrial automation, 5G infrastructure, and smart grids create the requirement for effective power electronics applications driving the market. With electric vehicles, aerospace & defense, consumer electronics, high demand for energy efficacy systems, and more rigid regulations, novel testing services are surfacing from the fast-growing electric segments.
What are the restraints and challenges for the power electronic testing market?
Even if there is expected growth ahead, the market will encounter several barriers and issues. Several obstacles and difficulties hinder the power electronics testing market. Expensive equipment and systems for advanced testing act as considerable economic obstacles for smaller and medium-sized companies. Conducting tests on modern power electronics proves to be complex with the emergence of wide-bandgap semiconductors such as SiC and GaN that demand specific knowledge and machinery. Wider global standards for safety add complexity for companies that must regularly evolve to satisfy the diverse and stringent regulations.


Personalize This Research

  • Triangulate with your Own Data
  • Get Data as per your Format and Definition
  • Gain a Deeper Dive on a Specific Application, Geography, Customer or Competitor
  • Any level of Personalization
Request A Free Customisation

Let Us Help You

  • What are the Known and Unknown Adjacencies Impacting the Power Electronic Market
  • What will your New Revenue Sources be?
  • Who will be your Top Customer; what will make them switch?
  • Defend your Market Share or Win Competitors
  • Get a Scorecard for Target Partners
Request A Free Customisation

Table Of Content

Exclusive indicates content/data unique to MarketsandMarkets and not available with any competitors.

TITLE
PAGE NO
INTRODUCTION
27
RESEARCH METHODOLOGY
31
EXECUTIVE SUMMARY
44
PREMIUM INSIGHTS
49
MARKET OVERVIEW
52
  • 5.1 MARKET DYNAMICS
    DRIVERS
    - Surge in EV adoption to increase need for testing services
    - Widespread adoption and expansion of renewable energy sources
    - Growth in demand for energy-efficient power electronics in consumer electronics and enterprises
    - Regulatory policies and industry demand for energy-efficient power systems to drive need for rigorous testing
    - Demand for higher-voltage systems in industries such as railways, electric grids, and data centers to drive demand for specialized testing equipment
    RESTRAINTS
    - Rapid evolution of semiconductor materials such as SiC and GaN increases complexity of testing
    - High initial investment costs in power electronics testing
    OPPORTUNITIES
    - Increasing reliance on high-efficiency power electronics for avionics and defense systems
    - Growth in importance of electrification in industrial applications
    - Expansion of 5G and Telecommunications
    CHALLENGES
    - Adhering to various global safety, efficiency, and quality standards can be complex and resource-intensive for manufacturers
  • 5.2 TRENDS/DISRUPTIONS IMPACTING CUSTOMERS’ BUSINESSES
  • 5.3 PRICING ANALYSIS
    AVERAGE SELLING PRICE TREND OF KEY PLAYERS, BY TEST EQUIPMENT, 2023
    AVERAGE SELLING PRICE OF TEST EQUIPMENT OFFERED BY KEY TEST EQUIPMENT PROVIDERS
    AVERAGE SELLING PRICE TREND OF LIGHTING COMPONENTS, BY REGION
  • 5.4 SUPPLY CHAIN ANALYSIS
  • 5.5 ECOSYSTEM ANALYSIS
  • 5.6 INVESTMENT AND FUNDING SCENARIO
  • 5.7 TECHNOLOGY ANALYSIS
    KEY TECHNOLOGIES
    - Wide bandgap semiconductors (SiC, GaN)
    - Finite element analysis (FEA)
    COMPLEMENTARY TECHNOLOGY
    - Digital twin technology
    ADJACENT TECHNOLOGIES
    - Automated Test Equipment (ATE)
    - Data Acquisition and Control (DAQ) Systems
  • 5.8 PATENT ANALYSIS
  • 5.9 TRADE ANALYSIS
    IMPORT SCENARIO
    EXPORT SCENARIO
  • 5.10 KEY CONFERENCES AND EVENTS, 2024–2025
  • 5.11 CASE STUDY ANALYSIS
    SEMIPOWEREX DEVELOPED SIC POWER MODULES OPTIMIZED FOR POWER CONVERSION SYSTEMS
    TRANSPHORM ENABLED CORSAIR TO OFFER HIGH-PERFORMANCE POWER SUPPLY UNITS (PSU)
    DELTA ELECTRONICS POWERED DATA CENTERS WITH GALLIUM NITRIDE FROM TEXAS INSTRUMENTS INCORPORATED
  • 5.12 TARIFF AND REGULATORY LANDSCAPE
    TARIFF ANALYSIS
    REGULATORY ANALYSIS
    - Regulatory bodies, government agencies, and other organizations
    - Standards
  • 5.13 PORTER’S FIVE FORCES ANALYSIS
    THREAT OF NEW ENTRANTS
    THREAT OF SUBSTITUTES
    BARGAINING POWER OF SUPPLIERS
    BARGAINING POWER OF BUYERS
    INTENSITY OF COMPETITIVE RIVALRY
  • 5.14 KEY STAKEHOLDERS AND BUYING CRITERIA
    KEY STAKEHOLDERS IN BUYING PROCESS
  • 5.15 BUYING CRITERIA
  • 5.16 IMPACT OF AI/GEN AI ON POWER ELECTRONICS TESTING MARKET
    INTRODUCTION
    USE OF GEN AI IN POWER ELECTRONICS TESTING
    IMPACT ON POWER ELECTRONICS TESTING MARKET
    ADJACENT ECOSYSTEM WORKING ON GEN AI
POWER ELECTRONICS TESTING MARKET, BY OFFERING
97
  • 6.1 INTRODUCTION
  • 6.2 TESTING EQUIPMENT
    AUTOMATED TEST EQUIPMENT
    - Rise in focus on shortening manufacturing time and reduction in product recall rate
    OSCILLOSCOPES
    - Increasing demand for miniature electronic devices
    SIGNAL GENERATORS
    - Ability to generate diverse, precise, and stable signals
    MULTIMETERS
    - Portability and versatility to boost adoption in fields and testing labs
    LOGIC ANALYZERS
    - Comprehensive use in troubleshooting digital circuits and communication systems
    SPECTRUM ANALYZERS
    - Ability to provide detailed insights into frequency content, power, and modulation of signals
    BERT SOLUTIONS
    - Pressing need to make informed choices about product development, process improvements, and resource allocation
    NETWORK ANALYZERS
    - Strong focus on improving reliability and efficiency of electronic networks
  • 6.3 TESTING SERVICES
    ELECTROMAGNETIC COMPATIBILITY (EMC) TESTING
    - As power electronics become more advanced, need to ensure proper electromagnetic behavior grows
    ELECTRICAL SAFETY TESTING
    - Need to verify that products can operate safely under normal and fault conditions
    RADIO FREQUENCY (RF) TESTING
    - Ensuring that power electronic devices do not emit excessive EMI and are resistant to external RF noise
    ENERGY EFFICIENCY TESTING
    - Ensuring that products consume less power and contribute to global sustainability efforts
POWER ELECTRONICS TESTING SERVICE MARKET, BY DEVICE TYPE
109
  • 7.1 INTRODUCTION
  • 7.2 POWER DISCRETE
    INCREASE IN EMPHASIS ON POWER DISCRETE DEVICES WITH HIGH-FREQUENCY SWITCHING FOR IMPROVED EFFICIENCY IN VARIOUS APPLICATIONS
    DIODE
    - Mounting type and diode packaging
    - PIN diode
    - Zener diode
    - Schottky diode
    - Switching diode
    - Rectifier diode
    TRANSISTOR
    - Use of smart power transistors in augmenting system reliability and effective power management
    - Field-effect transistor (FET)
    - Bipolar junction transistor (BJT)
    - Insulated gate bipolar transistor (IGBT)
    THYRISTORS
  • 7.3 POWER MODULE
    SIGNIFICANT ROLE IN INDUSTRIAL DRIVES IN ENSURING PRECISE CONTROL OVER SPEED OF ELECTRIC MOTORS
    STANDARD & POWER INTEGRATED MODULE
    - IGBT module
    - FET
    - Other Standard & Power Integrated Module Types
    IPM
  • 7.4 POWER INTEGRATED CIRCUIT (IC)
    POWER MANAGEMENT IC
    APPLICATION-SPECIFIC IC
POWER ELECTRONICS TESTING SERVICE MARKET, BY VERTICAL
143
  • 8.1 INTRODUCTION
  • 8.2 CONSUMER ELECTRONICS
    INCREASING INTEGRATION OF POWER ELECTRONICS IN WEARABLES, IOT DEVICES, AND SMART HOME DEVICES
  • 8.3 INDUSTRIAL
    GROWING ADOPTION OF DIGITAL CONTROL SYSTEMS AND ADVANCED ALGORITHMS IN POWER ELECTRONICS
  • 8.4 ICT
    RISE IN DEMAND FOR ADVANCED POWER ELECTRONIC DEVICES AND CONTROLLED COOLING FOR DATA CENTERS AND ICT EQUIPMENT
  • 8.5 AUTOMOTIVE & TRANSPORTATION
    INCREASING ADOPTION OF ELECTRIC VEHICLES WITH FAST CHARGING TO CONTRIBUTE TO MARKET GROWTH
  • 8.6 AEROSPACE & DEFENSE
    SHIFT TO ELECTRIC AIRCRAFT AND GROWING DEMAND FOR HIGH-FREQUENCY WARFARE SYSTEMS
  • 8.7 OTHER VERTICALS
POWER ELECTRONICS TESTING SERVICES MARKET, BY REGION
158
  • 9.1 INTRODUCTION
  • 9.2 NORTH AMERICA
    NORTH AMERICA: MACROECONOMIC OUTLOOK
    US
    - Adoption of wide bandgap semiconductor materials and focus on energy storage solutions for grid stability
    CANADA
    - Rising need for power electronics for efficient power management from renewable sources
    MEXICO
    - Nascent market to be driven by growing economy and increasing population
  • 9.3 EUROPE
    EUROPE: MACROECONOMIC OUTLOOK
    UK
    - Active government support to reduce carbon footprint across various verticals, especially with substantial auto OEM presence
    GERMANY
    - Significant contribution of power electronics to improving affordability and energy efficiency of EVs
    FRANCE
    - Increasing focus on reducing pollution levels by shifting to EVs
    ITALY
    - Among Europe’s leaders in producing electricity from renewable energy sources
    REST OF EUROPE
  • 9.4 ASIA PACIFIC
    ASIA PACIFIC: MACROECONOMIC OUTLOOK
    CHINA
    - Prominent manufacturer of consumer electronics and rapid adoption of EVs
    JAPAN
    - Focus on renewable energy production and adoption of SiC technology
    INDIA
    - Rapid urbanization and infrastructure modernization; high growth in solar energy adoption
    SOUTH KOREA
    - Increased infrastructure projects, advanced transportation systems, and renewable energy initiatives
    REST OF ASIA PACIFIC
  • 9.5 ROW
    ROW: MACROECONOMIC OUTLOOK
    SOUTH AMERICA
    - Rise in demand for power electronics from energy and industrial sectors in Brazil
    MIDDLE EAST & AFRICA
    - GCC
    - Rest of Middle East & Africa
COMPETITIVE LANDSCAPE
190
  • 10.1 OVERVIEW
  • 10.2 KEY PLAYER STRATEGIES/RIGHT TO WIN, 2020–2024
  • 10.3 REVENUE ANALYSIS, 2020–2023
  • 10.4 MARKET SHARE ANALYSIS, 2023
  • 10.5 COMPANY VALUATION AND FINANCIAL METRICS
    COMPANY VALUATION
    FINANCIAL METRICS
  • 10.6 BRAND/PRODUCT COMPARISON
  • 10.7 COMPANY EVALUATION MATRIX: KEY PLAYERS, 2023
    STARS
    EMERGING LEADERS
    PERVASIVE PLAYERS
    PARTICIPANTS
    COMPANY FOOTPRINT: KEY PLAYERS, 2023
    - Company footprint
    - Device footprint
    - Test Equipment footprint
    - Testing services footprint
    - Vertical footprint
    - Region footprint
  • 10.8 COMPANY EVALUATION MATRIX: STARTUPS/SMES, 2023
    PROGRESSIVE COMPANIES
    RESPONSIVE COMPANIES
    DYNAMIC COMPANIES
    STARTING BLOCKS
    COMPETITIVE BENCHMARKING: STARTUPS/SMES, 2023
    - Detailed list of key startups/SMEs
    - Competitive benchmarking of key startups/SMEs
  • 10.9 COMPETITIVE SCENARIO AND TRENDS
    PRODUCT LAUNCHES
    DEALS
    EXPANSIONS
    OTHER DEVELOPMENTS
COMPANY PROFILES
224
  • 11.1 KEY TESTING SERVICE PROVIDERS
    SGS SA
    - Business overview
    - Products/Products/Solutions/Services offered
    - Recent developments
    - MnM view
    INTERTEK GROUP PLC
    - Business overview
    - Products/Solutions/Services offered
    - Recent developments
    - MnM view
    TÜV SÜD
    - Business overview
    - Products/Solutions/Services offered
    - Recent Developments
    - MnM view
    TÜV RHEINLAND
    - Business overview
    - Products/Solutions/Services offered
    - Recent developments
    EUROFINS SCIENTIFIC
    - Business overview
    - Products/Solutions/Services offered
    - Recent developments
    BUREAU VERITAS
    - Business overview
    - Products/Solutions/Services offered
    - Recent developments
    TÜV NORD GROUP
    - Business overview
    - Products/Solutions/Services offered
    DEKRA
    - Business overview
    - Products/Solutions/Services offered
    - Recent developments
  • 11.2 OTHER KEY TESTING SERVICE PROVIDERS
    UL LLC
    APPLUS+
    ELEMENT MATERIALS TECHNOLOGY
    DNV GL
    CSA GROUP
    TEKTRONIX, INC.
    TESTILABS OY
  • 11.3 KEY TESTING EQUIPMENT PROVIDERS
    ADVANTEST CORPORATION
    - Business overview
    - Products/Solutions/Services offered
    - Recent developments
    - MnM view
    TERADYNE INC.
    - Business overview
    - Products/Solutions/Services offered
    - MnM view
    ROHDE & SCHWARZ
    - Business overview
    - Products/Solutions/Services offered
    - Recent developments
    - MnM view
    KEYSIGHT TECHNOLOGIES
    - Business overview
    - Products/Solutions/Services offered
    - Recent developments
    CHROMA ATE INC.
    - Business overview
    - Products/Solutions/Services offered
    NATIONAL INSTRUMENTS CORP.
    - Business overview
    - Products/Solutions/Services offered
    - Recent developments
    COHU, INC.
    - Business overview
    - Products/Solutions/Services offered
    - Recent developments
    - Recent developments
  • 11.4 OTHER TEST EQUIPMENT PROVIDERS
    ANRITSU
    DSPACE GMBH
    ETS-LINDGREN
    ORBIS SYSTEMS OY
    OMICRON LAB
    TESEC, INC.
    GOOD WILL INSTRUMENT CO., LTD.
    VAUNIX TECHNOLOGY CORPORATION
APPENDIX
292
  • 12.1 INSIGHTS FROM INDUSTRY EXPERTS
  • 12.2 DISCUSSION GUIDE
  • 12.3 KNOWLEDGESTORE: MARKETSANDMARKETS’ SUBSCRIPTION PORTAL
  • 12.4 CUSTOMIZATION OPTIONS
  • 12.5 RELATED REPORTS
  • 12.6 AUTHOR DETAILS
LIST OF TABLES
 
  • TABLE 1 LIST OF KEY SECONDARY SOURCES
  • TABLE 2 INTENDED PARTICIPANTS AND KEY OPINION LEADERS IN PRIMARY INTERVIEWS
  • TABLE 3 RISK ASSESSMENT: POWER ELECTRONICS TESTING MARKET
  • TABLE 4 PRICING TREND OF AUTOMATED TEST EQUIPMENT, BY TEST EQUIPMENT PROVIDER, 2020–2023 (USD MILLION)
  • TABLE 5 PRICING TREND OF NETWORK ANALYZER, BY TEST EQUIPMENT PROVIDER, 2020–2023 (USD)
  • TABLE 6 PRICING TREND OF SIGNAL ANALYZER, BY TEST EQUIPMENT PROVIDER, 2020–2023 (USD)
  • TABLE 7 PRICING TREND OF POWER ELECTRONICS TEST EQUIPMENT, BY REGION, 2020–2023 (USD)
  • TABLE 8 POWER ELECTRONICS TESTING MARKET: ECOSYSTEM
  • TABLE 9 LIST OF PATENTS PERTAINING TO POWER ELECTRONICS TESTING, 2020–2023
  • TABLE 10 IMPORT DATA FOR HS CODE 8541- SEMICONDUCTOR DEVICES , BY COUNTRY, 2020–2023 (USD MILLION)
  • TABLE 11 EXPORT DATA FOR HS CODE 8541 - SEMICONDUCTOR DEVICES, BY COUNTRY, 2020–2023 (USD MILLION)
  • TABLE 12 POWER ELECTRONICS TESTING MARKET: DETAILED LIST OF RELATED CONFERENCES AND EVENTS, 2024–2025
  • TABLE 13 US: EXPORT TARIFF FOR HS CODE 8541-COMPLIANT PRODUCTS, 2023
  • TABLE 14 HONG KONG: EXPORT TARIFF FOR HS CODE 8541-COMPLIANT PRODUCTS, 2022
  • TABLE 15 NORTH AMERICA: LIST OF REGULATORY BODIES, GOVERNMENT AGENCIES, AND OTHER ORGANIZATIONS
  • TABLE 16 EUROPE: LIST OF REGULATORY BODIES, GOVERNMENT AGENCIES, AND OTHER ORGANIZATIONS
  • TABLE 17 ASIA PACIFIC: LIST OF REGULATORY BODIES, GOVERNMENT AGENCIES, AND OTHER ORGANIZATIONS
  • TABLE 18 POWER ELECTRONICS TESTING MARKET: PORTER’S FIVE FORCES ANALYSIS
  • TABLE 19 INFLUENCE OF KEY STAKEHOLDERS ON BUYING PROCESS, BY VERTICAL (%)
  • TABLE 20 KEY BUYING CRITERIA FOR TOP THREE VERTICALS
  • TABLE 21 POWER ELECTRONICS TESTING MARKET, BY TESTING TYPE, 2020–2023 (USD MILLION)
  • TABLE 22 POWER ELECTRONICS TESTING MARKET, BY TESTING TYPE, 2024–2029 (USD MILLION)
  • TABLE 23 POWER ELECTRONICS TESTING EQUIPMENT MARKET, BY TYPE, 2020–2023 (USD MILLION)
  • TABLE 24 POWER ELECTRONICS TESTING EQUIPMENT MARKET, BY TYPE, 2024–2029 (USD MILLION)
  • TABLE 25 POWER ELECTRONICS TESTING SERVICES MARKET, BY TYPE, 2020–2023 (USD MILLION)
  • TABLE 26 POWER ELECTRONICS TESTING SERVICES MARKET, BY TYPE, 2024–2029 (USD MILLION)
  • TABLE 27 POWER ELECTRONICS TESTING SERVICES MARKET, BY DEVICE TYPE, 2020–2023 (USD MILLION)
  • TABLE 28 POWER ELECTRONICS TESTING SERVICES MARKET, BY DEVICE TYPE, 2024–2029 (USD MILLION)
  • TABLE 29 POWER DISCRETE ELECTRONICS TESTING SERVICES MARKET, BY REGION, 2020–2023 (USD MILLION)
  • TABLE 30 POWER DISCRETE ELECTRONICS TESTING SERVICES MARKET, BY REGION, 2024–2029 (USD MILLION)
  • TABLE 31 POWER DISCRETE ELECTRONICS TESTING SERVICES MARKET, BY VERTICAL, 2020–2023 (USD MILLION)
  • TABLE 32 POWER DISCRETE ELECTRONICS TESTING SERVICES MARKET, BY VERTICAL, 2024–2029 (USD MILLION)
  • TABLE 33 NORTH AMERICA: POWER DISCRETE ELECTRONICS TESTING SERVICES MARKET, BY COUNTRY, 2020–2023 (USD MILLION)
  • TABLE 34 NORTH AMERICA: POWER DISCRETE ELECTRONICS TESTING SERVICES MARKET, BY COUNTRY, 2024–2029 (USD MILLION)
  • TABLE 35 EUROPE: POWER DISCRETE ELECTRONICS TESTING SERVICES MARKET, BY COUNTRY, 2020–2023 (USD MILLION)
  • TABLE 36 EUROPE: POWER DISCRETE ELECTRONICS TESTING SERVICES MARKET, BY COUNTRY, 2024–2029 (USD MILLION)
  • TABLE 37 ASIA PACIFIC: POWER DISCRETE ELECTRONICS TESTING SERVICES MARKET, BY COUNTRY, 2020–2023 (USD MILLION)
  • TABLE 38 ASIA PACIFIC: POWER DISCRETE ELECTRONICS TESTING SERVICES MARKET, BY COUNTRY, 2024–2029 (USD MILLION)
  • TABLE 39 ROW: POWER DISCRETE ELECTRONICS TESTING SERVICES MARKET, BY REGION, 2020–2023 (USD MILLION)
  • TABLE 40 ROW: POWER DISCRETE ELECTRONICS TESTING SERVICES MARKET, BY REGION, 2024–2029 (USD MILLION)
  • TABLE 41 NORTH AMERICA: POWER DISCRETE ELECTRONICS TESTING SERVICES MARKET, BY VERTICAL, 2020–2023 (USD MILLION)
  • TABLE 42 NORTH AMERICA: POWER DISCRETE ELECTRONICS TESTING SERVICES MARKET, BY VERTICAL, 2024–2029 (USD MILLION)
  • TABLE 43 EUROPE: POWER DISCRETE ELECTRONICS TESTING SERVICES MARKET, BY VERTICAL, 2020–2023 (USD MILLION)
  • TABLE 44 EUROPE: POWER DISCRETE ELECTRONICS TESTING SERVICES MARKET, BY VERTICAL, 2024–2029 (USD MILLION)
  • TABLE 45 ASIA PACIFIC: POWER DISCRETE ELECTRONICS TESTING SERVICES MARKET, BY VERTICAL, 2020–2023 (USD MILLION)
  • TABLE 46 ASIA PACIFIC: POWER DISCRETE ELECTRONICS TESTING SERVICES MARKET, BY VERTICAL, 2024–2029 (USD MILLION)
  • TABLE 47 ROW: POWER DISCRETE ELECTRONICS TESTING SERVICES MARKET, BY VERTICAL, 2020–2023 (USD MILLION)
  • TABLE 48 ROW: POWER DISCRETE ELECTRONICS TESTING SERVICES MARKET, BY VERTICAL, 2024–2029 (USD MILLION)
  • TABLE 49 POWER DISCRETE ELECTRONICS TESTING SERVICES MARKET, BY TYPE, 2020–2023 (USD MILLION)
  • TABLE 50 POWER DISCRETE ELECTRONICS TESTING SERVICES MARKET, BY TYPE, 2024–2029 (USD MILLION)
  • TABLE 51 TRANSISTOR TESTING SERVICE MARKET, BY TYPE, 2020–2023 (USD MILLION)
  • TABLE 52 TRANSISTOR TESTING SERVICE MARKET, 2024–2029 (USD MILLION)
  • TABLE 53 POWER MODULE ELECTRONICS TESTING SERVICES MARKET, BY REGION, 2020–2023 (USD MILLION)
  • TABLE 54 POWER MODULE ELECTRONICS TESTING SERVICES MARKET, BY REGION, 2024–2029 (USD MILLION)
  • TABLE 55 POWER MODULE ELECTRONICS TESTING SERVICES MARKET, BY VERTICAL, 2020–2023 (USD MILLION)
  • TABLE 56 POWER MODULE ELECTRONICS TESTING SERVICES MARKET, BY VERTICAL, 2024–2029 (USD MILLION)
  • TABLE 57 NORTH AMERICA: POWER MODULE ELECTRONICS TESTING SERVICES MARKET, BY COUNTRY, 2020–2023 (USD MILLION)
  • TABLE 58 NORTH AMERICA: POWER MODULE ELECTRONICS TESTING SERVICES MARKET, BY COUNTRY, 2024–2029 (USD MILLION)
  • TABLE 59 EUROPE: POWER MODULE ELECTRONICS TESTING SERVICES MARKET, BY COUNTRY, 2020–2023 (USD MILLION)
  • TABLE 60 EUROPE: POWER MODULE ELECTRONICS TESTING SERVICES MARKET, BY COUNTRY, 2024–2029 (USD MILLION)
  • TABLE 61 ASIA PACIFIC: POWER MODULE ELECTRONICS TESTING SERVICES MARKET, BY COUNTRY, 2020–2023 (USD MILLION)
  • TABLE 62 ASIA PACIFIC: POWER MODULE ELECTRONICS TESTING SERVICES MARKET, BY COUNTRY, 2024–2029 (USD MILLION)
  • TABLE 63 ROW: POWER MODULE ELECTRONICS TESTING SERVICES MARKET, BY REGION, 2020–2023 (USD MILLION)
  • TABLE 64 ROW: POWER MODULE ELECTRONICS TESTING SERVICES MARKET, BY REGION, 2024–2029 (USD MILLION)
  • TABLE 65 NORTH AMERICA: POWER MODULE ELECTRONICS TESTING SERVICE MARKET, BY VERTICAL, 2020–2023 (USD MILLION)
  • TABLE 66 NORTH AMERICA: POWER MODULE ELECTRONICS TESTING SERVICE MARKET, BY VERTICAL, 2024–2029 (USD MILLION)
  • TABLE 67 EUROPE: POWER MODULE ELECTRONICS TESTING SERVICE MARKET, BY VERTICAL, 2020–2023 (USD MILLION)
  • TABLE 68 EUROPE: POWER MODULE ELECTRONICS TESTING SERVICE MARKET, BY VERTICAL, 2024–2029 (USD MILLION)
  • TABLE 69 ASIA PACIFIC: POWER MODULE ELECTRONICS TESTING SERVICE MARKET, BY VERTICAL, 2020–2023 (USD MILLION)
  • TABLE 70 ASIA PACIFIC: POWER MODULE ELECTRONICS TESTING SERVICE MARKET, BY VERTICAL, 2024–2029 (USD MILLION)
  • TABLE 71 ROW: POWER MODULE ELECTRONICS TESTING SERVICE MARKET, BY VERTICAL, 2020–2023 (USD MILLION)
  • TABLE 72 ROW: POWER MODULE ELECTRONICS TESTING SERVICE MARKET, BY VERTICAL, 2024–2029 (USD MILLION)
  • TABLE 73 POWER MODULE ELECTRONICS TESTING SERVICE MARKET, BY TYPE, 2020–2023 (USD MILLION)
  • TABLE 74 POWER MODULE ELECTRONICS TESTING SERVICE MARKET, BY TYPE, 2024–2029 (USD MILLION)
  • TABLE 75 STANDARD & POWER INTEGRATED MODULE ELECTRONICS TESTING SERVICES MARKET, BY TYPE, 2020–2023 (USD MILLION)
  • TABLE 76 STANDARD & POWER INTEGRATED MODULE ELECTRONICS TESTING SERVICES MARKET, BY TYPE, 2024–2029 (USD MILLION)
  • TABLE 77 POWER INTEGRATED CIRCUIT (IC) TESTING SERVICES MARKET, BY REGION, 2020–2023 (USD MILLION)
  • TABLE 78 POWER INTEGRATED CIRCUIT (IC) TESTING SERVICES MARKET, BY REGION, 2024–2029 (USD MILLION)
  • TABLE 79 POWER INTEGRATED CIRCUIT (IC) TESTING SERVICES MARKET, BY VERTICAL, 2020–2023 (USD MILLION)
  • TABLE 80 POWER INTEGRATED CIRCUIT (IC) TESTING SERVICES MARKET, BY VERTICAL, 2024–2029 (USD MILLION)
  • TABLE 81 NORTH AMERICA: POWER INTEGRATED CIRCUIT (IC) TESTING SERVICES MARKET, BY COUNTRY, 2020–2023 (USD MILLION)
  • TABLE 82 NORTH AMERICA: POWER INTEGRATED CIRCUIT (IC) TESTING SERVICES MARKET, BY COUNTRY, 2024–2029 (USD MILLION)
  • TABLE 83 EUROPE: POWER INTEGRATED CIRCUIT (IC) TESTING SERVICES MARKET, BY COUNTRY, 2020–2023 (USD MILLION)
  • TABLE 84 EUROPE: POWER INTEGRATED CIRCUIT (IC) TESTING SERVICES MARKET, BY COUNTRY, 2024–2029 (USD MILLION)
  • TABLE 85 ASIA PACIFIC: POWER INTEGRATED CIRCUIT (IC) TESTING SERVICES MARKET, BY COUNTRY, 2020–2023 (USD MILLION)
  • TABLE 86 ASIA PACIFIC: POWER INTEGRATED CIRCUIT (IC) TESTING SERVICES MARKET, BY COUNTRY, 2024–2029 (USD MILLION)
  • TABLE 87 ROW: POWER INTEGRATED CIRCUIT (IC) TESTING SERVICES MARKET, BY REGION, 2020–2023 (USD MILLION)
  • TABLE 88 ROW: POWER INTEGRATED CIRCUIT (IC) TESTING SERVICES MARKET, BY REGION, 2024–2029 (USD MILLION)
  • TABLE 89 NORTH AMERICA: POWER INTEGRATED CIRCUIT (IC) ELECTRONICS TESTING SERVICES MARKET, BY VERTICAL, 2020–2023 (USD MILLION)
  • TABLE 90 NORTH AMERICA: POWER INTEGRATED CIRCUIT (IC) ELECTRONICS TESTING SERVICES MARKET, BY VERTICAL, 2024–2029 (USD MILLION)
  • TABLE 91 EUROPE: POWER INTEGRATED CIRCUIT (IC) ELECTRONICS TESTING SERVICES MARKET, BY VERTICAL, 2020–2023 (USD MILLION)
  • TABLE 92 EUROPE: POWER INTEGRATED CIRCUIT (IC) ELECTRONICS TESTING SERVICES MARKET, BY VERTICAL, 2024–2029 (USD MILLION)
  • TABLE 93 ASIA PACIFIC: POWER INTEGRATED CIRCUIT (IC) ELECTRONICS TESTING SERVICES MARKET, BY VERTICAL, 2020–2023 (USD MILLION)
  • TABLE 94 ASIA PACIFIC: POWER INTEGRATED CIRCUIT (IC) ELECTRONICS TESTING SERVICES MARKET, BY VERTICAL, 2024–2029 (USD MILLION)
  • TABLE 95 ROW: POWER INTEGRATED CIRCUIT (IC) ELECTRONICS TESTING SERVICES MARKET, BY VERTICAL, 2020–2023 (USD MILLION)
  • TABLE 96 ROW: POWER INTEGRATED CIRCUIT (IC) ELECTRONICS TESTING SERVICES MARKET, BY VERTICAL, 2024–2029 (USD MILLION)
  • TABLE 97 POWER ELECTRONICS TESTING SERVICE MARKET, BY VERTICAL, 2020–2023 (USD MILLION)
  • TABLE 98 POWER ELECTRONICS TESTING SERVICE MARKET, BY VERTICAL, 2024–2029 (USD MILLION)
  • TABLE 99 POWER ELECTRONICS TESTING SERVICES MARKET IN CONSUMER ELECTRONICS, BY DEVICE TYPE, 2020–2023 (USD MILLION)
  • TABLE 100 POWER ELECTRONICS TESTING SERVICES MARKET IN CONSUMER ELECTRONICS, BY DEVICE TYPE, 2024–2029 (USD MILLION)
  • TABLE 101 POWER ELECTRONICS TESTING SERVICES MARKET IN CONSUMER ELECTRONICS, BY REGION, 2020–2023 (USD MILLION)
  • TABLE 102 POWER ELECTRONICS TESTING SERVICES MARKET IN CONSUMER ELECTRONICS, BY REGION, 2024–2029 (USD MILLION)
  • TABLE 103 POWER ELECTRONICS TESTING SERVICES MARKET IN INDUSTRIAL, BY DEVICE TYPE, 2020–2023 (USD MILLION)
  • TABLE 104 POWER ELECTRONICS TESTING SERVICES MARKET IN INDUSTRIAL, BY DEVICE TYPE, 2024–2029 (USD MILLION)
  • TABLE 105 POWER ELECTRONICS TESTING SERVICES MARKET IN INDUSTRIAL, BY REGION, 2020–2023 (USD MILLION)
  • TABLE 106 POWER ELECTRONICS TESTING SERVICES MARKET IN INDUSTRIAL, BY REGION, 2024–2029 (USD MILLION)
  • TABLE 107 POWER ELECTRONICS TESTING SERVICES MARKET IN ICT, BY DEVICE TYPE, 2020–2023 (USD MILLION)
  • TABLE 108 POWER ELECTRONICS TESTING SERVICES MARKET IN ICT, BY DEVICE TYPE, 2024–2029 (USD MILLION)
  • TABLE 109 POWER ELECTRONICS TESTING SERVICES MARKET IN ICT, BY REGION, 2020–2023 (USD MILLION)
  • TABLE 110 POWER ELECTRONICS TESTING SERVICES MARKET IN ICT, BY REGION, 2024–2029 (USD MILLION)
  • TABLE 111 POWER ELECTRONICS TESTING SERVICES MARKET IN AUTOMOTIVE & TRANSPORTATION, BY DEVICE TYPE, 2020–2023 (USD MILLION)
  • TABLE 112 POWER ELECTRONICS TESTING SERVICES MARKET IN AUTOMOTIVE & TRANSPORTATION, BY DEVICE TYPE, 2024–2029 (USD MILLION)
  • TABLE 113 POWER ELECTRONICS TESTING SERVICES MARKET IN AUTOMOTIVE & TRANSPORTATION, BY REGION, 2020–2023 (USD MILLION)
  • TABLE 114 POWER ELECTRONICS TESTING SERVICES MARKET IN AUTOMOTIVE & TRANSPORTATION, BY REGION, 2024–2029 (USD MILLION)
  • TABLE 115 POWER ELECTRONICS TESTING SERVICES MARKET IN AEROSPACE & DEFENSE, BY DEVICE TYPE, 2020–2023 (USD MILLION)
  • TABLE 116 POWER ELECTRONICS TESTING SERVICES MARKET IN AEROSPACE & DEFENSE, BY DEVICE TYPE, 2024–2029 (USD MILLION)
  • TABLE 117 POWER ELECTRONICS TESTING SERVICES MARKET IN AEROSPACE & DEFENSE, BY REGION, 2020–2023 (USD MILLION)
  • TABLE 118 POWER ELECTRONICS TESTING SERVICES MARKET IN AEROSPACE & DEFENSE, BY REGION, 2024–2029 (USD MILLION)
  • TABLE 119 POWER ELECTRONICS TESTING SERVICES MARKET IN OTHER VERTICALS, BY DEVICE TYPE, 2020–2023 (USD MILLION)
  • TABLE 120 POWER ELECTRONICS TESTING SERVICES MARKET IN OTHER VERTICALS, BY DEVICE TYPE, 2024–2029 (USD MILLION)
  • TABLE 121 POWER ELECTRONICS TESTING SERVICES MARKET IN OTHER VERTICALS, BY REGION, 2020–2023 (USD MILLION)
  • TABLE 122 POWER ELECTRONICS TESTING SERVICES MARKET IN OTHER VERTICALS, BY REGION, 2024–2029 (USD MILLION)
  • TABLE 123 POWER ELECTRONICS TESTING SERVICES MARKET, BY REGION, 2020–2023 (USD MILLION)
  • TABLE 124 POWER ELECTRONICS TESTING SERVICES MARKET, BY REGION, 2024–2029 (USD MILLION)
  • TABLE 125 NORTH AMERICA: POWER ELECTRONICS TESTING SERVICES MARKET, BY DEVICE TYPE, 2020–2023 (USD MILLION)
  • TABLE 126 NORTH AMERICA: POWER ELECTRONICS TESTING SERVICES MARKET, BY DEVICE TYPE, 2024–2029 (USD MILLION)
  • TABLE 127 NORTH AMERICA: POWER ELECTRONICS TESTING SERVICE MARKET, BY VERTICAL, 2020–2023 (USD MILLION)
  • TABLE 128 NORTH AMERICA: POWER ELECTRONICS TESTING SERVICE MARKET, BY VERTICAL, 2024–2029 (USD MILLION)
  • TABLE 129 NORTH AMERICA: POWER ELECTRONICS TESTING SERVICES MARKET, BY COUNTRY, 2020–2023 (USD MILLION)
  • TABLE 130 NORTH AMERICA: POWER ELECTRONICS TESTING SERVICES MARKET, BY COUNTRY, 2024–2029 (USD MILLION)
  • TABLE 131 US: POWER ELECTRONICS TESTING SERVICES MARKET, BY DEVICE TYPE, 2020–2023 (USD MILLION)
  • TABLE 132 US: POWER ELECTRONICS TESTING SERVICES MARKET, BY DEVICE TYPE, 2024–2029 (USD MILLION)
  • TABLE 133 CANADA: POWER ELECTRONICS TESTING SERVICES MARKET, BY DEVICE TYPE, 2020–2023 (USD MILLION)
  • TABLE 134 CANADA: POWER ELECTRONICS TESTING SERVICES MARKET, BY DEVICE TYPE, 2024–2029 (USD MILLION)
  • TABLE 135 MEXICO: POWER ELECTRONICS TESTING SERVICES MARKET, BY DEVICE TYPE, 2020–2023 (USD MILLION)
  • TABLE 136 MEXICO: POWER ELECTRONICS TESTING SERVICES MARKET, BY DEVICE TYPE, 2024–2029 (USD MILLION)
  • TABLE 137 EUROPE: POWER ELECTRONICS TESTING SERVICES MARKET, BY DEVICE TYPE, 2020–2023 (USD MILLION)
  • TABLE 138 EUROPE: POWER ELECTRONICS TESTING SERVICES MARKET, BY DEVICE TYPE, 2024–2029 (USD MILLION)
  • TABLE 139 EUROPE: POWER ELECTRONICS TESTING SERVICE MARKET, BY VERTICAL, 2020–2023 (USD MILLION)
  • TABLE 140 EUROPE: POWER ELECTRONICS TESTING SERVICE MARKET, BY VERTICAL, 2024–2029 (USD MILLION)
  • TABLE 141 EUROPE: POWER ELECTRONICS TESTING SERVICES MARKET, BY COUNTRY, 2020–2023 (USD MILLION)
  • TABLE 142 EUROPE: POWER ELECTRONICS TESTING SERVICES MARKET, BY COUNTRY, 2024–2029 (USD MILLION)
  • TABLE 143 UK: POWER ELECTRONICS TESTING SERVICES MARKET, BY DEVICE TYPE, 2020–2023 (USD MILLION)
  • TABLE 144 UK: POWER ELECTRONICS TESTING SERVICES MARKET, BY DEVICE TYPE, 2024–2029 (USD MILLION)
  • TABLE 145 GERMANY: POWER ELECTRONICS TESTING SERVICES MARKET, BY DEVICE TYPE, 2020–2023 (USD MILLION)
  • TABLE 146 GERMANY: POWER ELECTRONICS TESTING SERVICES MARKET, BY DEVICE TYPE, 2024–2029 (USD MILLION)
  • TABLE 147 FRANCE: POWER ELECTRONICS TESTING SERVICES MARKET, BY DEVICE TYPE, 2020–2023 (USD MILLION)
  • TABLE 148 FRANCE: POWER ELECTRONICS TESTING SERVICES MARKET, BY DEVICE TYPE, 2024–2029 (USD MILLION)
  • TABLE 149 ITALY: POWER ELECTRONICS TESTING SERVICES MARKET, BY DEVICE TYPE, 2020–2023 (USD MILLION)
  • TABLE 150 ITALY: POWER ELECTRONICS TESTING SERVICES MARKET, BY DEVICE TYPE, 2024–2029 (USD MILLION)
  • TABLE 151 REST OF EUROPE: POWER ELECTRONICS TESTING SERVICES MARKET, BY DEVICE TYPE, 2020–2023 (USD MILLION)
  • TABLE 152 REST OF EUROPE: POWER ELECTRONICS TESTING SERVICES MARKET, BY DEVICE TYPE, 2024–2029 (USD MILLION)
  • TABLE 153 ASIA PACIFIC: POWER ELECTRONICS TESTING SERVICES MARKET, BY APPLICATIONS, 2020–2023 (USD MILLION)
  • TABLE 154 ASIA PACIFIC: POWER ELECTRONICS TESTING SERVICES MARKET, BY END USER, 2024–2029 (USD MILLION)
  • TABLE 155 ASIA PACIFIC: POWER ELECTRONICS TESTING SERVICE MARKET, BY VERTICAL, 2020–2023 (USD MILLION)
  • TABLE 156 ASIA PACIFIC: POWER ELECTRONICS TESTING SERVICE MARKET, BY VERTICAL, 2024–2029 (USD MILLION)
  • TABLE 157 ASIA PACIFIC: POWER ELECTRONICS TESTING SERVICES MARKET, BY COUNTRY, 2020–2023 (USD MILLION)
  • TABLE 158 ASIA PACIFIC: POWER ELECTRONICS TESTING SERVICES MARKET, BY COUNTRY, 2024–2029 (USD MILLION)
  • TABLE 159 CHINA: POWER ELECTRONICS TESTING SERVICES MARKET, BY TECHNOLOGY, 2020–2023 (USD MILLION)
  • TABLE 160 CHINA: POWER ELECTRONICS TESTING SERVICES MARKET, BY TECHNOLOGY, 2024–2029 (USD MILLION)
  • TABLE 161 JAPAN: POWER ELECTRONICS TESTING SERVICES MARKET, BY DEVICE TYPE, 2020–2023 (USD MILLION)
  • TABLE 162 JAPAN: POWER ELECTRONICS TESTING SERVICES MARKET, BY DEVICE TYPE, 2024–2029 (USD MILLION)
  • TABLE 163 INDIA: POWER ELECTRONICS TESTING SERVICES MARKET, BY DEVICE TYPE, 2020–2023 (USD MILLION)
  • TABLE 164 INDIA: POWER ELECTRONICS TESTING SERVICES MARKET, BY DEVICE TYPE, 2024–2029 (USD MILLION)
  • TABLE 165 SOUTH KOREA: POWER ELECTRONICS TESTING SERVICES MARKET, BY DEVICE TYPE, 2020–2023 (USD MILLION)
  • TABLE 166 SOUTH KOREA: POWER ELECTRONICS TESTING SERVICES MARKET, BY DEVICE TYPE, 2024–2029 (USD MILLION)
  • TABLE 167 REST OF ASIA PACIFIC: POWER ELECTRONICS TESTING SERVICES MARKET, BY DEVICE TYPE, 2020–2023 (USD MILLION)
  • TABLE 168 REST OF ASIA PACIFIC: POWER ELECTRONICS TESTING SERVICES MARKET, BY DEVICE TYPE, 2024–2029 (USD MILLION)
  • TABLE 169 ROW: POWER ELECTRONICS TESTING SERVICES MARKET, BY APPLICATION, 2020–2023 (USD MILLION)
  • TABLE 170 ROW: POWER ELECTRONICS TESTING SERVICES MARKET, BY APPLICATION, 2024–2029 (USD MILLION)
  • TABLE 171 ROW: POWER ELECTRONICS TESTING SERVICE MARKET, BY VERTICAL, 2020–2023 (USD MILLION)
  • TABLE 172 ROW: POWER ELECTRONICS TESTING SERVICE MARKET, BY VERTICAL, 2024–2029 (USD MILLION)
  • TABLE 173 ROW: POWER ELECTRONICS TESTING SERVICES MARKET, BY REGION, 2020–2023 (USD MILLION)
  • TABLE 174 ROW: POWER ELECTRONICS TESTING SERVICES MARKET, BY REGION, 2024–2029 (USD MILLION)
  • TABLE 175 SOUTH AMERICA: POWER ELECTRONICS TESTING SERVICES MARKET, BY DEVICE TYPE, 2020–2023 (USD MILLION)
  • TABLE 176 SOUTH AMERICA: POWER ELECTRONICS TESTING SERVICES MARKET, BY DEVICE TYPE, 2024–2029 (USD MILLION)
  • TABLE 177 MIDDLE EAST & AFRICA: POWER ELECTRONICS TESTING SERVICES MARKET, BY DEVICE TYPE, 2020–2023 (USD MILLION)
  • TABLE 178 MIDDLE EAST & AFRICA: POWER ELECTRONICS TESTING SERVICES MARKET, BY DEVICE TYPE, 2024–2029 (USD MILLION)
  • TABLE 179 MIDDLE EAST & AFRICA: POWER ELECTRONICS TESTING SERVICES MARKET, BY REGION, 2020–2023 (USD MILLION)
  • TABLE 180 MIDDLE EAST & AFRICA: POWER ELECTRONICS TESTING SERVICES MARKET, BY REGION, 2024–2029 (USD MILLION)
  • TABLE 181 POWER ELECTRONICS TESTING EQUIPMENT: KEY PLAYER STRATEGIES/RIGHT TO WIN, 2020–2024
  • TABLE 182 POWER ELECTRONICS TESTING SERVICES: KEY PLAYER STRATEGIES/RIGHT TO WIN, 2020–2024
  • TABLE 183 POWER ELECTRONIC TESTING EQUIPMENT MARKET: DEGREE OF COMPETITION, 2023
  • TABLE 184 POWER ELECTRONIC TESTING SERVICES MARKET: DEGREE OF COMPETITION, 2023
  • TABLE 185 POWER ELECTRONIC TESTING MARKET: DEVICE FOOTPRINT
  • TABLE 186 POWER ELECTRONIC TESTING MARKET: TEST EQUIPMENT FOOTPRINT
  • TABLE 187 POWER ELECTRONIC TESTING MARKET: TESTING SERVICES FOOTPRINT
  • TABLE 188 POWER ELECTRONIC TESTING MARKET: VERTICAL FOOTPRINT
  • TABLE 189 POWER ELECTRONIC TESTING MARKET: REGION FOOTPRINT
  • TABLE 190 POWER ELECTRONIC TESTING MARKET: LIST OF KEY STARTUPS/SMES, 2023
  • TABLE 191 POWER ELECTRONIC TESTING MARKET: COMPETITIVE BENCHMARKING OF KEY STARTUPS/SMES
  • TABLE 192 POWER ELECTRONICS TESTING MARKET: PRODUCT LAUNCHES AND DEVELOPMENTS
  • TABLE 193 POWER ELECTRONICS TESTING MARKET : DEALS
  • TABLE 194 POWER ELECTRONICS TESTING MARKET: EXPANSIONS
  • TABLE 195 POWER ELECTRONICS TESTING MARKET: OTHER DEVELOPMENTS
  • TABLE 196 SGS SA: COMPANY OVERVIEW
  • TABLE 197 SGS SA: PRODUCTS/PRODUCTS/SOLUTIONS/SERVICES OFFERED
  • TABLE 198 SGS SA: DEALS
  • TABLE 199 SGS SA: EXPANSIONS
  • TABLE 200 INTERTEK GROUP PLC: COMPANY OVERVIEW
  • TABLE 201 INTERTEK GROUP PLC: PRODUCTS/SOLUTIONS/SERVICES OFFERED
  • TABLE 202 INTERTEK GROUP PLC: DEALS
  • TABLE 203 INTERTEK GROUP PLC: OTHER DEVELOPMENTS
  • TABLE 204 TÜV SÜD: COMPANY OVERVIEW
  • TABLE 205 TÜV SÜD: PRODUCTS/SOLUTIONS/SERVICES OFFERED
  • TABLE 206 TÜV SÜD: EXPANSIONS
  • TABLE 207 TÜV RHEINLAND: COMPANY OVERVIEW
  • TABLE 208 TÜV RHEINLAND: PRODUCTS/SOLUTIONS/SERVICES OFFERED
  • TABLE 209 TÜV RHEINLAND: PRODUCTS/SOLUTIONS/SERVICE LAUNCHES
  • TABLE 210 BUREAU VERITAS: DEALS
  • TABLE 211 EUROFINS SCIENTIFIC: COMPANY OVERVIEW
  • TABLE 212 EUROFINS SCIENTIFIC: PRODUCTS/SOLUTIONS/SERVICES OFFERED
  • TABLE 213 EUROFINS SCIENTIFIC: EXPANSIONS
  • TABLE 214 BUREAU VERITAS: COMPANY OVERVIEW
  • TABLE 215 BUREAU VERITAS: PRODUCTS/SOLUTIONS/SERVICES OFFERED
  • TABLE 216 BUREAU VERITAS: DEALS
  • TABLE 217 TÜV NORD GROUP: COMPANY OVERVIEW
  • TABLE 218 TÜV NORD GROUP: PRODUCTS/SOLUTIONS/SERVICES OFFERED
  • TABLE 219 DEKRA: COMPANY OVERVIEW
  • TABLE 220 DEKRA: PRODUCTS/SOLUTIONS/SERVICES OFFERED
  • TABLE 221 DEKRA: EXPANSIONS
  • TABLE 222 ADVANTEST CORPORATION: COMPANY OVERVIEW
  • TABLE 223 ADVANTEST CORPORATION: PRODUCTS/SOLUTIONS/SERVICES OFFERED
  • TABLE 224 ADVANTEST CORPORATION: PRODUCT LAUNCHES
  • TABLE 225 ADVANTEST CORPORATION: DEALS
  • TABLE 226 TERADYNE INC.: COMPANY OVERVIEW
  • TABLE 227 TERADYNE INC.: PRODUCTS/SOLUTIONS/SERVICES OFFERED
  • TABLE 228 ROHDE & SCHWARZ: COMPANY OVERVIEW
  • TABLE 229 ROHDE & SCHWARZ: PRODUCTS/SOLUTIONS/SERVICES OFFERED
  • TABLE 230 ROHDE & SCHWARZ: PRODUCT LAUNCHES
  • TABLE 231 ROHDE & SCHWARZ: DEALS
  • TABLE 232 KEYSIGHT TECHNOLOGIES: COMPANY OVERVIEW
  • TABLE 233 KEYSIGHT TECHNOLOGIES: PRODUCTS/SOLUTIONS/SERVICES OFFERED
  • TABLE 234 KEYSIGHT TECHNOLOGIES: PRODUCT LAUNCHES
  • TABLE 235 KEYSIGHT TECHNOLOGIES: DEALS
  • TABLE 236 CHROMA ATE INC.: COMPANY OVERVIEW
  • TABLE 237 CHROMA ATE INC.: PRODUCTS/SOLUTIONS/SERVICES OFFERED
  • TABLE 238 NATIONAL INSTRUMENTS CORP.: COMPANY OVERVIEW
  • TABLE 239 NATIONAL INSTRUMENTS CORP.: PRODUCTS/SOLUTIONS/SERVICES OFFERED
  • TABLE 240 NATIONAL INSTRUMENTS CORP.: PRODUCT LAUNCHES
  • TABLE 241 COHU, INC.: COMPANY OVERVIEW
  • TABLE 242 COHU, INC.: PRODUCTS/SOLUTIONS/SERVICES OFFERED
  • TABLE 243 COHU, INC.: PRODUCT LAUNCHES
  • TABLE 244 COHU, INC.: DEALS
LIST OF FIGURES
 
  • FIGURE 1 POWER ELECTRONIC TESTING MARKET SEGMENTATION
  • FIGURE 2 STUDY YEARS CONSIDERED
  • FIGURE 3 POWER ELECTRONICS TESTING MARKET: RESEARCH DESIGN
  • FIGURE 4 KEY DATA FROM SECONDARY SOURCES
  • FIGURE 5 KEY DATA FROM PRIMARY SOURCES
  • FIGURE 6 KEY INDUSTRY INSIGHTS
  • FIGURE 7 BREAKDOWN OF PRIMARY SOURCES, BY COMPANY TYPE, DESIGNATION, AND REGION
  • FIGURE 8 SECONDARY AND PRIMARY RESEARCH
  • FIGURE 9 APPROACH 1 (SUPPLY SIDE): REVENUE GENERATED BY POWER ELECTRONICS TESTING EQUIPMENT PROVIDERS
  • FIGURE 10 APPROACH 1 (SUPPLY SIDE): REVENUE GENERATED BY POWER ELECTRONICS TESTING SERVICE PROVIDERS
  • FIGURE 11 APPROACH 3 (DEMAND SIDE): BOTTOM-UP ESTIMATION BASED ON REGION
  • FIGURE 12 POWER ELECTRONICS TESTING MARKET: BOTTOM-UP APPROACH
  • FIGURE 13 POWER ELECTRONICS TESTING MARKET: TOP-DOWN APPROACH
  • FIGURE 14 DATA TRIANGULATION
  • FIGURE 15 POWER ELECTRONICS TESTING MARKET, 2020–2029 (USD MILLION)
  • FIGURE 16 POWER MODULE ELECTRONICS TESTING TO REGISTER HIGHEST GROWTH RATE DURING FORECAST PERIOD
  • FIGURE 17 TESTING SERVICES TO DOMINATE POWER ELECTRONICS TESTING MARKET BETWEEN 2024 AND 2029
  • FIGURE 18 AUTOMOTIVE & TRANSPORTATION VERTICAL TO ACCOUNT FOR LARGEST MARKET SHARE IN 2029
  • FIGURE 19 ASIA PACIFIC TO RECORD HIGHEST CAGR IN POWER ELECTRONICS TESTING SERVICES MARKET FROM 2024 TO 2029
  • FIGURE 20 INCREASE IN DEMAND FOR CONSUMER ELECTRONICS AND AUTOMOTIVE & TRANSPORTATION VERTICALS TO DRIVE POWER ELECTRONICS TESTING MARKET
  • FIGURE 21 POWER MODULE TESTING TO GROW NOTABLY BETWEEN 2024 AND 2029
  • FIGURE 22 AUTOMOTIVE & TRANSPORTATION TO DOMINATE MARKET FROM 2024 TO 2029
  • FIGURE 23 AUTOMATED TEST EQUIPMENT TO ACCOUNT FOR LARGEST MARKET SHARE IN 2029
  • FIGURE 24 ELECTROMAGNETIC COMPATIBILITY (EMC) TESTING TO ACCOUNT FOR LARGER MARKET SHARE IN 2029
  • FIGURE 25 ASIA PACIFIC TO DOMINATE POWER ELECTRONICS TESTING SERVICES MARKET DURING FORECAST PERIOD
  • FIGURE 26 POWER ELECTRONICS TESTING MARKET: DRIVERS, RESTRAINTS, OPPORTUNITIES, AND CHALLENGES
  • FIGURE 27 GLOBAL BATTERY ELECTRIC VEHICLE (BEV) SALES, 2020–2023 (MILLION UNITS)
  • FIGURE 28 QUARTERLY ELECTRIC CAR SALES BY REGION, 2022-2024 (MILLION UNITS)
  • FIGURE 29 POWER ELECTRONICS TESTING MARKET DRIVERS AND THEIR IMPACT
  • FIGURE 30 POWER ELECTRONICS TESTING MARKET RESTRAINTS AND THEIR IMPACT
  • FIGURE 31 POWER ELECTRONICS TESTING MARKET OPPORTUNITIES AND THEIR IMPACT
  • FIGURE 32 POWER ELECTRONICS TESTING MARKET CHALLENGES AND THEIR IMPACT
  • FIGURE 33 REVENUE SHIFT AND NEW REVENUE POCKETS FOR POWER ELECTRONICS TESTING MARKET PLAYERS
  • FIGURE 34 AVERAGE SELLING PRICE OF POWER ELECTRONICS TEST EQUIPMENT OFFERED BY KEY TEST EQUIPMENT PROVIDERS, 2023 (USD)
  • FIGURE 35 AVERAGE SELLING PRICE OF AUTOMATED TEST EQUIPMENT OFFERED BY TEST EQUIPMENT PROVIDERS, 2020–2023 (USD MILLION)
  • FIGURE 36 AVERAGE SELLING PRICE OF NETWORK ANALYZER OFFERED BY TEST EQUIPMENT PROVIDERS, 2020–2023 (USD)
  • FIGURE 37 AVERAGE SELLING PRICE OF SIGNAL ANALYZER OFFERED BY TEST EQUIPMENT PROVIDERS, 2020–2023 (USD)
  • FIGURE 38 AVERAGE SELLING PRICE OF POWER ELECTRONICS TEST EQUIPMENT, BY REGION, 2020–2023 (USD)
  • FIGURE 39 POWER ELECTRONICS TESTING MARKET: SUPPLY CHAIN ANALYSIS
  • FIGURE 40 POWER ELECTRONICS TESTING MARKET: KEY PLAYERS IN ECOSYSTEM
  • FIGURE 41 INVESTMENT AND FUNDING SCENARIO
  • FIGURE 42 NUMBER OF PATENTS GRANTED FROM 2012 TO 2022 FOR POWER ELECTRONICS MARKET
  • FIGURE 43 IMPORT DATA FOR HS CODE 8541- SEMICONDUCTOR DEVICES FOR KEY COUNTRIES, 2020–2023
  • FIGURE 44 EXPORT DATA FOR HS CODE 8541 - SEMICONDUCTOR DEVICES FOR KEY COUNTRIES, 2020–2023
  • FIGURE 45 POWER ELECTRONICS TESTING MARKET: PORTER’S FIVE FORCES ANALYSIS–2023
  • FIGURE 46 INFLUENCE OF STAKEHOLDERS ON BUYING PROCESS, BY VERTICAL
  • FIGURE 47 BUYING CRITERIA FOR TOP THREE VERTICALS
  • FIGURE 48 ADOPTION OF GEN AI IN VERTICAL FARMING
  • FIGURE 49 TESTING SERVICES TO ACCOUNT FOR LARGER MARKET SHARE DURING FORECAST PERIOD
  • FIGURE 50 AUTOMATED TEST EQUIPMENT TO ACCOUNT FOR LARGER MARKET SHARE DURING FORECAST PERIOD
  • FIGURE 51 HYDROGEN PERMEATION AND COMPATIBILITY TEST TO ACCOUNT FOR LARGER MARKET SHARE DURING FORECAST PERIOD
  • FIGURE 52 POWER MODULE SEGMENT TO GROW AT HIGHEST GROWTH RATE DURING FORECAST PERIOD
  • FIGURE 53 AUTOMOTIVE & TRANSPORTATION VERTICAL TO ACCOUNT FOR LARGER MARKET SHARE DURING FORECAST PERIOD
  • FIGURE 54 POWER ELECTRONICS TESTING SERVICES MARKET SEGMENTATION, BY REGION
  • FIGURE 55 INDIA TO EXHIBIT HIGHEST CAGR IN POWER ELECTRONICS TESTING SERVICES MARKET DURING FORECAST PERIOD
  • FIGURE 56 ASIA PACIFIC TO RECORD HIGHEST GROWTH RATE POWER ELECTRONICS TESTING SERVICES MARKET DURING FORECAST PERIOD
  • FIGURE 57 NORTH AMERICA: POWER ELECTRONICS TESTING SERVICES MARKET SNAPSHOT
  • FIGURE 58 EUROPE: POWER ELECTRONICS TESTING SERVICES MARKET SNAPSHOT
  • FIGURE 59 ASIA PACIFIC: POWER ELECTRONICS TESTING SERVICES MARKET SNAPSHOT
  • FIGURE 60 POWER ELECTRONICS TESTING EQUIPMENT MARKET: REVENUE ANALYSIS OF FIVE KEY PLAYERS, 2020–2023
  • FIGURE 61 POWER ELECTRONICS TESTING SERVICES MARKET: REVENUE ANALYSIS OF FIVE KEY PLAYERS, 2020–2023 (USD MILLION)
  • FIGURE 62 POWER ELECTRONIC TESTING EQUIPMENT MARKET SHARE ANALYSIS, 2023
  • FIGURE 63 POWER ELECTRONIC TESTING SERVICES MARKET SHARE ANALYSIS, 2023
  • FIGURE 64 POWER ELECTRONICS TESTING SERVICES MARKET: COMPANY VALUATION, 2024 (USD BILLION)
  • FIGURE 65 TESTING EQUIPMENT: COMPANY VALUATION, 2024 (USD BILLION)
  • FIGURE 66 POWER ELECTRONICS TESTING SERVICES MARKET: FINANCIAL METRICS, 2024 (EV/EBITDA)
  • FIGURE 67 TESTING EQUIPMENT: FINANCIAL METRICS, 2024 (EV/EBITDA)
  • FIGURE 68 BRAND/PRODUCT COMPARISON: TESTING SERVICES
  • FIGURE 69 BRAND/PRODUCT COMPARISON: TEST EQUIPMENT
  • FIGURE 70 POWER ELECTRONIC TESTING SERVICES MARKET: COMPANY EVALUATION MATRIX (KEY PLAYERS), 2023
  • FIGURE 71 POWER ELECTRONIC TEST EQUIPMENT MARKET: COMPANY EVALUATION MATRIX (KEY PLAYERS), 2023
  • FIGURE 72 POWER ELECTRONIC TESTING MARKET: COMPANY FOOTPRINT
  • FIGURE 73 POWER ELECTRONIC TESTING: COMPANY EVALUATION MATRIX (STARTUPS/SMES), 2023
  • FIGURE 74 SGS SA: COMPANY SNAPSHOT
  • FIGURE 75 INTERTEK GROUP PLC: COMPANY SNAPSHOT
  • FIGURE 76 TÜV SÜD: COMPANY SNAPSHOT
  • FIGURE 77 TÜV RHEINLAND: COMPANY SNAPSHOT
  • FIGURE 78 EUROFINS SCIENTIFIC: COMPANY SNAPSHOT
  • FIGURE 79 BUREAU VERITAS: COMPANY SNAPSHOT
  • FIGURE 80 TÜV NORD GROUP: COMPANY SNAPSHOT
  • FIGURE 81 DEKRA: COMPANY SNAPSHOT
  • FIGURE 82 ADVANTEST CORPORATION: COMPANY SNAPSHOT
  • FIGURE 83 TERADYNE INC.: COMPANY SNAPSHOT
  • FIGURE 84 KEYSIGHT TECHNOLOGIES: COMPANY SNAPSHOT
  • FIGURE 85 CHROMA ATE INC.: COMPANY SNAPSHOT
  • FIGURE 86 COHU, INC.: COMPANY SNAPSHOT

The research study involved 4 major activities in estimating the size of the power electronics testing market. Exhaustive secondary research has been done to collect important information about the market and peer markets. The validation of these findings, assumptions, and sizing with the help of primary research with industry experts across the value chain has been the next step. Both top-down and bottom-up approaches have been used to estimate the market size. Post which the market breakdown and data triangulation have been adopted to estimate the market sizes of segments and sub-segments.

Secondary Research

In the secondary research process, various secondary sources have been referred to for identifying and collecting information required for this study. The secondary sources include annual reports, press releases, investor presentations of companies, white papers, and articles from recognized authors. Secondary research has been mainly done to obtain key information about the market’s value chain, the pool of key market players, market segmentation according to industry trends, regional outlook, and developments from both market and technology perspectives.

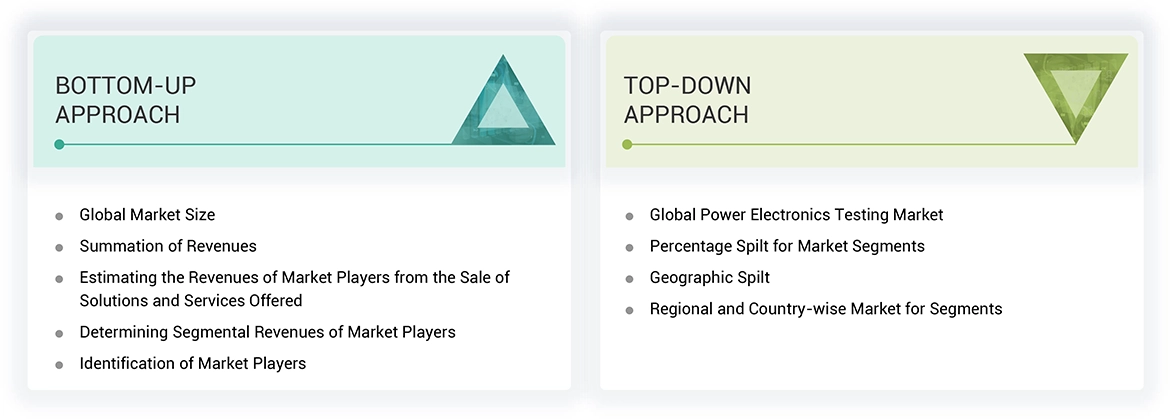
In the power electronics testing market report, the global market size has been estimated using both the top-down and bottom-up approaches, along with several other dependent submarkets. The major players in the market were identified using extensive secondary research, and their presence in the market was determined using secondary and primary research. All the percentage shares splits, and breakdowns have been determined using secondary sources and verified through primary sources.

Primary Research

Extensive primary research has been conducted after understanding the power electronics testing market scenario through secondary research. Several primary interviews have been conducted with key opinion leaders from both demand- and supply-side vendors across 4 major regions— North America, Europe, Asia Pacific, and the Rest of the World. Approximately 25% of the primary interviews have been conducted with the demand-side vendors and 75% with the supply-side vendors. Primary data has been collected mainly through telephonic interviews, which consist of 80% of the total primary interviews; questionnaires and emails have also been used to collect the data.

After successful interaction with industry experts, brief sessions were conducted with highly experienced independent consultants to reinforce the findings of our primary research. This, along with the in-house subject matter experts’ opinions, has led us to the findings as described in the report. The breakdown of primary respondents is as follows:

power electronic market Size, and Share

About the assumptions considered for the study, To know download the pdf brochure

Market Size Estimation

In the market engineering process, both top-down and bottom-up approaches, along with data triangulation methods, have been used to estimate and validate the size of the power electronics testing and other dependent submarkets. The research methodology used to estimate the market sizes includes the following:

  • Identifying top-line investments and spending in the ecosystem and considering segment-level splits and major market developments
  • Identifying different stakeholders in the power electronics testing market that influence the entire market, along with participants across the supply chain
  • Analyzing major manufacturers and service providers in the power electronics testing market and studying their solutions and service portfolios
  • Analyzing trends related to the adoption of power electronics testing solutions and services
  • Tracking recent and upcoming market developments, including investments, R&D activities, solution and service launches, collaborations, acquisitions, and partnerships, as well as forecasting the market size based on these developments and other critical parameters
  • Carrying out multiple discussions with key opinion leaders to identify the adoption trends of power electronics testing solutions and services
  • Segmenting the overall market into various other market segments
  • Validating the estimates at every level through discussions with key opinion leaders, such as chief executives (CXOs), directors, and operation managers, and finally with the domain experts at MarketsandMarkets

Power Electronic Market : Top-Down and Bottom-Up Approach

power electronic market Top Down and Bottom Up Approach

Data Triangulation

After arriving at the overall market size—using the market size estimation processes as explained above—the market has been split into several segments and subsegments. To complete the entire market engineering process and arrive at the exact statistics of each market segment and subsegment, data triangulation and market breakdown procedures have been employed, wherever applicable. The data has been triangulated by studying various factors and trends from the demand and supply sides in the power electronics testing market.

Market Definition

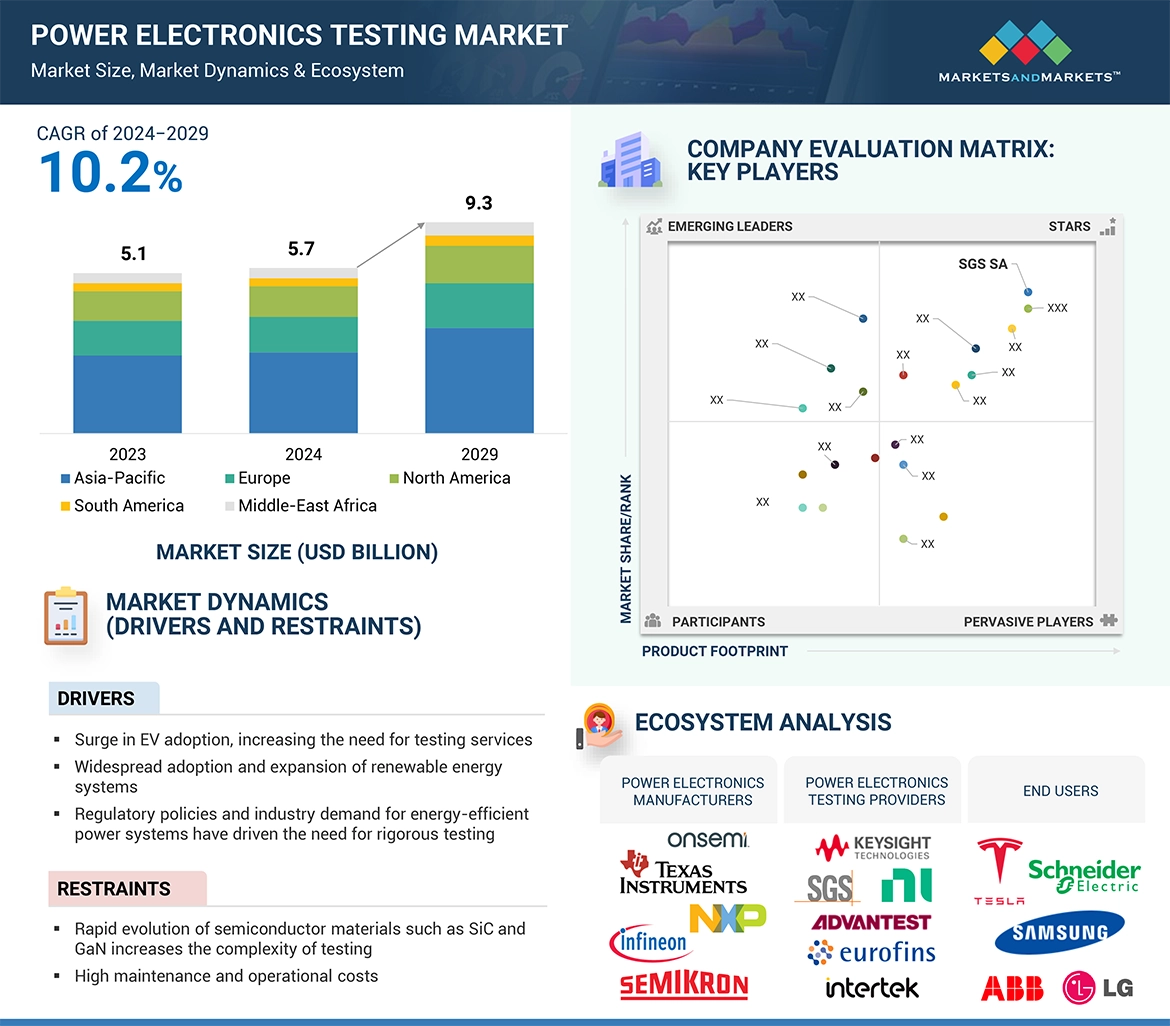
Power electronics is the application of solid-state electronics, in which electric power is converted from one form to another and controlled effectively and efficiently. This conversion is performed using semiconductor devices such as diodes, thyristors, MOSFETs, and IGBTs. Currently, most electrical and electromechanical devices are integrated with power circuits wherein such semiconductor devices are utilized. Power electronics has a wide range of applications in the automotive and transportation, industrial, renewable energy, and consumer electronics sectors. The power electronics testing market encompasses a range of products and services designed to evaluate the performance, durability, and reliability of power electronic devices such as converters, inverters, and power management systems. This market is driven by the increasing demand for efficient energy conversion in sectors like automotive (electric vehicles), renewable energy, and industrial applications. Key testing types include functional testing, which ensures that devices perform their intended functions under normal conditions; reliability testing, which assesses the device’s lifespan under stress or extreme conditions; thermal testing to monitor temperature performance; and electromagnetic compatibility (EMC) testing, which checks for interference issues. Additionally, electrical safety testing is performed to ensure compliance with regulatory standards.

Key Stakeholders

  • Raw Material Suppliers
  • Test Equipment Manufacturers
  • Service Providers
  • Device Manufacturers
  • Network Operators
  • Research and Development Organizations
  • Government and Regulatory Bodies
  • Industry Associations
  • System Integrators
  • Component Suppliers
  • Certification Bodies

Report Objectives

  • To define, describe, segment, and forecast the power electronic testing market, offering, device type, and vertical, in terms of value
  • To describe and forecast the market for various segments, with respect to four main regions, namely, North America, Europe, Asia Pacific, and the Rest of the World (RoW), in terms of value
  • To provide detailed information regarding drivers, restraints, opportunities, and challenges influencing the growth of the power electronic testing market
  • To provide a detailed overview of the power electronic testing market’s supply chain, along with the ecosystem, technology trends, use cases, regulatory environment, and porter’s five forces analysis for the market
  • To analyze industry trends, pricing data, patents and innovations, and trade data (export and import data) related to the power electronic testing.
  • To strategically analyze the micromarkets1 with respect to individual growth trends, prospects, and contributions to the total market
  • To strategically profile the key players and comprehensively analyze their market share and core competencies2
  • To analyze opportunities for stakeholders and provide a detailed competitive landscape of the market
  • To analyze competitive developments, such as product launches/developments, collaborations, partnerships, acquisitions, and research & development (R&D) activities, carried out by players in the power electronic testing market
  • To profile key players in the power electronic testing market and comprehensively analyze their market ranking based on their revenue, market share, and core competencies

Available Customizations

With the given market data, MarketsandMarkets offers customizations according to the specific requirements of companies. The following customization options are available for the report:

  • Detailed analysis and profiling of additional market players based on various blocks of the supply chain

Previous Versions of this Report

Custom Market Research Services

We Will Customise The Research For You, In Case The Report Listed Above Does Not Meet With Your Requirements

Get 10% Free Customisation

Growth opportunities and latent adjacency in Power Electronic Market

DMCA.com Protection Status