TABLE OF CONTENTS
1 INTRODUCTION (Page No. - 22)
1.1 STUDY OBJECTIVES
1.2 MARKET DEFINITION
1.2.1 INCLUSIONS AND EXCLUSIONS
1.3 STUDY SCOPE
1.3.1 MARKET SEGMENTATION
1.3.2 REGIONS COVERED
1.3.3 YEARS CONSIDERED
1.4 CURRENCY CONSIDERED
1.5 UNITS CONSIDERED
1.6 LIMITATIONS
1.7 STAKEHOLDERS
1.8 SUMMARY OF CHANGES
2 RESEARCH METHODOLOGY (Page No. - 27)
2.1 RESEARCH DATA
2.1.1 SECONDARY DATA
2.1.1.1 Key data from secondary sources
2.1.2 PRIMARY DATA
2.1.2.1 Key primary participants
2.1.2.2 Breakdown of primary interviews
2.1.2.3 Key industry insights
2.2 MARKET ESTIMATION
2.2.1 TOP-DOWN APPROACH
2.2.2 BOTTOM-UP APPROACH
2.3 BASE NUMBER CALCULATION
2.3.1 DEMAND-SIDE APPROACH
2.3.2 SUPPLY-SIDE APPROACH
2.4 MARKET FORECAST APPROACH
2.4.1 SUPPLY SIDE
2.4.2 DEMAND SIDE
2.5 DATA TRIANGULATION
2.6 ASSUMPTIONS
2.7 FACTOR ANALYSIS
2.8 RESEARCH LIMITATIONS
2.8.1 RECESSION IMPACT
3 EXECUTIVE SUMMARY (Page No. - 36)
4 PREMIUM INSIGHTS (Page No. - 40)
4.1 ATTRACTIVE OPPORTUNITIES FOR PLAYERS IN POLYOXYMETHYLENE MARKET
4.2 ASIA PACIFIC: POLYOXYMETHYLENE MARKET, BY END-USE INDUSTRY & COUNTRY
4.3 POLYOXYMETHYLENE MARKET, BY END-USE INDUSTRY
4.4 POLYOXYMETHYLENE MARKET, BY PROCESSING TECHNIQUE
4.5 POLYOXYMETHYLENE MARKET, BY TYPE
4.6 POLYOXYMETHYLENE MARKET, BY GRADE
4.7 POLYOXYMETHYLENE MARKET, BY COUNTRY
5 MARKET OVERVIEW (Page No. - 44)
5.1 INTRODUCTION
5.2 MARKET DYNAMICS
5.2.1 DRIVERS
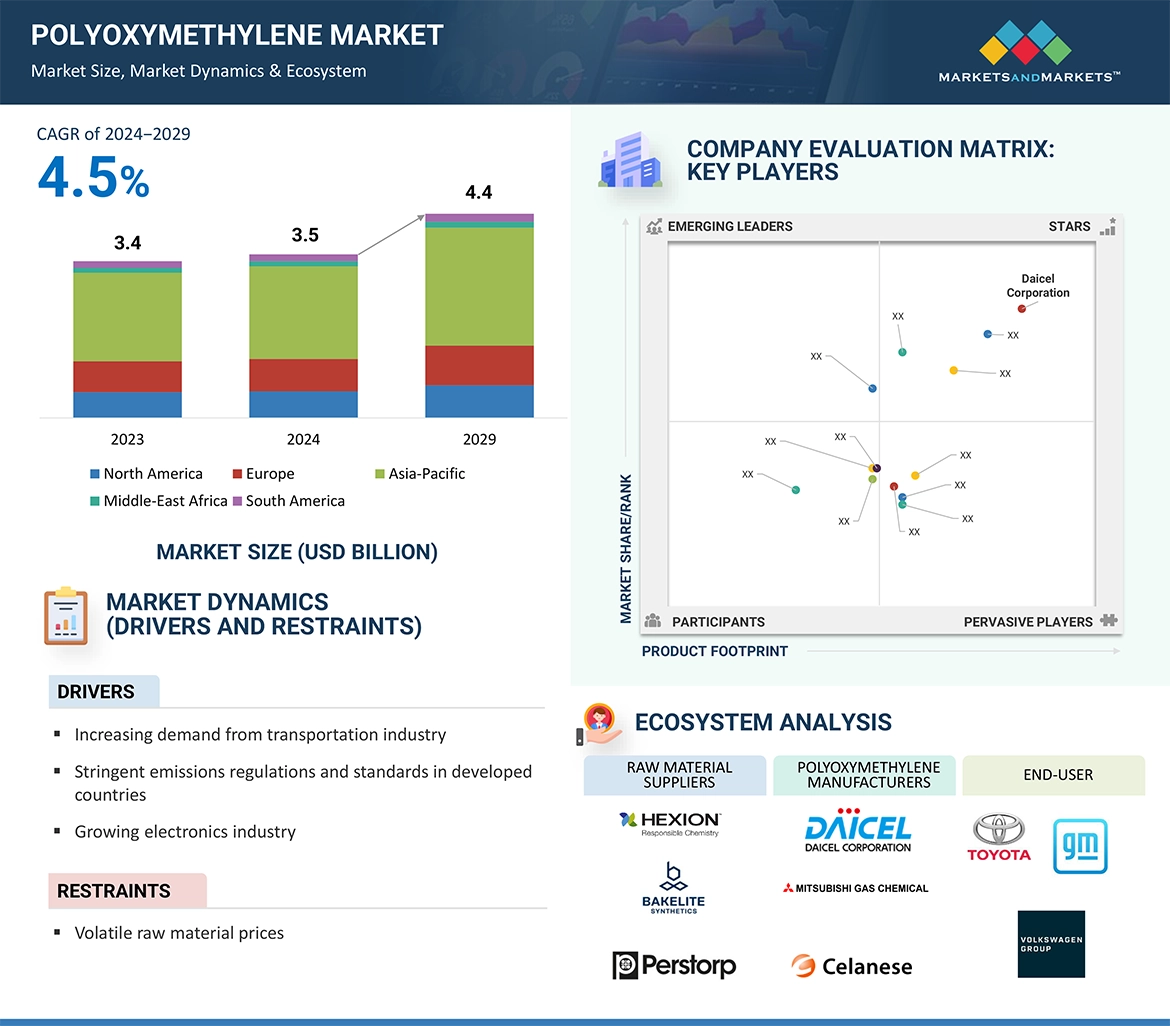
5.2.1.1 Increasing demand from transportation industry
5.2.1.2 Stringent emission regulations and standards in developed countries
5.2.1.3 Growing electronics industry
5.2.2 RESTRAINTS
5.2.2.1 Volatile raw material prices
5.2.3 OPPORTUNITIES
5.2.3.1 Rising demand from healthcare sector
5.2.4 CHALLENGES
5.2.4.1 Slow crystallization rate of polyoxymethylene
6 INDUSTRY TRENDS (Page No. - 48)
6.1 PORTER'S FIVE FORCES ANALYSIS
6.1.1 THREAT OF NEW ENTRANTS
6.1.2 THREAT OF SUBSTITUTES
6.1.3 BARGAINING POWER OF SUPPLIERS
6.1.4 BARGAINING POWER OF BUYERS
6.1.5 INTENSITY OF COMPETITIVE RIVALRY
6.2 VALUE CHAIN ANALYSIS
6.3 TRADE ANALYSIS
6.3.1 EXPORT SCENARIO OF POLYOXYMETHYLENE
6.3.2 IMPORT SCENARIO OF POLYOXYMETHYLENE
6.4 MACROECONOMIC OVERVIEW
6.4.1 GLOBAL GDP OUTLOOK
6.4.2 TRENDS IN ELECTRIC VEHICLES INDUSTRY
6.5 TARIFF AND REGULATORY LANDSCAPE
6.5.1 TARIFF RELATED TO POLYOXYMETHYLENE MARKET
6.5.2 REGULATORY BODIES, GOVERNMENT AGENCIES, AND OTHER ORGANIZATIONS
6.6 CASE STUDY ANALYSIS
6.7 TRENDS AND DISRUPTIONS IMPACTING CUSTOMER BUSINESS
6.8 KEY CONFERENCES & EVENTS
6.9 TECHNOLOGY ANALYSIS
6.9.1 KEY TECHNOLOGIES
6.9.1.1 Material extrusion (MEX)
6.9.1.2 Injection molding
6.9.1.3 Extrusion
6.9.2 COMPLIMENTARY TECHNOLOGIES
6.9.2.1 Nanocomposites
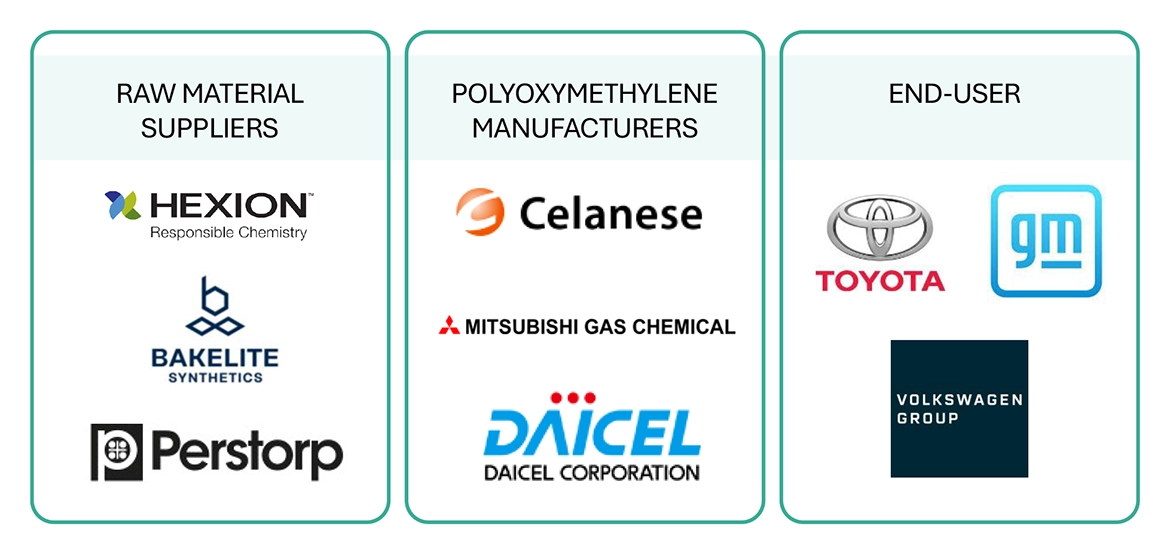
6.10 ECOSYSTEM ANALYSIS
6.11 KEY STAKEHOLDERS & BUYING CRITERIA
6.11.1 KEY STAKEHOLDERS IN BUYING PROCESS
6.11.2 BUYING CRITERIA
6.12 PATENT ANALYSIS
6.12.1 INTRODUCTION
6.12.2 METHODOLOGY
6.13 PRICING ANALYSIS
6.13.1 AVERAGE SELLING PRICE TREND OF KEY PLAYERS, BY TYPE
6.13.2 AVERAGE SELLING PRICE TREND, BY REGION
6.14 INVESTMENT AND FUNDING SCENARIO
7 POLYOXYMETHYLENE MARKET, BY GRADE (Page No. - 73)
7.1 INTRODUCTION
7.2 LOW FRICTION
7.2.1 DEMAND FOR LOW FRICTION GRADE OF POLYOXYMETHYLENE DRIVEN BY ITS GOOD MECHANICAL AND ELECTROMECHANICAL PROPERTIES
7.3 LOW VOC
7.3.1 RISING ENVIRONMENTAL CONCERNS TO PROMOTE USE OF LOW-VOC GRADE
7.4 CONDUCTIVE
7.4.1 CONDUCTIVE GRADE WIDELY USED IN ELECTRICAL AND SEMICONDUCTOR APPLICATIONS
7.5 ANTI-STATIC
7.5.1 INCREASING PRODUCTION OF ELECTRONIC COMPONENTS TO DRIVE DEMAND
7.6 OTHER GRADES
8 POLYOXYMETHYLENE MARKET, BY PROCESSING TECHNIQUE (Page No. - 77)
8.1 INTRODUCTION
8.2 INJECTION MOLDING
8.2.1 RISING AUTOMOTIVE PRODUCTION TO DRIVE DEMAND
8.3 EXTRUSION
8.3.1 EFFICIENCY AND COST-EFFECTIVE PROPERTIES OF EXTRUSION PROCESS TO SUPPORT MARKET GROWTH
8.4 COMPRESSION MOLDING
8.4.1 INCREASING DEMAND FROM ELECTRONIC INDUSTRY TO BOOST DEMAND
8.5 OTHER PROCESSING TECHNIQUES
9 POLYOXYMETHYLENE MARKET, BY TYPE (Page No. - 81)
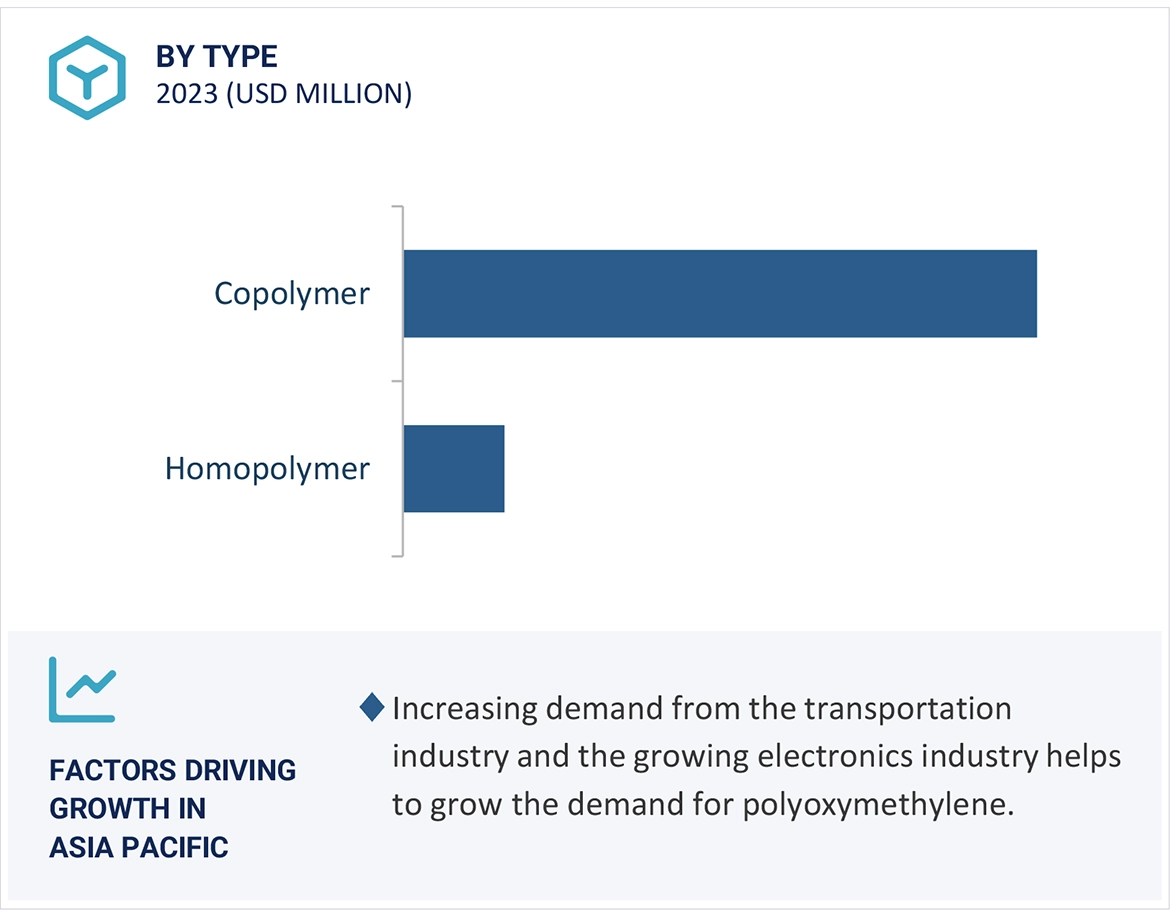
9.1 INTRODUCTION
9.2 HOMOPOLYMER
9.2.1 OFFERS SUPERIOR MECHANICAL PROPERTIES AND RIGIDITY
9.3 COPOLYMER
9.3.1 ENHANCED THERMAL STABILITY AND CHEMICAL RESISTANCE TO DRIVE DEMAND
10 POLYOXYMETHYLENE MARKET, BY END-USE INDUSTRY (Page No. - 84)
10.1 INTRODUCTION
10.2 TRANSPORTATION
10.2.1 INCREASING DEMAND FOR ELECTRIC VEHICLES TO DRIVE DEMAND
10.3 ELECTRICAL & ELECTRONICS
10.3.1 GROWING ELECTRONICS INDUSTRY TO FUEL MARKET FOR POLYOXYMETHYLENE
10.4 INDUSTRIAL
10.4.1 EXCELLENT MECHANICAL PROPERTIES FOR USE IN INDUSTRIAL GOODS TO FUEL DEMAND
10.5 CONSUMER
10.5.1 GROWING SUSTAINABILITY CONCERNS TO SUPPORT MARKET GROWTH
10.6 OTHER END-USE INDUSTRIES
11 POLYOXYMETHYLENE MARKET, BY REGION (Page No. - 88)
11.1 INTRODUCTION
11.2 NORTH AMERICA
11.2.1 IMPACT OF RECESSION
11.2.2 US
11.2.2.1 Growth of automotive industries to drive demand
11.2.3 CANADA
11.2.3.1 Growing automotive sector to support market growth
11.2.4 MEXICO
11.2.4.1 Investments in automotive industry to boost market growth
11.3 ASIA PACIFIC
11.3.1 RECESSION IMPACT
11.3.2 CHINA
11.3.2.1 Strong growth of automotive sector to drive market
11.3.3 JAPAN
11.3.3.1 Stringent emission standards to support market growth
11.3.4 INDIA
11.3.4.1 Government initiatives to drive demand for polyoxymethylene
11.3.5 SOUTH KOREA
11.3.5.1 Automobile manufacturing and increasing foreign investment to propel market
11.3.6 TAIWAN
11.3.6.1 Government initiatives to support market growth
11.3.7 REST OF ASIA PACIFIC
11.4 EUROPE
11.4.1 RECESSION IMPACT
11.4.2 GERMANY
11.4.2.1 Growing automotive and electronics sectors to drive market
11.4.3 UK
11.4.3.1 Growing electric vehicle penetration to meet vehicle emission targets to support market growth
11.4.4 FRANCE
11.4.4.1 Government initiatives and growing automotive industry to boost demand
11.4.5 ITALY
11.4.5.1 Government initiatives in transportation and electronics industries to propel demand
11.4.6 SPAIN
11.4.6.1 Automotive industry to impact growth of polyoxymethylene market
11.4.7 RUSSIA
11.4.7.1 Growing electronics industry to support market growth
11.4.8 REST OF EUROPE
11.5 MIDDLE EAST & AFRICA
11.5.1 RECESSION IMPACT
11.5.2 GCC COUNTRIES
11.5.2.1 Government initiatives for vehicle electrification to propel demand
11.5.2.2 Saudi Arabia
11.5.2.2.1 Growing automotive industry to drive demand for polyoxymethylene
11.5.2.3 UAE
11.5.2.3.1 Growing adoption of electric vehicles (EVs) to drive market
11.5.2.4 Rest of GCC
11.5.3 TURKEY
11.5.3.1 Investments in automotive industry to support market growth
11.5.4 SOUTH AFRICA
11.5.4.1 Growing automotive vehicle production to support market growth
11.5.5 REST OF MIDDLE EAST & AFRICA
11.6 SOUTH AMERICA
11.6.1 RECESSION IMPACT
11.6.2 BRAZIL
11.6.2.1 Growing automotive industry to fuel demand
11.6.3 ARGENTINA
11.6.3.1 Automotive industry to drive demand
11.6.4 REST OF SOUTH AMERICA
12 COMPETITIVE LANDSCAPE (Page No. - 137)
12.1 OVERVIEW
12.2 REVENUE ANALYSIS
12.3 MARKET SHARE ANALYSIS
12.4 MARKET RANKING ANALYSIS
12.5 COMPANY VALUATION AND FINANCIAL METRICS
12.6 PRODUCT/BRAND COMPARISON
12.7 COMPANY EVALUATION MATRIX: KEY PLAYERS, 2023
12.7.1 STARS
12.7.2 EMERGING LEADERS
12.7.3 PERVASIVE PLAYERS
12.7.4 PARTICIPANTS
12.7.5 COMPANY FOOTPRINT: KEY PLAYERS
12.8 START-UPS/SMES EVALUATION MATRIX, 2022
12.8.1 PROGRESSIVE COMPANIES
12.8.2 RESPONSIVE COMPANIES
12.8.3 DYNAMIC COMPANIES
12.8.4 STARTING BLOCKS
12.9 COMPETITIVE BENCHMARKING
12.10 COMPETITIVE SCENARIO AND TRENDS
12.10.1 PRODUCT LAUNCHES
12.10.2 DEALS
12.10.3 EXPANSIONS
12.10.4 OTHER DEVELOPMENTS
13 COMPANY PROFILES (Page No. - 157)
13.1 KEY PLAYERS
13.1.1 CELANESE CORPORATION
13.1.1.1 Business overview
13.1.1.2 Products/Solutions/Services offered
13.1.1.3 Recent developments
13.1.1.4 MnM view
13.1.1.4.1 Right to win
13.1.1.4.2 Strategic choices
13.1.1.4.3 Weaknesses & competitive threats
13.1.2 KOREA ENGINEERING PLASTICS CO., LTD. (KEP)
13.1.2.1 Business overview
13.1.2.2 Products/Solutions/Services offered
13.1.2.3 MnM view
13.1.2.3.1 Right to win
13.1.2.3.2 Strategic choices
13.1.2.3.3 Weaknesses & competitive threats
13.1.3 DAICEL CORPORATION
13.1.3.1 Business overview
13.1.3.2 Products/Solutions/Services offered
13.1.3.3 Recent developments
13.1.3.4 MnM view
13.1.3.4.1 Right to win
13.1.3.4.2 Strategic choices
13.1.3.4.3 Weaknesses & competitive threats
13.1.4 BASF GROUP
13.1.4.1 Business overview
13.1.4.2 Products/Solutions/Services offered
13.1.4.3 Recent developments
13.1.4.4 MnM view
13.1.4.4.1 Right to win
13.1.4.4.2 Strategic choices
13.1.4.4.3 Weaknesses & competitive threats
13.1.5 ASAHI KASEI CORPORATION
13.1.5.1 Business overview
13.1.5.2 Products/Solutions/Services offered
13.1.5.3 MnM view
13.1.5.3.1 Right to win
13.1.5.3.2 Strategic choices
13.1.5.3.3 Weaknesses & competitive threats
13.1.6 LG CHEM
13.1.6.1 Business overview
13.1.6.2 Products/Solutions/Services offered
13.1.6.3 MnM view
13.1.7 SABIC
13.1.7.1 Business overview
13.1.7.2 Products/Solutions/Services offered
13.1.7.3 MnM view
13.1.8 MITSUBISHI GAS CHEMICAL COMPANY, INC.
13.1.8.1 Business overview
13.1.8.2 Products/Solutions/Services offered
13.1.8.3 Recent developments
13.1.8.4 MnM view
13.1.9 LYONDELLBASELL INDUSTRIES HOLDINGS B.V.
13.1.9.1 Business overview
13.1.9.2 Products/Solutions/Services offered
13.1.9.3 MnM view
13.1.10 DUPONT DE NEMOURS INC.
13.1.10.1 Business overview
13.1.10.2 Products/Solutions/Services offered
13.1.10.3 MnM view
13.1.11 CHINA BLUECHEMICAL LTD.
13.1.11.1 Business overview
13.1.11.2 Products/Solutions/Services offered
13.1.11.3 MnM view
13.1.12 KOLON ENP
13.1.12.1 Business overview
13.1.12.2 Products/Solutions/Services offered
13.1.12.3 MnM view
13.1.13 HENAN ENERGY GROUP CO., LTD.
13.1.13.1 Business overview
13.1.13.2 Products/Solutions/Services offered
13.1.13.3 MnM view
13.2 OTHER PLAYERS
13.2.1 WESTLAKE PLASTICS
13.2.2 YUNTIANHUA GROUP CO., LTD.
13.2.3 BARLOG PLASTICS GMBH
13.2.4 FORMOSA PLASTICS GROUP
13.2.5 ENSINGER
13.2.6 EUROTEC ENGINEERING PLASTICS
13.2.7 GEHR
13.2.8 GLS POLYMERS PVT LTD.
13.2.9 REPOL
13.2.10 GUJARAT PETROSYNTHESE LIMITED
13.2.11 LICHARZ GMBH
13.2.12 POLYMER INDUSTRIES LLC
13.2.13 SAX POLYMERS
13.2.14 SINOPLAST GROUP LIMITED
13.2.15 TISAN ENGINEERING PLASTICS
14 ADJACENT MARKET (Page No. - 201)
14.1 INTRODUCTION
14.2 MICRO INJECTION MOLDED PLASTIC MARKET
15 APPENDIX (Page No. - 203)
15.1 DISCUSSION GUIDE
15.2 KNOWLEDGESTORE: MARKETSANDMARKETS’ SUBSCRIPTION PORTAL
15.3 CUSTOMIZATION OPTIONS
15.4 RELATED REPORTS
15.5 AUTHOR DETAILS
LIST OF TABLES (189 TABLES)
TABLE 1 GLOBAL AUTOMOTIVE VEHICLE PRODUCTION, BY REGION, 2019–2021 (MILLION UNITS)
TABLE 2 POLYOXYMETHYLENE MARKET: PORTER'S FIVE FORCES ANALYSIS
TABLE 3 WORLD GDP GROWTH PROJECTION, 2019–2026 (USD BILLION)
TABLE 4 AVERAGE TARIFF RATES, BY COUNTRY
TABLE 5 NORTH AMERICA: LIST OF REGULATORY BODIES, GOVERNMENT AGENCIES, AND OTHER ORGANIZATIONS
TABLE 6 EUROPE: LIST OF REGULATORY BODIES, GOVERNMENT AGENCIES, AND OTHER ORGANIZATIONS
TABLE 7 ASIA PACIFIC: LIST OF REGULATORY BODIES, GOVERNMENT AGENCIES, AND OTHER ORGANIZATIONS
TABLE 8 REST OF WORLD: LIST OF REGULATORY BODIES, GOVERNMENT AGENCIES, AND OTHER ORGANIZATIONS
TABLE 9 CRYSTAL NUCLEATION OF POM/ACETAL
TABLE 10 LASER MARKING OF ENGINEERING THERMOPLASTICS: POLYOXYMETHYLENE (POM) CASE STUDY
TABLE 11 LIFETIME PREDICTION OF PLASTIC PARTS
TABLE 12 POLYOXYMETHYLENE MARKET: DETAILED LIST OF CONFERENCES & EVENTS, 2024–2025
TABLE 13 POLYOXYMETHYLENE MARKET: ROLE IN ECOSYSTEM
TABLE 14 INFLUENCE OF STAKEHOLDERS IN BUYING PROCESS FOR TOP TWO END-USE INDUSTRIES (%)
TABLE 15 KEY BUYING CRITERIA FOR POLYOXYMETHYLENE FOR TOP TWO END-USE INDUSTRIES
TABLE 16 LIST OF PATENTS IN POLYOXYMETHYLENE MARKET, 2022–2023
TABLE 17 AVERAGE SELLING PRICE TREND OF KEY PLAYERS, BY TYPE (USD/KG)
TABLE 18 AVERAGE SELLING PRICE TREND, BY REGION, 2023–2029 (USD/KG)
TABLE 19 POLYOXYMETHYLENE MARKET SIZE, BY GRADE, 2022–2029 (USD MILLION)
TABLE 20 POLYOXYMETHYLENE MARKET SIZE, BY GRADE, 2022–2029 (KILOTON)
TABLE 21 POLYOXYMETHYLENE MARKET SIZE, BY PROCESSING TECHNIQUE, 2022–2029 (USD MILLION)
TABLE 22 POLYOXYMETHYLENE MARKET SIZE, BY PROCESSING TECHNIQUE, 2022–2029 (KILOTON)
TABLE 23 POLYOXYMETHYLENE MARKET SIZE, BY TYPE, 2022–2029 (USD MILLION)
TABLE 24 POLYOXYMETHYLENE MARKET SIZE, BY TYPE, 2022–2029 (KILOTON)
TABLE 25 POLYOXYMETHYLENE MARKET SIZE, BY END-USE INDUSTRY, 2022–2029 (USD MILLION)
TABLE 26 POLYOXYMETHYLENE MARKET SIZE, BY END-USE INDUSTRY, 2022–2029 (KILOTON)
TABLE 27 POLYOXYMETHYLENE MARKET SIZE, BY REGION, 2022–2029 (USD MILLION)
TABLE 28 POLYOXYMETHYLENE MARKET SIZE, BY REGION 2022–2029 (KILOTON)
TABLE 29 NORTH AMERICA: POLYOXYMETHYLENE MARKET, BY COUNTRY, 2022–2029 (USD MILLION)
TABLE 30 NORTH AMERICA: POLYOXYMETHYLENE MARKET, BY COUNTRY, 2022–2029 (KILOTON)
TABLE 31 NORTH AMERICA: POLYOXYMETHYLENE MARKET, BY END-USE INDUSTRY, 2022–2029 (USD MILLION)
TABLE 32 NORTH AMERICA: POLYOXYMETHYLENE MARKET, BY END-USE INDUSTRY, 2022–2029 (KILOTON)
TABLE 33 NORTH AMERICA: POLYOXYMETHYLENE MARKET, BY PROCESSING TECHNIQUE, 2022–2029 (USD MILLION)
TABLE 34 NORTH AMERICA: POLYOXYMETHYLENE MARKET, BY PROCESSING TECHNIQUE, 2022–2029 (KILOTON)
TABLE 35 NORTH AMERICA: POLYOXYMETHYLENE MARKET, BY TYPE, 2022–2029 (USD MILLION)
TABLE 36 NORTH AMERICA: POLYOXYMETHYLENE MARKET, BY TYPE, 2022–2029 (KILOTON)
TABLE 37 US: POLYOXYMETHYLENE MARKET, BY END-USE INDUSTRY, 2022–2029 (USD MILLION)
TABLE 38 US: POLYOXYMETHYLENE MARKET, BY END-USE INDUSTRY, 2022–2029 (KILOTON)
TABLE 39 CANADA: POLYOXYMETHYLENE MARKET, BY END-USE INDUSTRY, 2022–2029 (USD MILLION)
TABLE 40 CANADA: POLYOXYMETHYLENE MARKET, BY END-USE INDUSTRY, 2022–2029 (KILOTON)
TABLE 41 MEXICO: POLYOXYMETHYLENE MARKET, BY END-USE INDUSTRY, 2022–2029 (USD MILLION)
TABLE 42 MEXICO: POLYOXYMETHYLENE MARKET, BY END-USE INDUSTRY, 2022–2029 (KILOTON)
TABLE 43 ASIA PACIFIC: POLYOXYMETHYLENE MARKET, BY COUNTRY, 2022–2029 (USD MILLION)
TABLE 44 ASIA PACIFIC: POLYOXYMETHYLENE MARKET, BY COUNTRY, 2022–2029 (KILOTON)
TABLE 45 ASIA PACIFIC: POLYOXYMETHYLENE MARKET, BY END-USE INDUSTRY, 2022–2029 (USD MILLION)
TABLE 46 ASIA PACIFIC: POLYOXYMETHYLENE MARKET, BY END-USE INDUSTRY, 2022–2029 (KILOTON)
TABLE 47 ASIA PACIFIC: POLYOXYMETHYLENE MARKET, BY PROCESSING TECHNIQUE, 2022–2029 (USD MILLION)
TABLE 48 ASIA PACIFIC: POLYOXYMETHYLENE MARKET, BY PROCESSING TECHNIQUE, 2022–2029 (KILOTON)
TABLE 49 ASIA PACIFIC: POLYOXYMETHYLENE MARKET, BY TYPE, 2022–2029 (USD MILLION)
TABLE 50 ASIA PACIFIC: POLYOXYMETHYLENE MARKET, BY TYPE, 2022–2029 (KILOTON)
TABLE 51 CHINA: POLYOXYMETHYLENE MARKET, BY END-USE INDUSTRY, 2022–2029 (USD MILLION)
TABLE 52 CHINA: POLYOXYMETHYLENE MARKET, BY END-USE INDUSTRY, 2022–2029 (KILOTON)
TABLE 53 JAPAN: POLYOXYMETHYLENE MARKET, BY END-USE INDUSTRY, 2022–2029 (USD MILLION)
TABLE 54 JAPAN: POLYOXYMETHYLENE MARKET, BY END-USE INDUSTRY, 2022–2029 (KILOTON)
TABLE 55 INDIA: POLYOXYMETHYLENE MARKET, BY END-USE INDUSTRY, 2022–2029 (USD MILLION)
TABLE 56 INDIA: POLYOXYMETHYLENE MARKET, BY END-USE INDUSTRY, 2022–2029 (KILOTON)
TABLE 57 SOUTH KOREA: POLYOXYMETHYLENE MARKET, BY END-USE INDUSTRY, 2022–2029 (USD MILLION)
TABLE 58 SOUTH KOREA: POLYOXYMETHYLENE MARKET, BY END-USE INDUSTRY, 2022–2029 (KILOTON)
TABLE 59 TAIWAN: POLYOXYMETHYLENE MARKET, BY END-USE INDUSTRY, 2022–2029 (USD MILLION)
TABLE 60 TAIWAN: POLYOXYMETHYLENE MARKET, BY END-USE INDUSTRY, 2022–2029 (KILOTON)
TABLE 61 REST OF ASIA PACIFIC: POLYOXYMETHYLENE MARKET, BY END-USE INDUSTRY, 2022–2029 (USD MILLION)
TABLE 62 REST OF ASIA PACIFIC: POLYOXYMETHYLENE MARKET, BY END-USE INDUSTRY, 2022–2029 (KILOTON)
TABLE 63 EUROPE: POLYOXYMETHYLENE MARKET, BY COUNTRY, 2022–2029 (USD MILLION)
TABLE 64 EUROPE: POLYOXYMETHYLENE MARKET, BY COUNTRY, 2022–2029 (KILOTON)
TABLE 65 EUROPE: POLYOXYMETHYLENE MARKET, BY END-USE INDUSTRY, 2022–2029 (USD MILLION)
TABLE 66 EUROPE: POLYOXYMETHYLENE MARKET, BY END-USE INDUSTRY, 2022–2029 (KILOTON)
TABLE 67 EUROPE: POLYOXYMETHYLENE MARKET, BY PROCESSING TECHNIQUE, 2022–2029 (USD MILLION)
TABLE 68 EUROPE: POLYOXYMETHYLENE MARKET, BY PROCESSING TECHNIQUE, 2022–2029 (KILOTON)
TABLE 69 EUROPE: POLYOXYMETHYLENE MARKET, BY TYPE, 2022–2029 (USD MILLION)
TABLE 70 EUROPE: POLYOXYMETHYLENE MARKET, BY TYPE, 2022–2029 (KILOTON)
TABLE 71 GERMANY: POLYOXYMETHYLENE MARKET, BY END-USE INDUSTRY, 2022–2029 (USD MILLION)
TABLE 72 GERMANY: POLYOXYMETHYLENE MARKET, BY END-USE INDUSTRY, 2022–2029 (KILOTON)
TABLE 73 UK: POLYOXYMETHYLENE MARKET, BY END-USE INDUSTRY, 2022–2029 (USD MILLION)
TABLE 74 UK: POLYOXYMETHYLENE MARKET, BY END-USE INDUSTRY, 2022–2029 (KILOTON)
TABLE 75 FRANCE: POLYOXYMETHYLENE MARKET, BY END-USE INDUSTRY, 2022–2029 (USD MILLION)
TABLE 76 FRANCE: POLYOXYMETHYLENE MARKET, BY END-USE INDUSTRY, 2022–2029 (KILOTON)
TABLE 77 ITALY: POLYOXYMETHYLENE MARKET, BY END-USE INDUSTRY, 2022–2029 (USD MILLION)
TABLE 78 ITALY: POLYOXYMETHYLENE MARKET, BY END-USE INDUSTRY, 2022–2029 (KILOTON)
TABLE 79 SPAIN: POLYOXYMETHYLENE MARKET, BY END-USE INDUSTRY, 2022–2029 (USD MILLION)
TABLE 80 SPAIN: POLYOXYMETHYLENE MARKET, BY END-USE INDUSTRY, 2022–2029 (KILOTON)
TABLE 81 RUSSIA: POLYOXYMETHYLENE MARKET, BY END-USE INDUSTRY, 2022–2029 (USD MILLION)
TABLE 82 RUSSIA: POLYOXYMETHYLENE MARKET, BY END-USE INDUSTRY, 2022–2029 (KILOTON)
TABLE 83 REST OF EUROPE: POLYOXYMETHYLENE MARKET, BY END-USE INDUSTRY, 2022–2029 (USD MILLION)
TABLE 84 REST OF EUROPE: POLYOXYMETHYLENE MARKET, BY END-USE INDUSTRY, 2022–2029 (KILOTONS)
TABLE 85 MIDDLE EAST & AFRICA: POLYOXYMETHYLENE MARKET, BY COUNTRY, 2022–2029 (USD MILLION)
TABLE 86 MIDDLE EAST & AFRICA: POLYOXYMETHYLENE MARKET, BY COUNTRY, 2022–2029 (KILOTON)
TABLE 87 MIDDLE EAST & AFRICA: POLYOXYMETHYLENE MARKET, BY END-USE INDUSTRY, 2022–2029 (USD MILLION)
TABLE 88 MIDDLE EAST & AFRICA: POLYOXYMETHYLENE MARKET, BY END-USE INDUSTRY, 2022–2029 (KILOTON)
TABLE 89 MIDDLE EAST & AFRICA: POLYOXYMETHYLENE MARKET, BY PROCESSING TECHNIQUE, 2022–2029 (USD MILLION)
TABLE 90 MIDDLE EAST & AFRICA: POLYOXYMETHYLENE MARKET, BY PROCESSING TECHNIQUE, 2022–2029 (KILOTON)
TABLE 91 MIDDLE EAST & AFRICA: POLYOXYMETHYLENE MARKET, BY TYPE, 2022–2029 (USD MILLION)
TABLE 92 MIDDLE EAST & AFRICA: POLYOXYMETHYLENE MARKET, BY TYPE, 2022–2029 (KILOTON)
TABLE 93 GCC COUNTRIES: POLYOXYMETHYLENE MARKET, BY END-USE INDUSTRY, 2022–2029 (USD MILLION)
TABLE 94 GCC COUNTRIES: POLYOXYMETHYLENE MARKET, BY END-USE INDUSTRY, 2022–2029 (KILOTON)
TABLE 95 SAUDI ARABIA: POLYOXYMETHYLENE MARKET, BY END-USE INDUSTRY, 2022–2029 (USD MILLION)
TABLE 96 SAUDI ARABIA: POLYOXYMETHYLENE MARKET, BY END-USE INDUSTRY, 2022–2029 (KILOTON)
TABLE 97 UAE: POLYOXYMETHYLENE MARKET, BY END-USE INDUSTRY, 2022–2029 (USD MILLION)
TABLE 98 UAE: POLYOXYMETHYLENE MARKET, BY END-USE INDUSTRY, 2022–2029 (KILOTON)
TABLE 99 REST OF GCC: POLYOXYMETHYLENE MARKET, BY END-USE INDUSTRY, 2022–2029 (USD MILLION)
TABLE 100 REST OF GCC: POLYOXYMETHYLENE MARKET, BY END-USE INDUSTRY, 2022–2029 (KILOTON)
TABLE 101 TURKEY: POLYOXYMETHYLENE MARKET, BY END-USE INDUSTRY, 2022–2029 (USD MILLION)
TABLE 102 TURKEY: POLYOXYMETHYLENE MARKET, BY END-USE INDUSTRY, 2022–2029 (KILOTON)
TABLE 103 SOUTH AFRICA: POLYOXYMETHYLENE MARKET, BY END-USE INDUSTRY, 2022–2029 (USD MILLION)
TABLE 104 SOUTH AFRICA: POLYOXYMETHYLENE MARKET, BY END-USE INDUSTRY, 2022–2029 (KILOTON)
TABLE 105 REST OF MIDDLE EAST & AFRICA: POLYOXYMETHYLENE MARKET, BY END-USE INDUSTRY, 2022–2029 (USD MILLION)
TABLE 106 REST OF MIDDLE EAST & AFRICA: POLYOXYMETHYLENE MARKET, BY END-USE INDUSTRY, 2022–2029 (KILOTON)
TABLE 107 SOUTH AMERICA: POLYOXYMETHYLENE MARKET, BY COUNTRY, 2022–2029 (USD MILLION)
TABLE 108 SOUTH AMERICA: POLYOXYMETHYLENE MARKET, BY COUNTRY, 2022–2029 (KILOTON)
TABLE 109 SOUTH AMERICA: POLYOXYMETHYLENE MARKET, BY END-USE INDUSTRY, 2022–2029 (USD MILLION)
TABLE 110 SOUTH AMERICA: POLYOXYMETHYLENE MARKET, BY END-USE INDUSTRY, 2022–2029 (KILOTON)
TABLE 111 SOUTH AMERICA: POLYOXYMETHYLENE MARKET, BY PROCESSING TECHNIQUE, 2022–2029 (USD MILLION)
TABLE 112 SOUTH AMERICA: POLYOXYMETHYLENE MARKET, BY PROCESSING TECHNIQUE, 2022–2029 (KILOTON)
TABLE 113 SOUTH AMERICA: POLYOXYMETHYLENE MARKET, BY TYPE, 2022–2029 (USD MILLION)
TABLE 114 SOUTH AMERICA: POLYOXYMETHYLENE MARKET, BY TYPE, 2022–2029 (KILOTON)
TABLE 115 BRAZIL: POLYOXYMETHYLENE MARKET, BY END-USE INDUSTRY, 2022–2029 (USD MILLION)
TABLE 116 BRAZIL: POLYOXYMETHYLENE MARKET, BY END-USE INDUSTRY, 2022–2029 (KILOTON)
TABLE 117 ARGENTINA: POLYOXYMETHYLENE MARKET, BY END-USE INDUSTRY, 2022–2029 (USD MILLION)
TABLE 118 ARGENTINA: POLYOXYMETHYLENE MARKET, BY END-USE INDUSTRY, 2022–2029 (KILOTON)
TABLE 119 REST OF SOUTH AMERICA: POLYOXYMETHYLENE MARKET, BY END-USE INDUSTRY, 2022–2029 (USD MILLION)
TABLE 120 REST OF SOUTH AMERICA: POLYOXYMETHYLENE MARKET, BY END-USE INDUSTRY, 2022–2029 (KILOTON)
TABLE 121 OVERVIEW OF STRATEGIES ADOPTED BY KEY POLYOXYMETHYLENE MARKET PLAYERS
TABLE 122 POLYOXYMETHYLENE MARKET: DEGREE OF COMPETITION
TABLE 123 POLYOXYMETHYLENE MARKET: COMPANY REGION FOOTPRINT (13 COMPANIES)
TABLE 124 POLYOXYMETHYLENE MARKET: COMPANY TYPE FOOTPRINT (13 COMPANIES)
TABLE 125 POLYOXYMETHYLENE MARKET: COMPANY GRADE FOOTPRINT (13 COMPANIES)
TABLE 126 POLYOXYMETHYLENE MARKET: PROCESSING TECHNIQUE FOOTPRINT (13 COMPANIES)
TABLE 127 POLYOXYMETHYLENE MARKET: COMPANY END-USE INDUSTRY FOOTPRINT (13 COMPANIES)
TABLE 128 POLYOXYMETHYLENE MARKET: DETAILED LIST OF KEY STARTUPS/SMES
TABLE 129 POLYOXYMETHYLENE MARKET: COMPETITIVE BENCHMARKING OF KEY STARTUPS/SMES
TABLE 130 POLYOXYMETHYLENE MARKET: PRODUCT LAUNCHES, JANUARY 2019–MAY 2024
TABLE 131 POLYOXYMETHYLENE MARKET: DEALS, JANUARY 2019–MAY 2024
TABLE 132 POLYOXYMETHYLENE MARKET: EXPANSIONS, JANUARY 2019–MAY 2024
TABLE 133 POLYOXYMETHYLENE MARKET: OTHER DEVELOPMENTS, JANUARY 2019–MAY 2024
TABLE 134 CELANESE CORPORATION: COMPANY OVERVIEW
TABLE 135 CELANESE CORPORATION: PRODUCTS/SOLUTIONS/SERVICES OFFERED
TABLE 136 CELANESE CORPORATION: PRODUCT LAUNCHES, JANUARY 2019−MAY 2024
TABLE 137 CELANESE CORPORATION: DEALS, JANUARY 2019−MAY 2024
TABLE 138 CELANESE CORPORATION: EXPANSIONS, JANUARY 2019−MAY 2024
TABLE 139 CELANESE CORPORATION: OTHER DEVELOPMENTS, JANUARY 2019−MAY 2024
TABLE 140 KOREA ENGINEERING PLASTICS CO., LTD. (KEP): COMPANY OVERVIEW
TABLE 141 KOREA ENGINEERING PLASTICS CO., LTD. (KEP): PRODUCTS/SOLUTIONS/ SERVICES OFFERED
TABLE 142 DAICEL CORPORATION: COMPANY OVERVIEW
TABLE 143 DAICEL CORPORATION: PRODUCTS/SOLUTIONS/SERVICES OFFERED
TABLE 144 DAICEL CORPORATION: PRODUCT LAUNCHES, JANUARY 2019−MAY 2024
TABLE 145 DAICEL CORPORATION: DEALS, JANUARY 2019−MAY 2024
TABLE 146 DAICEL CORPORATION: EXPANSIONS, JANUARY 2019−MAY 2024
TABLE 147 DAICEL CORPORATION: OTHER DEVELOPMENTS, JANUARY 2019−MAY 2024
TABLE 148 BASF GROUP: COMPANY OVERVIEW
TABLE 149 BASF GROUP: PRODUCTS/SOLUTIONS/SERVICES OFFERED
TABLE 150 BASF GROUP: EXPANSIONS, JANUARY 2019−MAY 2024
TABLE 151 BASF GROUP: OTHER DEVELOPMENTS, JANUARY 2019−MAY 2024
TABLE 152 ASAHI KASEI CORPORATION: COMPANY OVERVIEW
TABLE 153 ASAHI KASEI CORPORATION: PRODUCTS/SOLUTIONS/SERVICES OFFERED
TABLE 154 LG CHEM: COMPANY OVERVIEW
TABLE 155 LG CHEM: PRODUCTS/SOLUTIONS/SERVICES OFFERED
TABLE 156 SABIC: COMPANY OVERVIEW
TABLE 157 SABIC: PRODUCTS/SOLUTIONS/SERVICES OFFERED
TABLE 158 MITSUBISHI GAS CHEMICAL COMPANY, INC.: COMPANY OVERVIEW
TABLE 159 MITSUBISHI GAS CHEMICAL COMPANY, INC.: PRODUCTS/SOLUTIONS/ SERVICES OFFERED
TABLE 160 MITSUBISHI GAS CHEMICAL COMPANY, INC.: DEALS, JANUARY 2019−MAY 2024
TABLE 161 MITSUBISHI GAS CHEMICAL COMPANY, INC.: EXPANSIONS, JANUARY 2018−MAY 2024
TABLE 162 LYONDELLBASELL INDUSTRIES HOLDINGS B.V.: COMPANY OVERVIEW
TABLE 163 LYONDELLBASELL INDUSTRIES HOLDINGS B.V.: PRODUCTS/SOLUTIONS/ SERVICES OFFERED
TABLE 164 DUPONT DE NEMOURS INC.: COMPANY OVERVIEW
TABLE 165 DUPONT DE NEMOURS INC.: PRODUCTS/SOLUTIONS/SERVICES OFFERED
TABLE 166 DUPONT DE NEMOURS INC.: OTHER DEVELOPMENTS, JANUARY 2019−MAY 2024
TABLE 167 CHINA BLUECHEMICAL LTD.: COMPANY OVERVIEW
TABLE 168 CHINA BLUECHEMICAL LTD.: PRODUCTS/SOLUTIONS/SERVICES OFFERED
TABLE 169 KOLON ENP: COMPANY OVERVIEW
TABLE 170 KOLON ENP: PRODUCTS/SOLUTIONS/SERVICES OFFERED
TABLE 171 HENAN ENERGY GROUP CO., LTD.: COMPANY OVERVIEW
TABLE 172 HENAN ENERGY GROUP CO., LTD.: PRODUCTS/SOLUTIONS/SERVICES OFFERED
TABLE 173 WESTLAKE PLASTICS: COMPANY OVERVIEW
TABLE 174 YUNTIANHUA GROUP CO., LTD.: COMPANY OVERVIEW
TABLE 175 BARLOG PLASTICS GMBH: COMPANY OVERVIEW
TABLE 176 FORMOSA PLASTICS GROUP: COMPANY OVERVIEW
TABLE 177 ENSINGER: COMPANY OVERVIEW
TABLE 178 EUROTEC ENGINEERING PLASTICS: COMPANY OVERVIEW
TABLE 179 GEHR: COMPANY OVERVIEW
TABLE 180 GLS POLYMERS PVT LTD.: COMPANY OVERVIEW
TABLE 181 REPOL: COMPANY OVERVIEW
TABLE 182 GUJARAT PETROSYNTHESE LIMITED: COMPANY OVERVIEW
TABLE 183 LICHARZ GMBH: COMPANY OVERVIEW
TABLE 184 POLYMER INDUSTRIES LLC: COMPANY OVERVIEW
TABLE 185 SAX POLYMERS: COMPANY OVERVIEW
TABLE 186 SINOPLAST GROUP LIMITED: COMPANY OVERVIEW
TABLE 187 TISAN ENGINEERING PLASTICS: COMPANY OVERVIEW
TABLE 188 MICRO INJECTION MOLDED PLASTIC MARKET, BY REGION, 2017–2021 (USD MILLION)
TABLE 189 MICRO INJECTION MOLDED PLASTIC MARKET, BY REGION, 2022–2028 (USD MILLION)
LIST OF FIGURES (57 FIGURES)
FIGURE 1 POLYOXYMETHYLENE MARKET: RESEARCH DESIGN
FIGURE 2 MARKET SIZE ESTIMATION: TOP-DOWN APPROACH
FIGURE 3 MARKET SIZE ESTIMATION: BOTTOM-UP APPROACH
FIGURE 4 POLYOXYMETHYLENE MARKET: APPROACH 1
FIGURE 5 POLYOXYMETHYLENE MARKET: APPROACH 2
FIGURE 6 POLYOXYMETHYLENE MARKET: DATA TRIANGULATION
FIGURE 7 TRANSPORTATION TO LEAD POLYOXYMETHYLENE MARKET DURING FORECAST PERIOD
FIGURE 8 INJECTION MOLDING SEGMENT TO DOMINATE MARKET DURING FORECAST PERIOD
FIGURE 9 LOW VOC SEGMENT TO DOMINATE MARKET DURING FORECAST PERIOD
FIGURE 10 COPOLYMER SEGMENT TO DOMINATE MARKET DURING FORECAST PERIOD
FIGURE 11 ASIA PACIFIC LED POLYOXYMETHYLENE MARKET IN 2023
FIGURE 12 RISING DEMAND FROM TRANSPORTATION SECTOR TO DRIVE POLYOXYMETHYLENE MARKET
FIGURE 13 ASIA PACIFIC: CHINA ACCOUNTED FOR LARGEST SHARE OF POLYOXYMETHYLENE MARKET
FIGURE 14 TRANSPORTATION SEGMENT TO LEAD POLYOXYMETHYLENE MARKET DURING FORECAST PERIOD
FIGURE 15 INJECTION MOLDING SEGMENT TO LEAD POLYOXYMETHYLENE MARKET DURING FORECAST PERIOD
FIGURE 16 COPOLYMER SEGMENT TO LEAD POLYOXYMETHYLENE MARKET DURING FORECAST PERIOD
FIGURE 17 LOW VOC SEGMENT TO LEAD POLYOXYMETHYLENE MARKET DURING FORECAST PERIOD
FIGURE 18 CHINA TO REGISTER HIGHEST CAGR FROM 2024 TO 2029
FIGURE 19 POLYOXYMETHYLENE MARKET: DRIVERS, RESTRAINTS, OPPORTUNITIES, AND CHALLENGES
FIGURE 20 POLYOXYMETHYLENE MARKET: PORTER'S FIVE FORCES ANALYSIS
FIGURE 21 POLYOXYMETHYLENE MARKET: VALUE CHAIN ANALYSIS
FIGURE 22 POLYACETALS (IN PRIMARY FORMS) EXPORT, BY KEY COUNTRIES (2018−2022)
FIGURE 23 POLYACETALS (IN PRIMARY FORMS) IMPORT, BY KEY COUNTRIES (2018−2022)
FIGURE 24 NEW ELECTRIC VEHICLES SOLD, BY COUNTRY (2022)
FIGURE 25 NEW REVENUE POCKETS FOR PLAYERS IN POLYOXYMETHYLENE MARKET
FIGURE 26 POLYOXYMETHYLENE MARKET: ECOSYSTEM MAPPING
FIGURE 27 INFLUENCE OF STAKEHOLDERS ON BUYING PROCESS FOR TOP TWO END-USE INDUSTRIES
FIGURE 28 KEY BUYING CRITERIA FOR TOP TWO END-USE INDUSTRIES
FIGURE 29 TOP PATENT OWNERS IN POLYOXYMETHYLENE MARKET, 2013–2023
FIGURE 30 JAPAN REGISTERED MAXIMUM NUMBER OF PATENTS FOR POLYOXYMETHYLENE BETWEEN 2013 AND 2023
FIGURE 31 POLYOXYMETHYLENE MARKET: AVERAGE SELLING PRICE, BY REGION (USD/KG)
FIGURE 32 INVESTOR FUNDING IN ELECTRIC VEHICLES SOARED IN 2021
FIGURE 33 LOW VOC SEGMENT TO REGISTER HIGHEST CAGR DURING FORECAST PERIOD
FIGURE 34 INJECTION MOLDING ACCOUNTED FOR LARGEST MARKET SHARE IN 2023
FIGURE 35 COPOLYMER SEGMENT ACCOUNTED FOR LARGER MARKET SHARE IN 2023
FIGURE 36 TRANSPORTATION TO ACCOUNT FOR LARGEST MARKET SHARE DURING FORECAST PERIOD
FIGURE 37 POLYOXYMETHYLENE MARKET: GEOGRAPHICAL SNAPSHOT
FIGURE 38 ASIA PACIFIC: POLYOXYMETHYLENE MARKET SNAPSHOT
FIGURE 39 EUROPE: POLYOXYMETHYLENE MARKET SNAPSHOT
FIGURE 40 REVENUE OF KEY PLAYERS IN POLYOXYMETHYLENE MARKET
FIGURE 41 POLYOXYMETHYLENE MARKET: MARKET SHARE ANALYSIS
FIGURE 42 COMPANY VALUATION (USD BILLION)
FIGURE 43 FINANCIAL MATRIX: EV/EBITDA RATIO
FIGURE 44 POLYOXYMETHYLENE MARKET: PRODUCT/BRAND COMPARISON
FIGURE 45 POLYOXYMETHYLENE MARKET: COMPANY EVALUATION MATRIX (KEY PLAYERS), 2023
FIGURE 46 POLYOXYMETHYLENE MARKET: COMPANY OVERALL FOOTPRINT
FIGURE 47 POLYOXYMETHYLENE MARKET: START-UPS/SMES EVALUATION MATRIX, 2023
FIGURE 48 CELANESE CORPORATION: COMPANY SNAPSHOT (2023)
FIGURE 49 DAICEL CORPORATION: COMPANY SNAPSHOT (2024)
FIGURE 50 BASF GROUP: COMPANY SNAPSHOT (2023)
FIGURE 51 ASAHI KASEI CORPORATION: COMPANY SNAPSHOT (2023)
FIGURE 52 LG CHEM: COMPANY SNAPSHOT (2023)
FIGURE 53 SABIC: COMPANY SNAPSHOT (2023)
FIGURE 54 MITSUBISHI GAS CHEMICAL COMPANY INC.: COMPANY SNAPSHOT (2023)
FIGURE 55 LYONDELLBASELL INDUSTRIES HOLDINGS B.V.: COMPANY SNAPSHOT (2023)
FIGURE 56 DUPONT DE NEMOURS INC.: COMPANY SNAPSHOT (2023)
FIGURE 57 CHINA BLUECHEMICAL LTD.: COMPANY SNAPSHOT (2023)


Growth opportunities and latent adjacency in Polyoxymethylene Market