Photoacoustic Imaging Market Size, Share & Trends

Report Code MD 9059
Published in Jul, 2024, By MarketsandMarkets™
Download PDF

Choose License Type

Buy Report Now Inquire Before Buying

Photoacoustic Imaging Market by Product (Imaging System, Transducer, Software, Accessories), Technology (Microscopy, Tomography), Type (Preclinical, Clinical), Application (Oncology, Neuro), End User (Hospitals, Academia) & Region Global Forecast to 2029

Overview

The global Photoacoustic imaging market, valued at US$75 million in 2023, is forecasted to grow at a robust CAGR of 5.5%, reaching US$80 million in 2024 and an impressive US$105 million by 2029. The comprehensive research encompasses an exhaustive examination of industry trends, meticulous pricing analysis, patent scrutiny, insights derived from conferences and webinars, identification of key stakeholders, and a nuanced understanding of market purchasing dynamics. The market is experiencing substantial growth fueled by rising investments, both direct and indirect, in imaging systems, alongside strategic partnerships aimed at advancing imaging technology. Furthermore, the increasing number of conferences and symposia dedicated to imaging technologies is contributing to this growth. Looking forward, emerging markets are expected to offer promising opportunities for industry players over the next five years.

Attractive Opportunities in the Photoacoustic Imaging Market

ASIA PACIFIC:

The Asia-Pacific market's growth is fueled by favorable conditions, enhancements in infrastructure, continuous regulatory advancements, and increasing levels of manufacturing activity. These factors collectively contribute to the region's expanding photoacoustic imaging market.

Market expansion correlates with research and development expenditures by research firms, alongside investments from governmental entities. These factors play pivotal roles in driving growth within the market.

Emerging markets like China, Brazil, and India offer promising growth prospects for businesses and investors seeking attractive opportunities in the upcoming market.

The increasing use of imaging systems in diagnostic imaging, encompassing both research institutes and academia, constitutes a significant segment of the North American market.

The Asia-Pacific photoacoustic imaging market is experiencing remarkable growth, driven significantly by advancements in technology that are pivotal to its expansion.

Global Photoacoustic Imaging Market Dynamics

DRIVER: Increasing prevalence of cancer.

The increasing prevalence of cancer is emerging as a significant growth driver for the market. As cancer rates continue to rise globally, there is a growing need for advanced imaging technologies that can offer early detection, precise diagnosis, and monitoring of treatment effectiveness. Photoacoustic imaging's ability to provide high-resolution, real-time images of tissue at various depths, including vascular and molecular information, positions it as a promising tool in the fight against cancer. This technology not only enhances oncological research but also supports personalized treatment strategies, thereby fueling its adoption in clinical settings and driving market expansion.

RESTRAINT: High cost of the photoacoustic imaging system

Photoacoustic Computed Tomography (PACT) is a hybrid, noninvasive imaging modality crucial for functional and molecular imaging in biomedicine. It has rapidly gained importance due to its superiority over traditional optical imaging techniques. However, its clinical adoption is hindered by high development costs; typical commercial systems range from USD 200K to USD 900K. These costs primarily stem from the need for high-power pulsed lasers, sensitive ultrasound transducers, and complex signal processing units. The lasers used are advanced, tunable models producing short, precisely controlled pulses, costing between USD 15,000 to USD 25,000. These lasers demand expensive manufacturing, regular maintenance, and calibration for optimal performance. Similarly, ultrasound transducers must be exceptionally sensitive to detect the faint signals generated by the photoacoustic effect, often requiring custom designs, further increasing expenses.

OPPORTUNITY: Rising demand for personalized medicines.

Personalized medicine, which tailors’ medical treatment to the individual characteristics of each patient, is driving innovation and growth in various medical imaging technologies, including Photoacoustic imaging. This demand impacts the Photoacoustic imaging market through several key points: it enhances diagnostics by offering high-resolution imaging at molecular levels, ideal for identifying disease markers specific to individual patients, which aligns with the personalized medicine approach requiring precise diagnostic tools. Additionally, Photoacoustic imaging facilitates early detection of diseases by visualizing molecular and cellular changes, improving patient outcomes through timely and targeted interventions. Furthermore, its real-time imaging capabilities allow clinicians to monitor the effects of personalized therapies as they are administered, providing crucial feedback for promptly adjusting treatments to ensure optimal efficacy. As a non-invasive technique that does not use ionizing radiation, Photoacoustic imaging is also safer for repeated use.

CHALLENGE: Lack of skilled professionals

The market faces significant challenges, primarily due to a shortage of skilled professionals. This technology's inherent complexity requires expertise in both optics and acoustics, as well as deep knowledge of laser-tissue interactions, ultrasound wave propagation, and the integration of these modalities to create coherent images. The interdisciplinary nature of photoacoustic imaging demands skills not commonly found in the workforce, and specialized educational programs are lacking, as traditional biomedical engineering or medical physics curricula do not extensively cover this area. Consequently, professionals often need additional training or post-graduate education, which can be time-consuming and costly. The absence of standardized training programs and certifications exacerbates the skills gap, affecting the quality and reliability of imaging results. Research and development in photoacoustic imaging are concentrated in a few specialized institutions and companies, limiting broader exposure and hands-on experience opportunities. The high learning curve associated with mastering the specialized software and analytical skills required for photoacoustic imaging integration and interpretation can deter professionals, especially given the need for continuous skill updates due to technological advancements. Recruitment and retention of skilled professionals are challenging, as competitive industries vie for the same talent pool, leading to high demand and turnover rates. This shortage directly impacts the growth of the market, hindering product development and commercialization, and slowing clinical adoption due to the lack of sufficiently trained professionals to operate equipment and interpret results.

Global Photoacoustic Imaging Market Ecosystem Analysis

By product, the imaging system segment accounted for the largest share of the photoacoustic imaging industry in 2023. Based on product, the photoacoustic imaging market is segmented into imaging system, transducers, and software and accessories. In 2023, the imaging system segment accounted for the largest market share. Photoacoustic imaging has seen significant advancements recently, driving growth in its market. Innovations in laser and ultrasound technology have enhanced resolution and imaging depth, allowing for more precise and detailed images of biological tissues.

By technology, photoacoustic imaging segment accounted for the largest share of the photoacoustic imaging industry during the forecast period.

Photoacoustic imaging products type include photoacoustic imaging, photoacoustic microscopy, and photoacoustic tomography. In 2023, the photoacoustic imaging segment accounted for the largest market share. The demand for photoacoustic imaging in research is primarily fueled by the need for streamlined processes, strict regulations ensuring product quality and performance, and the growing number of research and development initiatives in the industry.By type, pre-clinical segment of the photoacoustic imaging industry accounted for the largest share during the forecast period.Photoacoustic imaging market segment include pre-clinical, and clinical research. In 2023, the pre-clinical segment accounted for the largest market share. The demand for photoacoustic preclinical research is primarily driven by the need for streamlined processes, stringent regulations ensuring product quality and performance, and the increasing number of research and development initiatives in the industry.

By application, the oncology segment of the photoacoustic imaging industry will register significant growth in the near future.

Based on application, the photoacoustic imaging market is broadly segmented into oncology, hematology, veterinary, and other applications. The oncology segment to register the highest growth from 2024 to 2029. In recent times, research has become pivotal in the advancement of pharmaceuticals, offering pathways for addressing a multitude of medical ailments such as cancer, rheumatoid arthritis, psoriasis, Crohn's disease, and diabetes, among various others. As a result, the growing incidence of chronic illnesses, coupled with heightened research endeavors aimed at vaccine development, is driving the growth of this industry.By end-users, the research institutes and academia segment of the photoacoustic imaging industry will register significant growth soon.Based on end-users, the photoacoustic imaging market is broadly segmented into hospitals and imaging centers, and academic & research institutes. The academic & research institutes segment to register the highest growth from 2024 to 2029. Academic & research institutes are central to advancing photoacoustic imaging technologies by prioritizing improvements in imaging modalities to enhance efficiency and versatility. They also focus on elevating image quality through innovative algorithms and techniques to boost resolution and contrast, while exploring new applications across biomedical sciences ranging from oncology to neurology.

NORTH AMERICA Region Holds the Largest Share of the Photoacoustic Imaging Market.

North America, comprising the US and Canada, accounted for the largest share of the photoacoustic imaging market in 2023. The notable growth of the North American market can be largely attributed to the stringent FDA regulations governing product approval and safety, as well as the robust presence of hospitals and imaging centers. Additional factors contributing to the market expansion in North America include increased investment in imaging systems.

Recent Developments of Photoacoustic Imaging Market industry

  • In May 2022, FUJIFILM CORPORATION (Japan) (FUJIFILM VisualSonics, Inc ) has launched Vevo F2, ultrasound and photoacoustic imaging system that operates across an ultra-wide frequency range of 71 MHz to 1 MHz. This new system represents a breakthrough in ultra-high frequency ultrasound and photoacoustic imaging technologies. In November 2022, Seno Medical has announced the commercial launch of its Imagio Breast Imaging System, a new modality in breast imaging. The system will be introduced at the annual RSNA Scientific Assembly and Annual Meeting, taking place from November 27 to December 1 in Chicago.
  • In June 2022, Seno Medical has announced the commercial launch of its Imagio Breast Imaging System, a new modality in breast imaging. The system will be introduced at the annual RSNA Scientific Assembly and Annual Meeting, taking place from November 27 to December 1 in Chicago.

Key Market Players

KEY PLAYERS IN THE Photoacoustic Imaging Market INCLUDE

Want to explore hidden markets that can drive new revenue in Photoacoustic Imaging Market?

Scope of the Report

Report Attribute Details
Market Revenue in 2024 $80 million
Projected Revenue by 2029 $105 million
Revenue Rate Poised to Grow at a CAGR of 5.5%
Market Driver Increasing prevalence of cancer
Market Opportunity Rising demand for personalized medicines


Key Questions Addressed by the Report

What is the expected addressable market value of the photoacoustic imaging market over a six-year period?
The global photoacoustic imaging market is expected to reach USD 105 million by 2029 from USD 80 million in 2024, at a CAGR of 5.5% from 2024 to 2029.
Which segment based on type is expected to garner the highest traction within the photoacoustic imaging market?
Based on the product, the imaging system segment is expected to grow at the highest rate.


Personalize This Research

  • Triangulate with your Own Data
  • Get Data as per your Format and Definition
  • Gain a Deeper Dive on a Specific Application, Geography, Customer or Competitor
  • Any level of Personalization
Request A Free Customisation

Let Us Help You

  • What are the Known and Unknown Adjacencies Impacting the Photoacoustic Imaging Market
  • What will your New Revenue Sources be?
  • Who will be your Top Customer; what will make them switch?
  • Defend your Market Share or Win Competitors
  • Get a Scorecard for Target Partners
Customized Workshop Request

Table of Contents

Exclusive indicates content/data unique to MarketsandMarkets and not available with any competitors.

TITLE
PAGE NO
INTRODUCTION
18
RESEARCH METHODOLOGY
21
EXECUTIVE SUMMARY
32
PREMIUM INSIGHTS
35
MARKET OVERVIEW
37
  • 5.1 INTRODUCTION
  • 5.2 MARKET DYNAMICS
    DRIVERS
    - Increasing prevalence of cancer
    - Advantages over contrast-enhanced imaging techniques
    - Advancements in photoacoustic imaging systems
    - Rising healthcare investments
    RESTRAINTS
    - High system costs
    OPPORTUNITIES
    - Rising demand for personalized medicine
    - Expanding research and clinical applications
    CHALLENGES
    - Lack of skilled professionals
    - Stringent regulatory guidelines
  • 5.3 REGULATORY LANDSCAPE
    US
    EUROPE
    ASIA PACIFIC
    REST OF THE WORLD
    KEY REGULATORY BODIES AND GOVERNMENT AGENCIES
  • 5.4 VALUE CHAIN ANALYSIS
  • 5.5 SUPPLY CHAIN ANALYSIS
    PROMINENT COMPANIES
    SMALL AND MEDIUM-SIZED ENTERPRISES
    END USERS
  • 5.6 ECOSYSTEM ANALYSIS
  • 5.7 INVESTMENT & FUNDING SCENARIO
  • 5.8 PRICING ANALYSIS
  • 5.9 TRADE ANALYSIS
    IMPORT DATA
    EXPORT DATA
  • 5.10 PATENT ANALYSIS
    LIST OF MAJOR PATENTS, 2020–2024
  • 5.11 PORTER’S FIVE FORCE ANALYSIS
    THREAT OF NEW ENTRANTS
    THREAT OF SUBSTITUTES
    BARGAINING POWER OF SUPPLIERS
    BARGAINING POWER OF BUYERS
    INTENSITY OF COMPETITIVE RIVALRY
  • 5.12 KEY STAKEHOLDERS & BUYING CRITERIA
    KEY STAKEHOLDERS IN BUYING PROCESS
    BUYING CRITERIA
  • 5.13 KEY CONFERENCES & EVENTS
  • 5.14 TECHNOLOGY ANALYSIS
    KEY TECHNOLOGIES
    - Laser Systems
    - Ultrasound Transducers
    COMPLEMENTARY TECHNOLOGIES
    - Optical Imaging
    ADJACENT TECHNOLOGIES
    - Multimodal Imaging
  • 5.15 TRENDS/DISRUPTIONS IMPACTING CUSTOMERS’ BUSINESSES
  • 5.16 UNMET NEEDS AND KEY PAIN POINTS
  • 5.17 PHOTOACOUSTIC IMAGING MARKET: ADJACENT MARKETS
  • 5.18 ARTIFICIAL INTELLIGENCE (AI) IN PHOTOACOUSTIC IMAGING MARKET
PHOTOACOUSTIC IMAGING MARKET, BY PRODUCT
65
  • 6.1 INTRODUCTION
  • 6.2 IMAGING SYSTEMS
    TECHNOLOGICAL ADVANCEMENTS TO SUPPORT MARKET GROWTH
  • 6.3 TRANSDUCERS
    HIGH PRECISION AND CONSISTENCY TO PROPEL MARKET GROWTH
  • 6.4 SOFTWARE & ACCESSORIES
PHOTOACOUSTIC IMAGING MARKET, BY TECHNOLOGY
70
  • 7.1 INTRODUCTION
  • 7.2 PHOTOACOUSTIC IMAGING
    TECHNOLOGICAL ADVANCEMENTS TO SUPPORT MARKET GROWTH
  • 7.3 PHOTOACOUSTIC TOMOGRAPHY
    RISING POPULARITY OF PAT IN PRECLINICAL RESEARCH TO PROPEL MARKET
  • 7.4 PHOTOACOUSTIC MICROSCOPY
    INCREASING DEMAND IN HIGH-RESOLUTION TISSUE IMAGING TO DRIVE MARKET
PHOTOACOUSTIC IMAGING MARKET, BY TYPE
75
  • 8.1 INTRODUCTION
  • 8.2 PRECLINICAL RESEARCH
    GROWING FUNDING FOR PRECLINICAL RESEARCH TO DRIVE MARKET
  • 8.3 CLINICAL/CLINICAL RESEARCH
    RISING POPULARITY OF PHOTOACOUSTIC TOMOGRAPHY TO SUPPORT MARKET GROWTH
PHOTOACOUSTIC IMAGING MARKET, BY APPLICATION
79
  • 9.1 INTRODUCTION
  • 9.2 ONCOLOGY
    GROWING PREVALENCE OF CANCER TO DRIVE MARKET
  • 9.3 VETERINARY APPLICATIONS
    EXPANDING APPLICATIONS IN VETERINARY CARE TO DRIVE MARKET
  • 9.4 HEMATOLOGY
    ADVANCEMENTS AND GROWING APPLICATIONS IN HEMATOLOGY TO FAVOR MARKET GROWTH
  • 9.5 OTHER APPLICATIONS
PHOTOACOUSTIC IMAGING MARKET, BY END USER
84
  • 10.1 INTRODUCTION
  • 10.2 ACADEMIC & RESEARCH INSTITUTES
    ADVANCEMENTS AND RISING FUNDING TO PROPEL ADOPTION
  • 10.3 HOSPITALS & IMAGING CENTERS
    EXPANDING APPLICATIONS AND INCREASING ADOPTION IN HEALTHCARE TO DRIVE MARKET
PHOTOACOUSTIC IMAGING MARKET, BY REGION
88
  • 11.1 INTRODUCTION
  • 11.2 NORTH AMERICA
    NORTH AMERICA: RECESSION IMPACT
    US
    - Growing geriatric population to drive market
    CANADA
    - Favorable government funding scenario to support adoption
  • 11.3 EUROPE
    EUROPE: RECESSION IMPACT
    GERMANY
    - Rising prevalence of chronic diseases to fuel market growth
    UK
    - Favorable government support to propel market growth
    FRANCE
    - Infrastructural development and growing investments in life sciences R&D to support market growth
    REST OF EUROPE
  • 11.4 ASIA PACIFIC
    ASIA PACIFIC: RECESSION IMPACT
    JAPAN
    - Strong healthcare sector to support adoption
    CHINA
    - China to show strong growth in APAC market
    REST OF ASIA PACIFIC
  • 11.5 REST OF THE WORLD
    REST OF THE WORLD: RECESSION IMPACT
COMPETITIVE LANDSCAPE
109
  • 12.1 OVERVIEW
  • 12.2 KEY PLAYER STRATEGY/RIGHT TO WIN
    OVERVIEW OF STRATEGIES ADOPTED BY PLAYERS IN PHOTOACOUSTIC IMAGING MARKET
  • 12.3 REVENUE ANALYSIS
  • 12.4 MARKET SHARE ANALYSIS
  • 12.5 MARKET RANKING ANALYSIS
  • 12.6 COMPANY EVALUATION MATRIX: KEY PLAYERS, 2023
    STARS
    EMERGING LEADERS
    PERVASIVE PLAYERS
    PARTICIPANTS
    COMPANY FOOTPRINT: KEY PLAYERS, 2023
    - Company footprint
    - Product footprint
    - Technology footprint
    - Type footprint
    - Application footprint
    - End-user footprint
    - Regional footprint
  • 12.7 COMPANY EVALUATION MATRIX: STARTUPS/SMES, 2023
    PROGRESSIVE COMPANIES
    RESPONSIVE COMPANIES
    DYNAMIC COMPANIES
    STARTING BLOCKS
    COMPETITIVE BENCHMARKING: STARTUPS/SMES, 2023
  • 12.8 VALUATION & FINANCIAL METRICS
    FINANCIAL METRICS
    COMPANY VALUATION
  • 12.9 BRAND/PRODUCT COMPARISON
  • 12.10 COMPETITIVE SCENARIO
    PRODUCT LAUNCHES & APPROVALS
    DEALS
    OTHER DEVELOPMENTS
COMPANY PROFILES
128
  • 13.1 KEY PLAYERS
    FUJIFILM HOLDINGS CORPORATION
    - Business overview
    - Products offered
    - Recent developments
    - MnM view
    SENO MEDICAL
    - Business overview
    - Products offered
    - Recent developments
    - MnM view
    ITHERA MEDICAL GMBH
    - Business overview
    - Products offered
    - Recent developments
    - MnM view
    CYBERDYNE, INC.
    - Business overview
    - Products offered
    - MnM view
    ADVANTEST CORPORATION
    - Business overview
    - Products offered
    - MnM view
    TOMOWAVE LABORATORIES, INC.
    - Business overview
    - Products offered
    ILLUMISONICS INC.
    - Business overview
    - Products offered
    INNOLAS LASER GMBH
    - Business overview
    - Products offered
    KIBERO
    - Business overview
    - Products offered
    OPOTEK LLC
    - Business overview
    - Products offered
    VIBRONIX, INC.
    - Business overview
    - Products offered
    PHOTOSOUND TECHNOLOGIES, INC.
    - Business overview
    - Products offered
    VERASONICS, INC.
    - Business overview
    - Products offered
    LUXONUS INC.
    - Business overview
    - Products offered
    - Recent developments
    CALPACT
    - Business overview
    - Products offered
  • 13.2 OTHER PLAYERS
    PA IMAGING
    INTEGRATED OPTICS
    LASER 2000
    EKSPLA
    HÜBNER PHOTONICS
    LITRON LASERS
    IMASONIC SAS
    DEEPCOLOR SAS
    GUANGZHOU G-CELL TECHNOLOGY CO., LTD.
    VERMON
APPENDIX
159
  • 14.1 DISCUSSION GUIDE
  • 14.2 KNOWLEDGESTORE: MARKETSANDMARKETS’ SUBSCRIPTION PORTAL
  • 14.3 CUSTOMIZATION OPTIONS
  • 14.4 RELATED REPORTS
  • 14.5 AUTHOR DETAILS
LIST OF TABLES
 
  • TABLE 1 RESEARCH PRODUCTS AND THEIR APPLICATIONS
  • TABLE 2 REGULATORY STANDARDS/APPROVALS REQUIRED FOR PHOTOACOUSTIC IMAGING, BY COUNTRY/REGION
  • TABLE 3 NORTH AMERICA: REGULATORY BODIES, GOVERNMENT AGENCIES, AND OTHER ORGANIZATIONS
  • TABLE 4 EUROPE: REGULATORY BODIES, GOVERNMENT AGENCIES, AND OTHER ORGANIZATIONS
  • TABLE 5 ASIA PACIFIC: REGULATORY BODIES, GOVERNMENT AGENCIES, AND OTHER ORGANIZATIONS
  • TABLE 6 REST OF THE WORLD: REGULATORY BODIES, GOVERNMENT AGENCIES, AND OTHER ORGANIZATIONS
  • TABLE 7 PHOTOACOUSTIC IMAGING MARKET: ROLE IN ECOSYSTEM
  • TABLE 8 AVERAGE SELLING PRICE TREND OF PHOTOACOUSTIC IMAGING PRODUCTS, BY REGION
  • TABLE 9 IMPORT DATA FOR SEMICONDUCTOR DEVICES (E.G., DIODES, TRANSISTORS, SEMICONDUCTOR-BASED TRANSDUCERS) (HS CODE 8541), BY COUNTRY, 2019–2023 (USD THOUSAND)
  • TABLE 10 EXPORT DATA FOR SEMICONDUCTOR DEVICES (E.G. DIODES, TRANSISTORS, SEMICONDUCTOR-BASED TRANSDUCERS) (HS CODE 8541), BY COUNTRY, 2019–2023 (USD THOUSAND)
  • TABLE 11 LIST OF MAJOR PATENTS IN PHOTOACOUSTIC IMAGING MARKET, JANUARY 2020–MARCH 2024
  • TABLE 12 PHOTOACOUSTIC IMAGING MARKET: PORTER’S FIVE FORCES ANALYSIS
  • TABLE 13 INFLUENCE OF STAKEHOLDERS ON BUYING PROCESS (%)
  • TABLE 14 KEY BUYING CRITERIA FOR PHOTOACOUSTIC IMAGING
  • TABLE 15 LIST OF MAJOR CONFERENCES & EVENTS IN PHOTOACOUSTIC IMAGING MARKET IN JANUARY 2024-DECEMBER 2025
  • TABLE 16 PHOTOACOUSTIC IMAGING MARKET: CURRENT UNMET NEEDS
  • TABLE 17 PHOTOACOUSTIC IMAGING MARKET, BY PRODUCT, 2022–2029 (USD MILLION)
  • TABLE 18 PHOTOACOUSTIC IMAGING SYSTEMS MARKET, BY REGION, 2022–2029 (USD MILLION)
  • TABLE 19 PHOTOACOUSTIC IMAGING TRANSDUCERS MARKET, BY REGION, 2022–2029 (USD MILLION)
  • TABLE 20 PHOTOACOUSTIC IMAGING SOFTWARE & ACCESSORIES MARKET, BY REGION, 2022–2029 (USD MILLION)
  • TABLE 21 PHOTOACOUSTIC IMAGING MARKET, BY TECHNOLOGY, 2022–2029 (USD MILLION)
  • TABLE 22 PAI VS. OTHER IMAGING TECHNIQUES
  • TABLE 23 PHOTOACOUSTIC IMAGING MARKET FOR PAI SYSTEMS, BY REGION, 2022–2029 (USD MILLION)
  • TABLE 24 PHOTOACOUSTIC IMAGING MARKET FOR PAT SYSTEMS, BY REGION, 2022–2029 (USD MILLION)
  • TABLE 25 PHOTOACOUSTIC IMAGING MARKET FOR PAM SYSTEMS, BY REGION, 2022–2029 (USD MILLION)
  • TABLE 26 PHOTOACOUSTIC IMAGING MARKET, BY TYPE, 2022–2029 (USD MILLION)
  • TABLE 27 INDICATIVE LIST OF PRECLINICAL STUDIES USING PAI TO MONITOR VASCULAR FUNCTIONS IN TUMOR MODELS
  • TABLE 28 PHOTOACOUSTIC IMAGING MARKET FOR PRECLINICAL RESEARCH, BY REGION, 2022–2029 (USD MILLION)
  • TABLE 29 PHOTOACOUSTIC IMAGING MARKET FOR CLINICAL/CLINICAL RESEARCH, BY REGION, 2022–2029 (USD MILLION)
  • TABLE 30 PHOTOACOUSTIC IMAGING MARKET, BY APPLICATION, 2022–2029 (USD MILLION)
  • TABLE 31 PHOTOACOUSTIC IMAGING MARKET FOR ONCOLOGY, BY REGION, 2022–2029 (USD MILLION)
  • TABLE 32 PHOTOACOUSTIC IMAGING MARKET FOR VETERINARY APPLICATIONS, 2022–2029 (USD MILLION)
  • TABLE 33 PHOTOACOUSTIC IMAGING MARKET FOR HEMATOLOGY, BY REGION, 2022–2029 (USD MILLION)
  • TABLE 34 PHOTOACOUSTIC IMAGING MARKET FOR OTHER APPLICATIONS, BY REGION, 2022–2029 (USD MILLION)
  • TABLE 35 PHOTOACOUSTIC IMAGING MARKET, BY END USER, 2022–2029 (USD MILLION)
  • TABLE 36 PHOTOACOUSTIC IMAGING MARKET FOR ACADEMIC & RESEARCH INSTITUTES, BY REGION, 2022–2029 (USD MILLION)
  • TABLE 37 PHOTOACOUSTIC IMAGING MARKET FOR HOSPITALS & IMAGING CENTERS, BY REGION, 2022–2029 (USD MILLION)
  • TABLE 38 PHOTOACOUSTIC IMAGING MARKET, BY REGION, 2022–2029 (USD MILLION)
  • TABLE 39 NORTH AMERICA: PHOTOACOUSTIC IMAGING MARKET, BY COUNTRY, 2022–2029 (USD MILLION)
  • TABLE 40 NORTH AMERICA: PHOTOACOUSTIC IMAGING MARKET, BY PRODUCT, 2022–2029 (USD MILLION)
  • TABLE 41 NORTH AMERICA: PHOTOACOUSTIC IMAGING MARKET, BY TECHNOLOGY, 2022–2029 (USD MILLION)
  • TABLE 42 NORTH AMERICA: PHOTOACOUSTIC IMAGING MARKET, BY TYPE, 2022–2029 (USD MILLION)
  • TABLE 43 NORTH AMERICA: PHOTOACOUSTIC IMAGING MARKET, BY APPLICATION, 2022–2029 (USD MILLION)
  • TABLE 44 NORTH AMERICA: PHOTOACOUSTIC IMAGING MARKET, BY END USER, 2022–2029 (USD MILLION)
  • TABLE 45 US: PHOTOACOUSTIC IMAGING MARKET, BY PRODUCT, 2022–2029 (USD MILLION)
  • TABLE 46 CANADA: PHOTOACOUSTIC IMAGING MARKET, BY PRODUCT, 2022–2029 (USD MILLION)
  • TABLE 47 EUROPE: PHOTOACOUSTIC IMAGING MARKET, BY COUNTRY, 2022–2029 (USD MILLION)
  • TABLE 48 EUROPE: PHOTOACOUSTIC IMAGING MARKET, BY PRODUCT, 2022–2029 (USD MILLION)
  • TABLE 49 EUROPE: PHOTOACOUSTIC IMAGING MARKET, BY TECHNOLOGY, 2022–2029 (USD MILLION)
  • TABLE 50 EUROPE: PHOTOACOUSTIC IMAGING MARKET, BY TYPE, 2022–2029 (USD MILLION)
  • TABLE 51 EUROPE: PHOTOACOUSTIC IMAGING MARKET, BY APPLICATION, 2022–2029 (USD MILLION)
  • TABLE 52 EUROPE: PHOTOACOUSTIC IMAGING MARKET, BY END USER, 2022–2029 (USD MILLION)
  • TABLE 53 GERMANY: PHOTOACOUSTIC IMAGING MARKET, BY PRODUCT, 2022–2029 (USD MILLION)
  • TABLE 54 UK: PHOTOACOUSTIC IMAGING MARKET, BY PRODUCT, 2022–2029 (USD MILLION)
  • TABLE 55 FRANCE: PHOTOACOUSTIC IMAGING MARKET, BY PRODUCT, 2022–2029 (USD MILLION)
  • TABLE 56 REST OF EUROPE: PHOTOACOUSTIC IMAGING MARKET, BY PRODUCT, 2022–2029 (USD MILLION)
  • TABLE 57 ASIA PACIFIC: PHOTOACOUSTIC IMAGING MARKET, BY COUNTRY, 2022–2029 (USD MILLION)
  • TABLE 58 ASIA PACIFIC: PHOTOACOUSTIC IMAGING MARKET, BY PRODUCT, 2022–2029 (USD MILLION)
  • TABLE 59 ASIA PACIFIC: PHOTOACOUSTIC IMAGING MARKET, BY TECHNOLOGY, 2022–2029 (USD MILLION)
  • TABLE 60 ASIA PACIFIC: PHOTOACOUSTIC IMAGING MARKET, BY TYPE, 2022–2029 (USD MILLION)
  • TABLE 61 ASIA PACIFIC: PHOTOACOUSTIC IMAGING MARKET, BY APPLICATION, 2022–2029 (USD MILLION)
  • TABLE 62 ASIA PACIFIC: PHOTOACOUSTIC IMAGING MARKET, BY END USER, 2022–2029 (USD MILLION)
  • TABLE 63 JAPAN: PHOTOACOUSTIC IMAGING MARKET, BY PRODUCT, 2022–2029 (USD MILLION)
  • TABLE 64 CHINA: PHOTOACOUSTIC IMAGING MARKET, BY PRODUCT, 2022–2029 (USD MILLION)
  • TABLE 65 REST OF ASIA PACIFIC: PHOTOACOUSTIC IMAGING MARKET, BY PRODUCT, 2022–2029 (USD MILLION)
  • TABLE 66 REST OF THE WORLD: PHOTOACOUSTIC IMAGING MARKET, BY PRODUCT, 2022–2029 (USD MILLION)
  • TABLE 67 REST OF THE WORLD: PHOTOACOUSTIC IMAGING MARKET, BY TECHNOLOGY, 2022–2029 (USD MILLION)
  • TABLE 68 REST OF THE WORLD: PHOTOACOUSTIC IMAGING MARKET, BY TYPE, 2022–2029 (USD MILLION)
  • TABLE 69 REST OF THE WORLD: PHOTOACOUSTIC IMAGING MARKET, BY APPLICATION, 2022–2029 (USD MILLION)
  • TABLE 70 REST OF THE WORLD: PHOTOACOUSTIC IMAGING MARKET, BY END USER, 2022–2029 (USD MILLION)
  • TABLE 71 OVERVIEW OF STRATEGIES DEPLOYED BY KEY MANUFACTURING COMPANIES
  • TABLE 72 PHOTOACOUSTIC IMAGING MARKET: DEGREE OF COMPETITION
  • TABLE 73 PHOTOACOUSTIC IMAGING MARKET: PRODUCT FOOTPRINT
  • TABLE 74 PHOTOACOUSTIC IMAGING MARKET: TECHNOLOGY FOOTPRINT
  • TABLE 75 PHOTOACOUSTIC IMAGING MARKET: TYPE FOOTPRINT
  • TABLE 76 PHOTOACOUSTIC IMAGING MARKET: APPLICATION FOOTPRINT
  • TABLE 77 PHOTOACOUSTIC IMAGING MARKET: END-USER FOOTPRINT
  • TABLE 78 PHOTOACOUSTIC IMAGING MARKET: REGIONAL FOOTPRINT
  • TABLE 79 PHOTOACOUSTIC IMAGING MARKET: DETAILED LIST OF KEY STARTUPS/SME PLAYERS
  • TABLE 80 PHOTOACOUSTIC IMAGING MARKET: COMPETITIVE BENCHMARKING OF KEY EMERGING PLAYERS/STARTUPS
  • TABLE 81 PHOTOACOUSTIC IMAGING MARKET: PRODUCT LAUNCHES & APPROVALS, JANUARY 2020–DECEMBER 2023
  • TABLE 82 PHOTOACOUSTIC IMAGING MARKET: DEALS, JANUARY 2020–DECEMBER 2023
  • TABLE 83 PHOTOACOUSTIC IMAGING MARKET: OTHER DEVELOPMENTS, JANUARY 2020–DECEMBER 2023
  • TABLE 84 FUJIFILM HOLDINGS CORPORATION: COMPANY OVERVIEW
  • TABLE 85 FUJIFILM HOLDINGS CORPORATION: PRODUCTS OFFERED
  • TABLE 86 FUJIFILM HOLDINGS CORPORATION: PRODUCT LAUNCHES, JANUARY 2021–MARCH 2024
  • TABLE 87 FUJIFILM HOLDINGS CORPORATION: DEALS, JANUARY 2021–MARCH 2024
  • TABLE 88 FUJIFILM HOLDINGS CORPORATION: OTHER DEVELOPMENTS, JANUARY 2021–MARCH 2024
  • TABLE 89 SENO MEDICAL: COMPANY OVERVIEW
  • TABLE 90 SENO MEDICAL: PRODUCTS OFFERED
  • TABLE 91 SENO MEDICAL: PRODUCT LAUNCHES & APPROVALS, JANUARY 2021–MARCH 2024
  • TABLE 92 SENO MEDICAL: DEALS, JANUARY 2021–MARCH 2024
  • TABLE 93 ITHERA MEDICAL GMBH: COMPANY OVERVIEW
  • TABLE 94 ITHERA MEDICAL GMBH: PRODUCTS OFFERED
  • TABLE 95 ITHERA MEDICAL GMBH: OTHER DEVELOPMENTS, JANUARY 2021–MARCH 2024
  • TABLE 96 CYBERDYNE, INC.: COMPANY OVERVIEW
  • TABLE 97 CYBERDYNE INC.: PRODUCTS OFFERED
  • TABLE 98 ADVANTEST CORPORATION: COMPANY OVERVIEW
  • TABLE 99 ADVANTEST CORPORATION: PRODUCTS OFFERED
  • TABLE 100 TOMOWAVE LABORATORIES, INC.: COMPANY OVERVIEW
  • TABLE 101 TOMOWAVE LABORATORIES, INC.: PRODUCTS OFFERED
  • TABLE 102 ILLUMISONICS INC.: COMPANY OVERVIEW
  • TABLE 103 ILLUMISONICS INC.: PRODUCTS OFFERED
  • TABLE 104 INNOLAS LASER GMBH: COMPANY OVERVIEW
  • TABLE 105 INNOLAS LASER GMBH: PRODUCTS OFFERED
  • TABLE 106 KIBERO: COMPANY OVERVIEW
  • TABLE 107 KIBERO: PRODUCTS OFFERED
  • TABLE 108 OPOTEK LLC: COMPANY OVERVIEW
  • TABLE 109 OPOTEK LLC: PRODUCTS OFFERED
  • TABLE 110 VIBRONIX, INC.: COMPANY OVERVIEW
  • TABLE 111 VIBRONIX, INC.: PRODUCTS OFFERED
  • TABLE 112 PHOTOSOUND TECHNOLOGIES, INC.: COMPANY OVERVIEW
  • TABLE 113 PHOTOSOUND TECHNOLOGIES, INC.: PRODUCTS OFFERED
  • TABLE 114 VERASONICS, INC.: COMPANY OVERVIEW
  • TABLE 115 VERASONICS, INC.: PRODUCTS OFFERED
  • TABLE 116 LUXONUS INC.: COMPANY OVERVIEW
  • TABLE 117 LUXONUS INC.: PRODUCTS OFFERED
  • TABLE 118 LUXONUS INC.: PRODUCT APPROVALS, JANUARY 2021–MARCH 2024
  • TABLE 119 LUXONUS INC.: OTHER DEVELOPMENTS, JANUARY 2021–MARCH 2024
  • TABLE 120 CALPACT: COMPANY OVERVIEW
  • TABLE 121 CALPACT: PRODUCTS OFFERED
LIST OF FIGURES
 
  • FIGURE 1 RESEARCH DESIGN
  • FIGURE 2 BREAKDOWN OF PRIMARY INTERVIEWS: SUPPLY-SIDE AND DEMAND-SIDE PARTICIPANTS
  • FIGURE 3 BREAKDOWN OF PRIMARY INTERVIEWS: BY COMPANY TYPE, DESIGNATION, AND REGION
  • FIGURE 4 RESEARCH METHODOLOGY: HYPOTHESIS BUILDING
  • FIGURE 5 PHOTOACOUSTIC IMAGING MARKET SIZE ESTIMATION: APPROACH 1 (COMPANY REVENUE ESTIMATION)
  • FIGURE 6 PHOTOACOUSTIC IMAGING MARKET SIZE ESTIMATION: BOTTOM-UP APPROACH
  • FIGURE 7 CAGR PROJECTION: SUPPLY-SIDE ANALYSIS
  • FIGURE 8 TOP-DOWN APPROACH
  • FIGURE 9 DATA TRIANGULATION METHODOLOGY
  • FIGURE 10 PHOTOACOUSTIC IMAGING MARKET, BY PRODUCT, 2024 VS. 2029 (USD MILLION)
  • FIGURE 11 PHOTOACOUSTIC IMAGING MARKET, BY TECHNOLOGY, 2024 VS. 2029 (USD MILLION)
  • FIGURE 12 PHOTOACOUSTIC IMAGING MARKET, BY APPLICATION, 2024 VS. 2029
  • FIGURE 13 PHOTOACOUSTIC IMAGING MARKET: GEOGRAPHICAL SNAPSHOT
  • FIGURE 14 ADVANTAGES OVER CONTRAST-ENHANCED TECHNIQUES TO DRIVE ADOPTION OF PHOTOACOUSTIC IMAGING
  • FIGURE 15 PHOTOACOUSTIC IMAGING MARKET, BY TYPE, 2024 VS. 2029
  • FIGURE 16 NORTH AMERICA HELD LARGEST SHARE OF ALL APPLICATION SEGMENTS IN 2023
  • FIGURE 17 ASIA PACIFIC MARKETS TO REGISTER HIGHEST CAGR DURING FORECAST PERIOD
  • FIGURE 18 PHOTOACOUSTIC IMAGING MARKET: DRIVERS, RESTRAINTS, OPPORTUNITIES, AND CHALLENGES
  • FIGURE 19 BREAST CANCER INCIDENCE, 2022
  • FIGURE 20 PHOTOACOUSTIC IMAGING MARKET: VALUE CHAIN ANALYSIS
  • FIGURE 21 PHOTOACOUSTIC IMAGING MARKET: SUPPLY CHAIN ANALYSIS
  • FIGURE 22 PHOTOACOUSTIC IMAGING MARKET: ECOSYSTEM ANALYSIS
  • FIGURE 23 DEALS & FUNDING IN PHOTOACOUSTIC IMAGING MARKET, 2018–2022 (USD MILLION)
  • FIGURE 24 NUMBER OF INVESTOR DEALS, BY KEY PLAYER, 2018–2022
  • FIGURE 25 VALUE OF INVESTOR DEALS, BY KEY PLAYER, 2018–2022 (USD MILLION)
  • FIGURE 26 PRICES OF MAJOR PHOTOACOUSTIC IMAGING SYSTEMS, BY BRAND (USD THOUSAND) (2023)
  • FIGURE 27 AVERAGE SELLING PRICE OF MAJOR PHOTOACOUSTIC IMAGING SYSTEMS, BY REGION (USD THOUSAND) (2023)
  • FIGURE 28 PATENT DETAILS FOR BIOPHARMACEUTICAL PHOTOACOUSTIC IMAGING (JANUARY 2013–MAY 2024)
  • FIGURE 29 PHOTOACOUSTIC IMAGING MARKET: PORTER’S FIVE FORCES ANALYSIS
  • FIGURE 30 INFLUENCE OF STAKEHOLDERS ON BUYING PROCESS FOR TOP THREE CATEGORIES
  • FIGURE 31 KEY BUYING CRITERIA FOR PHOTOACOUSTIC IMAGING
  • FIGURE 32 REVENUE SHIFT IN PHOTOACOUSTIC IMAGING MARKET
  • FIGURE 33 ADJACENT MARKET ANALYSIS
  • FIGURE 34 NORTH AMERICA: PHOTOACOUSTIC IMAGING MARKET SNAPSHOT
  • FIGURE 35 ASIA PACIFIC: PHOTOACOUSTIC IMAGING MARKET SNAPSHOT
  • FIGURE 36 REVENUE ANALYSIS OF TOP THREE PLAYERS IN PHOTOACOUSTIC IMAGING MARKET (2020–2022)
  • FIGURE 37 PHOTOACOUSTIC IMAGING MARKET SHARE ANALYSIS OF KEY PLAYERS (2023)
  • FIGURE 38 SHARES OF LEADING PLAYERS IN PHOTOACOUSTIC IMAGING MARKET (2022)
  • FIGURE 39 PHOTOACOUSTIC IMAGING MARKET: COMPANY EVALUATION MATRIX (KEY PLAYERS), 2023
  • FIGURE 40 PHOTOACOUSTIC IMAGING MARKET: COMPANY FOOTPRINT
  • FIGURE 41 PHOTOACOUSTIC IMAGING MARKET: COMPANY EVALUATION MATRIX (STARTUPS/SMES), 2023
  • FIGURE 42 EV/EBITDA OF KEY VENDORS
  • FIGURE 43 YEAR-TO-DATE (YTD) PRICE TOTAL RETURN AND 5-YEAR STOCK BETA OF KEY VENDORS
  • FIGURE 44 BRAND/PRODUCT COMPARATIVE ANALYSIS, BY MODEL
  • FIGURE 45 FUJIFILM HOLDINGS CORPORATION: COMPANY SNAPSHOT (2022)
  • FIGURE 46 CYBERDYNE, INC: COMPANY SNAPSHOT (2023)
  • FIGURE 47 ADVANTEST CORPORATION: COMPANY SNAPSHOT (2022)

The study involved four major activities in estimating the current size of the photoacoustic imaging market. Exhaustive secondary research was done to collect information on the market, peer, and parent markets. The next step was to validate these findings, assumptions, and sizing with industry experts across the value chain through primary research. Both top-down and bottom-up approaches were employed to estimate the complete market size. After that, market breakdown and data triangulation were used to estimate the market size of segments and subsegments.

Secondary Research

The secondary research process involves the widespread use of secondary sources, directories, databases (such as Bloomberg Businessweek, Factiva, and D&B Hoovers), white papers, annual reports, company house documents, investor presentations, and SEC filings of companies. Secondary research was used to identify and collect information useful for the extensive, technical, market-oriented, and commercial photoacoustic imaging market study. It was also used to obtain important information about the key players and market classification & segmentation according to industry trends to the bottom-most level and key developments related to market and technology perspectives. A database of the key industry leaders was also prepared using secondary research.

Primary Research

In the primary research process, various sources from both the supply and demand sides were interviewed to obtain qualitative and quantitative information for this report. The primary sources from the supply side include industry experts such as CEOs, vice presidents, marketing and sales directors, technology & innovation directors, and related key executives from various key companies and organizations in the photoacoustic imaging market. The primary sources from the demand side include hospitals and imaging centers, research institutes and academia, among others. Primary research was conducted to validate the market segmentation, identify key players in the market, and gather insights on key industry trends & key market dynamics.

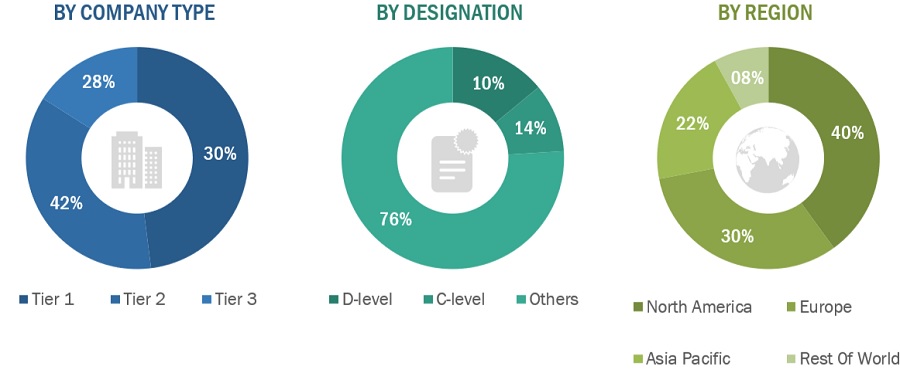
A breakdown of the primary respondents is provided below:
Photoacoustic Imaging Market Size, and Share

*Others include sales managers, marketing managers, business development managers, product managers, distributors, and suppliers.

Note: Companies are classified into tiers based on their total revenue. As of 2023, Tier 1 = >USD 1,000 million, Tier 2 = USD 500–1,000 million, and Tier 3 = <USD 500 million.

To know about the assumptions considered for the study, download the pdf brochure

Market Estimation Methodology

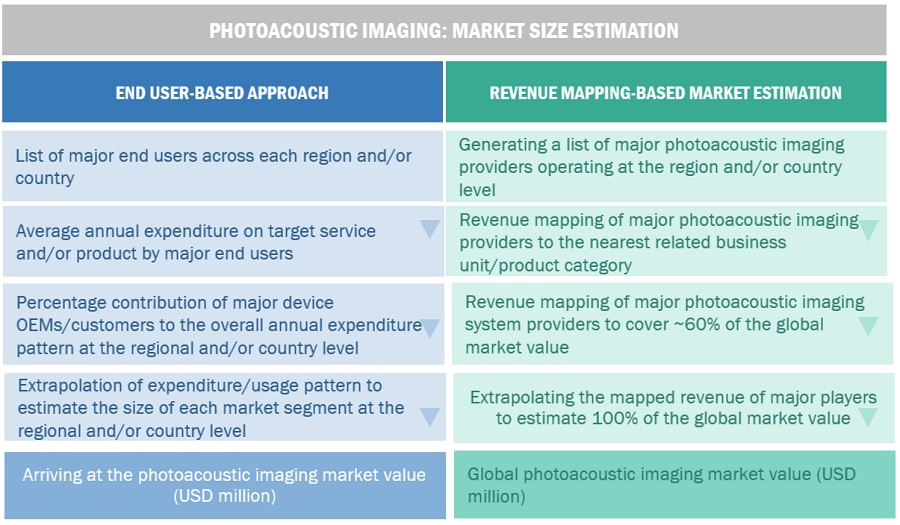
In this report, the global photoacoustic imaging market's size was determined using the revenue share analysis of leading players. For this purpose, key players in the market were identified, and their revenues from the photoacoustic imaging business were determined through various insights gathered during the primary and secondary research phases. Secondary research included the study of the annual and financial reports of the top market players. In contrast, primary research included extensive interviews with key opinion leaders, such as CEOs, directors, and marketing executives.

To calculate the global market value, segmental revenues were calculated based on the revenue mapping of major solution/service providers. This process involved the following steps:

  • A list of major players operating in the photoacoustic imaging market at the regional/country level
  • Product mapping of various manufacturers for each type of photoacoustic imaging product at the regional/country level
  • Mapping of annual revenue generated by listed major players from photoacoustic imaging products segments (or the nearest reported business unit/product category)
  • Revenue mapping of major players to cover at least ~60% of the global market share as of 2023
  • Extrapolation of the revenue mapping of the listed major players to derive the global market value of the respective segments/subsegments
  • Summation of the market value of all segments/subsegments to arrive at the global photoacoustic imaging market
Photoacoustic Imaging Market Size, and Share

To know about the assumptions considered for the study, Request for Free Sample Report

Data Triangulation

After arriving at the overall market size from the market size estimation process explained above, the photoacoustic imaging market was split into segments and subsegments. Data triangulation and market breakdown procedures were employed to complete the overall market engineering process and arrive at the exact statistics for all segments and subsegments. The data was triangulated by studying various factors and trends from both the demand and supply sides. Additionally, the photoacoustic imaging market was validated using both top-down and bottom-up approaches.

Market Definition

The photoacoustic imaging market refers to the industry segment focused on the development, production, and commercialization of imaging devices and technologies that utilize photoacoustic principles. Photoacoustic imaging combines the advantages of optical and ultrasound imaging techniques, allowing for high-resolution imaging of biological tissues with deep penetration depths. This market encompasses various stakeholders, including manufacturers of photoacoustic imaging systems, research institutions, healthcare providers, and regulatory bodies.

Key Stakeholders

  • Photoacoustic imaging manufacturers, suppliers, and providers
  • Hospitals and imaging  firms
  • Contract research organizations (CROs)
  • Academic & private research institutions
  • Research & development (R&D) companies
  • Academic institutions & private research institutions
  • Regulatory agencies
  • Quality control & assurance companies
  • Contract manufacturing organizations (CMOs)
  • Environmental & safety regulatory bodies

Objectives of the Study

  • To define, describe, and forecast the photoacoustic imaging market based on product, technology, type, application, end-user,  and region
  • To provide detailed information regarding the major factors influencing the growth potential of the photoacoustic imaging market (drivers, restraints, opportunities, challenges, and trends)
  • To analyze the micromarkets with respect to individual growth trends, future prospects, and contributions to the photoacoustic imaging market
  • To analyze key growth opportunities in the photoacoustic imaging market for key stakeholders and provide details of the competitive landscape for market leaders
  • To forecast the size of market segments and/or subsegments with respect to five major regions, namely, North America (US and Canada), Europe (Germany, France, the UK,and the RoE), Asia Pacific (Japan, China, India, and the RoAPAC), Rest of world.
  • To profile the key players in the global photoacoustic imaging market and comprehensively analyze their market shares and core competencies
  • To track and analyze the competitive developments undertaken in the global photoacoustic imaging market, such as product launches; agreements; expansions; and mergers & acquisitions.

Available Customizations

With the given market data, MarketsandMarkets offers customizations per the company’s specific needs. The following customization options are available for the present photoacoustic imaging market report:

Product Analysis

  • Product matrix, which gives a detailed comparison of the product portfolios of the top five companies

Company Information

  • Detailed analysis and profiling of additional market players (up to five)

Geographic Analysis

  • Further breakdown of the Rest of Europe photoacoustic imaging into Russia, Belgium, the Netherlands, Switzerland, Austria, Finland, Sweden, Poland, and Portugal, among others
  • Further breakdown of the Rest of Asia Pacific photoacoustic imaging into Singapore, Taiwan, New Zealand, Philippines, Malaysia, and other APAC countries

Previous Versions of this Report

"Our USP is "providing game-changing business opportunities reports with free customization" - so please feel free to provide us with your specific areas of interest / business challenges in much greater detail !!"

We appreciate your interest in this report. Once you fill out the form, you'll be immediately directed to an exclusive solution tailored to your needs. This high-value offering can help boost your revenue by 30% - a must-see opportunity for anyone looking to maximize growth.


By clicking the "Submit" button, you are agreeing to the Terms of Use and Privacy Policy.

Custom Market Research Services

We Will Customise The Research For You, In Case The Report Listed Above Does Not Meet With Your Requirements

Get 10% Free Customisation

Growth opportunities and latent adjacency in Photoacoustic Imaging Market

DMCA.com Protection Status