2
RESEARCH METHODOLOGY
40
5
MARKET OVERVIEW
Explore the booming demand for sustainable, energy-efficient motors amid rising costs and tech innovations.
60
5.2.1.1
SURGING DEMAND FOR ENERGY-EFFICIENT AND LOW-COST MAINTENANCE MOTORS ACROSS DIFFERENT INDUSTRIES
5.2.1.2
INCREASING USE OF PERMANENT MAGNET MOTORS IN ELECTRIC VEHICLES
5.2.1.3
RISING DEMAND FOR SUSTAINABLE SOLUTIONS IN HVAC INDUSTRY
5.2.2.1
HIGH COST OF PERMANENT MAGNET MOTORS
5.2.2.2
INCREASED PRICES OF RAW MATERIALS
5.2.3.1
ADOPTION OF COST-EFFECTIVE FERRITE PERMANENT MAGNETS
5.2.3.2
EMERGENCE OF ROBOTICS TECHNOLOGY
5.2.3.3
INCREASING USE OF IOT AND 5G TECHNOLOGIES ACROSS INDUSTRIES
5.2.4.1
EASY AVAILABILITY OF LOW-QUALITY AND INEXPENSIVE ELECTRIC MOTORS
5.3
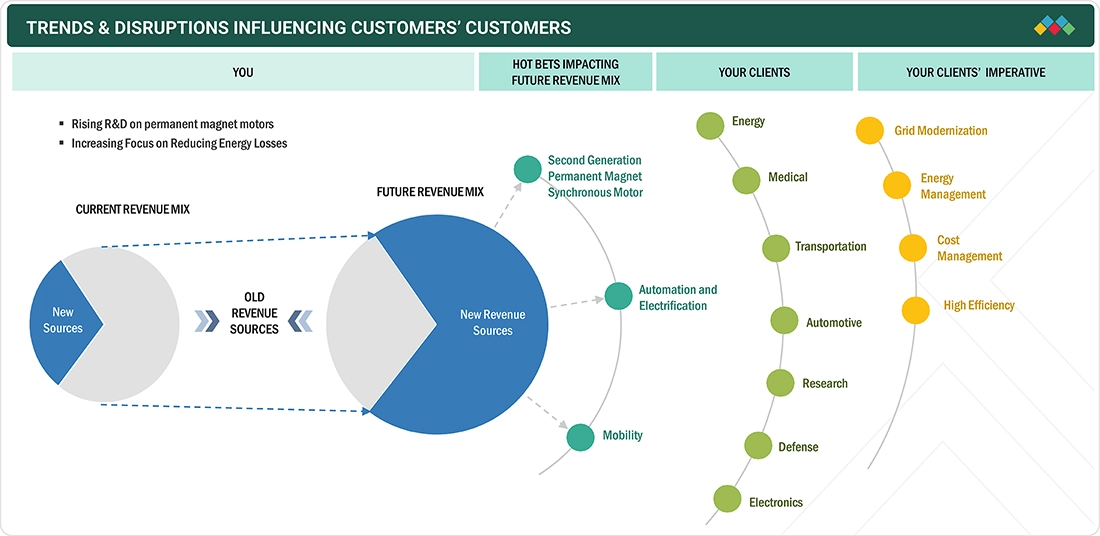
TRENDS/DISRUPTIONS IMPACTING CUSTOMER BUSINESS
5.6
PORTER’S FIVE FORCES ANALYSIS
5.6.1
THREAT OF SUBSTITUTES
5.6.2
BARGAINING POWER OF SUPPLIERS
5.6.3
BARGAINING POWER OF BUYERS
5.6.4
THREAT OF NEW ENTRANTS
5.6.5
INTENSITY OF COMPETITIVE RIVALRY
5.7.1
AVERAGE SELLING PRICE TREND OF PERMANENT MAGNET MOTORS, BY TYPE, 2021–2024
5.7.2
AVERAGE SELLING PRICE TREND OF PERMANENT MAGNET MOTORS, BY REGION, 2021–2024
5.8
TARIFF ANALYSIS AND REGULATORY LANDSCAPE
5.8.1
TARIFFS RELATED TO PERMANENT MAGNET MOTORS
5.8.2
REGULATORY BODIES, GOVERNMENT AGENCIES, AND OTHER ORGANIZATIONS
5.9.1.1
ADVANCED MAGNETIC MATERIALS
5.9.2
ADJACENT TECHNOLOGIES
5.9.2.1
ENERGY RECOVERY & REGENERATIVE BRAKING
5.12
IMPACT OF GENERATIVE AI/AI ON PERMANENT MAGNET MOTOR MARKET
5.12.1
ADOPTION OF GENERATIVE AI/AI IN PERMANENT MAGNET MOTOR MARKET
5.12.2
IMPACT OF GENERATIVE AI/AI ON END USER, BY REGION
5.12.3
IMPACT OF AI ON PERMANENT MAGNET MOTOR MARKET, BY REGION
5.13
IMPACT OF 2025 US TARIFF – OVERVIEW
5.13.3
IMPACT ON COUNTRY/REGION
5.13.3.3
EUROPEAN MANUFACTURER STRATEGIES
5.13.3.6
MIDDLE EAST & AFRICA
5.13.3.7
IMPACT ON END USER
6
PERMANENT MAGNET MOTOR MARKET, BY TYPE
Market Size & Growth Rate Forecast Analysis to 2030 in USD Million | 8 Data Tables
90
6.2
PERMANENT MAGNET AC MOTORS
6.2.1
HIGH TORQUE CAPACITY AND ABILITY TO WITHSTAND HIGH OVERLOAD TO INCREASE ADOPTION
6.3
PERMANENT MAGNET DC MOTORS
6.3.1
RISING DEMAND FOR COMPACT, ECONOMICAL SOLUTIONS FOR LOW-TORQUE APPLICATIONS TO FUEL MARKET GROWTH
6.4.1
ELEVATING USE IN ELECTRIC VEHICLES, HVAC AND MEDICAL EQUIPMENT, AND ROBOTICS TO SUPPORT MARKET GROWTH
7
PERMANENT MAGNET MOTOR MARKET, BY POWER RATING
Market Size & Growth Rate Forecast Analysis to 2030 in USD Million | 10 Data Tables
96
7.2.1
HIGH STARTING TORQUE AND OVERLOAD CAPACITY TO SPUR DEMAND
7.3.1
PRINTING & PACKAGING INDUSTRY TO CONTRIBUTE MOST TO SEGMENTAL GROWTH
7.4.1
RISING USE IN AEROSPACE AND RAILWAY APPLICATIONS TO STIMULATE SEGMENTAL GROWTH
7.5.1
ABILITY TO OPERATE HEAVY-DUTY EQUIPMENT TO INCREASE ADOPTION
8
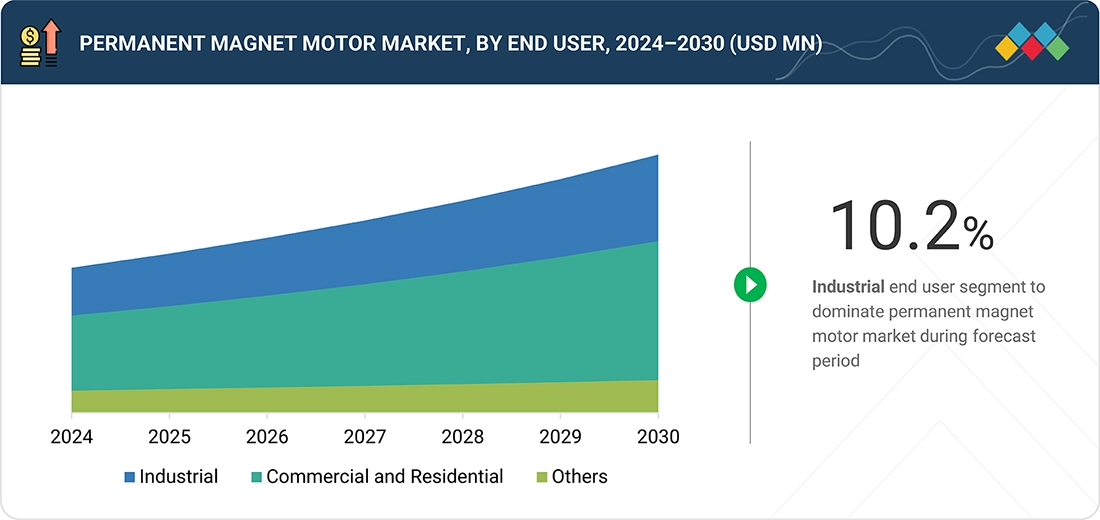
PERMANENT MAGNET MOTOR MARKET, BY END USER
Market Size & Growth Rate Forecast Analysis to 2030 in USD Million | 46 Data Tables
103
8.2.1.1
INCREASING DEMAND FROM EV MANUFACTURERS TO ACCELERATE MARKET GROWTH
8.2.2.1
RISING NEED FOR HIGH STARTING TORQUE AND ENERGY EFFICIENCY TO BOOST DEMAND
8.2.3.1
INCREASING DEMAND FOR COMMERCIAL PRINTING AND FOOD PACKAGING IN ASIA PACIFIC TO FUEL MARKET GROWTH
8.2.4
AEROSPACE & AVIATION
8.2.4.1
DEVELOPMENT OF ADVANCEMENTS IN ELECTRIC AND HYBRID AIRCRAFT TO FOSTER MARKET GROWTH
8.2.5.1
TECHNOLOGICAL IMPROVEMENTS IN MANUFACTURING PROCESSES AND RAPID OBSOLESCENCE OF ELECTRONIC PRODUCTS TO SPUR DEMAND
8.2.6.1
GROWING ADOPTION OF AGVS AND COBOTS BY MANUFACTURING FIRMS TO SUPPORT MARKET GROWTH
8.2.7.1
SIGNIFICANT FOCUS ON ENERGY SAVINGS AND HYGIENE COMPLIANCE TO DRIVE ADOPTION
8.2.8
CHEMICALS & PETROCHEMICALS
8.2.8.1
INCREASING SHALE GAS EXPLORATION IN US AND CANADA TO STIMULATE MARKET GROWTH
8.3
COMMERCIAL & RESIDENTIAL
8.3.1.5
OTHER COMMERCIAL END USERS
8.3.2.1
RAPID URBANIZATION, INCREASING POPULATION, AND IMPROVEMENTS IN MOTOR TECHNOLOGY TO SUPPORT MARKET GROWTH
9
PERMANENT MAGNET MOTOR MARKET, BY REGION
Comprehensive coverage of 8 Regions with country-level deep-dive of 18 Countries | 364 Data Tables.
127
9.2.1.1
RISING USE IN INDUSTRIAL APPLICATIONS TO FOSTER MARKET GROWTH
9.2.2.1
GROWING FOCUS ON TECHNOLOGICALLY ADVANCED INDUSTRIAL EQUIPMENT AND MANUFACTURING PROCESSES TO DRIVE DEMAND
9.2.3.1
ONGOING INDUSTRIALIZATION TO ACCELERATE DEMAND
9.2.4.1
GROWING FOCUS ON DIGITALIZATION AND INCREASING ADOPTION OF ADVANCED MANUFACTURING TECHNOLOGIES TO DRIVE MARKET
9.2.5.1
SURGING ADOPTION OF RENEWABLE ENERGY TECHNOLOGIES TO FACILITATE MARKET GROWTH
9.2.6
REST OF ASIA PACIFIC
9.3.1.1
ADVANCEMENTS IN SUPPLY CHAIN AND SUPPORTIVE DECARBONIZATION POLICIES TO ACCELERATE DEMAND
9.3.2.1
ROBUST GOVERNMENTAL INCENTIVES FOR ELECTRIFICATION OF INDUSTRIAL APPLICATIONS TO STIMULATE DEMAND
9.3.3.1
ADVANCEMENTS IN AUTOMOTIVE MODELS TO SUPPORT MARKET GROWTH
9.4.1.1
INCREASING INVESTMENT IN AUTOMOTIVE SECTORS TO FUEL DEMAND
9.4.2.1
RISING INVESTMENT IN AUTOMATION AND ELECTRONICS TO FACILITATE MARKET GROWTH
9.4.3.1
GROWING INVESTMENTS IN ENHANCING EV MANUFACTURING CAPABILITY TO FOSTER MARKET GROWTH
9.4.4.1
INCREASING HEAVY INVESTMENTS IN RENEWABLE ENERGY TO CREATE GROW OPPORTUNITIES
9.4.5.1
ELEVATING USE OF PERMANENT MAGNET MOTORS IN AUTOMATION AND RENEWABLE ENERGY PROJECTS TO CONTRIBUTE TO MARKET GROWTH
9.5.1.1
TRANSITION TOWARD SUSTAINABLE MANUFACTURING PRACTICES TO SPUR DEMAND
9.5.2.1
INCREASING FOCUS ON RENEWABLE ENERGY AND ELECTRIC MOBILITY TO DRIVE MARKET
9.5.3
REST OF SOUTH AMERICA
9.6.2.1
GOVERNMENT’S PUSH FOR ENERGY-EFFICIENT TECHNOLOGIES TO FUEL MARKET GROWTH
9.6.3
REST OF MIDDLE EAST & AFRICA
10
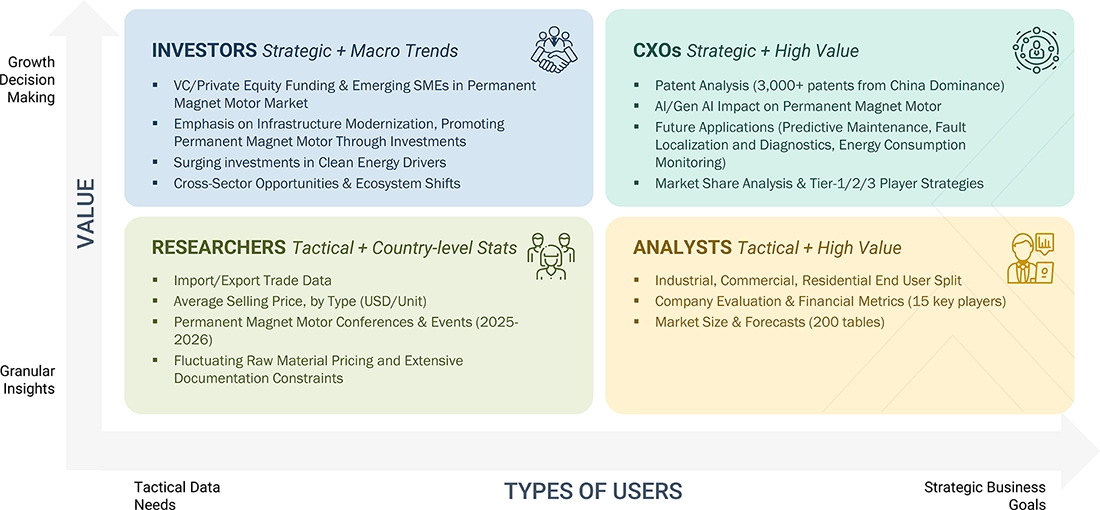
COMPETITIVE LANDSCAPE
Uncover strategic moves and market dominance of key players shaping the competitive landscape.
265
10.1
KEY PLAYER STRATEGIES
10.2
KEY PLAYER STRATEGIES/RIGHT TO WIN, 2021–2025
10.3
MARKET SHARE ANALYSIS, 2024
10.4
REVENUE ANALYSIS, 2020–2024
10.5
COMPANY EVALUATION MATRIX: KEY PLAYERS, 2024
10.5.5
COMPANY FOOTPRINT: KEY PLAYERS, 2024
10.5.5.1
COMPANY FOOTPRINT
10.5.5.2
REGION FOOTPRINT
10.5.5.4
POWER RATING FOOTPRINT
10.5.5.5
END USER FOOTPRINT
10.6
COMPETITIVE SCENARIO
10.6.1
PRODUCT LAUNCHES/ENHANCEMENTS
11
COMPANY PROFILES
In-depth Company Profiles of Leading Market Players with detailed Business Overview, Product and Service Portfolio, Recent Developments, and Unique Analyst Perspective (MnM View)
280
11.1.1.1
BUSINESS OVERVIEW
11.1.1.2
PRODUCTS/SERVICES/SOLUTIONS OFFERED
11.1.1.3
RECENT DEVELOPMENTS
11.1.3
ROCKWELL AUTOMATION
11.1.5
JOHNSON ELECTRIC HOLDINGS LIMITED
11.1.6
WOLONG ELECTRIC GROUP
11.1.10
TOSHIBA CORPORATION
11.1.11
REGAL REXNORD CORPORATION
11.1.12
YASKAWA ELECTRIC CORPORATION
11.2.1
DUMORE CORPORATION
11.2.4
CARTER MOTOR COMPANY
12.1
INSIGHTS FROM INDUSTRY EXPERTS
12.3
KNOWLEDGESTORE: MARKETSANDMARKETS’ SUBSCRIPTION PORTAL
12.4
CUSTOMIZATION OPTIONS
TABLE 1
PERMANENT MAGNET MOTOR MARKET: INCLUSIONS AND EXCLUSIONS, BY POWER RATING
TABLE 2
PERMANENT MAGNET MOTOR MARKET: INCLUSIONS AND EXCLUSIONS, BY TYPE
TABLE 3
PERMANENT MAGNET MOTOR MARKET: INCLUSIONS AND EXCLUSIONS, BY END USER
TABLE 4
PERMANENT MAGNET MOTOR MARKET: INCLUSIONS AND EXCLUSIONS, BY REGION
TABLE 5
PERMANENT MAGNET MOTOR MARKET SIZE ESTIMATION METHODOLOGY (DEMAND SIDE)
TABLE 6
PERMANENT MAGNET MOTOR MARKET: RISK ANALYSIS
TABLE 7
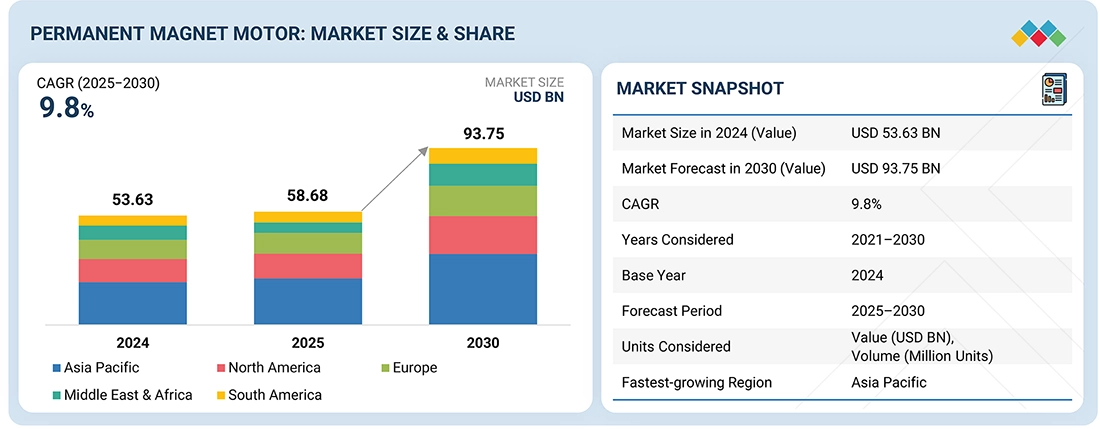
PERMANENT MAGNET MOTOR MARKET SNAPSHOT
TABLE 8
ROLE OF COMPANIES IN PERMANENT MAGNET MOTOR ECOSYSTEM
TABLE 9
PERMANENT MAGNET MOTOR: PORTER’S FIVE FORCES ANALYSIS
TABLE 10
AVERAGE SELLING PRICE TREND OF PERMANENT MAGNET MOTORS, BY TYPE, 2021–2024 (USD/UNIT)
TABLE 11
AVERAGE SELLING PRICE TREND OF PERMANENT MAGNET MOTORS, BY REGION, 2021–2024 (USD/UNIT)
TABLE 12
PERMANENT MAGNET MOTOR MARKET: AVERAGE TARIFF, BY COUNTRY, 2024
TABLE 13
NORTH AMERICA: REGULATORY BODIES, GOVERNMENT AGENCIES, AND OTHER ORGANIZATIONS
TABLE 14
EUROPE: REGULATORY BODIES, GOVERNMENT AGENCIES, AND OTHER ORGANIZATIONS
TABLE 15
ASIA PACIFIC: REGULATORY BODIES, GOVERNMENT AGENCIES, AND OTHER ORGANIZATIONS
TABLE 16
MIDDLE EAST & AFRICA: REGULATORY BODIES, GOVERNMENT AGENCIES, AND OTHER ORGANIZATIONS
TABLE 17
LIST OF MAJOR PATENTS, 2018–2023
TABLE 18
CASE STUDY 1: ABB BOOSTS OPERATIONAL EFFICIENCY WITH SMART, RESILIENT MOTOR TECHNOLOGY
TABLE 19
CASE STUDY 2: MAXIMIZING PERMANENT MAGNET MOTOR EFFICIENCY WITH MAGCAM TECHNOLOGY
TABLE 20
CASE STUDY 3: MAGNEFFICIENT PMM SAVED OPERATOR 18.5% ON ELECTRICAL SPENDING COMPARED TO IMS
TABLE 21
US-ADJUSTED RECIPROCAL TARIFF RATES
TABLE 22
EXPECTED CHANGE IN PRICES AND POTENTIAL IMPACT ON END USERS DUE TO TARIFF ENFORCEMENT
TABLE 23
PERMANENT MAGNET MOTOR MARKET, BY TYPE, 2021–2024 (USD MILLION)
TABLE 24
PERMANENT MAGNET MOTOR MARKET, BY TYPE, 2025–2030 (USD MILLION)
TABLE 25
PERMANENT MAGNET AC MOTORS: PERMANENT MAGNET MOTOR MARKET, BY REGION, 2021–2024 (USD MILLION)
TABLE 26
PERMANENT MAGNET AC MOTORS: PERMANENT MAGNET MOTOR MARKET, BY REGION, 2025–2030 (USD MILLION)
TABLE 27
PERMANENT MAGNET DC MOTORS: PERMANENT MAGNET MOTOR MARKET, BY REGION, 2021–2024 (USD MILLION)
TABLE 28
PERMANENT MAGNET DC MOTORS: PERMANENT MAGNET MOTOR MARKET, BY REGION, 2025–2030 (USD MILLION)
TABLE 29
BRUSHLESS DC MOTORS: PERMANENT MAGNET MOTOR MARKET, BY REGION, 2021–2024 (USD MILLION)
TABLE 30
BRUSHLESS DC MOTORS: PERMANENT MAGNET MOTOR MARKET, BY REGION, 2025–2030 (USD MILLION)
TABLE 31
PERMANENT MAGNET MOTOR MARKET, BY POWER RATING, 2021–2024 (USD MILLION)
TABLE 32
PERMANENT MAGNET MOTOR MARKET, BY POWER RATING, 2025–2030 (USD MILLION)
TABLE 33
UP TO 25 KW: PERMANENT MAGNET MOTOR MARKET, BY REGION, 2021–2024 (USD MILLION)
TABLE 34
UP TO 25 KW: PERMANENT MAGNET MOTOR MARKET, BY REGION, 2025–2030 (USD MILLION)
TABLE 35
26–100 KW: PERMANENT MAGNET MOTOR MARKET, BY REGION, 2021–2024 (USD MILLION)
TABLE 36
26–100 KW: PERMANENT MAGNET MOTOR MARKET, BY REGION, 2025–2030 (USD MILLION)
TABLE 37
101–300 KW: PERMANENT MAGNET MOTOR MARKET, BY REGION, 2021–2024 (USD MILLION)
TABLE 38
101–300 KW: PERMANENT MAGNET MOTOR MARKET, BY REGION, 2025–2030 (USD MILLION)
TABLE 39
ABOVE 300 KW: PERMANENT MAGNET MOTOR MARKET, BY REGION, 2021–2024 (USD MILLION)
TABLE 40
ABOVE 300 KW: PERMANENT MAGNET MOTOR MARKET, BY REGION, 2025–2030 (USD MILLION)
TABLE 41
PERMANENT MAGNET MOTOR MARKET, BY END USER, 2021–2024 (USD MILLION)
TABLE 42
PERMANENT MAGNET MOTOR MARKET, BY END USER, 2025–2030 (USD MILLION)
TABLE 43
PERMANENT MAGNET MOTOR MARKET, BY INDUSTRIAL END USER, 2021–2024 (USD MILLION)
TABLE 44
PERMANENT MAGNET MOTOR MARKET, BY INDUSTRIAL END USER, 2025–2030 (USD MILLION)
TABLE 45
PERMANENT MAGNET MOTOR MARKET, BY COMMERCIAL & RESIDENTIAL END USER, 2021–2024 (USD MILLION)
TABLE 46
PERMANENT MAGNET MOTOR MARKET, BY COMMERCIAL & RESIDENTIAL END USER, 2025–2030 (USD MILLION)
TABLE 47
PERMANENT MAGNET MOTOR MARKET, BY COMMERCIAL END USER, 2021–2024 (USD MILLION)
TABLE 48
PERMANENT MAGNET MOTOR MARKET, BY COMMERCIAL END USER, 2025–2030 (USD MILLION)
TABLE 49
PERMANENT MAGNET MOTOR MARKET FOR INDUSTRIAL, BY REGION, 2021–2024 (USD MILLION)
TABLE 50
PERMANENT MAGNET MOTOR MARKET FOR INDUSTRIAL, BY REGION, 2025–2030 (USD MILLION)
TABLE 51
PERMANENT MAGNET MOTOR MARKET FOR AUTOMOTIVE, BY REGION, 2021–2024 (USD MILLION)
TABLE 52
PERMANENT MAGNET MOTOR MARKET FOR AUTOMOTIVE: BY REGION, 2025–2030 (USD MILLION)
TABLE 53
PERMANENT MAGNET MOTOR MARKET FOR TEXTILES, BY REGION, 2021–2024 (USD MILLION)
TABLE 54
PERMANENT MAGNET MOTOR MARKET FOR TEXTILES, BY REGION, 2025–2030 (USD MILLION)
TABLE 55
PERMANENT MAGNET MOTOR MARKET FOR PULP & PAPER, BY REGION, 2021–2024 (USD MILLION)
TABLE 56
PERMANENT MAGNET MOTOR MARKET FOR PULP & PAPER, BY REGION, 2025–2030 (USD MILLION)
TABLE 57
PERMANENT MAGNET MOTOR MARKET FOR AEROSPACE & AVIATION, BY REGION, 2021–2024 (USD MILLION)
TABLE 58
PERMANENT MAGNET MOTOR MARKET FOR AEROSPACE & AVIATION, BY REGION, 2025–2030 (USD MILLION)
TABLE 59
PERMANENT MAGNET MOTOR MARKET FOR ELECTRONICS, BY REGION, 2021–2024 (USD MILLION)
TABLE 60
PERMANENT MAGNET MOTOR MARKET FOR ELECTRONICS, BY REGION, 2025–2030 (USD MILLION)
TABLE 61
PERMANENT MAGNET MOTOR MARKET FOR ROBOTICS, BY REGION, 2021–2024 (USD MILLION)
TABLE 62
PERMANENT MAGNET MOTOR MARKET FOR ROBOTICS, BY REGION, 2025–2030 (USD MILLION)
TABLE 63
PERMANENT MAGNET MOTOR MARKET FOR FOOD & BEVERAGES, BY REGION, 2021–2024 (USD MILLION)
TABLE 64
PERMANENT MAGNET MOTOR MARKET FOR FOOD & BEVERAGES, BY REGION, 2025–2030 (USD MILLION)
TABLE 65
PERMANENT MAGNET MOTOR MARKET FOR CHEMICALS & PETROCHEMICALS, BY REGION, 2021–2024 (USD MILLION)
TABLE 66
PERMANENT MAGNET MOTOR MARKET FOR CHEMICALS & PETROCHEMICALS, BY REGION, 2025–2030 (USD MILLION)
TABLE 67
PERMANENT MAGNET MOTOR MARKET FOR OTHER END USERS, BY REGION, 2021–2024 (USD MILLION)
TABLE 68
PERMANENT MAGNET MOTOR MARKET FOR OTHER END USERS, BY REGION, 2025–2030 (USD MILLION)
TABLE 69
PERMANENT MAGNET MOTOR MARKET FOR COMMERCIAL & RESIDENTIAL, BY REGION, 2021–2024 (USD MILLION)
TABLE 70
PERMANENT MAGNET MOTOR MARKET FOR COMMERCIAL & RESIDENTIAL, BY REGION, 2025–2030 (USD MILLION)
TABLE 71
PERMANENT MAGNET MOTOR MARKET FOR COMMERCIAL, BY REGION, 2021–2024 (USD MILLION)
TABLE 72
PERMANENT MAGNET MOTOR MARKET FOR COMMERCIAL, BY REGION, 2025–2030 (USD MILLION)
TABLE 73
PERMANENT MAGNET MOTOR MARKET FOR MALLS, BY REGION, 2021–2024 (USD MILLION)
TABLE 74
PERMANENT MAGNET MOTOR MARKET FOR MALLS, BY REGION, 2025–2030 (USD MILLION)
TABLE 75
PERMANENT MAGNET MOTOR MARKET FOR OFFICES, BY REGION, 2021–2024 (USD MILLION)
TABLE 76
PERMANENT MAGNET MOTOR MARKET FOR OFFICES, BY REGION, 2025–2030 (USD MILLION)
TABLE 77
PERMANENT MAGNET MOTOR MARKET FOR BANKS, BY REGION, 2021–2024 (USD MILLION)
TABLE 78
PERMANENT MAGNET MOTOR MARKET FOR BANKS, BY REGION, 2025–2030 (USD MILLION)
TABLE 79
PERMANENT MAGNET MOTOR MARKET FOR HEALTHCARE, BY REGION, 2021–2024 (USD MILLION)
TABLE 80
PERMANENT MAGNET MOTOR MARKET FOR HEALTHCARE, BY REGION, 2025–2030 (USD MILLION)
TABLE 81
PERMANENT MAGNET MOTOR MARKET FOR OTHER COMMERCIAL END USERS, BY REGION, 2021–2024 (USD MILLION)
TABLE 82
PERMANENT MAGNET MOTOR MARKET FOR OTHER COMMERCIAL END USERS, BY REGION, 2025–2030 (USD MILLION)
TABLE 83
PERMANENT MAGNET MOTOR MARKET FOR RESIDENTIAL, BY REGION, 2021–2024 (USD MILLION)
TABLE 84
PERMANENT MAGNET MOTOR MARKET FOR RESIDENTIAL, BY REGION, 2025–2030 (USD MILLION)
TABLE 85
PERMANENT MAGNET MOTOR MARKET FOR OTHER END USERS, BY REGION, 2021–2024 (USD MILLION)
TABLE 86
PERMANENT MAGNET MOTOR MARKET FOR OTHER END USERS, BY REGION, 2025–2030 (USD MILLION)
TABLE 87
PERMANENT MAGNET MOTOR MARKET, BY REGION, 2021–2024 (USD MILLION)
TABLE 88
PERMANENT MAGNET MOTOR MARKET, BY REGION, 2025–2030 (USD MILLION)
TABLE 89
PERMANENT MAGNET MOTOR MARKET, BY REGION, 2021–2024 (MILLION UNITS)
TABLE 90
PERMANENT MAGNET MOTOR MARKET, BY REGION, 2025–2030 (MILLION UNITS)
TABLE 91
ASIA PACIFIC: PERMANENT MAGNET MOTOR MARKET, BY TYPE, 2021–2024 (USD MILLION)
TABLE 92
ASIA PACIFIC: PERMANENT MAGNET MOTOR MARKET, BY TYPE, 2025–2030 (USD MILLION)
TABLE 93
ASIA PACIFIC: PERMANENT MAGNET MOTOR MARKET, BY POWER RATING, 2021–2024 (USD MILLION)
TABLE 94
ASIA PACIFIC: PERMANENT MAGNET MOTOR MARKET, BY POWER RATING, 2025–2030 (USD MILLION)
TABLE 95
ASIA PACIFIC: PERMANENT MAGNET MOTOR MARKET, BY END USER, 2021–2024 (USD MILLION)
TABLE 96
ASIA PACIFIC: PERMANENT MAGNET MOTOR MARKET, BY END USER, 2025–2030 (USD MILLION)
TABLE 97
ASIA PACIFIC: PERMANENT MAGNET MOTOR MARKET, BY INDUSTRIAL END USER, 2021–2024 (USD MILLION)
TABLE 98
ASIA PACIFIC: PERMANENT MAGNET MOTOR MARKET, BY INDUSTRIAL END USER, 2025–2030 (USD MILLION)
TABLE 99
ASIA PACIFIC: PERMANENT MAGNET MOTOR MARKET, BY COMMERCIAL & RESIDENTIAL END USER, 2021–2024 (USD MILLION)
TABLE 100
ASIA PACIFIC: PERMANENT MAGNET MOTOR MARKET, BY COMMERCIAL & RESIDENTIAL END USER, 2025–2030 (USD MILLION)
TABLE 101
ASIA PACIFIC: PERMANENT MAGNET MOTOR MARKET, BY COMMERCIAL END USER, 2021–2024 (USD MILLION)
TABLE 102
ASIA PACIFIC: PERMANENT MAGNET MOTOR MARKET, BY COMMERCIAL END USER, 2025–2030 (USD MILLION)
TABLE 103
ASIA PACIFIC: PERMANENT MAGNET MOTOR MARKET, BY COUNTRY, 2021–2024 (USD MILLION)
TABLE 104
ASIA PACIFIC: PERMANENT MAGNET MOTOR MARKET, BY COUNTRY, 2025–2030 (USD MILLION)
TABLE 105
CHINA: PERMANENT MAGNET MOTOR MARKET, BY TYPE, 2021–2024 (USD MILLION)
TABLE 106
CHINA: PERMANENT MAGNET MOTOR MARKET, BY TYPE, 2025–2030 (USD MILLION)
TABLE 107
CHINA: PERMANENT MAGNET MOTOR MARKET, BY POWER RATING, 2021–2024 (USD MILLION)
TABLE 108
CHINA: PERMANENT MAGNET MOTOR MARKET, BY POWER RATING, 2025–2030 (USD MILLION)
TABLE 109
CHINA: PERMANENT MAGNET MOTOR MARKET, BY END USER, 2021–2024 (USD MILLION)
TABLE 110
CHINA: PERMANENT MAGNET MOTOR MARKET, BY END USER, 2025–2030 (USD MILLION)
TABLE 111
CHINA: PERMANENT MAGNET MOTOR MARKET, BY INDUSTRIAL END USER, 2021–2024 (USD MILLION)
TABLE 112
CHINA: PERMANENT MAGNET MOTOR MARKET, BY INDUSTRIAL END USER, 2025–2030 (USD MILLION)
TABLE 113
CHINA: PERMANENT MAGNET MOTOR MARKET, BY COMMERCIAL & RESIDENTIAL END USER, 2021–2024 (USD MILLION)
TABLE 114
HINA: PERMANENT MAGNET MOTOR MARKET, BY COMMERCIAL & RESIDENTIAL END USER, 2025–2030 (USD MILLION)
TABLE 115
CHINA: PERMANENT MAGNET MOTOR MARKET, BY COMMERCIAL END USER, 2021–2024 (USD MILLION)
TABLE 116
CHINA: PERMANENT MAGNET MOTOR MARKET, BY COMMERCIAL END USER, 2025–2030 (USD MILLION)
TABLE 117
JAPAN: PERMANENT MAGNET MOTOR MARKET, BY TYPE, 2021–2024 (USD MILLION)
TABLE 118
JAPAN: PERMANENT MAGNET MOTOR MARKET, BY TYPE, 2025–2030 (USD MILLION)
TABLE 119
JAPAN: PERMANENT MAGNET MOTOR MARKET, BY POWER RATING, 2021–2024 (USD MILLION)
TABLE 120
JAPAN: PERMANENT MAGNET MOTOR MARKET, BY POWER RATING, 2025–2030 (USD MILLION)
TABLE 121
JAPAN: PERMANENT MAGNET MOTOR MARKET, BY END USER, 2021–2024 (USD MILLION)
TABLE 122
JAPAN: PERMANENT MAGNET MOTOR MARKET, BY END USER, 2025–2030 (USD MILLION)
TABLE 123
JAPAN: PERMANENT MAGNET MOTOR MARKET, BY INDUSTRIAL END USER, 2021–2024 (USD MILLION)
TABLE 124
JAPAN: PERMANENT MAGNET MOTOR MARKET, BY INDUSTRIAL END USER, 2025–2030 (USD MILLION)
TABLE 125
JAPAN: PERMANENT MAGNET MOTOR MARKET, BY COMMERCIAL & RESIDENTIAL END USER, 2021–2024 (USD MILLION)
TABLE 126
JAPAN: PERMANENT MAGNET MOTOR MARKET, BY COMMERCIAL & RESIDENTIAL END USER, 2025–2030 (USD MILLION)
TABLE 127
JAPAN: PERMANENT MAGNET MOTOR MARKET, BY COMMERCIAL END USER, 2021–2024 (USD MILLION)
TABLE 128
JAPAN: PERMANENT MAGNET MOTOR MARKET, BY COMMERCIAL END USER, 2025–2030 (USD MILLION)
TABLE 129
INDIA: PERMANENT MAGNET MOTOR MARKET, BY TYPE, 2021–2024 (USD MILLION)
TABLE 130
INDIA: PERMANENT MAGNET MOTOR MARKET, BY TYPE, 2025–2030 (USD MILLION)
TABLE 131
INDIA: PERMANENT MAGNET MOTOR MARKET, BY POWER RATING, 2021–2024 (USD MILLION)
TABLE 132
INDIA: PERMANENT MAGNET MOTOR MARKET, BY POWER RATING, 2025–2030 (USD MILLION)
TABLE 133
INDIA: PERMANENT MAGNET MOTOR MARKET, BY END USER, 2021–2024 (USD MILLION)
TABLE 134
INDIA: PERMANENT MAGNET MOTOR MARKET, BY END USER, 2025–2030 (USD MILLION)
TABLE 135
INDIA: PERMANENT MAGNET MOTOR MARKET, BY INDUSTRIAL END USER, 2021–2024 (USD MILLION)
TABLE 136
INDIA: PERMANENT MAGNET MOTOR MARKET, BY INDUSTRIAL END USER, 2025–2030 (USD MILLION)
TABLE 137
INDIA: PERMANENT MAGNET MOTOR MARKET, BY COMMERCIAL & RESIDENTIAL END USER, 2021–2024 (USD MILLION)
TABLE 138
INDIA: PERMANENT MAGNET MOTOR MARKET, BY COMMERCIAL & RESIDENTIAL END USER, 2025–2030 (USD MILLION)
TABLE 139
INDIA: PERMANENT MAGNET MOTOR MARKET, BY COMMERCIAL END USER, 2021–2024 (USD MILLION)
TABLE 140
INDIA: PERMANENT MAGNET MOTOR MARKET, BY COMMERCIAL END USER, 2025–2030 (USD MILLION)
TABLE 141
SOUTH KOREA: PERMANENT MAGNET MOTOR MARKET, BY TYPE, 2021–2024 (USD MILLION)
TABLE 142
SOUTH KOREA: PERMANENT MAGNET MOTOR MARKET, BY TYPE, 2025–2030 (USD MILLION)
TABLE 143
SOUTH KOREA: PERMANENT MAGNET MOTOR MARKET, BY POWER RATING, 2021–2024 (USD MILLION)
TABLE 144
SOUTH KOREA: PERMANENT MAGNET MOTOR MARKET, BY POWER RATING, 2025–2030 (USD MILLION)
TABLE 145
SOUTH KOREA: PERMANENT MAGNET MOTOR MARKET, BY END USER, 2021–2024 (USD MILLION)
TABLE 146
SOUTH KOREA: PERMANENT MAGNET MOTOR MARKET, BY END USER, 2025–2030 (USD MILLION)
TABLE 147
SOUTH KOREA: PERMANENT MAGNET MOTOR MARKET, BY INDUSTRIAL END USER, 2021–2024 (USD MILLION)
TABLE 148
SOUTH KOREA: PERMANENT MAGNET MOTOR MARKET, BY INDUSTRIAL END USER, 2025–2030 (USD MILLION)
TABLE 149
SOUTH KOREA: PERMANENT MAGNET MOTOR MARKET, BY COMMERCIAL & RESIDENTIAL END USER, 2021–2024 (USD MILLION)
TABLE 150
SOUTH KOREA: PERMANENT MAGNET MOTOR MARKET, BY COMMERCIAL & RESIDENTIAL END USER, 2025–2030 (USD MILLION)
TABLE 151
SOUTH KOREA: PERMANENT MAGNET MOTOR MARKET, BY COMMERCIAL END USER, 2021–2024 (USD MILLION)
TABLE 152
SOUTH KOREA: PERMANENT MAGNET MOTOR MARKET, BY COMMERCIAL END USER, 2025–2030 (USD MILLION)
TABLE 153
AUSTRALIA: PERMANENT MAGNET MOTOR MARKET, BY TYPE, 2021–2024 (USD MILLION)
TABLE 154
AUSTRALIA: PERMANENT MAGNET MOTOR MARKET, BY TYPE, 2025–2030 (USD MILLION)
TABLE 155
AUSTRALIA: PERMANENT MAGNET MOTOR MARKET, BY POWER RATING, 2021–2024 (USD MILLION)
TABLE 156
AUSTRALIA: PERMANENT MAGNET MOTOR MARKET, BY POWER RATING, 2025–2030 (USD MILLION)
TABLE 157
AUSTRALIA: PERMANENT MAGNET MOTOR MARKET, BY END USER, 2021–2024 (USD MILLION)
TABLE 158
AUSTRALIA: PERMANENT MAGNET MOTOR MARKET, BY END USER, 2025–2030 (USD MILLION)
TABLE 159
AUSTRALIA: PERMANENT MAGNET MOTOR MARKET, BY INDUSTRIAL END USER, 2021–2024 (USD MILLION)
TABLE 160
AUSTRALIA: PERMANENT MAGNET MOTOR MARKET, BY INDUSTRIAL END USER, 2025–2030 (USD MILLION)
TABLE 161
AUSTRALIA: PERMANENT MAGNET MOTOR MARKET, BY COMMERCIAL & RESIDENTIAL END USER, 2021–2024 (USD MILLION)
TABLE 162
AUSTRALIA: PERMANENT MAGNET MOTOR MARKET, BY COMMERCIAL & RESIDENTIAL END USER, 2025–2030 (USD MILLION)
TABLE 163
AUSTRALIA: PERMANENT MAGNET MOTOR MARKET, BY COMMERCIAL END USER, 2021–2024 (USD MILLION)
TABLE 164
AUSTRALIA: PERMANENT MAGNET MOTOR MARKET, BY COMMERCIAL END USER, 2025–2030 (USD MILLION)
TABLE 165
REST OF ASIA PACIFIC: PERMANENT MAGNET MOTOR MARKET, BY TYPE, 2021–2024 (USD MILLION)
TABLE 166
REST OF ASIA PACIFIC: PERMANENT MAGNET MOTOR MARKET, BY TYPE, 2025–2030 (USD MILLION)
TABLE 167
REST OF ASIA PACIFIC: PERMANENT MAGNET MOTOR MARKET, BY POWER RATING, 2021–2024 (USD MILLION)
TABLE 168
REST OF ASIA PACIFIC: PERMANENT MAGNET MOTOR MARKET, BY POWER RATING, 2025–2030 (USD MILLION)
TABLE 169
REST OF ASIA PACIFIC: PERMANENT MAGNET MOTOR MARKET, BY END USER, 2021–2024 (USD MILLION)
TABLE 170
REST OF ASIA PACIFIC: PERMANENT MAGNET MOTOR MARKET, BY END USER, 2025–2030 (USD MILLION)
TABLE 171
REST OF ASIA PACIFIC: PERMANENT MAGNET MOTOR MARKET, BY INDUSTRIAL END USER, 2021–2024 (USD MILLION)
TABLE 172
REST OF ASIA PACIFIC: PERMANENT MAGNET MOTOR MARKET, BY INDUSTRIAL END USER, 2025–2030 (USD MILLION)
TABLE 173
REST OF ASIA PACIFIC: PERMANENT MAGNET MOTOR MARKET, BY COMMERCIAL & RESIDENTIAL END USER, 2021–2024 (USD MILLION)
TABLE 174
REST OF ASIA PACIFIC: PERMANENT MAGNET MOTOR MARKET, BY COMMERCIAL & RESIDENTIAL END USER, 2025–2030 (USD MILLION)
TABLE 175
REST OF ASIA PACIFIC: PERMANENT MAGNET MOTOR MARKET, BY COMMERCIAL END USER, 2021–2024 (USD MILLION)
TABLE 176
REST OF ASIA PACIFIC: PERMANENT MAGNET MOTOR MARKET, BY COMMERCIAL END USER, 2025–2030 (USD MILLION)
TABLE 177
NORTH AMERICA: PERMANENT MAGNET MOTOR MARKET, BY TYPE, 2021–2024 (USD MILLION)
TABLE 178
NORTH AMERICA: PERMANENT MAGNET MOTOR MARKET, BY TYPE, 2025–2030 (USD MILLION)
TABLE 179
NORTH AMERICA: PERMANENT MAGNET MOTOR MARKET, BY POWER RATING, 2021–2024 (USD MILLION)
TABLE 180
NORTH AMERICA: PERMANENT MAGNET MOTOR MARKET, BY POWER RATING, 2025–2030 (USD MILLION)
TABLE 181
NORTH AMERICA: PERMANENT MAGNET MOTOR MARKET, BY END USER, 2021–2024 (USD MILLION)
TABLE 182
NORTH AMERICA: PERMANENT MAGNET MOTOR MARKET, BY END USER, 2025–2030 (USD MILLION)
TABLE 183
NORTH AMERICA: PERMANENT MAGNET MOTOR MARKET, BY INDUSTRIAL END USER, 2021–2024 (USD MILLION)
TABLE 184
NORTH AMERICA: PERMANENT MAGNET MOTOR MARKET, BY INDUSTRIAL END USER, 2025–2030 (USD MILLION)
TABLE 185
NORTH AMERICA: PERMANENT MAGNET MOTOR MARKET, BY COMMERCIAL & RESIDENTIAL END USER, 2021–2024 (USD MILLION)
TABLE 186
NORTH AMERICA: PERMANENT MAGNET MOTOR MARKET, BY COMMERCIAL & RESIDENTIAL END USER, 2025–2030 (USD MILLION)
TABLE 187
NORTH AMERICA: PERMANENT MAGNET MOTOR MARKET, BY COMMERCIAL END USER, 2021–2024 (USD MILLION)
TABLE 188
NORTH AMERICA: PERMANENT MAGNET MOTOR MARKET, BY COMMERCIAL END USER, 2025–2030 (USD MILLION)
TABLE 189
NORTH AMERICA: PERMANENT MAGNET MOTOR MARKET, BY COUNTRY, 2021–2024 (USD MILLION)
TABLE 190
NORTH AMERICA: PERMANENT MAGNET MOTOR MARKET, BY COUNTRY, 2025–2030 (USD MILLION)
TABLE 191
US: PERMANENT MAGNET MOTOR MARKET, BY TYPE, 2021–2024 (USD MILLION)
TABLE 192
US: PERMANENT MAGNET MOTOR MARKET, BY TYPE, 2025–2030 (USD MILLION)
TABLE 193
US: PERMANENT MAGNET MOTOR MARKET, BY POWER RATING, 2021–2024 (USD MILLION)
TABLE 194
US: PERMANENT MAGNET MOTOR MARKET, BY POWER RATING, 2025–2030 (USD MILLION)
TABLE 195
US: PERMANENT MAGNET MOTOR MARKET, BY END USER, 2021–2024 (USD MILLION)
TABLE 196
US: PERMANENT MAGNET MOTOR MARKET, BY END USER, 2025–2030 (USD MILLION)
TABLE 197
US: PERMANENT MAGNET MOTOR MARKET, BY INDUSTRIAL END USER, 2021–2024 (USD MILLION)
TABLE 198
US: PERMANENT MAGNET MOTOR MARKET, BY INDUSTRIAL END USER, 2025–2030 (USD MILLION)
TABLE 199
US: PERMANENT MAGNET MOTOR MARKET, BY COMMERCIAL & RESIDENTIAL END USER, 2021–2024 (USD MILLION)
TABLE 200
US: PERMANENT MAGNET MOTOR MARKET, BY COMMERCIAL & RESIDENTIAL END USER, 2025–2030 (USD MILLION)
TABLE 201
US: PERMANENT MAGNET MOTOR MARKET, BY COMMERCIAL END USER, 2021–2024 (USD MILLION)
TABLE 202
US: PERMANENT MAGNET MOTOR MARKET, BY COMMERCIAL END USER, 2025–2030 (USD MILLION)
TABLE 203
CANADA: PERMANENT MAGNET MOTOR MARKET, BY TYPE, 2021–2024 (USD MILLION)
TABLE 204
CANADA: PERMANENT MAGNET MOTOR MARKET, BY TYPE, 2025–2030 (USD MILLION)
TABLE 205
CANADA: PERMANENT MAGNET MOTOR MARKET, BY POWER RATING, 2021–2024 (USD MILLION)
TABLE 206
CANADA: PERMANENT MAGNET MOTOR MARKET, BY POWER RATING, 2025–2030 (USD MILLION)
TABLE 207
CANADA: PERMANENT MAGNET MOTOR MARKET, BY END USER, 2021–2024 (USD MILLION)
TABLE 208
CANADA: PERMANENT MAGNET MOTOR MARKET, BY END USER, 2025–2030 (USD MILLION)
TABLE 209
CANADA: PERMANENT MAGNET MOTOR MARKET, BY INDUSTRIAL END USER, 2021–2024 (USD MILLION)
TABLE 210
CANADA: PERMANENT MAGNET MOTOR MARKET, BY INDUSTRIAL END USER, 2025–2030 (USD MILLION)
TABLE 211
CANADA: PERMANENT MAGNET MOTOR MARKET, BY COMMERCIAL & RESIDENTIAL END USER, 2021–2024 (USD MILLION)
TABLE 212
CANADA: PERMANENT MAGNET MOTOR MARKET, BY COMMERCIAL & RESIDENTIAL END USER, 2025–2030 (USD MILLION)
TABLE 213
CANADA: PERMANENT MAGNET MOTOR MARKET, BY COMMERCIAL END USER, 2021–2024 (USD MILLION)
TABLE 214
CANADA: PERMANENT MAGNET MOTOR MARKET, BY COMMERCIAL END USER, 2025–2030 (USD MILLION)
TABLE 215
MEXICO: PERMANENT MAGNET MOTOR MARKET, BY TYPE, 2021–2024 (USD MILLION)
TABLE 216
MEXICO: PERMANENT MAGNET MOTOR MARKET, BY TYPE, 2025–2030 (USD MILLION)
TABLE 217
MEXICO: PERMANENT MAGNET MOTOR MARKET, BY POWER RATING, 2021–2024 (USD MILLION)
TABLE 218
MEXICO: PERMANENT MAGNET MOTOR MARKET, BY POWER RATING, 2025–2030 (USD MILLION)
TABLE 219
MEXICO: PERMANENT MAGNET MOTOR MARKET, BY END USER, 2021–2024 (USD MILLION)
TABLE 220
MEXICO: PERMANENT MAGNET MOTOR MARKET, BY END USER, 2025–2030 (USD MILLION)
TABLE 221
MEXICO: PERMANENT MAGNET MOTOR MARKET, BY INDUSTRIAL END USER, 2021–2024 (USD MILLION)
TABLE 222
MEXICO: PERMANENT MAGNET MOTOR MARKET, BY INDUSTRIAL END USER, 2025–2030 (USD MILLION)
TABLE 223
MEXICO: PERMANENT MAGNET MOTOR MARKET, BY COMMERCIAL & RESIDENTIAL END USER, 2021–2024 (USD MILLION)
TABLE 224
MEXICO: PERMANENT MAGNET MOTOR MARKET, BY COMMERCIAL & RESIDENTIAL END USER, 2025–2030 (USD MILLION)
TABLE 225
MEXICO: PERMANENT MAGNET MOTOR MARKET, BY COMMERCIAL END USER, 2021–2024 (USD MILLION)
TABLE 226
MEXICO: PERMANENT MAGNET MOTOR MARKET, BY COMMERCIAL END USER, 2025–2030 (USD MILLION)
TABLE 227
EUROPE: PERMANENT MAGNET MOTOR MARKET, BY TYPE, 2021–2024 (USD MILLION)
TABLE 228
EUROPE: PERMANENT MAGNET MOTOR MARKET, BY TYPE, 2025–2030 (USD MILLION)
TABLE 229
EUROPE: PERMANENT MAGNET MOTOR MARKET, BY POWER RATING, 2021–2024 (USD MILLION)
TABLE 230
EUROPE: PERMANENT MAGNET MOTOR MARKET, BY POWER RATING, 2025–2030 (USD MILLION)
TABLE 231
EUROPE: PERMANENT MAGNET MOTOR MARKET, BY END USER, 2021–2024 (USD MILLION)
TABLE 232
EUROPE: PERMANENT MAGNET MOTOR MARKET, BY END USER, 2025–2030 (USD MILLION)
TABLE 233
EUROPE: PERMANENT MAGNET MOTOR MARKET, BY INDUSTRIAL END USER, 2021–2024 (USD MILLION)
TABLE 234
EUROPE: PERMANENT MAGNET MOTOR MARKET, BY INDUSTRIAL END USER, 2025–2030 (USD MILLION)
TABLE 235
EUROPE: PERMANENT MAGNET MOTOR MARKET, BY COMMERCIAL & RESIDENTIAL END USER, 2021–2024 (USD MILLION)
TABLE 236
EUROPE: PERMANENT MAGNET MOTOR MARKET, BY COMMERCIAL & RESIDENTIAL END USER, 2025–2030 (USD MILLION)
TABLE 237
EUROPE: PERMANENT MAGNET MOTOR MARKET, BY COMMERCIAL END USER, 2021–2024 (USD MILLION)
TABLE 238
EUROPE: PERMANENT MAGNET MOTOR MARKET, BY COMMERCIAL END USER, 2025–2030 (USD MILLION)
TABLE 239
EUROPE: PERMANENT MAGNET MOTOR MARKET, BY COUNTRY, 2021–2024 (USD MILLION)
TABLE 240
EUROPE: PERMANENT MAGNET MOTOR MARKET, BY COUNTRY, 2025–2030 (USD MILLION)
TABLE 241
GERMANY: PERMANENT MAGNET MOTOR MARKET, BY TYPE, 2021–2024 (USD MILLION)
TABLE 242
GERMANY: PERMANENT MAGNET MOTOR MARKET, BY TYPE, 2025–2030 (USD MILLION)
TABLE 243
GERMANY: PERMANENT MAGNET MOTOR MARKET, BY POWER RATING, 2021–2024 (USD MILLION)
TABLE 244
GERMANY: PERMANENT MAGNET MOTOR MARKET, BY POWER RATING, 2025–2030 (USD MILLION)
TABLE 245
GERMANY: PERMANENT MAGNET MOTOR MARKET, BY END USER, 2021–2024 (USD MILLION)
TABLE 246
GERMANY: PERMANENT MAGNET MOTOR MARKET, BY END USER, 2025–2030 (USD MILLION)
TABLE 247
GERMANY: PERMANENT MAGNET MOTOR MARKET, BY INDUSTRIAL END USER, 2021–2024 (USD MILLION)
TABLE 248
GERMANY: PERMANENT MAGNET MOTOR MARKET, BY INDUSTRIAL END USER, 2025–2030 (USD MILLION)
TABLE 249
GERMANY: PERMANENT MAGNET MOTOR MARKET, BY COMMERCIAL & RESIDENTIAL END USER, 2021–2024 (USD MILLION)
TABLE 250
GERMANY: PERMANENT MAGNET MOTOR MARKET, BY COMMERCIAL & RESIDENTIAL END USER, 2025–2030 (USD MILLION)
TABLE 251
GERMANY: PERMANENT MAGNET MOTOR MARKET, BY COMMERCIAL END USER, 2021–2024 (USD MILLION)
TABLE 252
GERMANY: PERMANENT MAGNET MOTOR MARKET, BY COMMERCIAL END USER, 2025–2030 (USD MILLION)
TABLE 253
UK: PERMANENT MAGNET MOTOR MARKET, BY TYPE, 2021–2024 (USD MILLION)
TABLE 254
UK: PERMANENT MAGNET MOTOR MARKET, BY TYPE, 2025–2030 (USD MILLION)
TABLE 255
UK: PERMANENT MAGNET MOTOR MARKET, BY POWER RATING, 2021–2024 (USD MILLION)
TABLE 256
UK: PERMANENT MAGNET MOTOR MARKET, BY POWER RATING, 2025–2030 (USD MILLION)
TABLE 257
UK: PERMANENT MAGNET MOTOR MARKET, BY END USER, 2021–2024 (USD MILLION)
TABLE 258
UK: PERMANENT MAGNET MOTOR MARKET, BY END USER, 2025–2030 (USD MILLION)
TABLE 259
UK: PERMANENT MAGNET MOTOR MARKET, BY INDUSTRIAL END USER , 2021–2024 (USD MILLION)
TABLE 260
UK: PERMANENT MAGNET MOTOR MARKET, BY INDUSTRIAL END USER , 2025–2030 (USD MILLION)
TABLE 261
UK: PERMANENT MAGNET MOTOR MARKET, BY COMMERCIAL & RESIDENTIAL END USER, 2021–2024 (USD MILLION)
TABLE 262
UK: PERMANENT MAGNET MOTOR MARKET, BY COMMERCIAL & RESIDENTIAL END USER, 2025–2030 (USD MILLION)
TABLE 263
UK: PERMANENT MAGNET MOTOR MARKET, BY COMMERCIAL END USER, 2021–2024 (USD MILLION)
TABLE 264
UK: PERMANENT MAGNET MOTOR MARKET, BY COMMERCIAL END USER, 2025–2030 (USD MILLION)
TABLE 265
FRANCE: PERMANENT MAGNET MOTOR MARKET, BY TYPE, 2021–2024 (USD MILLION)
TABLE 266
FRANCE: PERMANENT MAGNET MOTOR MARKET, BY TYPE, 2025–2030 (USD MILLION)
TABLE 267
FRANCE: PERMANENT MAGNET MOTOR MARKET, BY POWER RATING, 2021–2024 (USD MILLION)
TABLE 268
FRANCE: PERMANENT MAGNET MOTOR MARKET, BY POWER RATING, 2025–2030 (USD MILLION)
TABLE 269
FRANCE: PERMANENT MAGNET MOTOR MARKET, BY END USER, 2021–2024 (USD MILLION)
TABLE 270
FRANCE: PERMANENT MAGNET MOTOR MARKET, BY END USER, 2025–2030 (USD MILLION)
TABLE 271
FRANCE: PERMANENT MAGNET MOTOR MARKET, BY INDUSTRIAL END USER , 2021–2024 (USD MILLION)
TABLE 272
FRANCE: PERMANENT MAGNET MOTOR MARKET, BY INDUSTRIAL END USER , 2025–2030 (USD MILLION)
TABLE 273
FRANCE: PERMANENT MAGNET MOTOR MARKET, BY COMMERCIAL & RESIDENTIAL END USER, 2021–2024 (USD MILLION)
TABLE 274
FRANCE: PERMANENT MAGNET MOTOR MARKET, BY COMMERCIAL & RESIDENTIAL END USER, 2025–2030 (USD MILLION)
TABLE 275
FRANCE: PERMANENT MAGNET MOTOR MARKET, BY COMMERCIAL END USER, 2021–2024 (USD MILLION)
TABLE 276
FRANCE: PERMANENT MAGNET MOTOR MARKET, BY COMMERCIAL END USER, 2025–2030 (USD MILLION)
TABLE 277
ITALY: PERMANENT MAGNET MOTOR MARKET, BY TYPE, 2021–2024 (USD MILLION)
TABLE 278
ITALY: PERMANENT MAGNET MOTOR MARKET, BY TYPE, 2025–2030 (USD MILLION)
TABLE 279
ITALY: PERMANENT MAGNET MOTOR MARKET, BY POWER RATING, 2021–2024 (USD MILLION)
TABLE 280
ITALY: PERMANENT MAGNET MOTOR MARKET, BY POWER RATING, 2025–2030 (USD MILLION)
TABLE 281
ITALY: PERMANENT MAGNET MOTOR MARKET, BY END USER, 2021–2024 (USD MILLION)
TABLE 282
ITALY: PERMANENT MAGNET MOTOR MARKET, BY END USER, 2025–2030 (USD MILLION)
TABLE 283
ITALY: PERMANENT MAGNET MOTOR MARKET, BY INDUSTRIAL END USER, 2021–2024 (USD MILLION)
TABLE 284
ITALY: PERMANENT MAGNET MOTOR MARKET, BY INDUSTRIAL END USER, 2025–2030 (USD MILLION)
TABLE 285
ITALY: PERMANENT MAGNET MOTOR MARKET, BY COMMERCIAL & RESIDENTIAL END USER, 2021–2024 (USD MILLION)
TABLE 286
ITALY: PERMANENT MAGNET MOTOR MARKET, BY COMMERCIAL & RESIDENTIAL END USER, 2025–2030 (USD MILLION)
TABLE 287
ITALY: PERMANENT MAGNET MOTOR MARKET, BY COMMERCIAL END USER, 2021–2024 (USD MILLION)
TABLE 288
ITALY: PERMANENT MAGNET MOTOR MARKET, BY COMMERCIAL END USER, 2025–2030 (USD MILLION)
TABLE 289
RUSSIA: PERMANENT MAGNET MOTOR MARKET, BY TYPE, 2021–2024 (USD MILLION)
TABLE 290
RUSSIA: PERMANENT MAGNET MOTOR MARKET, BY TYPE, 2025–2030 (USD MILLION)
TABLE 291
RUSSIA: PERMANENT MAGNET MOTOR MARKET, BY POWER RATING, 2021–2024 (USD MILLION)
TABLE 292
RUSSIA: PERMANENT MAGNET MOTOR MARKET, BY POWER RATING, 2025–2030 (USD MILLION)
TABLE 293
RUSSIA: PERMANENT MAGNET MOTOR MARKET, BY END USER, 2021–2024 (USD MILLION)
TABLE 294
RUSSIA: PERMANENT MAGNET MOTOR MARKET, BY END USER, 2025–2030 (USD MILLION)
TABLE 295
RUSSIA: PERMANENT MAGNET MOTOR MARKET, BY INDUSTRIAL END USER, 2021–2024 (USD MILLION)
TABLE 296
RUSSIA: PERMANENT MAGNET MOTOR MARKET, BY INDUSTRIAL END USER, 2025–2030 (USD MILLION)
TABLE 297
RUSSIA: PERMANENT MAGNET MOTOR MARKET, BY COMMERCIAL & RESIDENTIAL END USER, 2021–2024 (USD MILLION)
TABLE 298
RUSSIA: PERMANENT MAGNET MOTOR MARKET, BY COMMERCIAL & RESIDENTIAL END USER, 2025–2030 (USD MILLION)
TABLE 299
RUSSIA: PERMANENT MAGNET MOTOR MARKET, BY COMMERCIAL END USER, 2021–2024 (USD MILLION)
TABLE 300
RUSSIA: PERMANENT MAGNET MOTOR MARKET, BY COMMERCIAL END USER, 2025–2030 (USD MILLION)
TABLE 301
REST OF EUROPE: PERMANENT MAGNET MOTOR MARKET, BY TYPE, 2021–2024 (USD MILLION)
TABLE 302
REST OF EUROPE: PERMANENT MAGNET MOTOR MARKET, BY TYPE, 2025–2030 (USD MILLION)
TABLE 303
REST OF EUROPE: PERMANENT MAGNET MOTOR MARKET, BY POWER RATING, 2021–2024 (USD MILLION)
TABLE 304
REST OF EUROPE: PERMANENT MAGNET MOTOR MARKET, BY POWER RATING, 2025–2030 (USD MILLION)
TABLE 305
REST OF EUROPE: PERMANENT MAGNET MOTOR MARKET, BY END USER, 2021–2024 (USD MILLION)
TABLE 306
REST OF EUROPE: PERMANENT MAGNET MOTOR MARKET, BY END USER, 2025–2030 (USD MILLION)
TABLE 307
REST OF EUROPE: PERMANENT MAGNET MOTOR MARKET, BY INDUSTRIAL END USER, 2021–2024 (USD MILLION)
TABLE 308
REST OF EUROPE: PERMANENT MAGNET MOTOR MARKET, BY INDUSTRIAL END USER, 2025–2030 (USD MILLION)
TABLE 309
REST OF EUROPE: PERMANENT MAGNET MOTOR MARKET, BY COMMERCIAL & RESIDENTIAL, END USER, 2021–2024 (USD MILLION)
TABLE 310
REST OF EUROPE: PERMANENT MAGNET MOTOR MARKET, BY COMMERCIAL & RESIDENTIAL END USER, 2025–2030 (USD MILLION)
TABLE 311
REST OF EUROPE: PERMANENT MAGNET MOTOR MARKET, BY COMMERCIAL END USER, 2021–2024 (USD MILLION)
TABLE 312
REST OF EUROPE: PERMANENT MAGNET MOTOR MARKET, BY COMMERCIAL END USER, 2025–2030 (USD MILLION)
TABLE 313
SOUTH AMERICA: PERMANENT MAGNET MOTOR MARKET, BY TYPE, 2021–2024 (USD MILLION)
TABLE 314
SOUTH AMERICA: PERMANENT MAGNET MOTOR MARKET, BY TYPE, 2025–2030 (USD MILLION)
TABLE 315
SOUTH AMERICA: PERMANENT MAGNET MOTOR MARKET, BY POWER RATING, 2021–2024 (USD MILLION)
TABLE 316
SOUTH AMERICA: PERMANENT MAGNET MOTOR MARKET, BY POWER RATING, 2025–2030 (USD MILLION)
TABLE 317
SOUTH AMERICA: PERMANENT MAGNET MOTOR MARKET, BY END USER, 2021–2024 (USD MILLION)
TABLE 318
SOUTH AMERICA: PERMANENT MAGNET MOTOR MARKET, BY END USER, 2025–2030 (USD MILLION)
TABLE 319
SOUTH AMERICA: PERMANENT MAGNET MOTOR MARKET, BY INDUSTRIAL END USER, 2021–2024 (USD MILLION)
TABLE 320
SOUTH AMERICA: PERMANENT MAGNET MOTOR MARKET, BY INDUSTRIAL END USER, 2025–2030 (USD MILLION)
TABLE 321
SOUTH AMERICA: PERMANENT MAGNET MOTOR MARKET, BY COMMERCIAL & RESIDENTIAL END USER, 2021–2024 (USD MILLION)
TABLE 322
SOUTH AMERICA: PERMANENT MAGNET MOTOR MARKET, BY COMMERCIAL & RESIDENTIAL END USER, 2025–2030 (USD MILLION)
TABLE 323
SOUTH AMERICA: PERMANENT MAGNET MOTOR MARKET, BY COMMERCIAL END USER, 2021–2024 (USD MILLION)
TABLE 324
SOUTH AMERICA: PERMANENT MAGNET MOTOR MARKET, BY COMMERCIAL END USER, 2025–2030 (USD MILLION)
TABLE 325
SOUTH AMERICA: PERMANENT MAGNET MOTOR MARKET, BY COUNTRY, 2021–2024 (USD MILLION)
TABLE 326
SOUTH AMERICA: PERMANENT MAGNET MOTOR MARKET, BY COUNTRY, 2025–2030 (USD MILLION)
TABLE 327
BRAZIL: PERMANENT MAGNET MOTOR MARKET, BY TYPE, 2021–2024 (USD MILLION)
TABLE 328
BRAZIL: PERMANENT MAGNET MOTOR MARKET, BY TYPE, 2025–2030 (USD MILLION)
TABLE 329
BRAZIL: PERMANENT MAGNET MOTOR MARKET, BY POWER RATING, 2021–2024 (USD MILLION)
TABLE 330
BRAZIL: PERMANENT MAGNET MOTOR MARKET, BY POWER RATING, 2025–2030 (USD MILLION)
TABLE 331
BRAZIL: PERMANENT MAGNET MOTOR MARKET, BY END USER, 2021–2024 (USD MILLION)
TABLE 332
BRAZIL: PERMANENT MAGNET MOTOR MARKET, BY END USER, 2025–2030 (USD MILLION)
TABLE 333
BRAZIL: PERMANENT MAGNET MOTOR MARKET, BY INDUSTRIAL END USER, 2021–2024 (USD MILLION)
TABLE 334
BRAZIL: PERMANENT MAGNET MOTOR MARKET, BY INDUSTRIAL END USER, 2025–2030 (USD MILLION)
TABLE 335
BRAZIL: PERMANENT MAGNET MOTOR MARKET, BY COMMERCIAL & RESIDENTIAL END USER, 2021–2024 (USD MILLION)
TABLE 336
BRAZIL: PERMANENT MAGNET MOTOR MARKET, BY COMMERCIAL & RESIDENTIAL END USER, 2025–2030 (USD MILLION)
TABLE 337
BRAZIL: PERMANENT MAGNET MOTOR MARKET, BY COMMERCIAL END USER, 2021–2024 (USD MILLION)
TABLE 338
BRAZIL: PERMANENT MAGNET MOTOR MARKET, BY COMMERCIAL END USER, 2025–2030 (USD MILLION)
TABLE 339
ARGENTINA: PERMANENT MAGNET MOTOR MARKET, BY TYPE, 2021–2024 (USD MILLION)
TABLE 340
ARGENTINA: PERMANENT MAGNET MOTOR MARKET, BY TYPE, 2025–2030 (USD MILLION)
TABLE 341
ARGENTINA: PERMANENT MAGNET MOTOR MARKET, BY POWER RATING, 2021–2024 (USD MILLION)
TABLE 342
ARGENTINA: PERMANENT MAGNET MOTOR MARKET, BY POWER RATING, 2025–2030 (USD MILLION)
TABLE 343
ARGENTINA: PERMANENT MAGNET MOTOR MARKET, BY END USER, 2021–2024 (USD MILLION)
TABLE 344
ARGENTINA: PERMANENT MAGNET MOTOR MARKET, BY END USER, 2025–2030 (USD MILLION)
TABLE 345
ARGENTINA: PERMANENT MAGNET MOTOR MARKET, BY INDUSTRIAL END USER, 2021–2024 (USD MILLION)
TABLE 346
ARGENTINA: PERMANENT MAGNET MOTOR MARKET, BY INDUSTRIA END USER, 2025–2030 (USD MILLION)
TABLE 347
ARGENTINA: PERMANENT MAGNET MOTOR MARKET, BY COMMERCIAL & RESIDENTIAL END USER, 2021–2024 (USD MILLION)
TABLE 348
ARGENTINA: PERMANENT MAGNET MOTOR MARKET, BY COMMERCIAL & RESIDENTIAL END USER, 2025–2030 (USD MILLION)
TABLE 349
ARGENTINA: PERMANENT MAGNET MOTOR MARKET, BY COMMERCIAL END USER, 2021–2024 (USD MILLION)
TABLE 350
ARGENTINA: PERMANENT MAGNET MOTOR MARKET, BY COMMERCIAL END USER, 2025–2030 (USD MILLION)
TABLE 351
REST OF SOUTH AMERICA: PERMANENT MAGNET MOTOR MARKET, BY TYPE, 2021–2024 (USD MILLION)
TABLE 352
REST OF SOUTH AMERICA: PERMANENT MAGNET MOTOR MARKET, BY TYPE, 2025–2030 (USD MILLION)
TABLE 353
REST OF SOUTH AMERICA: PERMANENT MAGNET MOTOR MARKET, BY POWER RATING, 2021–2024 (USD MILLION)
TABLE 354
REST OF SOUTH AMERICA: PERMANENT MAGNET MOTOR MARKET, BY POWER RATING, 2025–2030 (USD MILLION)
TABLE 355
REST OF SOUTH AMERICA: PERMANENT MAGNET MOTOR MARKET, BY END USER, 2021–2024 (USD MILLION)
TABLE 356
REST OF SOUTH AMERICA: PERMANENT MAGNET MOTOR MARKET, BY END USER, 2025–2030 (USD MILLION)
TABLE 357
REST OF SOUTH AMERICA: PERMANENT MAGNET MOTOR MARKET, BY INDUSTRIAL END USER, 2021–2024 (USD MILLION)
TABLE 358
REST OF SOUTH AMERICA: PERMANENT MAGNET MOTOR MARKET, BY INDUSTRIAL END USER, 2025–2030 (USD MILLION)
TABLE 359
REST OF SOUTH AMERICA: PERMANENT MAGNET MOTOR MARKET, BY COMMERCIAL & RESIDENTIAL END USER, 2021–2024 (USD MILLION)
TABLE 360
REST OF SOUTH AMERICA: PERMANENT MAGNET MOTOR MARKET, BY COMMERCIAL & RESIDENTIAL END USER, 2025–2030 (USD MILLION)
TABLE 361
REST OF SOUTH AMERICA: PERMANENT MAGNET MOTOR MARKET, BY COMMERCIAL END USER, 2021–2024 (USD MILLION)
TABLE 362
REST OF SOUTH AMERICA: PERMANENT MAGNET MOTOR MARKET, BY COMMERCIAL END USER, 2025–2030 (USD MILLION)
TABLE 363
MIDDLE EAST & AFRICA: PERMANENT MAGNET MOTOR MARKET, BY TYPE, 2021–2024 (USD MILLION)
TABLE 364
MIDDLE EAST & AFRICA: PERMANENT MAGNET MOTOR MARKET, BY TYPE, 2025–2030 (USD MILLION)
TABLE 365
MIDDLE EAST & AFRICA: PERMANENT MAGNET MOTOR MARKET, BY POWER RATING, 2021–2024 (USD MILLION)
TABLE 366
MIDDLE EAST & AFRICA: PERMANENT MAGNET MOTOR MARKET, BY POWER RATING, 2025–2030 (USD MILLION)
TABLE 367
MIDDLE EAST & AFRICA: PERMANENT MAGNET MOTOR MARKET, BY END USER, 2021–2024 (USD MILLION)
TABLE 368
MIDDLE EAST & AFRICA: PERMANENT MAGNET MOTOR MARKET, BY END USER, 2025–2030 (USD MILLION)
TABLE 369
MIDDLE EAST & AFRICA: PERMANENT MAGNET MOTOR MARKET, BY INDUSTRIAL END USER, 2021–2024 (USD MILLION)
TABLE 370
MIDDLE EAST & AFRICA: PERMANENT MAGNET MOTOR MARKET, BY INDUSTRIAL END USER, 2025–2030 (USD MILLION)
TABLE 371
MIDDLE EAST & AFRICA: PERMANENT MAGNET MOTOR MARKET, BY COMMERCIAL & RESIDENTIAL END USER, 2021–2024 (USD MILLION)
TABLE 372
MIDDLE EAST & AFRICA: PERMANENT MAGNET MOTOR MARKET, BY COMMERCIAL & RESIDENTIAL END USER, 2025–2030 (USD MILLION)
TABLE 373
MIDDLE EAST & AFRICA: PERMANENT MAGNET MOTOR MARKET, BY COMMERCIAL END USER, 2021–2024 (USD MILLION)
TABLE 374
MIDDLE EAST & AFRICA: PERMANENT MAGNET MOTOR MARKET, BY COMMERCIAL END USER, 2025–2030 (USD MILLION)
TABLE 375
MIDDLE EAST & AFRICA: PERMANENT MAGNET MOTOR MARKET, BY COUNTRY, 2021–2024 (USD MILLION)
TABLE 376
MIDDLE EAST & AFRICA: PERMANENT MAGNET MOTOR MARKET, BY COUNTRY, 2025–2030 (USD MILLION)
TABLE 377
GCC: PERMANENT MAGNET MOTOR MARKET, BY TYPE, 2021–2024 (USD MILLION)
TABLE 378
GCC: PERMANENT MAGNET MOTOR MARKET, BY TYPE, 2025–2030 (USD MILLION)
TABLE 379
GCC: PERMANENT MAGNET MOTOR MARKET, BY POWER RATING, 2021–2024 (USD MILLION)
TABLE 380
GCC: PERMANENT MAGNET MOTOR MARKET, BY POWER RATING, 2025–2030 (USD MILLION)
TABLE 381
GCC: PERMANENT MAGNET MOTOR MARKET, BY END USER, 2021–2024 (USD MILLION)
TABLE 382
GCC: PERMANENT MAGNET MOTOR MARKET, BY END USER, 2025–2030 (USD MILLION)
TABLE 383
GCC: PERMANENT MAGNET MOTOR MARKET, BY INDUSTRIAL END USER , 2021–2024 (USD MILLION)
TABLE 384
GCC: PERMANENT MAGNET MOTOR MARKET, BY INDUSTRIAL END USER, 2025–2030 (USD MILLION)
TABLE 385
GCC: PERMANENT MAGNET MOTOR MARKET, BY COMMERCIAL & RESIDENTIAL END USER, 2021–2024 (USD MILLION)
TABLE 386
GCC: PERMANENT MAGNET MOTOR MARKET, BY COMMERCIAL & RESIDENTIAL END USER, 2025–2030 (USD MILLION)
TABLE 387
GCC: PERMANENT MAGNET MOTOR MARKET, BY COMMERCIAL END USER, 2021–2024 (USD MILLION)
TABLE 388
GCC: PERMANENT MAGNET MOTOR MARKET, BY COMMERCIAL END USER, 2025–2030 (USD MILLION)
TABLE 389
GCC: PERMANENT MAGNET MOTOR MARKET, BY COUNTRY, 2021–2024 (USD MILLION)
TABLE 390
GCC: PERMANENT MAGNET MOTOR MARKET, BY COUNTRY, 2025–2030 (USD MILLION)
TABLE 391
SAUDI ARABIA: PERMANENT MAGNET MOTOR MARKET, BY TYPE, 2021–2024 (USD MILLION)
TABLE 392
SAUDI ARABIA: PERMANENT MAGNET MOTOR MARKET, BY TYPE, 2025–2030 (USD MILLION)
TABLE 393
SAUDI ARABIA: PERMANENT MAGNET MOTOR MARKET, BY POWER RATING, 2021–2024 (USD MILLION)
TABLE 394
SAUDI ARABIA: PERMANENT MAGNET MOTOR MARKET, BY POWER RATING, 2025–2030 (USD MILLION)
TABLE 395
SAUDI ARABIA: PERMANENT MAGNET MOTOR MARKET, BY END USER, 2021–2024 (USD MILLION)
TABLE 396
SAUDI ARABIA: PERMANENT MAGNET MOTOR MARKET, BY END USER, 2025–2030 (USD MILLION)
TABLE 397
SAUDI ARABIA: PERMANENT MAGNET MOTOR MARKET, BY INDUSTRIAL END USER, 2021–2024 (USD MILLION)
TABLE 398
SAUDI ARABIA: PERMANENT MAGNET MOTOR MARKET, BY INDUSTRIAL END USER, 2025–2030 (USD MILLION)
TABLE 399
SAUDI ARABIA: PERMANENT MAGNET MOTOR MARKET, BY COMMERCIAL & RESIDENTIAL END USER, 2021–2024 (USD MILLION)
TABLE 400
SAUDI ARABIA: PERMANENT MAGNET MOTOR MARKET, BY COMMERCIAL & RESIDENTIAL END USER, 2025–2030 (USD MILLION)
TABLE 401
SAUDI ARABIA: PERMANENT MAGNET MOTOR MARKET, BY COMMERCIAL END USER, 2021–2024 (USD MILLION)
TABLE 402
SAUDI ARABIA: PERMANENT MAGNET MOTOR MARKET, BY COMMERCIAL END USER, 2025–2030 (USD MILLION)
TABLE 403
UAE: PERMANENT MAGNET MOTOR MARKET, BY TYPE, 2021–2024 (USD MILLION)
TABLE 404
UAE: PERMANENT MAGNET MOTOR MARKET, BY TYPE, 2025–2030 (USD MILLION)
TABLE 405
UAE: PERMANENT MAGNET MOTOR MARKET, BY POWER RATING, 2021–2024 (USD MILLION)
TABLE 406
UAE: PERMANENT MAGNET MOTOR MARKET, BY POWER RATING, 2025–2030 (USD MILLION)
TABLE 407
UAE: PERMANENT MAGNET MOTOR MARKET, BY END USER, 2021–2024 (USD MILLION)
TABLE 408
UAE: PERMANENT MAGNET MOTOR MARKET, BY END USER, 2025–2030 (USD MILLION)
TABLE 409
UAE: PERMANENT MAGNET MOTOR MARKET, BY INDUSTRIAL END USER, 2021–2024 (USD MILLION)
TABLE 410
UAE: PERMANENT MAGNET MOTOR MARKET, BY INDUSTRIAL END USER, 2025–2030 (USD MILLION)
TABLE 411
UAE: PERMANENT MAGNET MOTOR MARKET, BY COMMERCIAL & RESIDENTIAL END USER, 2021–2024 (USD MILLION)
TABLE 412
UAE: PERMANENT MAGNET MOTOR MARKET, BY COMMERCIAL & RESIDENTIAL END USER, 2025–2030 (USD MILLION)
TABLE 413
UAE: PERMANENT MAGNET MOTOR MARKET, BY COMMERCIAL END USER, 2021–2024 (USD MILLION)
TABLE 414
UAE: PERMANENT MAGNET MOTOR MARKET, BY COMMERCIAL END USER, 2025–2030 (USD MILLION)
TABLE 415
REST OF GCC: PERMANENT MAGNET MOTOR MARKET, BY TYPE, 2021–2024 (USD MILLION)
TABLE 416
REST OF GCC: PERMANENT MAGNET MOTOR MARKET, BY TYPE, 2025–2030 (USD MILLION)
TABLE 417
REST OF GCC: PERMANENT MAGNET MOTOR MARKET, BY POWER RATING, 2021–2024 (USD MILLION)
TABLE 418
REST OF GCC: PERMANENT MAGNET MOTOR MARKET, BY POWER RATING, 2025–2030 (USD MILLION)
TABLE 419
REST OF GCC: PERMANENT MAGNET MOTOR MARKET, BY END USER, 2021–2024 (USD MILLION)
TABLE 420
REST OF GCC: PERMANENT MAGNET MOTOR MARKET, BY END USER, 2025–2030 (USD MILLION)
TABLE 421
REST OF GCC: PERMANENT MAGNET MOTOR MARKET, BY INDUSTRIAL END USER, 2021–2024 (USD MILLION)
TABLE 422
REST OF GCC: PERMANENT MAGNET MOTOR MARKET, BY INDUSTRIAL END USER, 2025–2030 (USD MILLION)
TABLE 423
REST OF GCC: PERMANENT MAGNET MOTOR MARKET, BY COMMERCIAL & RESIDENTIAL END USER, 2021–2024 (USD MILLION)
TABLE 424
REST OF GCC: PERMANENT MAGNET MOTOR MARKET, BY COMMERCIAL & RESIDENTIAL END USER, 2025–2030 (USD MILLION)
TABLE 425
REST OF GCC: PERMANENT MAGNET MOTOR MARKET, BY COMMERCIAL END USER, 2021–2024 (USD MILLION)
TABLE 426
REST OF GCC: PERMANENT MAGNET MOTOR MARKET, BY COMMERCIAL END USER, 2025–2030 (USD MILLION)
TABLE 427
SOUTH AFRICA: PERMANENT MAGNET MOTOR MARKET, BY TYPE, 2021–2024 (USD MILLION)
TABLE 428
SOUTH AFRICA: PERMANENT MAGNET MOTOR MARKET, BY TYPE, 2025–2030 (USD MILLION)
TABLE 429
SOUTH AFRICA: PERMANENT MAGNET MOTOR MARKET, BY POWER RATING, 2021–2024 (USD MILLION)
TABLE 430
SOUTH AFRICA: PERMANENT MAGNET MOTOR MARKET, BY POWER RATING, 2025–2030 (USD MILLION)
TABLE 431
SOUTH AFRICA: PERMANENT MAGNET MOTOR MARKET, BY END USER, 2021–2024 (USD MILLION)
TABLE 432
SOUTH AFRICA: PERMANENT MAGNET MOTOR MARKET, BY END USER, 2025–2030 (USD MILLION)
TABLE 433
SOUTH AFRICA: PERMANENT MAGNET MOTOR MARKET, BY INDUSTRIAL END USER, 2021–2024 (USD MILLION)
TABLE 434
SOUTH AFRICA: PERMANENT MAGNET MOTOR MARKET, BY INDUSTRIAL END USER, 2025–2030 (USD MILLION)
TABLE 435
SOUTH AFRICA: PERMANENT MAGNET MOTOR MARKET, BY COMMERCIAL & RESIDENTIAL END USER, 2021–2024 (USD MILLION)
TABLE 436
SOUTH AFRICA: PERMANENT MAGNET MOTOR MARKET, BY COMMERCIAL & RESIDENTIAL END USER, 2025–2030 (USD MILLION)
TABLE 437
SOUTH AFRICA: PERMANENT MAGNET MOTOR MARKET, BY COMMERCIAL END USER, 2021–2024 (USD MILLION)
TABLE 438
SOUTH AFRICA: PERMANENT MAGNET MOTOR MARKET, BY COMMERCIAL END USER, 2025–2030 (USD MILLION)
TABLE 439
REST OF MIDDLE EAST & AFRICA: PERMANENT MAGNET MOTOR MARKET, BY TYPE, 2021–2024 (USD MILLION)
TABLE 440
REST OF MIDDLE EAST & AFRICA: PERMANENT MAGNET MOTOR MARKET, BY TYPE, 2025–2030 (USD MILLION)
TABLE 441
REST OF MIDDLE EAST & AFRICA: PERMANENT MAGNET MOTOR MARKET, BY POWER RATING, 2021–2024 (USD MILLION)
TABLE 442
REST OF MIDDLE EAST & AFRICA: PERMANENT MAGNET MOTOR MARKET, BY POWER RATING, 2025–2030 (USD MILLION)
TABLE 443
REST OF MIDDLE EAST & AFRICA: PERMANENT MAGNET MOTOR MARKET, BY END USER, 2021–2024 (USD MILLION)
TABLE 444
REST OF MIDDLE EAST & AFRICA: PERMANENT MAGNET MOTOR MARKET, BY END USER, 2025–2030 (USD MILLION)
TABLE 445
REST OF MIDDLE EAST & AFRICA: PERMANENT MAGNET MOTOR MARKET, BY INDUSTRIAL END USER, 2021–2024 (USD MILLION)
TABLE 446
REST OF MIDDLE EAST & AFRICA: PERMANENT MAGNET MOTOR MARKET, BY INDUSTRIAL END USER, 2025–2030 (USD MILLION)
TABLE 447
REST OF MIDDLE EAST & AFRICA: PERMANENT MAGNET MOTOR MARKET, BY COMMERCIAL & RESIDENTIAL END USER, 2021–2024 (USD MILLION)
TABLE 448
REST OF MIDDLE EAST & AFRICA: PERMANENT MAGNET MOTOR MARKET, BY COMMERCIAL & RESIDENTIAL END USER, 2025–2030 (USD MILLION)
TABLE 449
REST OF MIDDLE EAST & AFRICA: PERMANENT MAGNET MOTOR MARKET, BY COMMERCIAL END USER, 2021–2024 (USD MILLION)
TABLE 450
REST OF MIDDLE EAST & AFRICA: PERMANENT MAGNET MOTOR MARKET, BY COMMERCIAL END USER, 2025–2030 (USD MILLION)
TABLE 451
PERMANENT MAGNET MOTOR MARKET: OVERVIEW OF STRATEGIES ADOPTED BY KEY PLAYERS, JANUARY 2021–MAY 2025
TABLE 452
PERMANENT MAGNET MOTOR MARKET: DEGREE OF COMPETITION, 2024
TABLE 453
PERMANENT MAGNET MOTOR MARKET: REGIONAL FOOTPRINT
TABLE 454
PERMANENT MAGNET MOTOR MARKET: TYPE FOOTPRINT
TABLE 455
PERMANENT MAGNET MOTOR MARKET: POWER RATING FOOTPRINT
TABLE 456
PERMANENT MAGNET MOTOR MARKET: END USER FOOTPRINT
TABLE 457
PERMANENT MAGNET MOTOR MARKET: PRODUCT LAUNCHES/ENHANCEMENTS, JANUARY 2021–MAY 2025
TABLE 458
PERMANENT MAGNET MOTOR MARKET: DEALS, JANUARY 2021–MAY 2025
TABLE 459
ABB: COMPANY OVERVIEW
TABLE 460
ABB: PRODUCTS/SERVICES/SOLUTIONS OFFERED
TABLE 461
ABB: PRODUCT LAUNCHES
TABLE 463
SIEMENS: COMPANY OVERVIEW
TABLE 464
SIEMENS: PRODUCTS/SOLUTIONS/SERVICES OFFERED
TABLE 466
ROCKWELL AUTOMATION: COMPANY OVERVIEW
TABLE 467
ROCKWELL AUTOMATION: PRODUCTS/SOLUTIONS/SERVICES OFFERED
TABLE 468
ROCKWELL AUTOMATION: PRODUCT LAUNCHES/ENHANCEMENTS
TABLE 469
NIDEC CORPORATION: COMPANY OVERVIEW
TABLE 470
NIDEC CORPORATION: PRODUCTS/SOLUTIONS/SERVICES OFFERED
TABLE 471
NIDEC CORPORATION: PRODUCT LAUNCHES/ENHANCEMENTS
TABLE 472
JOHNSON ELECTRIC HOLDINGS LIMITED: COMPANY OVERVIEW
TABLE 473
JOHNSON ELECTRIC HOLDINGS LIMITED: PRODUCTS/SOLUTIONS/ SERVICES OFFERED
TABLE 474
JOHNSON ELECTRIC ELECTRIC HOLDINGS LIMITED: PRODUCT LAUNCHES/ENHANCEMENTS
TABLE 475
WOLONG ELECTRIC GROUP: COMPANY OVERVIEW
TABLE 476
WOLONG ELECTRIC GROUP: PRODUCTS/SOLUTIONS/SERVICES OFFERED
TABLE 477
WEG: COMPANY OVERVIEW
TABLE 478
WEG: PRODUCTS/SOLUTIONS/SERVICES OFFERED
TABLE 480
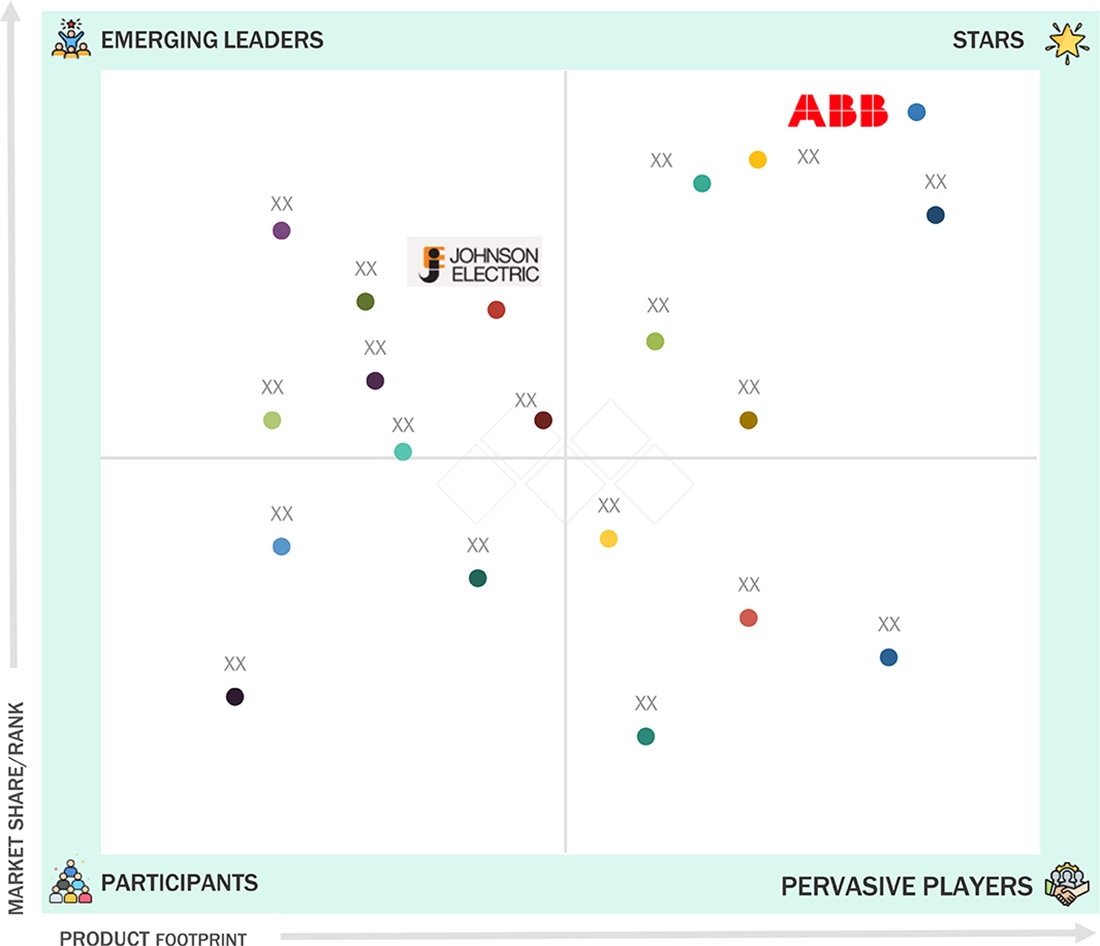
ALLIED MOTION: COMPANY OVERVIEW
TABLE 481
ALLIED MOTION: PRODUCTS/SOLUTIONS/SERVICES OFFERED
TABLE 482
ALLIED MOTION: PRODUCT LAUNCHES/ENHANCEMENTS
TABLE 483
AMETEK GMBH: COMPANY OVERVIEW
TABLE 484
AMETEK GMBH: PRODUCTS/SOLUTIONS/SERVICES OFFERED
TABLE 485
TOSHIBA CORPORATION: COMPANY OVERVIEW
TABLE 486
TOSHIBA CORPORATION: PRODUCTS/SOLUTIONS/SERVICES OFFERED
TABLE 487
TOSHIBA CORPORATION: PRODUCT LAUNCHES/ENHANCEMENTS
TABLE 488
REGAL REXNORD CORPORATION: COMPANY OVERVIEW
TABLE 489
REGAL REXNORD CORPORATION: PRODUCTS/SOLUTIONS/SERVICES OFFERED
TABLE 490
YASKAWA ELECTRIC CORPORATION: COMPANY OVERVIEW
TABLE 491
YASKAWA ELECTRIC CORPORATION: PRODUCTS/SOLUTIONS/SERVICES OFFERED
TABLE 492
LIEBHERR: COMPANY OVERVIEW
TABLE 493
LIEBHERR: PRODUCTS/SOLUTIONS/SERVICES OFFERED
TABLE 494
FAULHABER: COMPANY OVERVIEW
TABLE 495
FAULHABER: PRODUCTS/SOLUTIONS/SERVICES OFFERED
TABLE 496
TECO CORPORATION: COMPANY OVERVIEW
TABLE 497
TECO CORPORATION: PRODUCTS/SOLUTIONS/SERVICES OFFERED
TABLE 498
TECO CORPORATION: DEALS
FIGURE 1
PERMANENT MAGNET MOTOR MARKET: RESEARCH DESIGN
FIGURE 2
KEY METRICS CONSIDERED TO ANALYZE DEMAND FOR PERMANENT MAGNET MOTORS
FIGURE 3
PERMANENT MAGNET MOTOR MARKET: BOTTOM-UP APPROACH
FIGURE 4
PERMANENT MAGNET MOTOR MARKET SIZE ESTIMATION METHODOLOGY: TOP-DOWN APPROACH
FIGURE 5
KEY STEPS CONSIDERED FOR ASSESSING SUPPLY OF PERMANENT MAGNET MOTORS
FIGURE 6
PERMANENT MAGNET MOTOR MARKET: SUPPLY-SIDE ANALYSIS
FIGURE 7
DATA TRIANGULATION METHODOLOGY
FIGURE 8
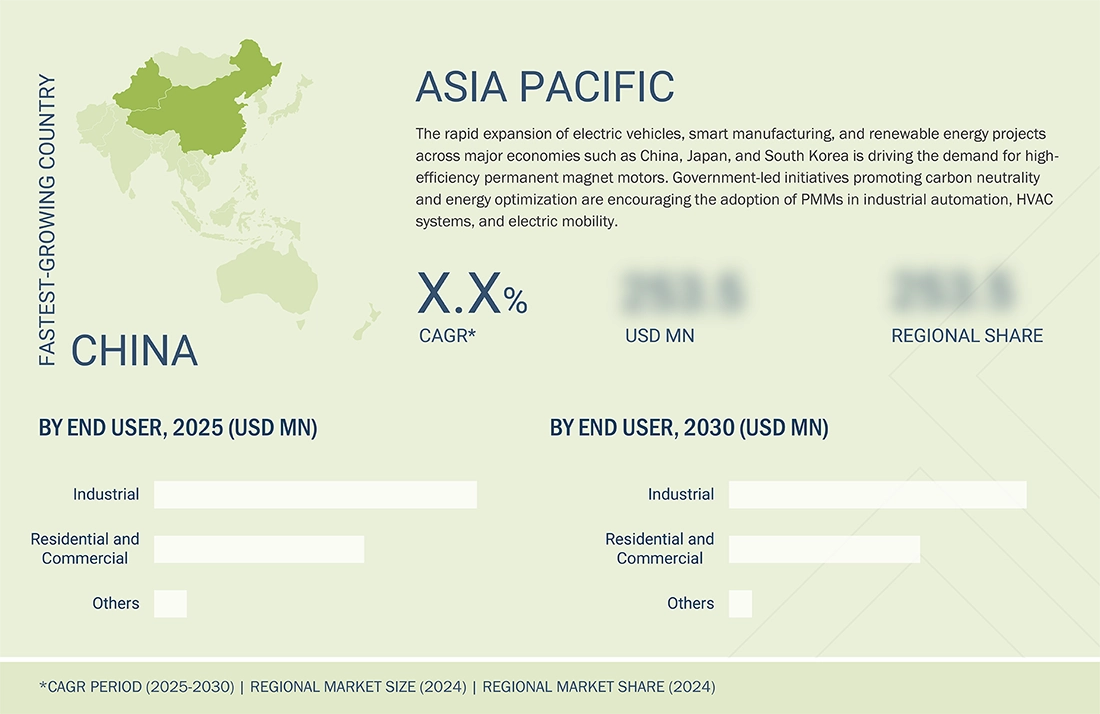
ASIA PACIFIC TO BE FASTEST-GROWING MARKET FOR PERMANENT MAGNET MOTORS DURING FORECAST PERIOD
FIGURE 9
PERMANENT MAGNET AC MOTORS TO HOLD PROMINENT MARKET SHARE IN 2025
FIGURE 10
UP TO 25 KW SEGMENT TO RECORD HIGHEST CAGR DURING FORECAST PERIOD
FIGURE 11
INDUSTRIAL SEGMENT TO LEAD PERMANENT MAGNET MOTOR MARKET THROUGHOUT FORECAST PERIOD
FIGURE 12
INCREASING INVESTMENTS IN ELECTRONIC APPLIANCES AND ELECTRIC VEHICLES TO DRIVE MARKET DURING FORECAST PERIOD
FIGURE 13
ASIA PACIFIC TO RECORD HIGHEST CAGR FROM 2025 TO 2030
FIGURE 14
PERMANENT MAGNET AC MOTORS AND CHINA LED MARKET IN ASIA PACIFIC IN 2024
FIGURE 15
PERMANENT MAGNET AC MOTORS TO ACCOUNT FOR MAJORITY OF MARKET SHARE IN 2030
FIGURE 16
UP TO 25 KW SEGMENT TO ACCOUNT FOR LARGEST MARKET SHARE IN 2030
FIGURE 17
INDUSTRIAL END USERS TO COMMAND PERMANENT MAGNET MOTOR MARKET IN 2030
FIGURE 18
PERMANENT MAGNET MOTOR MARKET: DRIVERS, RESTRAINTS, OPPORTUNITIES, AND CHALLENGES
FIGURE 19
WORLDWIDE EV SALES, MILLION UNITS, 2021–2024
FIGURE 20
TRENDS/DISRUPTIONS INFLUENCING CUSTOMERS IN PERMANENT MAGNET MOTOR MARKET
FIGURE 21
VALUE CHAIN ANALYSIS
FIGURE 22
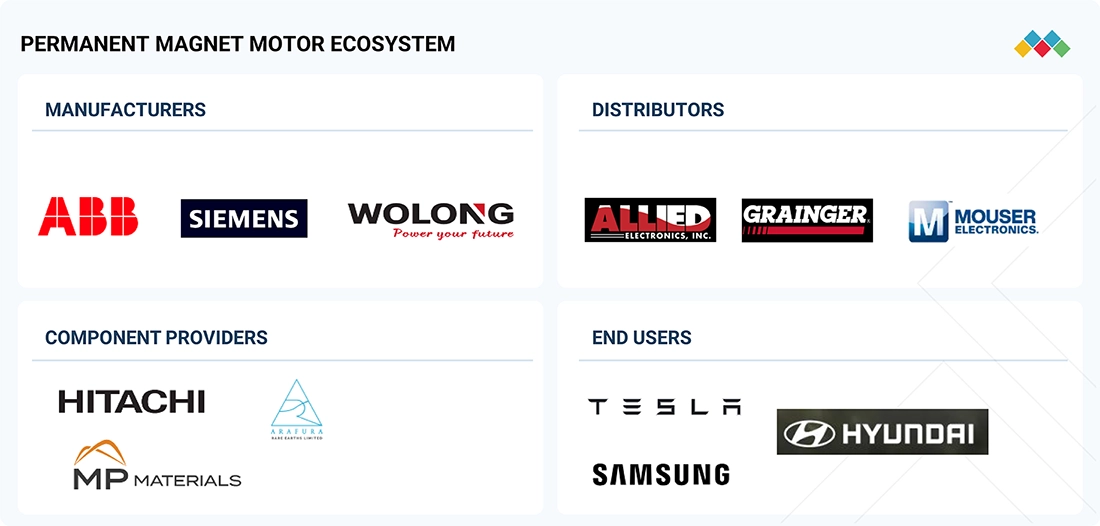
PERMANENT MAGNET MOTOR ECOSYSTEM PARTICIPANTS
FIGURE 23
PORTER’S FIVE FORCES ANALYSIS FOR PERMANENT MAGNET MOTOR MARKET
FIGURE 24
AVERAGE SELLING PRICE TREND OF PERMANENT MAGNET MOTOR TYPES, 2021–2024
FIGURE 25
AVERAGE SELLING PRICE TREND OF PERMANENT MAGNET MOTORS, BY REGION, 2021–2024
FIGURE 26
PATENTS APPLIED AND GRANTED, 2014–2024
FIGURE 27
IMPACT OF GENERATIVE AI/AI ON END USERS, BY REGION
FIGURE 28
PERMANENT MAGNET MOTOR MARKET SHARE, BY TYPE, 2024
FIGURE 29
PERMANENT MAGNET MOTOR MARKET, BY POWER RATING, 2024
FIGURE 30
PERMANENT MAGNET MOTOR MARKET SHARE, BY END USER, 2024
FIGURE 31
ASIA PACIFIC TO REGISTER HIGHEST CAGR IN PERMANENT MAGNET MOTOR MARKET DURING FORECAST PERIOD
FIGURE 32
PERMANENT MAGNET MOTOR MARKET, BY REGION, 2024
FIGURE 33
ASIA PACIFIC: PERMANENT MAGNET MOTOR MARKET SNAPSHOT
FIGURE 34
NORTH AMERICA: PERMANENT MAGNET MOTOR MARKET SNAPSHOT
FIGURE 35
PERMANENT MAGNET MOTOR MARKET SHARE ANALYSIS, 2024
FIGURE 36
PERMANENT MAGNET MOTOR MARKET: REVENUE ANALYSIS OF FOUR KEY PLAYERS, 2020 TO 2024
FIGURE 37
PERMANENT MAGNET MOTOR MARKET: COMPANY EVALUATION MATRIX (KEY PLAYERS), 2024
FIGURE 38
PERMANENT MAGNET MOTOR MARKET: COMPANY FOOTPRINT
FIGURE 39
ABB: COMPANY SNAPSHOT
FIGURE 40
SIEMENS: COMPANY SNAPSHOT
FIGURE 41
ROCKWELL AUTOMATION: COMPANY SNAPSHOT
FIGURE 42
NIDEC CORPORATION: COMPANY SNAPSHOT
FIGURE 43
JOHNSON ELECTRIC HOLDINGS LIMITED: COMPANY SNAPSHOT
FIGURE 44
WEG: COMPANY SNAPSHOT
FIGURE 45
ALLIED MOTION: COMPANY SNAPSHOT
FIGURE 46
AMETEK GMBH: COMPANY SNAPSHOT
FIGURE 47
REGAL REXNORD CORPORATION: COMPANY SNAPSHOT
FIGURE 48
YASKAWA ELECTRIC CORPORATION: COMPANY SNAPSHOT
FIGURE 49
LIEBHERR: COMPANY SNAPSHOT
FIGURE 50
TECO CORPORATION: COMPANY SNAPSHOT


 Exclusive indicates content/data unique to MarketsandMarkets and not available with any competitors.


Growth opportunities and latent adjacency in Permanent Magnet Motor Market