Peritoneal Dialysis Market

Report Code MD 9149
Published On Oct, 2024, By MarketsandMarkets™
Download PDF

Choose License Type

Buy Report Now Inquire Before Buying

Peritoneal Dialysis Market by Offering (Peritoneal Dialysis Solution Bags, Machines), Modality (Continuous Ambulatory Peritoneal Dialysis Center(CAPD)), Disease Indication (End-Stage Renal Disease), End User (Hospitals) - Global Forecast to 2029

Overview

The peritoneal dialysis market is projected to reach USD 12.70 Billion by 2029 from USD 9.58 Billion in 2024 at a CAGR of 5.8% throughout the forecast period. The market is also growing due to a number of drivers. For example, the prevalence of chronic kidney disease (CKD) is increasing in various countries; the demographic population is aging; and home-based therapies are the preferred choices for patients. According to the CDC, an estimated 14% of US adults, or 35.5 million, have CKD. The CDC reported that CKD was more common among people aged 65 years or more, which accounted for 34% than people aged between 45-64 years, which had 12%, and those aged 18-44, 6%. Going by markets like China, which is one of the leading markets in terms of the global dialysis population, the government is also promoting PD as the treatment choice at home with additional reimbursement and support. All these factors-rising patient populations, government support, technological advances, and a move towards home care-converge to drive the peritoneal dialysis market significantly across the world.

Attractive Opportunities in the Peritoneal Dialysis Market

Asia Pacific

Market growth in the Asia Pacific is attributed to the rising prevalence of acute kidney diseases, improving healthcare expenditure, and the growing accessibility of dialysis for ESRD treatment.

Market growth in the Asia Pacific is attributed to the rising prevalence of acute kidney diseases, improving healthcare expenditure, and the growing accessibility of dialysis for ESRD treatment.

Home peritoneal dialysis has become an important choice for patients, given rising accessibility and support.

The APAC market is projected to register a CAGR of 7.3% during the forecast period.

North America dominates the peritoneal dialysis market with a share of 40.8%. This market is projected to reach USD 5.18 billion by 2029, at a CAGR of 5.8% during the forecast period.

Global Peritoneal Dialysis Market Dynamics

DRIVERS: Technological advancements and increased investment in R&D

The key players like Fresenius Medical Care AG, Baxter International Inc., and Medtronic Plc are enhancing their products of PD for better treatment. Baxter's Home Choice Claria System is a light weight, portable PD cycler for APD use that can be remotely controlled. This will improve home PD use, the same program is provided by DaVita through its home kidney care services. In June 2023, Singapore General Hospital and AWAK Technologies have announced that a pre-pivotal clinical trial of an advanced version of the Automated Wearable Artificial Kidney Peritoneal Dialysis (AWAK PD) device has been launched. Based on its portability for dialysis, the FDA has given the company 'Breakthrough Device Designation'.

In April 2023, the FDA granted Medtronic Plc approval of its Enlite Glucose Sensor, a device that aids in the improvement of continuous monitoring within PD treatments. In February 2023, the Innovation Fund of National Kidney Foundation funded Relavo, a developer of home dialysis through PeritoneX technology, which eliminates risk from infections through the sanitizing of dialysis tubes and minimizes the peritonitis rate. These R&D investments prove the industry's efforts toward promoting dialysis technologies, patient safety, and quality treatment for patients with kidney disease.

RESTRAINTS: Underutilization of peritoneal dialysis in low-income and lower-middle-income countries (LLMICs)

PD has several advantages over HD, but it is grossly underutilized in the world, especially in the LLMICs, where KRT is frequently unavailable, inaccessible, and unaffordable. Today, in the world, only 11% of dialysis patients are using PD; and more than 50% of them live in China, the US, Mexico, or Thailand. Reports across the world have revealed various types of barriers to increased PD utilization, including low levels of education and low reimbursements for providers. Some patients even prefer other modes of treatment over dialysis, which is a barrier as well. However, LLMICS also present unique yet surmountable challenges in the sense that they continue to pose very high and prohibitive costs of PD services, particularly fluids for PD; higher relative treatment cost to patients, compared to HD; lack of adequate PD training opportunities for healthcare staff; shortage of the kidney care workforce; and problems associated with some PD outcomes, such as catheter-related infections, hospitalizations, and mortality rates.


OPPORTUNITIES: Increasing growth opportunities in emerging economies

Consideration of the emerging markets such as China, India, and Brazil will open up exceptional growth opportunities to the players operating in the peritoneal dialysis market. It is because these markets are showing an increased prevalence of diabetes and CKD. Continued expansion in economic growth in China and India coincides with increased expenditure on healthcare; hence, this enhances the affordability of peritoneal dialysis treatment. Concerning the growth opportunities for ESRD, as of an article written by BMC Nephrology in 2023, ESRD prevalence across China is anticipated to reach 1,505 patients per million population by 2025. To address the increasing demand for dialysis from the emerging market, the players aim at acquiring or partnering with healthcare providers in a bid to enter into a partnership. For instance, on December 2021, Baxter International Inc., US made an acquisition of all outstanding equity interest of Hill-Rom Holdings, Inc., a global leader in medical technology. Medtronic and DaVita in April 2023, launched Mozarc Medical-an independent new company that helps reshape kidney health, driving patient-centered tech solutions. Also, the rise in the number of dialysis clinics across emerging nations may also have an excellent growth prospect for the peritoneal dialysis market. Initiatives taken by the government, which include increased investment in health infrastructure, as well as providing subsidies for treatment costs across the emerging economies to enhance access to healthcare services such as dialysis, are likely to enhance market growth opportunities. The Government of India launched the Pradhan Mantri National Dialysis Programme (PMNDP), under which dialysis will be provided free of cost at the district hospitals across the country to BPL beneficiaries. Of the PMNDP beneficiaries up to 31 December 2022, about 1.7 million recipients were covered in terms of hemodialysis and peritoneal dialysis services.

CHALLENGES: Shortage of skilled nephrologists in low-income and lower-middle-income countries (LLMICs)

Low- and lower-middle-income countries (LLMICs) are actually experiencing an alarming shortfall of skilled nephrologists, which has impacted kidney care services negatively. The global median prevalence of nephrologists stands at 11.8 per million population, although this figure is very broadly dispersed across regions and different levels of income. Africa has the lowest count at 1.1 pRMR, while South Asia indicates a number as low as 1.8 pmp, followed by OSEA, at 3.2 pmp. Other countries in the list are probable to have the least percentage of nephrologists; they include Afghanistan at 0.03 PMP, Malawi at 0.05 pmp, and Mozambique at 0.09 pmp. A great number of countries also have no nephrologists present within them, and among such countries is Samoa, Solomon Islands, Vanuatu, and Andorra. Nephrologist trainees are also not spared, with LICS attaining a median prevalence as low as 0.1 pmp and LMICS reaching 0.3 pmp, whereas the figure was 1.3 Rmp in upper-middle-income countries (UMICs) and 3.9 pmp in high-income countries (HICs). In LICS, nephrologists shortfalls are very severe at 90%, and pediatric nephrologists shortfalls are severe at 95%. Shortfalls of transplant surgeons stay at 90%. Specialists who provide access to HD and PD are at100% and 90% respectively. These shortfalls are worse in the poorer regions where scarcity of training facilities and resources heightens the situation.

There is a very paucity of trained nephrologists, and proper education programs tailored for the branch of nephrology are also limited in number. All these contribute to bigger consequences with dialysis treatment and health outcomes. Improving kidney care outcomes along with the reduction of burden caused due to kidney diseases can be obtained by addressing these shortages in resource-deficient settings.

Global Peritoneal Dialysis Market Ecosystem Analysis

The peritoneal dialysis market ecosystem is comprised of several firms that operate in manufacturing, distribution, raw material procurement, and service provision necessary for a dialysis treatment. The leaders among these manufacturers are Baxter International Inc, Fresenius Medical Care AG, and Medtronic plc, which drive the requirement for new product development and innovation. At the distribution end, this includes distribution through Cardinal Health and McKesson to spread across possible markets. Finally, various raw material suppliers-industry goliaths like 3M and Merck-compose key components needed for the production of a dialysis product. Services companies like DaVita Kidney Care and U.S. Renal Care offer dialysis services through this network of services. The advantage of this integrated system is that the supply chain will not have a bunch of bottlenecks because services delivery is efficient and prompt to meet the global demand for peritoneal dialysis solutions.


Peritoneal solution bags segment is accounted for the largest share of peritoneal dialysis market

Peritoneal dialysis solution bags hold the largest market share because they are a requisite part of continuous dialysis treatment. Major dialysis service providers often enter into long-term contracts with hospitals and clinics to avoid running out of these crucial consumables at any point in time. Long-term agreements for such consumable items make it easier for healthcare facilities to procure them and ensure continuous stock supplies with less likelihood of interrupted patient care. Securement of the partnerships assures providers not only a market presence but also reliability with the healthcare institutions. It is essential because patients rely on the consistent delivery of solution bags for everyday treatment, and such contracts are thus critical in the long term.

Continuous Ambulatory Peritoneal Dialysis (CAPD) segment holds the largest market share of peritoneal dialysis market

Continuous Ambulatory Peritoneal Dialysis (CAPD) holds the largest share of the global peritoneal dialysis market, mainly because it has significant advantages in patient outcomes. A study observes that CAPD retains patients' residual kidney function far better than other treatments for which patients stay active for a considerably long period as compared to hemodialysis patients. It also greatly decreases the rate of hospitalizations because this facilitates the option of allowing patients to do the dialysis in their homes, thus reducing chances of complications in hospitals. This home-based treatment approach boosts the autonomy and self-care that patients can exhibit toward handling their conditions, hence fostering adherence with treatment while also ensuring increased quality of life and better health outcomes for patients.

End-stage renal disease segment accounted for the largest market share in the global peritoneal dialysis market and expected to grow at the highest CAGR during the forecast period

The global peritoneal dialysis market is primarily constituting End-stage Renal Disease (ESRD), in line with more awareness and education associated with the disease, gaining medical importance through proper diagnosis as early as possible. Education leading to an increase in all strata of patients and service providers results in equal knowledge on kidney damage and time-sensitive intervention as well. It leads to earlier diagnoses and a subsequent growth in the patients needing dialysis treatments. So, demand for dialysis, peritoneal included, is growing as patients seek more effective and accessible solutions to manage their condition and to maintain their quality of life.

Home care setttings segment holds the largest market share in the global peritoneal dialysis market and expected to grow at the highest CAGR during the forecast period.

Home care settings make up the largest share of the international peritoneal dialysis market, primarily because: a more expanded treatment setting allows patients in distant or less-connected regions to access regular medical treatment. The availability of home dialysis becomes a practical and viable alternative when limited medical institutions in an area force patients into looking for efficient ways to manage their dialysis in the comfort of their homes. This flexibility, therefore reduces the need to visit hospitals frequently while also lightening health care systems; the patient is empowered with the ability to perform dialysis independently through home care settings so that more people will be able to receive the necessary treatment thus improving health outcomes and quality of life.

Asia Pacific region is expected to exhibit the highest growth rate during the forecast period

The Asia Pacific is expected to see the highest CAGR in the global peritoneal dialysis market during the forecasting years, mainly due to the increasing incidence of kidney diseases within the matured population of Japan and China. In addition to these statistics, the changing demography is creating a higher demand for efficient dialysis solutions, and a high rate of dialogue between governments, NGOs, and private companies is making dialysis services much more accessible. Through these partnerships, it will be possible to have health programs established, access improved, and awareness concerning peritoneal dialysis options. These factors enhance better health outcomes in consequence, driving growth within the market within the region.

HIGHEST CAGR MARKET IN 2023
CHINA FASTEST GROWING MARKET IN THE REGION

Recent Developments of Peritoneal Dialysis Market

  • In August 2024, Baxter International Inc (US) and Carlyle (US) signed a definitive agreement under which Carlyle will acquire Baxter's Kidney Care segment. The segment will be named Vantive, with the aim of creating a standalone kidney care company.
  • In April 2023, Medtronic plc (Ireland) and DaVita Inc (US) launched Mozarc Medical—an independent new company that aims to reshape kidney health and drive patient-centered technology solutions.
  • In August 2022, Fresenius Medical Care AG (Germany) acquired InterWell Health (US), a physician organization that drives innovation in the kidney care space in the US, and Cricket Health. Inc (US), provider of value-based kidney care with patient engagement and data platform.
  • In February 2021, Terumo Corporation (Japan) finalized an agreement to acquire Health Outcomes Sciences, Inc. This acquisition will position Terumo as a leader in clinical decision support and predictive analytics, enabling healthcare organizations to receive customized insights at the point of care. These insights aim to improve clinical, patient, and financial outcomes.

Key Market Players

Get online access to the report on the World's First Market Intelligence Cloud

  • Easy to Download Historical Data & Forecast Numbers
  • Company Analysis Dashboard for high growth potential opportunities
  • Research Analyst Access for customization & queries
  • Competitor Analysis with Interactive dashboard
  • Latest News, Updates & Trend analysis
Request Sample

Scope of the Report

Report Metric Details
Market Size Available for Years 2022-2029
Base Year Considered 2023
Forecast period 2024-2029
Forecast units Value (USD Million)
Segments covered By Offering, Modality, Disease Indication, End User and Region
Geographies covered North America, Europe, Asia Pacific, Middle East & Africa, GCC Countries.


Key Questions Addressed by the Report

Which are the top industry players in the peritoneal dialysis market?
The major players in this market are Baxter International Inc. (US), Fresenius Medical Care AG (Germany), Medtronic plc (Ireland), Davita Inc. (US), Becton, Dickinson and Company (US).
Which modality segments have been included in the peritoneal dialysis market report?
The report contains the following modality segments:
  • Continuous Ambulatory Peritoneal Dialysis (CAPD)
  • Automated Peritoneal Dialysis (APD)
Which region is dominating in the peritoneal dialysis market?
In 2023, North America accounted for the largest share of the peritoneal dialysis market. North America boasts a well-developed health care system with advanced technologies and facilities, thus ensuring easy delivery of peritoneal dialysis.
What are emerging trends in peritoneal dialysis market?
One of the developing trends in the peritoneal dialysis market is new innovation in dialysis equipment, including APD machines, is making home-based treatment safer and more efficient with increased possibilities for more user-friendly interfaces and better monitoring. Telemedicine improves patient management and follow-up care through peritoneal dialysis. Remote monitoring and virtual consultations facilitate timely assessment by healthcare providers about the progress of patients and the possibility of adjusting treatment plans.
What is the total CAGR expected to be recorded for the peritoneal dialysis market during 2024-2029?
It is expected to record a CAGR of 5.8% from 2024-2029


Personalize This Research

  • Triangulate with your Own Data
  • Get Data as per your Format and Definition
  • Gain a Deeper Dive on a Specific Application, Geography, Customer or Competitor
  • Any level of Personalization
Request A Free Customisation

Let Us Help You

  • What are the Known and Unknown Adjacencies Impacting the Peritoneal Dialysis Market
  • What will your New Revenue Sources be?
  • Who will be your Top Customer; what will make them switch?
  • Defend your Market Share or Win Competitors
  • Get a Scorecard for Target Partners
Request A Free Customisation

Table Of Content

Exclusive indicates content/data unique to MarketsandMarkets and not available with any competitors.

TITLE
PAGE NO
INTRODUCTION
24
RESEARCH METHODOLOGY
29
EXECUTIVE SUMMARY
43
PREMIUM INSIGHTS
48
MARKET OVERVIEW
52
  • 5.1 INTRODUCTION
  • 5.2 MARKET DYNAMICS
    DRIVERS
    - Rising prevalence of chronic kidney diseases
    - Growing prevalence of diabetes and hypertension
    - Technological advancements and increased investment in R&D
    RESTRAINTS
    - Underutilization of peritoneal dialysis in low-income and lower-middle-income countries (LLMICs)
    OPPORTUNITIES
    - Increasing growth opportunities in emerging economies
    - Surge in demand for home dialysis treatment
    CHALLENGES
    - Shortage of skilled nephrologists in low-income and lower-middle-income countries (LLMICs)
    - High risk of peritonitis as a barrier to peritoneal dialysis adoption
  • 5.3 INDUSTRY TRENDS
    INCREASED ADOPTION OF HOME-BASED TREATMENTS
    RISING INCIDENCE OF CHRONIC KIDNEY DISEASE (CKD)
  • 5.4 TECHNOLOGY ANALYSIS
    KEY TECHNOLOGIES
    - Automated peritoneal dialysis (APD) machines
    COMPLEMENTARY TECHNOLOGIES
    - Remote monitoring systems
    ADJACENT TECHNOLOGIES
    - Wearable technology
  • 5.5 SUPPLY CHAIN ANALYSIS
  • 5.6 VALUE CHAIN ANALYSIS
  • 5.7 TRADE ANALYSIS
    TRADE ANALYSIS FOR PERITONEAL DIALYSIS MACHINES, SOLUTION BAGS, CATHETERS, AND TRANSFER SETS (HS CODE 9018)
  • 5.8 PORTER’S FIVE FORCES ANALYSIS
    THREAT OF NEW ENTRANTS
    THREAT OF SUBSTITUTES
    BARGAINING POWER OF SUPPLIERS
    BARGAINING POWER OF BUYERS
    INTENSITY OF COMPETITIVE RIVALRY
  • 5.9 REGULATORY ANALYSIS
    REGULATORY LANDSCAPE
    - North America
    - Europe
    - Asia Pacific
    - Latin America
    - Middle East
    - Africa
    REGULATORY BODIES, GOVERNMENT AGENCIES, AND OTHER ORGANIZATIONS
  • 5.10 PATENT ANALYSIS
    PATENT PUBLICATION TRENDS FOR PERITONEAL DIALYSIS MARKET
    INSIGHTS: JURISDICTION AND TOP APPLICANT ANALYSIS
  • 5.11 PRICING ANALYSIS
    AVERAGE SELLING PRICE OF PERITONEAL DIALYSIS PRODUCTS AND CONSUMABLES, BY KEY PLAYER (2023)
  • 5.12 KEY CONFERENCES & EVENTS, 2024–2025
  • 5.13 KEY STAKEHOLDERS & BUYING CRITERIA
    KEY STAKEHOLDERS IN BUYING PROCESS
    KEY BUYING CRITERIA
  • 5.14 ECOSYSTEM ANALYSIS
  • 5.15 ADJACENT MARKET ANALYSIS
    HEMODIALYSIS AND PERITONEAL DIALYSIS MARKET
    CONTINUOUS RENAL REPLACEMENT THERAPY MARKET
  • 5.16 CASE STUDY ANALYSIS
  • 5.17 IMPACT OF GENERATIVE AI ON PERITONEAL DIALYSIS MARKET
  • 5.18 UNMET NEEDS AND END-USER EXPECTATIONS
  • 5.19 TRENDS/DISRUPTIONS AFFECTING CUSTOMERS’ BUSINESSES
  • 5.20 INVESTMENT & FUNDING SCENARIO
  • 5.21 PROCEDURE DATA ANALYSIS
    PREVALENCE DATA FOR TREATED KIDNEY FAILURE
PERITONEAL DIALYSIS MARKET, BY OFFERING
90
  • 6.1 INTRODUCTION
  • 6.2 PERITONEAL DIALYSIS PRODUCTS
    PERITONEAL DIALYSIS SOLUTION BAGS
    - High demand for solutions to boost segmental growth
    PERITONEAL DIALYSIS MACHINES
    - Rising prevalence of chronic diseases in emerging economies to boost adoption
    PERITONEAL DIALYSIS CATHETERS
    - Favorable reimbursement policies to support market growth
    PERITONEAL DIALYSIS TRANSFER SETS
    - Product recalls to limit market growth
    OTHER PERITONEAL DIALYSIS PRODUCTS
  • 6.3 PERITONEAL DIALYSIS SERVICES
    BETTER PRIVACY AND INCREASED COMFORT OF AT-HOME DIALYSIS TREATMENT TO DRIVE MARKET
PERITONEAL DIALYSIS MARKET, BY MODALITY
102
  • 7.1 INTRODUCTION
  • 7.2 CONTINUOUS AMBULATORY PERITONEAL DIALYSIS (CAPD)
    SUPERIOR CLEARANCE OF HIGH-MOLECULAR-WEIGHT SUBSTANCES TO DRIVE MARKET
  • 7.3 AUTOMATED PERITONEAL DIALYSIS (APD)
    RISK OF RAPID DECLINE IN RESIDUAL RENAL FUNCTIONS TO LIMIT ADOPTION
PERITONEAL DIALYSIS MARKET, BY DISEASE INDICATION
106
  • 8.1 INTRODUCTION
  • 8.2 END-STAGE RENAL DISEASE
    GROWING GERIATRIC POPULATION AND INCREASING PREVALENCE OF DIABETES TO DRIVE MARKET
  • 8.3 ACUTE KIDNEY INJURY
    INCREASING HOSPITALIZATIONS TO PROPEL MARKET GROWTH
  • 8.4 OTHER DISEASES
PERITONEAL DIALYSIS MARKET, BY END USER
111
  • 9.1 INTRODUCTION
  • 9.2 HOME CARE SETTINGS
    LOWER COST AND SHORTER HOSPITAL STAYS TO AID MARKET GROWTH
  • 9.3 HOSPITALS & INDEPENDENT DIALYSIS CENTERS
    IMPROVED FACILITIES AND INCREASED GOVERNMENT SUPPORT TO DRIVE MARKET
  • 9.4 OTHER END USERS
PERITONEAL DIALYSIS MARKET, BY REGION
117
  • 10.1 INTRODUCTION
    PERITONEAL DIALYSIS PREVALENCE DATA
    PERITONEAL DIALYSIS PROCEDURE DATA
  • 10.2 NORTH AMERICA
    MACROECONOMIC OUTLOOK FOR NORTH AMERICA
    US
    - US to account for largest market share during study period
    CANADA
    - Shortage of dialysis facilities and increased treatment cost to limit market
  • 10.3 EUROPE
    MACROECONOMIC OUTLOOK FOR EUROPE
    GERMANY
    - Rising number of end-stage renal disease (ESRD) patients to boost market growth
    UK
    - Increased number of new dialysis centers and technological advancements to support market growth
    FRANCE
    - Low cost of peritoneal dialysis and consistent reimbursement policies to drive market growth
    ITALY
    - Increasing research activities and growing patient population with acute renal failure to augment market growth
    SPAIN
    - Favorable reimbursement scenario to boost market growth
    REST OF EUROPE
  • 10.4 ASIA PACIFIC
    MACROECONOMIC OUTLOOK FOR ASIA PACIFIC
    JAPAN
    - High prevalence of end-stage renal disease (ESRD) and large geriatric population to support market growth
    CHINA
    - Increasing prevalence of diabetes and hypertension to drive market
    INDIA
    - Favorable government initiatives and high prevalence of kidney disease to fuel market growth
    AUSTRALIA
    - Increasing government initiatives about renal care to support market growth
    SOUTH KOREA
    - Growing geriatric population with chronic kidney disease to propel market growth
    REST OF ASIA PACIFIC
  • 10.5 LATIN AMERICA
    MACROECONOMIC OUTLOOK FOR LATIN AMERICA
    BRAZIL
    - Brazil to account for largest share of Latin American market during forecast period
    MEXICO
    - Increasing patient population and growing middle class population to boost market growth
    REST OF LATIN AMERICA
  • 10.6 MIDDLE EAST & AFRICA
    GROWING DEMAND FOR CONVENIENT AND ACCESSIBLE RENAL CARE TO PROPEL GROWTH
    MACROECONOMIC OUTLOOK FOR MIDDLE EAST & AFRICA
  • 10.7 GCC COUNTRIES
    HIGHER DISPOSABLE INCOME AND INCREASED GOVERNMENT HEALTHCARE EXPENDITURE TO PROPEL MARKET GROWTH
    MACROECONOMIC OUTLOOK FOR GCC COUNTRIES
COMPETITIVE LANDSCAPE
185
  • 11.1 OVERVIEW
  • 11.2 KEY PLAYER STRATEGY/RIGHT TO WIN
    OVERVIEW OF STRATEGIES ADOPTED BY PLAYERS IN PERITONEAL DIALYSIS MARKET
  • 11.3 REVENUE ANALYSIS, 2019–2023
  • 11.4 MARKET SHARE ANALYSIS, 2023
  • 11.5 COMPANY EVALUATION MATRIX: KEY PLAYERS, 2023
    STARS
    EMERGING LEADERS
    PERVASIVE PLAYERS
    PARTICIPANTS
    COMPANY FOOTPRINT: KEY PLAYERS, 2023
    - Company footprint
    - Offering footprint
    - Modality footprint
    - Disease indication footprint
    - End-user footprint
    - Region footprint
  • 11.6 COMPANY EVALUATION MATRIX: START-UPS/SMES, 2023
    PROGRESSIVE COMPANIES
    RESPONSIVE COMPANIES
    DYNAMIC COMPANIES
    STARTING BLOCKS
    COMPETITIVE BENCHMARKING: STARTUPS/SMES, 2023
  • 11.7 COMPANY VALUATION & FINANCIAL METRICS
  • 11.8 COMPETITIVE SCENARIO
    PRODUCT APPROVALS
    DEALS
    EXPANSIONS
  • 11.9 BRAND/PRODUCT COMPARISON
  • 11.10 PERITONEAL DIALYSIS MARKET: R&D EXPENDITURE
COMPANY PROFILES
205
  • 12.1 KEY PLAYERS
    FRESENIUS MEDICAL CARE AG
    - Business overview
    - Products & services offered
    - Recent developments
    - MnM view
    BAXTER INTERNATIONAL INC.
    - Business overview
    - Products & services offered
    - Recent developments
    - MnM view
    MEDTRONIC PLC
    - Business overview
    - Products & services offered
    - Recent developments
    - MnM view
    DAVITA INC.
    - Business overview
    - Products & services offered
    - Recent developments
    - MnM view
    BECTON, DICKINSON AND COMPANY
    - Business overview
    - Products & services offered
    - Recent developments
    - MnM view
    TERUMO CORPORATION
    - Business overview
    - Products & services offered
    - Recent developments
    UTAH MEDICAL PRODUCTS, INC.
    - Business overview
    - Products & services offered
    DIAVERUM AB
    - Business overview
    - Products & services offered
    MEDIONICS
    - Business overview
    - Products & services offered
    NEWSOL TECHNOLOGIES INC.
    - Business overview
    - Products & services offered
    APOLLO DIALYSIS PVT. LTD.
    - Business overview
    - Products & services offered
    U.S. RENAL CARE, INC.
    - Business overview
    - Products & services offered
    NORTHWEST KIDNEY CENTERS
    - Business overview
    - Products & services offered
    - Recent developments
    RELAVO
    - Business overview
    - Products & services offered
    MITRA INDUSTRIES PVT. LTD.
    - Business overview
    - Products & services offered
  • 12.2 OTHER PLAYERS
    JMS CO., LTD.
    AMECATH
    POLYMEDICURE
    HUAREN PHARMACEUTICAL
    AWAK TECHNOLOGIES
    INNOVATIVE RENAL CARE
    ROMSONS
    SSEM MTHEMBU MEDICAL (PTY) LTD.
    RENAX BIOMEDICAL TECHNOLOGY CO., LTD.
    ADVIN HEALTH CARE
APPENDIX
246
  • 13.1 KNOWLEDGESTORE: MARKETSANDMARKETS’ SUBSCRIPTION PORTAL
  • 13.2 CUSTOMIZATION OPTIONS
  • 13.3 RELATED REPORTS
  • 13.4 AUTHOR DETAILS
LIST OF TABLES
 
  • TABLE 1 STANDARD CURRENCY CONVERSION RATES
  • TABLE 2 NUMBER OF PEOPLE AGED 65 YEARS OR OVER, BY REGION, 2022 VS. 2050
  • TABLE 3 UTILIZATION OF KIDNEY REPLACEMENT THERAPIES (PERITONEAL DIALYSIS VS. HEMODIALYSIS)
  • TABLE 4 COST OF KIDNEY REPLACEMENT THERAPIES (2021)
  • TABLE 5 TRADE ANALYSIS OF MEDICAL DEVICE PRODUCTS
  • TABLE 6 IMPORT DATA FOR PERITONEAL DIALYSIS MACHINES, SOLUTION BAGS, CATHETERS, AND TRANSFER SETS (HS CODE 9018), BY COUNTRY, 2019–2023 (USD THOUSAND)
  • TABLE 7 EXPORT DATA FOR PERITONEAL DIALYSIS MACHINES, SOLUTION BAGS, CATHETERS AND TRANSFER SETS (HS CODE 9018), BY COUNTRY, 2019–2023 (USD THOUSAND)
  • TABLE 8 PERITONEAL DIALYSIS MARKET: PORTER’S FIVE FORCES ANALYSIS
  • TABLE 9 NORTH AMERICA: REGULATORY BODIES, GOVERNMENT AGENCIES, AND OTHER ORGANIZATIONS
  • TABLE 10 EUROPE: REGULATORY BODIES, GOVERNMENT AGENCIES, AND OTHER ORGANIZATIONS
  • TABLE 11 ASIA PACIFIC: REGULATORY BODIES, GOVERNMENT AGENCIES, AND OTHER ORGANIZATIONS
  • TABLE 12 LATIN AMERICA: REGULATORY BODIES, GOVERNMENT AGENCIES, AND OTHER ORGANIZATIONS
  • TABLE 13 MIDDLE EAST & AFRICA: REGULATORY BODIES, GOVERNMENT AGENCIES, AND OTHER ORGANIZATIONS
  • TABLE 14 AVERAGE SELLING PRICE OF PERITONEAL DIALYSIS PRODUCTS AND CONSUMABLES, BY KEY PLAYER, 2023 (USD)
  • TABLE 15 PERITONEAL DIALYSIS MARKET: DETAILED LIST OF KEY CONFERENCES & EVENTS, 2024–2025
  • TABLE 16 INFLUENCE OF KEY STAKEHOLDERS ON BUYING PROCESS FOR PERITONEAL DIALYSIS PRODUCTS
  • TABLE 17 BUYING CRITERIA FOR PERITONEAL DIALYSIS PRODUCTS
  • TABLE 18 PERITONEAL DIALYSIS MARKET: ECOSYSTEM ANALYSIS
  • TABLE 19 CASE STUDY 1: CUSTOMIZED DIALYSIS TUBING SETS
  • TABLE 20 CASE STUDY 2: CUSTOMIZED SOFTWARE FOR AUTOMATED PERITONEAL DIALYSIS (APD) MACHINE
  • TABLE 21 PERITONEAL DIALYSIS MARKET: UNMET NEEDS
  • TABLE 22 PERITONEAL DIALYSIS MARKET: END-USER EXPECTATIONS
  • TABLE 23 PREVALENCE DATA, BY COUNTRY, 2021–2023 (PMP)
  • TABLE 24 NUMBER OF PERITONEAL DIALYSIS PATIENTS, BY REGION, 2019–2023
  • TABLE 25 NUMBER OF PERITONEAL DIALYSIS PATIENTS, BY REGION, 2024–2029
  • TABLE 26 PROCEDURE DATA FOR PERITONEAL DIALYSIS, BY COUNTRY, 2019–2023
  • TABLE 27 PROCEDURE DATA FOR PERITONEAL DIALYSIS, BY COUNTRY, 2024–2029
  • TABLE 28 PERITONEAL DIALYSIS MARKET, BY OFFERING, 2022–2029 (USD MILLION)
  • TABLE 29 PERITONEAL DIALYSIS PRODUCTS MARKET, BY TYPE, 2022–2029 (USD MILLION)
  • TABLE 30 PERITONEAL DIALYSIS PRODUCTS MARKET, BY COUNTRY, 2022–2029 (USD MILLION)
  • TABLE 31 AVERAGE VOLUME OF EXCHANGE, BY REGION, 2019–2023 (MILLION LITERS)
  • TABLE 32 AVERAGE VOLUME OF EXCHANGE, BY REGION, 2024–2029 (MILLION LITERS)
  • TABLE 33 PERITONEAL DIALYSIS SOLUTION BAGS MARKET, BY COUNTRY, 2022–2029 (USD MILLION)
  • TABLE 34 PERITONEAL DIALYSIS SOLUTION BAGS MARKET, BY REGION, 2022–2029 (THOUSAND UNITS)
  • TABLE 35 PERITONEAL DIALYSIS MACHINES MARKET, BY COUNTRY, 2022–2029 (USD MILLION)
  • TABLE 36 PERITONEAL DIALYSIS MACHINES MARKET, BY REGION, 2022–2029 (THOUSAND UNITS)
  • TABLE 37 PERITONEAL DIALYSIS CATHETERS MARKET, BY COUNTRY, 2022–2029 (USD MILLION)
  • TABLE 38 PERITONEAL DIALYSIS TRANSFER SETS MARKET, BY COUNTRY, 2022–2029 (USD MILLION)
  • TABLE 39 OTHER PERITONEAL DIALYSIS PRODUCTS MARKET, BY COUNTRY, 2022–2029 (USD MILLION)
  • TABLE 40 PERITONEAL DIALYSIS SERVICES MARKET, BY COUNTRY, 2022–2029 (USD MILLION)
  • TABLE 41 PERITONEAL DIALYSIS MARKET, BY MODALITY, 2022–2029 (USD MILLION)
  • TABLE 42 CONTINUOUS AMBULATORY PERITONEAL DIALYSIS (CAPD) MARKET, BY COUNTRY, 2022–2029 (USD MILLION)
  • TABLE 43 AMBULATORY PERITONEAL DIALYSIS (APD) MARKET, BY COUNTRY, 2022–2029 (USD MILLION)
  • TABLE 44 PERITONEAL DIALYSIS MARKET, BY DISEASE INDICATION, 2022–2029 (USD MILLION)
  • TABLE 45 PERITONEAL DIALYSIS MARKET FOR END-STAGE RENAL DISEASE, BY REGION, 2022–2029 (USD MILLION)
  • TABLE 46 PERITONEAL DIALYSIS MARKET FOR ACUTE KIDNEY INJURY, BY REGION, 2022–2029 (USD MILLION)
  • TABLE 47 PERITONEAL DIALYSIS MARKET FOR OTHER DISEASES, BY COUNTRY, 2022–2029 (USD MILLION)
  • TABLE 48 PERITONEAL DIALYSIS MARKET, BY END USER, 2022–2029 (USD MILLION)
  • TABLE 49 PERITONEAL DIALYSIS MARKET FOR HOME CARE SETTINGS, BY COUNTRY, 2022–2029 (USD MILLION)
  • TABLE 50 PERITONEAL DIALYSIS MARKET FOR HOSPITALS & INDEPENDENT DIALYSIS CENTERS, BY COUNTRY, 2022–2029 (USD MILLION)
  • TABLE 51 PERITONEAL DIALYSIS MARKET FOR OTHER END USERS, BY COUNTRY, 2022–2029 (USD MILLION)
  • TABLE 52 PERITONEAL DIALYSIS PREVALENCE DATA, BY COUNTRY, 2019–2023
  • TABLE 53 PERITONEAL DIALYSIS PREVALENCE DATA, BY COUNTRY, 2024–2029
  • TABLE 54 PERITONEAL DIALYSIS PROCEDURE DATA, BY REGION, 2019–2023 (MILLION PROCEDURES)
  • TABLE 55 PERITONEAL DIALYSIS PROCEDURE DATA, BY REGION, 2024–2029 (MILLION PROCEDURES)
  • TABLE 56 PERITONEAL DIALYSIS MARKET, BY REGION, 2022–2029 (USD MILLION)
  • TABLE 57 NORTH AMERICA: PERITONEAL DIALYSIS MARKET, BY COUNTRY, 2022–2029 (USD MILLION)
  • TABLE 58 NORTH AMERICA: PERITONEAL DIALYSIS MARKET, BY OFFERING, 2022–2029 (USD MILLION)
  • TABLE 59 NORTH AMERICA: PERITONEAL DIALYSIS PRODUCTS MARKET, BY TYPE, 2022–2029 (USD MILLION)
  • TABLE 60 NORTH AMERICA: PERITONEAL DIALYSIS MARKET, BY MODALITY, 2022–2029 (USD MILLION)
  • TABLE 61 NORTH AMERICA: PERITONEAL DIALYSIS MARKET, BY DISEASE INDICATION, 2022–2029 (USD MILLION)
  • TABLE 62 NORTH AMERICA: PERITONEAL DIALYSIS MARKET, BY END USER, 2022–2029 (USD MILLION)
  • TABLE 63 US: MACROECONOMIC INDICATORS
  • TABLE 64 US: PERITONEAL DIALYSIS MARKET, BY OFFERING, 2022–2029 (USD MILLION)
  • TABLE 65 US: PERITONEAL DIALYSIS PRODUCTS MARKET, BY TYPE, 2022–2029 (USD MILLION)
  • TABLE 66 US: PERITONEAL DIALYSIS MARKET, BY MODALITY, 2022–2029 (USD MILLION)
  • TABLE 67 US: PERITONEAL DIALYSIS MARKET, BY DISEASE INDICATION, 2022–2029 (USD MILLION)
  • TABLE 68 US: PERITONEAL DIALYSIS MARKET, BY END USER, 2022–2029 (USD MILLION)
  • TABLE 69 CANADA: MACROECONOMIC INDICATORS
  • TABLE 70 CANADA: PERITONEAL DIALYSIS MARKET, BY OFFERING, 2022–2029 (USD MILLION)
  • TABLE 71 CANADA: PERITONEAL DIALYSIS PRODUCTS MARKET, BY TYPE, 2022–2029 (USD MILLION)
  • TABLE 72 CANADA: PERITONEAL DIALYSIS MARKET, BY MODALITY, 2022–2029 (USD MILLION)
  • TABLE 73 CANADA: PERITONEAL DIALYSIS MARKET, BY DISEASE INDICATION, 2022–2029 (USD MILLION)
  • TABLE 74 CANADA: PERITONEAL DIALYSIS MARKET, BY END USER, 2022–2029 (USD MILLION)
  • TABLE 75 EUROPE: PERITONEAL DIALYSIS MARKET, BY COUNTRY, 2022–2029 (USD MILLION)
  • TABLE 76 EUROPE: PERITONEAL DIALYSIS MARKET, BY OFFERING, 2022–2029 (USD MILLION)
  • TABLE 77 EUROPE: PERITONEAL DIALYSIS PRODUCTS MARKET, BY TYPE, 2022–2029 (USD MILLION)
  • TABLE 78 EUROPE: PERITONEAL DIALYSIS MARKET, BY MODALITY, 2022–2029 (USD MILLION)
  • TABLE 79 EUROPE: PERITONEAL DIALYSIS MARKET, BY DISEASE INDICATION, 2022–2029 (USD MILLION)
  • TABLE 80 EUROPE: PERITONEAL DIALYSIS MARKET, BY END USER, 2022–2029 (USD MILLION)
  • TABLE 81 GERMANY: MACROECONOMIC INDICATORS
  • TABLE 82 GERMANY: PERITONEAL DIALYSIS MARKET, BY OFFERING, 2022–2029 (USD MILLION)
  • TABLE 83 GERMANY: PERITONEAL DIALYSIS PRODUCTS MARKET, BY TYPE, 2022–2029 (USD MILLION)
  • TABLE 84 GERMANY: PERITONEAL DIALYSIS MARKET, BY MODALITY, 2022–2029 (USD MILLION)
  • TABLE 85 GERMANY: PERITONEAL DIALYSIS MARKET, BY DISEASE INDICATION, 2022–2029 (USD MILLION)
  • TABLE 86 GERMANY: PERITONEAL DIALYSIS MARKET, BY END USER, 2022–2029 (USD MILLION)
  • TABLE 87 UK: MACROECONOMIC INDICATORS
  • TABLE 88 UK: PERITONEAL DIALYSIS MARKET, BY OFFERING, 2022–2029 (USD MILLION)
  • TABLE 89 UK: PERITONEAL DIALYSIS PRODUCTS MARKET, BY TYPE, 2022–2029 (USD MILLION)
  • TABLE 90 UK: PERITONEAL DIALYSIS MARKET, BY MODALITY, 2022–2029 (USD MILLION)
  • TABLE 91 UK: PERITONEAL DIALYSIS MARKET, BY DISEASE INDICATION, 2022–2029 (USD MILLION)
  • TABLE 92 UK: PERITONEAL DIALYSIS MARKET, BY END USER, 2022–2029 (USD MILLION)
  • TABLE 93 FRANCE: MACROECONOMIC INDICATORS
  • TABLE 94 FRANCE: PERITONEAL DIALYSIS MARKET, BY OFFERING, 2022–2029 (USD MILLION)
  • TABLE 95 FRANCE: PERITONEAL DIALYSIS PRODUCTS MARKET, BY TYPE, 2022–2029 (USD MILLION)
  • TABLE 96 FRANCE: PERITONEAL DIALYSIS MARKET, BY MODALITY, 2022–2029 (USD MILLION)
  • TABLE 97 FRANCE: PERITONEAL DIALYSIS MARKET, BY DISEASE INDICATION, 2022–2029 (USD MILLION)
  • TABLE 98 FRANCE: PERITONEAL DIALYSIS MARKET, BY END USER, 2022–2029 (USD MILLION)
  • TABLE 99 ITALY: MACROECONOMIC INDICATORS
  • TABLE 100 ITALY: PERITONEAL DIALYSIS MARKET, BY OFFERING, 2022–2029 (USD MILLION)
  • TABLE 101 ITALY: PERITONEAL DIALYSIS PRODUCTS MARKET, BY TYPE, 2022–2029 (USD MILLION)
  • TABLE 102 ITALY: PERITONEAL DIALYSIS MARKET, BY MODALITY, 2022–2029 (USD MILLION)
  • TABLE 103 ITALY: PERITONEAL DIALYSIS MARKET, BY DISEASE INDICATION, 2022–2029 (USD MILLION)
  • TABLE 104 ITALY: PERITONEAL DIALYSIS MARKET, BY END USER, 2022–2029 (USD MILLION)
  • TABLE 105 SPAIN: MACROECONOMIC INDICATORS
  • TABLE 106 SPAIN: PERITONEAL DIALYSIS MARKET, BY OFFERING, 2022–2029 (USD MILLION)
  • TABLE 107 SPAIN: PERITONEAL DIALYSIS PRODUCTS MARKET, BY TYPE, 2022–2029 (USD MILLION)
  • TABLE 108 SPAIN: PERITONEAL DIALYSIS MARKET, BY MODALITY, 2022–2029 (USD MILLION)
  • TABLE 109 SPAIN: PERITONEAL DIALYSIS MARKET, BY DISEASE INDICATION, 2022–2029 (USD MILLION)
  • TABLE 110 SPAIN: PERITONEAL DIALYSIS MARKET, BY END USER, 2022–2029 (USD MILLION)
  • TABLE 111 REST OF EUROPE: PERITONEAL DIALYSIS MARKET, BY OFFERING, 2022–2029 (USD MILLION)
  • TABLE 112 REST OF EUROPE: PERITONEAL DIALYSIS PRODUCTS MARKET, BY TYPE, 2022–2029 (USD MILLION)
  • TABLE 113 REST OF EUROPE: PERITONEAL DIALYSIS MARKET, BY MODALITY, 2022–2029 (USD MILLION)
  • TABLE 114 REST OF EUROPE: PERITONEAL DIALYSIS MARKET, BY DISEASE INDICATION, 2022–2029 (USD MILLION)
  • TABLE 115 REST OF EUROPE: PERITONEAL DIALYSIS MARKET, BY END USER, 2022–2029 (USD MILLION)
  • TABLE 116 ASIA PACIFIC: PERITONEAL DIALYSIS MARKET, BY COUNTRY, 2022–2029 (USD MILLION)
  • TABLE 117 ASIA PACIFIC: PERITONEAL DIALYSIS MARKET, BY OFFERING, 2022–2029 (USD MILLION)
  • TABLE 118 ASIA PACIFIC: PERITONEAL DIALYSIS PRODUCTS MARKET, BY TYPE, 2022–2029 (USD MILLION)
  • TABLE 119 ASIA PACIFIC: PERITONEAL DIALYSIS MARKET, BY MODALITY, 2022–2029 (USD MILLION)
  • TABLE 120 ASIA PACIFIC: PERITONEAL DIALYSIS MARKET, BY DISEASE INDICATION, 2022–2029 (USD MILLION)
  • TABLE 121 ASIA PACIFIC: PERITONEAL DIALYSIS MARKET, BY END USER, 2022–2029 (USD MILLION)
  • TABLE 122 JAPAN: MACROECONOMIC INDICATORS
  • TABLE 123 JAPAN: PERITONEAL DIALYSIS MARKET, BY OFFERING, 2022–2029 (USD MILLION)
  • TABLE 124 JAPAN: PERITONEAL DIALYSIS PRODUCTS MARKET, BY TYPE, 2022–2029 (USD MILLION)
  • TABLE 125 JAPAN: PERITONEAL DIALYSIS MARKET, BY MODALITY, 2022–2029 (USD MILLION)
  • TABLE 126 JAPAN: PERITONEAL DIALYSIS MARKET, BY DISEASE INDICATION, 2022–2029 (USD MILLION)
  • TABLE 127 JAPAN: PERITONEAL DIALYSIS MARKET, BY END USER, 2022–2029 (USD MILLION)
  • TABLE 128 CHINA: MACROECONOMIC INDICATORS
  • TABLE 129 CHINA: PERITONEAL DIALYSIS MARKET, BY OFFERING, 2022–2029 (USD MILLION)
  • TABLE 130 CHINA: PERITONEAL DIALYSIS PRODUCTS MARKET, BY TYPE, 2022–2029 (USD MILLION)
  • TABLE 131 CHINA: PERITONEAL DIALYSIS MARKET, BY MODALITY, 2022–2029 (USD MILLION)
  • TABLE 132 CHINA: PERITONEAL DIALYSIS MARKET, BY DISEASE INDICATION, 2022–2029 (USD MILLION)
  • TABLE 133 CHINA: PERITONEAL DIALYSIS MARKET, BY END USER, 2022–2029 (USD MILLION)
  • TABLE 134 INDIA: MACROECONOMIC INDICATORS
  • TABLE 135 INDIA: PERITONEAL DIALYSIS MARKET, BY OFFERING, 2022–2029 (USD MILLION)
  • TABLE 136 INDIA: PERITONEAL DIALYSIS PRODUCTS MARKET, BY TYPE, 2022–2029 (USD MILLION)
  • TABLE 137 INDIA: PERITONEAL DIALYSIS MARKET, BY MODALITY, 2022–2029 (USD MILLION)
  • TABLE 138 INDIA: PERITONEAL DIALYSIS MARKET, BY DISEASE INDICATION, 2022–2029 (USD MILLION)
  • TABLE 139 INDIA: PERITONEAL DIALYSIS MARKET, BY END USER, 2022–2029 (USD MILLION)
  • TABLE 140 AUSTRALIA: MACROECONOMIC INDICATORS
  • TABLE 141 AUSTRALIA: PERITONEAL DIALYSIS MARKET, BY OFFERING, 2022–2029 (USD MILLION)
  • TABLE 142 AUSTRALIA: PERITONEAL DIALYSIS PRODUCTS MARKET, BY TYPE, 2022–2029 (USD MILLION)
  • TABLE 143 AUSTRALIA: PERITONEAL DIALYSIS MARKET, BY MODALITY, 2022–2029 (USD MILLION)
  • TABLE 144 AUSTRALIA: PERITONEAL DIALYSIS MARKET, BY DISEASE INDICATION, 2022–2029 (USD MILLION)
  • TABLE 145 AUSTRALIA: PERITONEAL DIALYSIS MARKET, BY END USER, 2022–2029 (USD MILLION)
  • TABLE 146 SOUTH KOREA: MACROECONOMIC INDICATORS
  • TABLE 147 SOUTH KOREA: PERITONEAL DIALYSIS MARKET, BY OFFERING, 2022–2029 (USD MILLION)
  • TABLE 148 SOUTH KOREA: PERITONEAL DIALYSIS PRODUCTS MARKET, BY TYPE, 2022–2029 (USD MILLION)
  • TABLE 149 SOUTH KOREA: PERITONEAL DIALYSIS MARKET, BY MODALITY, 2022–2029 (USD MILLION)
  • TABLE 150 SOUTH KOREA: PERITONEAL DIALYSIS MARKET, BY DISEASE INDICATION, 2022–2029 (USD MILLION)
  • TABLE 151 SOUTH KOREA: PERITONEAL DIALYSIS MARKET, BY END USER, 2022–2029 (USD MILLION)
  • TABLE 152 REST OF ASIA PACIFIC: PERITONEAL DIALYSIS MARKET, BY OFFERING, 2022–2029 (USD MILLION)
  • TABLE 153 REST OF ASIA PACIFIC: PERITONEAL DIALYSIS PRODUCTS MARKET, BY TYPE, 2022–2029 (USD MILLION)
  • TABLE 154 REST OF ASIA PACIFIC: PERITONEAL DIALYSIS MARKET, BY MODALITY, 2022–2029 (USD MILLION)
  • TABLE 155 REST OF ASIA PACIFIC: PERITONEAL DIALYSIS MARKET, BY DISEASE INDICATION, 2022–2029 (USD MILLION)
  • TABLE 156 REST OF ASIA PACIFIC: PERITONEAL DIALYSIS MARKET, BY END USER, 2022–2029 (USD MILLION)
  • TABLE 157 LATIN AMERICA: PERITONEAL DIALYSIS MARKET, BY COUNTRY, 2022–2029 (USD MILLION)
  • TABLE 158 LATIN AMERICA: PERITONEAL DIALYSIS MARKET, BY OFFERING, 2022–2029 (USD MILLION)
  • TABLE 159 LATIN AMERICA: PERITONEAL DIALYSIS PRODUCTS MARKET, BY TYPE, 2022–2029 (USD MILLION)
  • TABLE 160 LATIN AMERICA: PERITONEAL DIALYSIS MARKET, BY MODALITY, 2022–2029 (USD MILLION)
  • TABLE 161 LATIN AMERICA: PERITONEAL DIALYSIS MARKET, BY DISEASE INDICATION, 2022–2029 (USD MILLION)
  • TABLE 162 LATIN AMERICA: PERITONEAL DIALYSIS MARKET, BY END USER, 2022–2029 (USD MILLION)
  • TABLE 163 BRAZIL: MACROECONOMIC INDICATORS
  • TABLE 164 BRAZIL: PERITONEAL DIALYSIS MARKET, BY OFFERING, 2022–2029 (USD MILLION)
  • TABLE 165 BRAZIL: PERITONEAL DIALYSIS PRODUCTS MARKET, BY TYPE, 2022–2029 (USD MILLION)
  • TABLE 166 BRAZIL: PERITONEAL DIALYSIS MARKET, BY MODALITY, 2022–2029 (USD MILLION)
  • TABLE 167 BRAZIL: PERITONEAL DIALYSIS MARKET, BY DISEASE INDICATION, 2022–2029 (USD MILLION)
  • TABLE 168 BRAZIL: PERITONEAL DIALYSIS MARKET, BY END USER, 2022–2029 (USD MILLION)
  • TABLE 169 MEXICO: MACROECONOMIC INDICATORS
  • TABLE 170 MEXICO: PERITONEAL DIALYSIS MARKET, BY OFFERING, 2022–2029 (USD MILLION)
  • TABLE 171 MEXICO: PERITONEAL DIALYSIS PRODUCTS MARKET, BY TYPE, 2022–2029 (USD MILLION)
  • TABLE 172 MEXICO: PERITONEAL DIALYSIS MARKET, BY MODALITY, 2022–2029 (USD MILLION)
  • TABLE 173 MEXICO: PERITONEAL DIALYSIS MARKET, BY DISEASE INDICATION, 2022–2029 (USD MILLION)
  • TABLE 174 MEXICO: PERITONEAL DIALYSIS MARKET, BY END USER, 2022–2029 (USD MILLION)
  • TABLE 175 REST OF LATIN AMERICA: PERITONEAL DIALYSIS MARKET, BY OFFERING, 2022–2029 (USD MILLION)
  • TABLE 176 REST OF LATIN AMERICA: PERITONEAL DIALYSIS PRODUCTS MARKET, BY TYPE, 2022–2029 (USD MILLION)
  • TABLE 177 REST OF LATIN AMERICA: PERITONEAL DIALYSIS MARKET, BY MODALITY, 2022–2029 (USD MILLION)
  • TABLE 178 REST OF LATIN AMERICA: PERITONEAL DIALYSIS MARKET, BY DISEASE INDICATION, 2022–2029 (USD MILLION)
  • TABLE 179 REST OF LATIN AMERICA: PERITONEAL DIALYSIS MARKET, BY END USER, 2022–2029 (USD MILLION)
  • TABLE 180 MIDDLE EAST & AFRICA: PERITONEAL DIALYSIS MARKET, BY OFFERING, 2022–2029 (USD MILLION)
  • TABLE 181 MIDDLE EAST & AFRICA: PERITONEAL DIALYSIS PRODUCTS MARKET, BY TYPE, 2022–2029 (USD MILLION)
  • TABLE 182 MIDDLE EAST & AFRICA: PERITONEAL DIALYSIS MARKET, BY MODALITY, 2022–2029 (USD MILLION)
  • TABLE 183 MIDDLE EAST & AFRICA: PERITONEAL DIALYSIS MARKET, BY DISEASE INDICATION, 2022–2029 (USD MILLION)
  • TABLE 184 MIDDLE EAST & AFRICA: PERITONEAL DIALYSIS MARKET, BY END USER, 2022–2029 (USD MILLION)
  • TABLE 185 GCC COUNTRIES: PERITONEAL DIALYSIS MARKET, BY OFFERING, 2022–2029 (USD MILLION)
  • TABLE 186 GCC COUNTRIES: PERITONEAL DIALYSIS PRODUCTS MARKET, BY TYPE, 2022–2029 (USD MILLION)
  • TABLE 187 GCC COUNTRIES: PERITONEAL DIALYSIS MARKET, BY MODALITY, 2022–2029 (USD MILLION)
  • TABLE 188 GCC COUNTRIES: PERITONEAL DIALYSIS MARKET, BY DISEASE INDICATION, 2022–2029 (USD MILLION)
  • TABLE 189 GCC COUNTRIES: PERITONEAL DIALYSIS MARKET, BY END USER, 2022–2029 (USD MILLION)
  • TABLE 190 PERITONEAL DIALYSIS MARKET: DEGREE OF COMPETITION
  • TABLE 191 PERITONEAL DIALYSIS MARKET: OFFERING FOOTPRINT
  • TABLE 192 PERITONEAL DIALYSIS MARKET: MODALITY FOOTPRINT
  • TABLE 193 PERITONEAL DIALYSIS MARKET: DISEASE INDICATION FOOTPRINT
  • TABLE 194 PERITONEAL DIALYSIS MARKET: END-USER FOOTPRINT
  • TABLE 195 PERITONEAL DIALYSIS MARKET: REGION FOOTPRINT
  • TABLE 196 PERITONEAL DIALYSIS MARKET: DETAILED LIST OF KEY START-UP/SME PLAYERS
  • TABLE 197 PERITONEAL DIALYSIS MARKET: COMPETITIVE BENCHMARKING OF KEY START-UP/SME PLAYERS REGION FOOTPRINT
  • TABLE 198 PERITONEAL DIALYSIS MARKET: PRODUCT APPROVALS (JANUARY 2021- SEPTEMBER 2024)
  • TABLE 199 PERITONEAL DIALYSIS MARKET: DEALS, JANUARY 2020–SEPTEMBER 2024
  • TABLE 200 PERITONEAL DIALYSIS MARKET: EXPANSIONS, JANUARY 2020–SEPTEMBER 2024
  • TABLE 201 FRESENIUS MEDICAL CARE AG: COMPANY OVERVIEW
  • TABLE 202 FRESENIUS MEDICAL CARE AG: PRODUCTS & SERVICES OFFERED
  • TABLE 203 FRESENIUS MEDICAL CARE AG: DEALS, JANUARY 2021–SEPTEMBER 2024
  • TABLE 204 BAXTER INTERNATIONAL INC.: COMPANY OVERVIEW
  • TABLE 205 BAXTER INTERNATIONAL INC.: PRODUCTS & SERVICES OFFERED
  • TABLE 206 BAXTER INTERNATIONAL INC.: DEALS, JANUARY 2021–SEPTEMBER 2024
  • TABLE 207 MEDTRONIC PLC: COMPANY OVERVIEW
  • TABLE 208 MEDTRONIC PLC: PRODUCTS & SERVICES OFFERED
  • TABLE 209 MEDTRONIC PLC: DEALS, JANUARY 2021–SEPTEMBER 2024
  • TABLE 210 DAVITA INC.: COMPANY OVERVIEW
  • TABLE 211 DAVITA INC.: PRODUCTS & SERVICES OFFERED
  • TABLE 212 DAVITA INC.: DEALS, JANUARY 2021–SEPTEMBER 2024
  • TABLE 213 DAVITA INC.: EXPANSIONS, JANUARY 2021–SEPTEMBER 2024
  • TABLE 214 BECTON, DICKINSON AND COMPANY: COMPANY OVERVIEW
  • TABLE 215 BECTON, DICKINSON AND COMPANY: PRODUCTS & SERVICES OFFERED
  • TABLE 216 BECTON, DICKINSON AND COMPANY: EXPANSIONS, JANUARY 2021–SEPTEMBER 2024
  • TABLE 217 TERUMO CORPORATION: COMPANY OVERVIEW
  • TABLE 218 TERUMO CORPORATION: PRODUCTS & SERVICES OFFERED
  • TABLE 219 TERUMO CORPORATION: PRODUCT APPROVALS, JANUARY 2021–SEPTEMBER 2024
  • TABLE 220 TERUMO CORPORATION: DEALS, JANUARY 2021–SEPTEMBER 2024
  • TABLE 221 TERUMO CORPORATION: EXPANSIONS, JANUARY 2021–SEPTEMBER 2024
  • TABLE 222 UTAH MEDICAL PRODUCTS, INC.: BUSINESS OVERVIEW
  • TABLE 223 UTAH MEDICAL PRODUCTS, INC.: PRODUCTS & SERVICES OFFERED
  • TABLE 224 DIAVERUM AB: COMPANY OVERVIEW
  • TABLE 225 DIAVERUM AB: PRODUCTS & SERVICES OFFERED
  • TABLE 226 MEDIONICS: BUSINESS OVERVIEW
  • TABLE 227 MEDIONICS: PRODUCTS & SERVICES OFFERED
  • TABLE 228 NEWSOL TECHNOLOGIES INC.: COMPANY OVERVIEW
  • TABLE 229 NEWSOL TECHNOLOGIES INC.: PRODUCTS & SERVICES OFFERED
  • TABLE 230 APOLLO DIALYSIS PVT. LTD.: BUSINESS OVERVIEW
  • TABLE 231 APOLLO DIALYSIS PVT. LTD.: PRODUCTS & SERVICES OFFERED
  • TABLE 232 U.S. RENAL CARE, INC.: BUSINESS OVERVIEW
  • TABLE 233 U.S. RENAL CARE, INC.: PRODUCTS & SERVICES OFFERED
  • TABLE 234 NORTHWEST KIDNEY CENTERS: COMPANY OVERVIEW
  • TABLE 235 NORTHWEST KIDNEY CENTERS: PRODUCTS & SERVICES OFFERED
  • TABLE 236 NORTHWEST KIDNEY CENTERS: DEALS, JANUARY 2021–SEPTEMBER 2024
  • TABLE 237 NORTHWEST KIDNEY CENTERS: EXPANSIONS, JANUARY 2021–SEPTEMBER 2024
  • TABLE 238 RELAVO: COMPANY OVERVIEW
  • TABLE 239 RELAVO: PRODUCTS & SERVICES OFFERED
  • TABLE 240 MITRA INDUSTRIES PVT. LTD.: BUSINESS OVERVIEW
  • TABLE 241 MITRA INDUSTRIES PVT. LTD.: PRODUCTS & SERVICES OFFERED
LIST OF FIGURES
 
  • FIGURE 1 PERITONEAL DIALYSIS MARKET: SEGMENTS COVERED
  • FIGURE 2 RESEARCH DESIGN: PERITONEAL DIALYSIS MARKET
  • FIGURE 3 INDICATIVE LIST OF SECONDARY SOURCES
  • FIGURE 4 LIST OF KEY PRIMARY SOURCES
  • FIGURE 5 KEY INDUSTRY INSIGHTS
  • FIGURE 6 BREAKDOWN OF PRIMARY INTERVIEWS: SUPPLY-SIDE AND DEMAND-SIDE PARTICIPANTS
  • FIGURE 7 BREAKDOWN OF PRIMARY INTERVIEWS: BY COMPANY TYPE, DESIGNATION, AND REGION
  • FIGURE 8 MARKET SIZE ESTIMATION: REVENUE SHARE ANALYSIS
  • FIGURE 9 REVENUE SHARE ANALYSIS ILLUSTRATION
  • FIGURE 10 SUPPLY-SIDE MARKET SIZE ESTIMATION: PERITONEAL DIALYSIS MARKET (2023)
  • FIGURE 11 ESTIMATION OF PERITONEAL DIALYSIS PROCEDURES, BY COUNTRY/REGION
  • FIGURE 12 MARKET SIZE ESTIMATION: PERITONEAL DIALYSIS MARKET, BY PRODUCT UTILIZATION METHODOLOGY
  • FIGURE 13 MARKET SIZE ESTIMATION: PERITONEAL DIALYSIS SERVICES MARKET, BY REVENUE MAPPING METHODOLOGY
  • FIGURE 14 PERITONEAL DIALYSIS: AVERAGE VOLUME EXCHANGE ESTIMATION MODEL
  • FIGURE 15 CAGR PROJECTIONS FROM ANALYSIS OF DRIVERS, RESTRAINTS, OPPORTUNITIES, AND CHALLENGES (2024–2029)
  • FIGURE 16 CAGR PROJECTIONS: SUPPLY-SIDE ANALYSIS
  • FIGURE 17 DATA TRIANGULATION METHODOLOGY
  • FIGURE 18 PERITONEAL DIALYSIS MARKET, BY OFFERING, 2024 VS. 2029 (USD MILLION)
  • FIGURE 19 PERITONEAL DIALYSIS PRODUCTS MARKET, BY TYPE, 2024 VS. 2029 (USD MILLION)
  • FIGURE 20 PERITONEAL DIALYSIS MARKET, BY MODALITY, 2024 VS. 2029 (USD MILLION)
  • FIGURE 21 PERITONEAL DIALYSIS MARKET, BY DISEASE INDICATION, 2024 VS. 2029 (USD MILLION)
  • FIGURE 22 PERITONEAL DIALYSIS MARKET, BY END USER, 2024 VS. 2029 (USD MILLION)
  • FIGURE 23 GEOGRAPHIC SNAPSHOT: PERITONEAL DIALYSIS MARKET
  • FIGURE 24 INCREASING PREVALENCE OF ESRD TO DRIVE MARKET GROWTH
  • FIGURE 25 JAPAN ACCOUNTED FOR LARGEST SHARE OF ASIA PACIFIC MARKET IN 2023
  • FIGURE 26 INDIA TO REGISTER HIGHEST GROWTH RATE DURING FORECAST PERIOD
  • FIGURE 27 NORTH AMERICA TO CONTINUE TO DOMINATE PERITONEAL DIALYSIS MARKET DURING FORECAST PERIOD
  • FIGURE 28 DEVELOPING ECONOMIES TO REGISTER HIGHER GROWTH DURING FORECAST PERIOD
  • FIGURE 29 PERITONEAL DIALYSIS MARKET: DRIVERS, RESTRAINTS, OPPORTUNITIES, AND CHALLENGES
  • FIGURE 30 CANADA: NUMBER OF END-STAGE RENAL DISEASE PATIENTS, BY AGE GROUP (2022)
  • FIGURE 31 US: REPORTED CAUSES OF END-STAGE RENAL DISEASES, 2023
  • FIGURE 32 INCIDENCE OF TREATED END-STAGE RENAL DISEASE, 2021
  • FIGURE 33 SHORTAGES OF NEPHROLOGISTS IN LOW-INCOME AND LOWER-MIDDLE-INCOME COUNTRIES (LLMICS)
  • FIGURE 34 PERITONEAL DIALYSIS MARKET: SUPPLY CHAIN ANALYSIS
  • FIGURE 35 PERITONEAL DIALYSIS MARKET: VALUE CHAIN ANALYSIS
  • FIGURE 36 PERITONEAL DIALYSIS MARKET: PORTER’S FIVE FORCES ANALYSIS
  • FIGURE 37 PATENT PUBLICATION TRENDS (2014–2024)
  • FIGURE 38 TOP APPLICANTS AND OWNERS (COMPANIES/INSTITUTIONS) FOR PERITONEAL DIALYSIS PATENTS (JANUARY 2014–SEPTEMBER 2024)
  • FIGURE 39 INFLUENCE OF STAKEHOLDERS ON BUYING PROCESS FOR PERITONEAL DIALYSIS PRODUCTS
  • FIGURE 40 KEY BUYING CRITERIA FOR PERITONEAL DIALYSIS PRODUCTS
  • FIGURE 41 HEMODIALYSIS AND PERITONEAL DIALYSIS MARKET OVERVIEW
  • FIGURE 42 CONTINUOUS RENAL REPLACEMENT THERAPY MARKET OVERVIEW
  • FIGURE 43 KEY FEATURES OF GENERATIVE AI IN PERITONEAL DIALYSIS MARKET
  • FIGURE 44 PERITONEAL DIALYSIS MARKET: TRENDS/DISRUPTIONS AFFECTING CUSTOMERS’ BUSINESSES
  • FIGURE 45 NUMBER OF DEALS & FUNDING ACTIVITY IN PERITONEAL DIALYSIS MARKET, 2019–2023 (USD MILLION)
  • FIGURE 46 NUMBER OF INVESTOR DEALS, BY KEY PLAYER, 2019–2023
  • FIGURE 47 VALUE OF INVESTOR DEALS, BY KEY PLAYER, 2019–2023 (USD MILLION)
  • FIGURE 48 NORTH AMERICA: PERITONEAL DIALYSIS MARKET SNAPSHOT
  • FIGURE 49 ASIA PACIFIC: PERITONEAL DIALYSIS MARKET SNAPSHOT
  • FIGURE 50 OVERVIEW OF STRATEGIES DEPLOYED BY KEY PRODUCT & SERVICE COMPANIES
  • FIGURE 51 REVENUE ANALYSIS OF TOP THREE PLAYERS IN PERITONEAL DIALYSIS MARKET (2019–2023)
  • FIGURE 52 MARKET SHARE ANALYSIS OF KEY PLAYERS IN PERITONEAL DIALYSIS MARKET (2023)
  • FIGURE 53 PERITONEAL DIALYSIS MARKET: COMPANY EVALUATION MATRIX (KEY PLAYERS), 2023
  • FIGURE 54 PERITONEAL DIALYSIS MARKET: COMPANY FOOTPRINT
  • FIGURE 55 PERITONEAL DIALYSIS MARKET: COMPANY EVALUATION MATRIX (START-UPS/SMES), 2023
  • FIGURE 56 EV/EBITDA OF KEY VENDORS
  • FIGURE 57 YEAR-TO-DATE (YTD) PRICE TOTAL RETURN AND 5-YEAR STOCK BETA OF KEY VENDORS
  • FIGURE 58 BRAND/PRODUCT COMPARATIVE ANALYSIS
  • FIGURE 59 R&D EXPENDITURE OF KEY PLAYERS (2022 VS. 2023)
  • FIGURE 60 FRESENIUS MEDICAL CARE AG: COMPANY SNAPSHOT (2023)
  • FIGURE 61 BAXTER INTERNATIONAL INC.: COMPANY SNAPSHOT (2023)
  • FIGURE 62 MEDTRONIC PLC: COMPANY SNAPSHOT (2023)
  • FIGURE 63 DAVITA INC.: COMPANY SNAPSHOT (2023)
  • FIGURE 64 BECTON, DICKINSON AND COMPANY: COMPANY SNAPSHOT (2023)
  • FIGURE 65 TERUMO CORPORATION: COMPANY SNAPSHOT (2023)
  • FIGURE 66 UTAH MEDICAL PRODUCTS, INC.: COMPANY SNAPSHOT (2023)

This research study involved the extensive use of both primary and secondary sources. It involved the study of various factors affecting the industry to identify the segmentation types, industry trends, key players, the competitive landscape of market players, and key market dynamics such as drivers, opportunities, challenges, restraints, and key player strategies.

Secondary Research

This research study involved the wide use of secondary sources, directories, databases such as Dun & Bradstreet, Bloomberg Businessweek, and Factiva, white papers, and companies’ house documents. Secondary research was undertaken to identify and collect information for this extensive, technical, market-oriented, and commercial study of the peritoneal dialysismarket. It was also used to obtain important information about the top players, market classification, and segmentation according to industry trends to the bottom-most level, geographic markets, and key developments related to the market. A database of the key industry leaders was also prepared using secondary research.

Primary Research

In the primary research process, various supply side and demand side sources were interviewed to obtain qualitative and quantitative information for this report. Primary sources from the supply side included industry experts such as CEOs, vice presidents, marketing and sales directors, technology & innovation directors, engineers, and related key executives from various companies and organizations operating in the peritoneal dialysis market. Primary sources from the demand side included hospitals, clinics, researchers, lab technicians, purchase managers etc, and stakeholders in corporate & government bodies.

A breakdown of the primary respondents for peritoneal dialysis market (supply side) market is provided below:

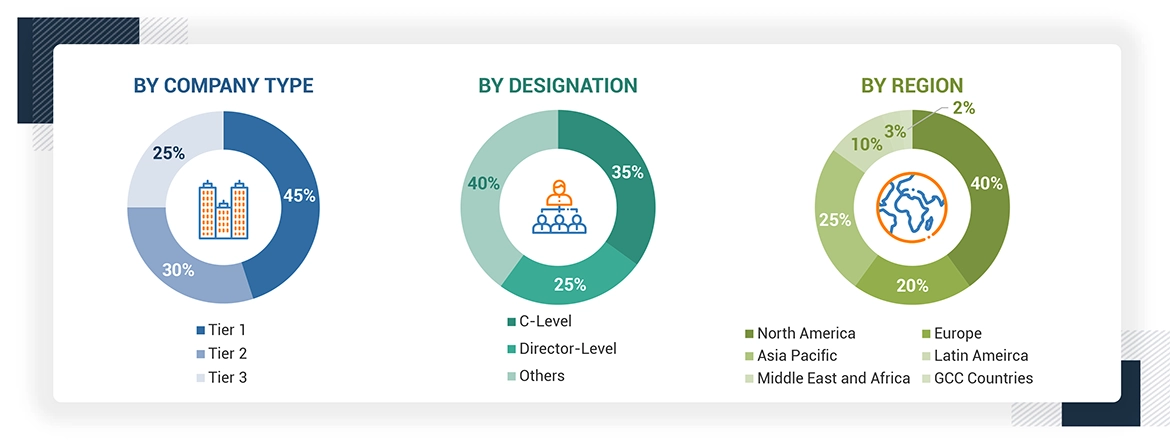
Note 1: Companies are classified into tiers based on their total revenue. As of 2023: Tier 1 = >USD 1 billion, Tier 2 = USD 500 million to USD 1 billion, and Tier 3 = < USD 500 million.

Note 2: C-level executives include CEOs, COOs, CTOs, and VPs.

Note 3: Other primaries include sales managers, marketing managers, and product managers.

To know about the assumptions considered for the study, download the pdf brochure

Market Size Estimation

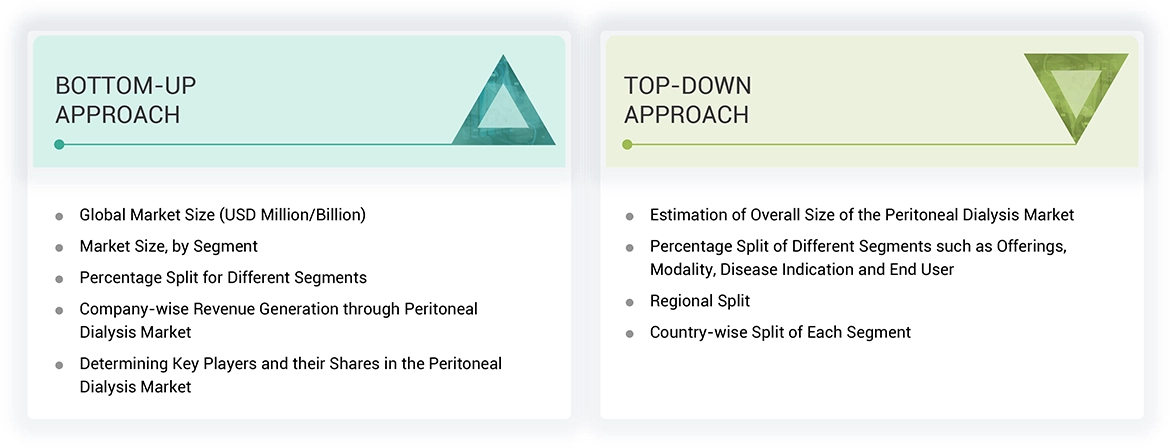
The market size for peritoneal dialysis market was calculated using data from four different sources, as will be discussed below. Each technique concluded and a weighted average of the four ways was calculated based on the number of assumptions each approach made. The market size for peritoneal dialysis market was calculated using data from three distinct sources, as will be discussed below:

Data Triangulation

The entire market was split up into four segments when the market size was determined. Data triangulation and market breakdown processes were used where necessary to complete the entire market engineering process and arrive at the precise statistics for all segments.

Approach to derive the market size and estimate market growth.

Using secondary data from both paid and unpaid sources, the market rankings for the major players were determined following a thorough analysis of their sales of peritoneal dialysis products and services. Due to data restrictions, the revenue share in certain cases was determined after a thorough analysis of the product portfolio of big corporations and their individual sales performance. This information was verified at each stage by in-depth interviews with professionals in the field.

Market Definition

Dialysis is the process through which the body eliminates wastes and extra fluids. In this case, the kidneys do not filter blood efficiently. There are two major forms of dialysis, which include hemodialysis and peritoneal dialysis. In hemodialysis, a dialyzer is used with a machine to provide assistance in removing waste and fluid from the blood alongside electrolytes. Peritoneal dialysis takes the process of cleansing blood from a patient's body into the patient's body; it does not require machines outside the body. The method requires instillation of a special solution within the abdominal cavity for absorption of wastes and excess fluids by the peritoneum membrane. It is, therefore, offered as a home alternative of hemodialysis to the patient, and one would be able to control the treatment course at a more comfortable and convenient place.

Stakeholders

  • Peritoneal dialysis product manufacturers
  • Distributors, channel partners, and third-party suppliers
  • Peritoneal dialysis service providers
  • Dialysis research laboratories
  • Dialysis associations and organizations
  • Healthcare service providers (including hospitals and dialysis centers)
  • Dialysis nurses and nephrologists
  • Academic medical centers and universities
  • Business research and consulting service providers
  • Venture capitalists and other government funding organizations

Report Objectives

  • To define, describe, and forecast the peritoneal dialysis market based on by offering, modality, disease indication, end user and region
  • To provide detailed information about the major factors influencing the market growth (such as drivers, restraints, challenges, and opportunities)
  • To strategically analyze micromarkets1 with respect to individual growth trends, prospects, and contributions to the overall peritoneal dialysis market
  • To analyze market opportunities for stakeholders and provide details of the competitive landscape for key players
  • To forecast the size of the peritoneal dialysis market in North America, Europe, the Asia Pacific, Latin America, Middle East & Africa and GCC Countries
  • To profile the key players and comprehensively analyze their market shares and core competencies in the peritoneal dialysis market
  • To track and analyze competitive developments such as partnerships, expansions, acquisitions, collaborations, product launches, agreements, and other developments in the peritoneal dialysis market
  • To benchmark players within the peritoneal dialysis market using the Company Evaluation Quadrant framework, which analyzes market players on various parameters within the broad categories of business strategy, market share, and product offerings


Previous Versions of this Report

Custom Market Research Services

We Will Customise The Research For You, In Case The Report Listed Above Does Not Meet With Your Requirements

Get 10% Free Customisation

Growth opportunities and latent adjacency in Peritoneal Dialysis Market

DMCA.com Protection Status