Payment Gateway Market

Payment Gateway Market by Offering (Hosted, Self-Hosted, API-Hosted, Local Bank Integration), Verticals (Retail & E-commerce, BFSI, Travel & Hospitality, IT & ITeS, Telecom, Healthcare, Media & Entertainment, Education) - Global Forecast to 2029

Report Code: TC 8989 Apr, 2024, by marketsandmarkets.com

The global payment gateway market size reached USD 26.7 Billion in 2024. Looking forward, expects the industry to reach US$ 48.4 Billion by 2029, exhibiting a growth rate (CAGR) of 12.6% during 2024-2029. The explosion of e-commerce platforms and the growing comfort level of consumers with online shopping has fundamentally changed the way we pay.  This shift has created a surging demand for secure and efficient payment processing solutions. Payment gateways have become the crucial bridge between online stores and customers, ensuring a seamless and secure checkout experience. They act as trusted intermediaries, encrypting sensitive financial information and facilitating transactions between banks and merchants. By offering a variety of payment methods, from traditional credit cards to digital wallets and even alternative payment options, payment gateways cater to diverse customer preferences. This not only simplifies the checkout process for consumers but also boosts conversion rates for businesses. In essence, secure and efficient payment gateways are the invisible backbone of a thriving online shopping experience, fostering trust and confidence in the digital marketplace.

Payment Gateway Market

To know about the assumptions considered for the study, Request for Free Sample Report

Payment Gateway Market Opportunities

To know about the assumptions considered for the study, download the pdf brochure

Payment Gateway Market Trends

Driver:  Rapid Growth in eCommerce

The flourishing e-commerce sector stands as a cornerstone driver propelling the growth of the payment gateway market. This surge is intricately tied to the continuous expansion of online shopping, spurred by a confluence of factors including pervasive convenience, an expansive array of product offerings, and the dynamic shifts in consumer habits. In an era where businesses are progressively transitioning towards digital storefronts to meet the evolving needs of consumers, the demand for secure, reliable, and efficient payment processing solutions has surged exponentially. Payment gateways, in this context, assume a pivotal role by serving as the linchpin for seamless transactions in the digital realm. Beyond their fundamental function of facilitating payments, these gateways contribute significantly to bolstering consumer confidence in the safety and reliability of online transactions. As the e-commerce ecosystem becomes increasingly integral to the global economy, payment gateways emerge as indispensable facilitators, supporting the overall momentum of this digital marketplace and playing a crucial role in shaping the future of commerce. The surge in virtual sales models, embraced by over 90% of B2B companies since 2020 as per the International Trade Association, is fueling the expansion of the payment gateway market. This growth is attributed to enhanced process efficiencies and the adoption of advanced management software.

Restraint: Dependency on banking Infrastructure

The reliance on traditional banking infrastructure represents a constraint for payment gateway providers, especially in regions where banking systems may lag in terms of technological advancement. This dependency poses challenges related to transaction speed, efficiency, and accessibility. To overcome this limitation, strategic partnerships with innovative financial institutions and collaborations within the fintech ecosystem become crucial. Additionally, technological innovations, such as the integration of blockchain or the development of alternative payment channels, can provide avenues to mitigate the constraints imposed by traditional banking systems. By exploring these avenues, payment gateway providers can enhance their agility and responsiveness to the diverse needs of global consumers, irrespective of the maturity of the local banking infrastructure. Strategic initiatives and technological advancements become essential components of overcoming dependencies on traditional banking structures, ensuring that payment gateways remain resilient and adaptable in the face of evolving financial landscapes.

Opportunity: Blockchain and cryptocurrency Integration

The integration of blockchain technology and the embrace of cryptocurrencies represent a transformative opportunity for payment gateways to redefine the landscape of digital transactions. Blockchain, with its decentralized and transparent nature, offers the potential for faster and more secure transactions, reducing the reliance on traditional banking systems. Cryptocurrencies, such as Bitcoin and Ethereum, provide an alternative form of payment, enabling greater financial inclusivity and borderless transactions. Payment gateways that strategically incorporate blockchain and cryptocurrency support into their services position themselves at the forefront of innovation, catering to a growing segment of users seeking the advantages of decentralized and digital currencies. As the blockchain ecosystem continues to evolve, payment gateways embracing these technologies are poised to offer users enhanced security, reduced transaction costs, and increased efficiency.

Challenge : Customer trust and data privacy

The bedrock of the payment gateway industry lies in the establishment and preservation of customer trust, underpinned by robust data privacy measures. Building and maintaining this trust represents an ongoing challenge for payment gateway providers, given the sensitive nature of the financial information they handle. A single breach or compromise can have severe repercussions, not only in terms of financial losses but also in damaging the reputation and credibility of the payment gateway provider. Therefore, providers must continually invest in cutting-edge security technologies, adhere to stringent regulatory standards, and communicate transparently with their users regarding data protection measures. By prioritizing and demonstrating a steadfast commitment to data privacy and security, payment gateway providers can instill confidence in their users, fostering long-term relationships built on trust and reliability.

Ecosystem Of Payment Gateway Market

Top Companies in Payment Gateway Market

The prominent players in the payment gateway market include Amazon (US), Paypal (US) and Fiserv (US) and so on.  These companies have been operating in the market for several years and possess a diversified product portfolio and state-of-the-art technologies with a well-established geographic footprint.

"By type, hosted segment to hold the largest market size during the forecast period.”

Hosted payment solutions offer businesses a scalable infrastructure that can seamlessly accommodate growth and handle increasing transaction volumes without necessitating significant technical adjustments on the merchant's side. By opting for hosted solutions, businesses can offload the burden of managing and scaling payment processing infrastructure to experienced third-party providers. These providers leverage robust and redundant systems capable of efficiently handling surges in transaction volumes, ensuring uninterrupted service even during peak periods of activity. Additionally, hosted solutions typically offer flexible pricing models that allow businesses to pay for the resources they use, enabling cost-effective scalability without the need for large upfront investments in hardware or software. Moreover, hosted payment providers often offer additional features and services such as fraud detection, analytics, and customer support, further enhancing the value proposition for merchants. Overall, hosted solutions empower businesses to focus on core operations and growth initiatives while entrusting the scalability and reliability of their payment processing to expert providers, ensuring seamless and efficient transactions as their business expands.

“Media & Entertainment segment is expected to have the fastest growth rate during the forecast period.”

In the Media & Entertainment industry, the expansion of digital content delivery and subscription-based models has led to a growing need for payment gateways that can seamlessly manage subscriptions across different regions with varying payment methods. As M&E companies target global audiences, they must accommodate diverse payment preferences and currencies to maximize subscriber acquisition and retention. Payment gateways driving the growth of the M&E sector offer robust capabilities to handle recurring payments from international cards as well as local payment options seamlessly. By supporting a wide range of payment methods, including credit/debit cards, digital wallets, and alternative payment options, these gateways enable M&E companies to offer flexible subscription plans tailored to the preferences of their global audience. Moreover, advanced features such as dynamic currency conversion and automatic payment retries enhance the user experience by reducing friction and increasing transaction success rates. As the demand for digital content continues to soar worldwide, payment gateways that prioritize flexibility and seamless subscription management across diverse markets play a critical role in driving the growth and success of the Media & Entertainment industry.

“Asia Pacific to have the largest market size during the forecast period.”

In the Asia Pacific region, the rise of ride-hailing services, food delivery apps, and other on-demand services has created a pressing need for real-time payment processing solutions that seamlessly integrate with these platforms within payment gateways. As consumers increasingly rely on these services for their daily needs, the demand for efficient and secure payment processing has surged. Payment gateways that offer real-time transaction capabilities and seamless integration with ride-hailing and food delivery platforms enable businesses in the Asia Pacific region to provide a frictionless payment experience to their customers. By facilitating instant payment authorization and settlement, these gateways ensure smooth and timely transactions between service providers and consumers, enhancing customer satisfaction and loyalty. Moreover, integration with on-demand service platforms allows payment gateways to capture a larger share of the rapidly growing market for digital services in the Asia Pacific region, driving innovation and fostering further growth in the payment industry. As the adoption of on-demand services continues to expand across Asia Pacific, payment gateways that prioritize real-time payment processing and seamless integration with these platforms are poised to play a crucial role in shaping the future of digital commerce in the region.

North American Payment Gateway Market Size, and Share

Market Players:

The major players in the payment gateway market are Paypal (US), Amazon (US), Visa (US), Mastercard (US), Stripe (Ireland), Fiserv (US), and other players. These players have adopted various growth strategies, such as partnerships, agreements and collaborations, new product launches and enhancements, and acquisitions to expand their payment gateway market footprint.

Want to explore hidden markets that can drive new revenue in Payment Gateway Market?

Scope of the Report

Report Metrics

Details

Market size available for years

2018-2029

Base year considered

2023

Forecast period

2024–2029

Forecast units

Value (USD Billion)

Segments Covered

By type ( hosted, self-hosted, other types)
vertical (BFSI, retail & ecommerce, telecom, healthcare, media and entertainment, travel and hospitality, it & ites, other verticals)

Region covered

North America, Europe, Asia Pacific, Middle East & Africa, and Latin America.

Top Companies in Payment Gateway 

JP Morgan (US), Paypal (US), Amazon (US), Visa (US), Mastercard (US), PhonPe (India), Razorpay (India), Alibaba (China), Stripe (Ireland), Adyen (Netherlands), Block, Inc (US), FIS (US),  Global Payments (US), Apple (US), Fiserv (US), Verifone (US), Paysafe (UK), Fidelity payments (US), Easebuzz (India), Bluesnap (US), Windcave (US), Helcim (US), Instamojo (India), Infibeam Avenue (US), NOWPayments (Netherlands), CoinGate (Lithuania), Ippopay (India), PayJunction (US), Lyra Network (US)

This research report categorizes the payment gateway market to forecast revenues and analyze trends in each of the following submarkets:

Based on offering:
  • Hosted
  • Self-hosted type
  • Other types
By Vertical:
  • BFSI
  • Retail & eCommerce
  • Telecom
  • Healthcare
  • Media and Entertainment
  • Travel and Hospitality
  • IT & ITeS
  • Other Verticals
By Region:
  • North America
    • United States (US)
    • Canada
  • Europe
    • United Kingdom (UK)
    • Germany
    • France
    • Italy
    • Spain
    • Rest of Europe
  • Asia Pacific
    • China
    • Japan
    • India
    • Australia & New Zealand
    • Rest of Asia Pacific
  • Middle East & Africa
    • GCC Countries
      • Kingdom of Saudi Arabia (KSA)
      • United Arab Emirates (UAE)
      • Rest of GCC Countries
    • South Africa
    • Rest of the Middle East & Africa
  • Latin America
    • Brazil
    • Mexico
    • Rest of Latin America

Recent Developments

  • In February 2024, Adyen and Billie partnered up to bring Buy Now, Pay Later to businesses across Europe. Billie’s solution is seamlessly integrated with Adyen and can be activated by shops with just a few clicks.
  • In May 2023, Stripe partnered with Airbnb to power bank payments for Airbnb guests using bank accounts.
  • In May 2022, MasterCard partnered with CRED to enable Mastercard credit cardholders to make simple, secure, and high-value transactions using the CRED app on any mobile device.
  • In October 2021,  PayPal acquired Paidy, a leading two-sided payments platform and provider of buy now, pay later solutions in Japan. This acquisition would expand PayPal’s capabilities, distribution, and relevance in the domestic payments market in Japan.

Frequently Asked Questions (FAQ):

To speak to our analyst for a discussion on the above findings, click Speak to Analyst

Exclusive indicates content/data unique to MarketsandMarkets and not available with any competitors.

INTRODUCTION
22
RESEARCH METHODOLOGY
26
EXECUTIVE SUMMARY
35
PREMIUM INSIGHTS
38
MARKET OVERVIEW AND INDUSTRY TRENDS
41
  • 5.1 INTRODUCTION
  • 5.2 MARKET DYNAMICS
    DRIVERS
    - Rapid Growth in E-commerce
    - Mobile Payment Adoption
    - Globalization of Business Transactions
    RESTRAINTS
    - Regulatory Compliance
    - Dependency on Banking Infrastructure
    OPPORTUNITIES
    - Blockchain and Cryptocurrency Integration
    - Value-added Services
    CHALLENGES
    - Customer Trust and Data Privacy
    - Changing Consumer Behavior
  • 5.3 BRIEF HISTORY OF PAYMENT GATEWAY TECHNOLOGY
    1960–1990
    1990–2000
    2000–2010
    2010–2020
    202O–PRESENT
  • 5.4 ECOSYSTEM/MARKET MAP
  • 5.5 PAYMENT GATEWAY INVESTMENT LANDSCAPE
  • 5.6 CASE STUDY ANALYSIS
    CASE STUDY 1: RAZORPAY OPTIMIZER HELPED CRAFT FABINDIA’S PAYMENTS SUCCESS STORY
    CASE STUDY 2: SRI BALAJI UNIVERSITY REDUCED 90% OF RECONCILIATION EFFORTS USING FEESBUZZ AND FORMS
    CASE STUDY 3: PAN HOME COLLABORATED WITH AMAZON PAYMENT SERVICES TO TRANSFORM CUSTOMER EXPERIENCE
    CASE STUDY 4: COINGATE EMPOWERED BACLOUD WITH CRYPTOCURRENCY PAYMENT SOLUTIONS
    CASE STUDY 5: STRIPE HELPED INCREASE TWILIO'S 10% AUTHORIZATION RATE
    CASE STUDY 6: NAMELY STREAMLINED PAYMENTS AND BOOSTED EFFICIENCY WITH BLUESNAP INTEGRATION
  • 5.7 VALUE CHAIN ANALYSIS
    REGULATORY BODIES, GOVERNMENT AGENCIES, AND OTHER ORGANIZATIONS
  • 5.8 NORTH AMERICA
    US
    CANADA
  • 5.9 EUROPE
    GERMANY
    UK
  • 5.10 ASIA PACIFIC
    CHINA
    INDIA
    JAPAN
  • 5.11 REST OF THE WORLD
    QATAR
    MEXICO
  • 5.12 PATENT ANALYSIS
    LIST OF MAJOR PATENTS
  • 5.13 PRICING ANALYSIS
    AVERAGE SELLING PRICE TREND OF KEY PLAYERS, BY BILLING CYCLE
    INDICATIVE PRICING ANALYSIS OF KEY PLAYERS, BY FEATURE
  • 5.14 PORTER’S FIVE FORCES ANALYSIS
    THREAT OF NEW ENTRANTS
    THREAT OF SUBSTITUTES
    BARGAINING POWER OF BUYERS
    BARGAINING POWER OF SUPPLIERS
    INTENSITY OF COMPETITIVE RIVALRY
  • 5.15 TRENDS AND DISRUPTIONS IMPACTING CUSTOMERS’ BUSINESSES
  • 5.16 KEY STAKEHOLDERS & BUYING CRITERIA
    KEY STAKEHOLDERS IN BUYING PROCESS
    BUYING CRITERIA
  • 5.17 KEY CONFERENCES & EVENTS IN 2024
  • 5.18 TECHNOLOGY ANALYSIS
    KEY TECHNOLOGIES
    - Encryption and Tokenization
    - Artificial Intelligence
    - Contactless Payments
    ADJACENT TECHNOLOGIES
    - Biometric Authentication
    - IoT
    - Blockchain
    COMPLEMENTARY TECHNOLOGIES
    - 5G Technology
    - Voice Recognition Technology
  • 5.19 BEST PRACTICES IN PAYMENT GATEWAY MARKET
    SECURITY COMPLIANCE
    FRAUD PREVENTION
    RELIABILITY AND UPTIME
    USER-FRIENDLY INTERFACE
    FAST TRANSACTION PROCESSING
    SCALABILITY
    TRANSPARENT PRICING
    GLOBAL PAYMENT SUPPORT
    ROBUST API DOCUMENTATION
    CUSTOMER SUPPORT
    REGULAR UPDATES AND INNOVATION
    COMPLIANCE WITH REGULATORY STANDARDS
  • 5.20 CURRENT AND EMERGING BUSINESS MODELS
    TRANSACTION-BASED MODEL
    SUBSCRIPTION-BASED MODELS
    VALUE-ADDED SERVICES MODEL
    INTEGRATED SERVICE MODELS
    CROSS-BORDER PAYMENT SOLUTIONS
    CONTACTLESS AND NFC PAYMENTS
    EMBEDDED FINANCE
  • 5.21 PAYMENT GATEWAY TOOLS, FRAMEWORKS, AND TECHNIQUES
  • 5.22 FUTURE LANDSCAPE OF PAYMENT GATEWAY MARKET
    SHORT-TERM ROADMAP (2023–2025)
    MID-TERM ROADMAP (2025–2028)
    LONG-TERM ROADMAP (2029–2030)
PAYMENT GATEWAY MARKET, BY TYPE
73
  • 6.1 INTRODUCTION
    TYPE: PAYMENT GATEWAY MARKET DRIVERS
  • 6.2 HOSTED
    OUTSOURCED PAYMENT PROCESSING TO SAVE COSTS AND DRIVE GROWTH
  • 6.3 SELF-HOSTED
    CUSTOMIZED PAYMENT PROCESSING TO DRIVE GROWTH
  • 6.4 OTHER TYPES
PAYMENT GATEWAY MARKET, BY VERTICAL
79
  • 7.1 INTRODUCTION
    VERTICAL: PAYMENT GATEWAY MARKET DRIVERS
  • 7.2 BFSI
    SECURE AND FASTER BANKING TRANSACTIONS TO DRIVE GROWTH
    USE CASE
    - Secure online banking transactions
    - Credit card payments
  • 7.3 TELECOM
    DIVERSE PAYMENT OPTIONS TO DRIVE MARKET GROWTH
    USE CASE
    - Mobile recharge and top-ups
    - Value-added service purchases
  • 7.4 HEALTHCARE
    ONLINE MEDICAL BILLING AND FASTER INSURANCE PROCESSING TO DRIVE GROWTH
    USE CASE
    - Patient payments and co-payments
    - Medical bill payments
  • 7.5 MEDIA & ENTERTAINMENT
    RECURRING SUBSCRIPTIONS AND GROWTH OF ONLINE PLATFORMS TO DRIVE GROWTH
    USE CASE
    - Pay-per-view events
    - Digital content purchases
  • 7.6 TRAVEL & HOSPITALITY
    EASE OF MULTICURRENCY TRANSACTIONS TO DRIVE GROWTH
    USE CASE
    - Hotel booking payments
    - Flight reservations
  • 7.7 IT & ITES
    ENHANCED SECURITY AND ENCRYPTION TO DRIVE GROWTH
    USE CASE
    - Licensing and royalties
    - Training and certification programs
  • 7.8 RETAIL & E-COMMERCE
    INCREASE IN GLOBAL E-COMMERCE SALES TO DRIVE GROWTH
    USE CASE
    - Inventory management
    - Customizable checkout experience
  • 7.9 OTHER VERTICALS
    USE CASE
    - Event registrations
    - Property sales
    - Toll payments
    - Catering services
PAYMENT GATEWAY MARKET, BY REGION
93
  • 8.1 INTRODUCTION
  • 8.2 NORTH AMERICA
    NORTH AMERICA: PAYMENT GATEWAY MARKET DRIVERS
    NORTH AMERICA: RECESSION IMPACT
    US
    - Robust financial ecosystem and major players to drive market
    CANADA
    - Government initiatives and immense participation from private players to drive market growth
  • 8.3 EUROPE
    EUROPE: PAYMENT GATEWAY MARKET DRIVERS
    EUROPE: RECESSION IMPACT
    GERMANY
    - Robust financial ecosystem to drive growth
    UK
    - Government initiatives and availability of advanced connectivity to drive growth
    ITALY
    - Surge in digital payments and e-commerce sector to drive growth
    FRANCE
    - Strategic investments and innovative solutions to fuel market growth
    SPAIN
    - Government funding and major players to drive growth of market
    REST OF EUROPE
  • 8.4 ASIA PACIFIC
    ASIA PACIFIC: PAYMENT GATEWAY MARKET DRIVERS
    ASIA PACIFIC: RECESSION IMPACT
    CHINA
    - Substantial investments and robust e-commerce ecosystem to drive market
    INDIA
    - Innovative digital payment solutions to drive growth
    JAPAN
    - Initiatives such as Society 5.0 and digital payment industry to drive growth
    AUSTRALIA & NEW ZEALAND
    - Government regulations and open banking initiatives to drive growth
    REST OF ASIA PACIFIC
  • 8.5 MIDDLE EAST & AFRICA
    MIDDLE EAST & AFRICA: PAYMENT GATEWAY MARKET DRIVERS
    MIDDLE EAST & AFRICA: RECESSION IMPACT
    GCC COUNTRIES
    - UAE
    - Kingdom of Saudi Arabia
    REST OF GCC COUNTRIES
    SOUTH AFRICA
    - Innovations in digital payment solutions to drive growth
    REST OF MIDDLE EAST & AFRICA
  • 8.6 LATIN AMERICA
    LATIN AMERICA: PAYMENT GATEWAY MARKET DRIVERS
    LATIN AMERICA: RECESSION IMPACT
    BRAZIL
    - Surging e-commerce sector in country to drive growth
    MEXICO
    - Diverse digital payment options to drive growth
    REST OF LATIN AMERICA
COMPETITIVE LANDSCAPE
129
  • 9.1 INTRODUCTION
  • 9.2 KEY PLAYER STRATEGIES/RIGHT TO WIN
    OVERVIEW OF STRATEGIES ADOPTED BY KEY PAYMENT GATEWAY PROVIDERS
  • 9.3 REVENUE ANALYSIS
  • 9.4 MARKET SHARE ANALYSIS
    COMPANY FOOTPRINT: KEY PLAYERS, 2023
  • 9.5 COMPANY EVALUATION MATRIX
    STARS
    EMERGING LEADERS
    PERVASIVE PLAYERS
    PARTICIPANTS
  • 9.6 STARTUP/SME EVALUATION MATRIX
    PROGRESSIVE COMPANIES
    RESPONSIVE COMPANIES
    DYNAMIC COMPANIES
    STARTING BLOCKS
    COMPETITIVE BENCHMARKING
  • 9.7 COMPETITIVE SCENARIO AND TRENDS
    PRODUCT LAUNCHES
    DEALS
  • 9.8 PAYMENT GATEWAY PRODUCT BENCHMARKING
    PROMINENT PAYMENT GATEWAY PLAYERS
  • 9.9 VALUATION AND FINANCIAL METRICS OF KEY PAYMENT GATEWAY PROVIDERS
COMPANY PROFILES
147
  • 10.1 MAJOR PLAYERS
    PAYPAL
    - Business overview
    - Products offered
    - Recent developments
    - MnM view
    FISERV
    - Business overview
    - Products offered
    - Recent developments
    - MnM view
    STRIPE
    - Business overview
    - Products offered
    - Recent developments
    VISA
    - Business overview
    - Products offered
    - Recent developments
    - MnM view
    AMAZON
    - Business overview
    - Products/Solutions/Services offered
    - Recent developments
    - MnM view
    MASTERCARD
    - Business overview
    - Products offered
    - Recent developments
    - MnM view
    FIS
    - Business overview
    - Products offered
    - Recent developments
    BLOCK
    - Business overview
    - Products offered
    - Recent developments
    GLOBAL PAYMENTS
    - Business overview
    - Products offered
    - Recent developments
    ADYEN
    - Business overview
    - Products offered
    - Recent developments
    APPLE
    - Business overview
    - Products offered
    J.P. MORGAN
    - Business overview
    - Products/Solutions/Services offered
    - Recent developments
    ALIBABA GROUP
    - Business overview
    - Products/Solutions/Services offered
    - Recent developments
    RAZORPAY
    PHONEPE
    PAYSAFE
    VERIFONE
  • 10.2 STARTUPS/SMES
    FIDELITY PAYMENT SERVICES
    EASEBUZZ
    BLUESNAP
    WINDCAVE
    HELCIM
    INFIBEAM AVENUES LIMITED (IAL)
    NOWPAYMENTS
    INSTAMOJO
    COINGATE
    IPPOPAY
    PAYJUNCTION
    LYRA NETWORK
ADJACENT/RELATED MARKETS
211
  • 11.1 INTRODUCTION
  • 11.2 DIGITAL PAYMENT MARKET
    MARKET DEFINITION
    MARKET OVERVIEW
  • 11.3 SOLUTIONS
    DIGITAL PAYMENT MARKET, BY TRANSACTION TYPE
    DIGITAL PAYMENT MARKET, BY PAYMENT MODE
    DIGITAL PAYMENT MARKET, BY VERTICAL
    DIGITAL PAYMENT MARKET, BY REGION
  • 11.4 PAYMENT PROCESSING SOLUTIONS MARKET
    MARKET DEFINITION
    MARKET OVERVIEW
    PAYMENT PROCESSING SOLUTIONS, BY PAYMENT METHOD
    PAYMENT PROCESSING SOLUTIONS MARKET, BY VERTICAL
    PAYMENT PROCESSING SOLUTIONS MANAGEMENT MARKET, BY REGION
APPENDIX
220
  • 12.1 DISCUSSION GUIDE
  • 12.2 KNOWLEDGESTORE: MARKETSANDMARKETS’ SUBSCRIPTION PORTAL
  • 12.3 CUSTOMIZATION OPTIONS
  • 12.4 RELATED REPORTS
  • 12.5 AUTHOR DETAILS
LIST OF TABLES
 
  • TABLE 1 USD EXCHANGE RATES, 2021–2023
  • TABLE 2 RISK ASSESSMENT
  • TABLE 3 RESEARCH ASSUMPTIONS
  • TABLE 4 PAYMENT GATEWAY MARKET: ECOSYSTEM
  • TABLE 5 NORTH AMERICA: LIST OF REGULATORY BODIES, GOVERNMENT AGENCIES, AND OTHER ORGANIZATIONS
  • TABLE 6 EUROPE: LIST OF REGULATORY BODIES, GOVERNMENT AGENCIES, AND OTHER ORGANIZATIONS
  • TABLE 7 ASIA PACIFIC: LIST OF REGULATORY BODIES, GOVERNMENT AGENCIES, AND OTHER ORGANIZATIONS
  • TABLE 8 REST OF THE WORLD: LIST OF REGULATORY BODIES, GOVERNMENT AGENCIES, AND OTHER ORGANIZATIONS
  • TABLE 9 AVERAGE SELLING PRICE TREND OF KEY PLAYERS, BY PAYMENT TYPE (USD)
  • TABLE 10 INDICATIVE PRICING ANALYSIS OF PAYMENT GATEWAYS, BY FEATURE (USD)
  • TABLE 11 PAYMENT GATEWAY MARKET: PORTER’S FIVE FORCES ANALYSIS
  • TABLE 12 INFLUENCE OF STAKEHOLDERS ON BUYING PROCESS FOR TOP THREE END USERS (%)
  • TABLE 13 KEY BUYING CRITERIA FOR TOP END USERS
  • TABLE 14 MARKET: DETAILED LIST OF CONFERENCES & EVENTS, 2024
  • TABLE 15 MARKET, BY TYPE, 2018–2023 (USD MILLION)
  • TABLE 16 MARKET, BY TYPE, 2024–2029 (USD MILLION)
  • TABLE 17 HOSTED: MARKET, BY REGION, 2018–2023 (USD MILLION)
  • TABLE 18 HOSTED: MARKET, BY REGION, 2024–2029 (USD MILLION)
  • TABLE 19 SELF-HOSTED: MARKET, BY REGION, 2018–2023 (USD MILLION)
  • TABLE 20 SELF-HOSTED: MARKET, BY REGION, 2024–2029 (USD MILLION)
  • TABLE 21 OTHER TYPES: MARKET, BY REGION, 2018–2023 (USD MILLION)
  • TABLE 22 OTHER TYPES: MARKET, BY REGION, 2024–2029 (USD MILLION)
  • TABLE 23 PAYMENT GATEWAY MARKET, BY VERTICAL, 2018–2023 (USD MILLION)
  • TABLE 24 MARKET, BY VERTICAL, 2024–2029 (USD MILLION)
  • TABLE 25 BFSI: MARKET, BY REGION, 2018–2023 (USD MILLION)
  • TABLE 26 BFSI: MARKET, BY REGION, 2024–2029 (USD MILLION)
  • TABLE 27 TELECOM: MARKET, BY REGION, 2018–2023 (USD MILLION)
  • TABLE 28 TELECOM: MARKET, BY REGION, 2024–2029 (USD MILLION)
  • TABLE 29 HEALTHCARE: MARKET, BY REGION, 2018–2023 (USD MILLION)
  • TABLE 30 HEALTHCARE: MARKET, BY REGION, 2024–2029 (USD MILLION)
  • TABLE 31 MEDIA & ENTERTAINMENT: MARKET, BY REGION, 2018–2023 (USD MILLION)
  • TABLE 32 MEDIA & ENTERTAINMENT: MARKET, BY REGION, 2024–2029 (USD MILLION)
  • TABLE 33 TRAVEL & HOSPITALITY: MARKET, BY REGION, 2018–2023 (USD MILLION)
  • TABLE 34 TRAVEL & HOSPITALITY: MARKET, BY REGION, 2024–2029 (USD MILLION)
  • TABLE 35 IT & ITES: MARKET, BY REGION, 2018–2023 (USD MILLION)
  • TABLE 36 IT & ITES: MARKET, BY REGION, 2024–2029 (USD MILLION)
  • TABLE 37 RETAIL & E-COMMERCE: MARKET, BY REGION, 2018–2023 (USD MILLION)
  • TABLE 38 RETAIL & E-COMMERCE: MARKET, BY REGION, 2024–2029 (USD MILLION)
  • TABLE 39 OTHER VERTICALS: MARKET, BY REGION, 2018–2023 (USD MILLION)
  • TABLE 40 OTHER VERTICALS: MARKET, BY REGION, 2024–2029 (USD MILLION)
  • TABLE 41 PAYMENT GATEWAY MARKET, BY REGION, 2018–2023 (USD MILLION)
  • TABLE 42 MARKET, BY REGION, 2024–2029 (USD MILLION)
  • TABLE 43 NORTH AMERICA: MARKET, BY TYPE, 2018–2023 (USD MILLION)
  • TABLE 44 NORTH AMERICA: MARKET, BY TYPE, 2024–2029 (USD MILLION)
  • TABLE 45 NORTH AMERICA: MARKET, BY VERTICAL, 2018–2023 (USD MILLION)
  • TABLE 46 NORTH AMERICA: MARKET, BY VERTICAL, 2024–2029 (USD MILLION)
  • TABLE 47 NORTH AMERICA: MARKET, BY COUNTRY, 2018–2023 (USD MILLION)
  • TABLE 48 NORTH AMERICA: MARKET, BY COUNTRY, 2024–2029 (USD MILLION)
  • TABLE 49 US: PAYMENT GATEWAY MARKET, BY TYPE, 2018–2023 (USD MILLION)
  • TABLE 50 US: MARKET, BY TYPE, 2024–2029 (USD MILLION)
  • TABLE 51 US: MARKET, BY VERTICAL, 2018–2023 (USD MILLION)
  • TABLE 52 US: MARKET, BY VERTICAL, 2024–2029 (USD MILLION)
  • TABLE 53 CANADA: PAYMENT GATEWAY MARKET, BY TYPE, 2018–2023 (USD MILLION)
  • TABLE 54 CANADA: MARKET, BY TYPE, 2024–2029 (USD MILLION)
  • TABLE 55 CANADA: MARKET, BY VERTICAL, 2018–2023 (USD MILLION)
  • TABLE 56 CANADA: MARKET, BY VERTICAL, 2024–2029 (USD MILLION)
  • TABLE 57 EUROPE: MARKET, BY TYPE, 2018–2023 (USD MILLION)
  • TABLE 58 EUROPE: MARKET, BY TYPE, 2024–2029 (USD MILLION)
  • TABLE 59 EUROPE: MARKET, BY VERTICAL, 2018–2023 (USD MILLION)
  • TABLE 60 EUROPE: MARKET, BY VERTICAL, 2024–2029 (USD MILLION)
  • TABLE 61 EUROPE: MARKET, BY COUNTRY, 2018–2023 (USD MILLION)
  • TABLE 62 EUROPE: MARKET, BY COUNTRY, 2024–2029 (USD MILLION)
  • TABLE 63 UK: PAYMENT GATEWAY MARKET, BY TYPE, 2018–2023 (USD MILLION)
  • TABLE 64 UK: MARKET, BY TYPE, 2024–2029 (USD MILLION)
  • TABLE 65 UK: MARKET, BY VERTICAL, 2018–2023 (USD MILLION)
  • TABLE 66 UK: MARKET, BY VERTICAL, 2024–2029 (USD MILLION)
  • TABLE 67 ASIA PACIFIC: MARKET, BY TYPE, 2018–2023 (USD MILLION)
  • TABLE 68 ASIA PACIFIC: MARKET, BY TYPE, 2024–2029 (USD MILLION)
  • TABLE 69 ASIA PACIFIC: MARKET, BY VERTICAL, 2018–2023 (USD MILLION)
  • TABLE 70 ASIA PACIFIC: MARKET, BY VERTICAL, 2024–2029 (USD MILLION)
  • TABLE 71 ASIA PACIFIC: MARKET, BY COUNTRY, 2018–2023 (USD MILLION)
  • TABLE 72 ASIA PACIFIC: MARKET, BY COUNTRY, 2024–2029 (USD MILLION)
  • TABLE 73 CHINA: PAYMENT GATEWAY MARKET, BY TYPE, 2018–2023 (USD MILLION)
  • TABLE 74 CHINA: MARKET, BY TYPE, 2024–2029 (USD MILLION)
  • TABLE 75 CHINA: MARKET, BY VERTICAL, 2018–2023 (USD MILLION)
  • TABLE 76 CHINA: MARKET, BY VERTICAL, 2024–2029 (USD MILLION)
  • TABLE 77 MIDDLE EAST & AFRICA: MARKET, BY REGION/COUNTRY, 2018–2023 (USD MILLION)
  • TABLE 78 MIDDLE EAST & AFRICA: MARKET, BY REGION/COUNTRY, 2024–2029 (USD MILLION)
  • TABLE 79 MIDDLE EAST & AFRICA: MARKET, BY TYPE, 2018–2023 (USD MILLION)
  • TABLE 80 MIDDLE EAST & AFRICA: MARKET, BY TYPE, 2024–2029 (USD MILLION)
  • TABLE 81 MIDDLE EAST & AFRICA: MARKET, BY VERTICAL, 2018–2023 (USD MILLION)
  • TABLE 82 MIDDLE EAST & AFRICA: MARKET, BY VERTICAL, 2024–2029 (USD MILLION)
  • TABLE 83 GCC COUNTRIES: PAYMENT GATEWAY MARKET, BY COUNTRY, 2018–2023 (USD MILLION)
  • TABLE 84 GCC COUNTRIES: MARKET, BY COUNTRY, 2024–2029 (USD MILLION)
  • TABLE 85 GCC COUNTRIES: MARKET, BY TYPE, 2018–2023 (USD MILLION)
  • TABLE 86 GCC COUNTRIES: MARKET, BY TYPE, 2024–2029 (USD MILLION)
  • TABLE 87 GCC COUNTRIES: MARKET, BY VERTICAL, 2018–2023 (USD MILLION)
  • TABLE 88 GCC COUNTRIES: MARKET, BY VERTICAL, 2024–2029 (USD MILLION)
  • TABLE 89 LATIN AMERICA: MARKET, BY COUNTRY, 2018–2023 (USD MILLION)
  • TABLE 90 LATIN AMERICA: MARKET, BY COUNTRY, 2024–2029 (USD MILLION)
  • TABLE 91 LATIN AMERICA: MARKET, BY TYPE, 2018–2023 (USD MILLION)
  • TABLE 92 LATIN AMERICA: MARKET, BY TYPE, 2024–2029 (USD MILLION)
  • TABLE 93 LATIN AMERICA: MARKET, BY VERTICAL, 2018–2023 (USD MILLION)
  • TABLE 94 LATIN AMERICA: MARKET, BY VERTICAL, 2024–2029 (USD MILLION)
  • TABLE 95 BRAZIL: PAYMENT GATEWAY MARKET, BY TYPE, 2018–2023 (USD MILLION)
  • TABLE 96 BRAZIL: MARKET, BY TYPE, 2024–2029 (USD MILLION)
  • TABLE 97 BRAZIL: MARKET, BY VERTICAL, 2018–2023 (USD MILLION)
  • TABLE 98 BRAZIL: MARKET, BY VERTICAL, 2024–2029 (USD MILLION)
  • TABLE 99 MARKET: DEGREE OF COMPETITION
  • TABLE 100 TYPE FOOTPRINT FOR KEY PLAYERS
  • TABLE 101 VERTICAL FOOTPRINT FOR KEY PLAYERS
  • TABLE 102 REGION FOOTPRINT FOR KEY PLAYERS
  • TABLE 103 DETAILED LIST OF STARTUPS/SMES
  • TABLE 104 COMPETITIVE BENCHMARKING OF KEY STARTUPS/SMES
  • TABLE 105 MARKET: PRODUCT LAUNCHES, JANUARY 2021–DECEMBER 2023
  • TABLE 106 MARKET: DEALS, JANUARY 2021–SEPTEMBER 2023
  • TABLE 107 PAYPAL: BUSINESS OVERVIEW
  • TABLE 108 PAYPAL: PRODUCTS OFFERED
  • TABLE 109 PAYPAL: PRODUCT LAUNCHES
  • TABLE 110 PAYPAL: DEALS
  • TABLE 111 PAYPAL: EXPANSIONS
  • TABLE 112 FISERV: BUSINESS OVERVIEW
  • TABLE 113 FISERV: PRODUCTS OFFERED
  • TABLE 114 FISERV: PRODUCT LAUNCHES
  • TABLE 115 FISERV: DEALS
  • TABLE 116 FISERV: EXPANSIONS
  • TABLE 117 STRIPE: BUSINESS OVERVIEW
  • TABLE 118 STRIPE: PRODUCTS OFFERED
  • TABLE 119 STRIPE: PRODUCT LAUNCHES
  • TABLE 120 STRIPE: DEALS
  • TABLE 121 STRIPE: EXPANSIONS
  • TABLE 122 VISA: BUSINESS OVERVIEW
  • TABLE 123 VISA: PRODUCTS OFFERED
  • TABLE 124 VISA: DEALS
  • TABLE 125 VISA: EXPANSIONS
  • TABLE 126 AMAZON: COMPANY OVERVIEW
  • TABLE 127 AMAZON: PRODUCTS/SOLUTIONS/SERVICES OFFERED
  • TABLE 128 AMAZON: DEALS
  • TABLE 129 MASTERCARD: BUSINESS OVERVIEW
  • TABLE 130 MASTERCARD: PRODUCTS OFFERED
  • TABLE 131 MASTERCARD: PRODUCT LAUNCHES
  • TABLE 132 MASTERCARD: DEALS
  • TABLE 133 FIS: BUSINESS OVERVIEW
  • TABLE 134 FIS: PRODUCTS OFFERED
  • TABLE 135 FIS: PRODUCT LAUNCHES
  • TABLE 136 FIS: DEALS
  • TABLE 137 FIS: EXPANSIONS
  • TABLE 138 BLOCK: BUSINESS OVERVIEW
  • TABLE 139 BLOCK: PRODUCTS OFFERED
  • TABLE 140 BLOCK: PRODUCT LAUNCHES
  • TABLE 141 BLOCK: DEALS
  • TABLE 142 BLOCK: EXPANSIONS
  • TABLE 143 GLOBAL PAYMENTS: BUSINESS OVERVIEW
  • TABLE 144 GLOBAL PAYMENTS: PRODUCTS OFFERED
  • TABLE 145 GLOBAL PAYMENTS: DEALS
  • TABLE 146 ADYEN: BUSINESS OVERVIEW
  • TABLE 147 ADYEN: PRODUCTS OFFERED
  • TABLE 148 ADYEN: PRODUCT LAUNCHES
  • TABLE 149 ADYEN: DEALS
  • TABLE 150 ADYEN: EXPANSIONS
  • TABLE 151 APPLE: BUSINESS OVERVIEW
  • TABLE 152 APPLE: PRODUCTS OFFERED
  • TABLE 153 J.P. MORGAN: COMPANY OVERVIEW
  • TABLE 154 J.P. MORGAN CHASE: PRODUCTS/SOLUTIONS/SERVICES OFFERED
  • TABLE 155 J.P. MORGAN CHASE: PRODUCT LAUNCHES
  • TABLE 156 J.P. MORGAN CHASE: DEALS
  • TABLE 157 ALIBABA GROUP: COMPANY OVERVIEW
  • TABLE 158 ALIBABA GROUP: PRODUCTS/SOLUTIONS/SERVICES OFFERED
  • TABLE 159 ALIBABA GROUP: DEALS
  • TABLE 160 DIGITAL PAYMENT MARKET, BY SOLUTION, 2018–2022 (USD MILLION)
  • TABLE 161 DIGITAL PAYMENT MARKET, BY SOLUTION, 2023–2028 (USD MILLION)
  • TABLE 162 DIGITAL PAYMENT MARKET, BY TRANSACTION TYPE, 2018–2022 (USD MILLION)
  • TABLE 163 DIGITAL PAYMENT MARKET, BY TRANSACTION TYPE, 2023–2028 (USD MILLION)
  • TABLE 164 DIGITAL PAYMENT MARKET, BY PAYMENT MODE, 2018–2022 (USD MILLION)
  • TABLE 165 DIGITAL PAYMENT MARKET, PAYMENT MODE, 2023–2028 (USD MILLION)
  • TABLE 166 DIGITAL PAYMENT MARKET, BY VERTICAL, 2018–2022 (USD MILLION)
  • TABLE 167 DIGITAL PAYMENT MARKET, BY VERTICAL, 2023–2028 (USD MILLION)
  • TABLE 168 DIGITAL PAYMENT MARKET, BY REGION, 2018–2022 (USD MILLION)
  • TABLE 169 DIGITAL PAYMENT MARKET, BY REGION, 2023–2028 (USD MILLION)
  • TABLE 170 PAYMENT PROCESSING SOLUTIONS MARKET, BY PAYMENT METHOD, 2018–2022 (USD MILLION)
  • TABLE 171 PAYMENT PROCESSING SOLUTIONS MARKET, BY PAYMENT METHOD, 2023–2028 (USD MILLION)
  • TABLE 172 PAYMENT PROCESSING SOLUTIONS MARKET, BY VERTICAL, 2018–2022 (USD MILLION)
  • TABLE 173 PAYMENT PROCESSING SOLUTIONS MARKET, BY VERTICAL, 2023–2028 (USD MILLION)
  • TABLE 174 PAYMENT PROCESSING SOLUTIONS MARKET, BY REGION, 2018–2022 (USD MILLION)
  • TABLE 175 PAYMENT PROCESSING SOLUTIONS MARKET, BY REGION, 2023–2028 (USD MILLION)
LIST OF FIGURES
 
  • FIGURE 1 MARKET: RESEARCH DESIGN
  • FIGURE 2 BREAKDOWN OF PRIMARY INTERVIEWS, BY COMPANY TYPE, DESIGNATION, AND REGION
  • FIGURE 3 PAYMENT GATEWAY MARKET: TOP-DOWN AND BOTTOM-UP APPROACHES
  • FIGURE 4 MARKET SIZE ESTIMATION METHODOLOGY – APPROACH 1 (SUPPLY SIDE): REVENUE OF VENDORS IN PAYMENT GATEWAY MARKET
  • FIGURE 5 MARKET SIZE ESTIMATION METHODOLOGY – APPROACH 2 (DEMAND SIDE): PAYMENT GATEWAY MARKET
  • FIGURE 6 MARKET SIZE ESTIMATION USING BOTTOM-UP APPROACH
  • FIGURE 7 DATA TRIANGULATION AND MARKET BREAKUP
  • FIGURE 8 PAYMENT GATEWAY MARKET TO WITNESS SIGNIFICANT GROWTH DURING FORECAST PERIOD
  • FIGURE 9 PAYMENT GATEWAY MARKET: REGIONAL SNAPSHOT
  • FIGURE 10 RAPID DIGITAL TRANSFORMATION IN DEVELOPING ECONOMIES TO DRIVE MARKET
  • FIGURE 11 TOP GROWING SEGMENTS IN 2024
  • FIGURE 12 HOSTED SEGMENT TO LEAD MARKET DURING FORECAST PERIOD
  • FIGURE 13 RETAIL & E-COMMERCE TO HOLD LARGEST MARKET DURING FORECAST PERIOD
  • FIGURE 14 HOSTED SEGMENT AND RETAIL & E-COMMERCE ESTIMATED TO HOLD LARGEST MARKET SHARES IN 2024
  • FIGURE 15 PAYMENT GATEWAY MARKET: DRIVERS, RESTRAINTS, OPPORTUNITIES, AND CHALLENGES
  • FIGURE 16 RISING VOLUME OF UPI PAYMENTS, 2016 TO 2023 (MILLION)
  • FIGURE 17 BRIEF HISTORY OF PAYMENT GATEWAY TECHNOLOGY
  • FIGURE 18 KEY PLAYERS IN PAYMENT GATEWAY MARKET ECOSYSTEM
  • FIGURE 19 PAYMENT GATEWAY MARKET: VALUE CHAIN ANALYSIS
  • FIGURE 20 LIST OF MAJOR PATENTS FOR PAYMENT GATEWAY
  • FIGURE 21 AVERAGE SELLING PRICE TREND OF KEY PLAYERS, BY BILLING CYCLE
  • FIGURE 22 PORTER’S FIVE FORCES ANALYSIS: PAYMENT GATEWAY MARKET
  • FIGURE 23 TRENDS AND DISRUPTIONS IMPACTING CUSTOMERS’ BUSINESSES
  • FIGURE 24 INFLUENCE OF STAKEHOLDERS ON BUYING PROCESS FOR TOP THREE END USERS
  • FIGURE 25 KEY BUYING CRITERIA FOR TOP THREE END USERS
  • FIGURE 26 HOSTED SEGMENT TO HOLD LARGEST MARKET SIZE DURING FORECAST PERIOD
  • FIGURE 27 MEDIA & ENTERTAINMENT SEGMENT TO GROW AT HIGHEST CAGR DURING FORECAST PERIOD
  • FIGURE 28 NORTH AMERICA: PAYMENT GATEWAY MARKET SNAPSHOT
  • FIGURE 29 ASIA PACIFIC: PAYMENT GATEWAY MARKET SNAPSHOT
  • FIGURE 30 HISTORICAL REVENUE ANALYSIS OF KEY PLAYERS, 2018–2022 (USD MILLION)
  • FIGURE 31 PAYMENT GATEWAY MARKET SHARE ANALYSIS, 2023
  • FIGURE 32 COMPANY FOOTPRINT
  • FIGURE 33 PAYMENT GATEWAY MARKET: COMPANY EVALUATION MATRIX, 2023
  • FIGURE 34 PAYMENT GATEWAY MARKET: STARTUP/SME EVALUATION MATRIX
  • FIGURE 35 COMPARATIVE ANALYSIS OF PROMINENT PAYMENT GATEWAY VENDORS
  • FIGURE 36 VALUATION AND FINANCIAL METRICS OF KEY PAYMENT GATEWAY VENDORS
  • FIGURE 37 PAYPAL: COMPANY SNAPSHOT
  • FIGURE 38 FISERV: COMPANY SNAPSHOT
  • FIGURE 39 VISA: COMPANY SNAPSHOT
  • FIGURE 40 AMAZON: COMPANY SNAPSHOT
  • FIGURE 41 MASTERCARD: COMPANY SNAPSHOT
  • FIGURE 42 FIS: COMPANY SNAPSHOT
  • FIGURE 43 BLOCK: COMPANY SNAPSHOT
  • FIGURE 44 GLOBAL PAYMENTS: COMPANY SNAPSHOT
  • FIGURE 45 ADYEN: COMPANY SNAPSHOT
  • FIGURE 46 APPLE: COMPANY SNAPSHOT
  • FIGURE 47 J.P. MORGAN: COMPANY SNAPSHOT
  • FIGURE 48 ALIBABA GROUP: COMPANY SNAPSHOT


This research study involved the extensive use of secondary sources, directories, and databases, such as Dun & Bradstreet (D&B) Hoovers and Bloomberg BusinessWeek, to identify and collect information useful for a technical, market-oriented, and commercial study of the payment gateway market. The primary sources have been mainly industry experts from the core and related industries and preferred suppliers, manufacturers, distributors, service providers, technology developers, alliances, and organizations related to all segments of the value chain of this market. In-depth interviews have been conducted with various primary respondents, including key industry participants, subject matter experts, C-level executives of key market players, and industry consultants to obtain and verify critical qualitative and quantitative information.

Secondary Research

The market for companies offering payment gateway  solutions and services to different verticals has been estimated and projected based on the secondary data made available through paid and unpaid sources, as well as by analyzing their product portfolios in the ecosystem of the payment gateway market. It also involved rating company products based on their performance and quality. In the secondary research process, various sources such as Journal of Electronic Commerce Research (JECR), International Journal of Electronic Commerce (IJEC),  and Electronic Commerce Research and Applications (ECRA)  have been referred to for identifying and collecting information for this study on the payment gateway market. The secondary sources included annual reports, press releases investor presentations of companies, white papers, journals, and certified publications and articles by recognized authors, directories, and databases. Secondary research has been mainly used to obtain key information about the supply chain of the market, the total pool of key players, market classification, segmentation according to industry trends to the bottommost level, regional markets, and key developments from both market- and technology-oriented perspectives that have been further validated by primary sources.

Primary Research

In the primary research process, various primary sources from both the supply and demand sides were interviewed to obtain qualitative and quantitative information on the market. The primary sources from the supply side included various industry experts, including Chief Experience Officers (CXOs); Vice Presidents (VPs); directors from business development, marketing, and product development/innovation teams; related key executives from payment gateway solution vendors, SIs, professional service providers, and industry associations; and key opinion leaders. Primary interviews were conducted to gather insights, such as market statistics, revenue data collected from solutions and services, market breakups, market size estimations, market forecasts, and data triangulation. Primary research also helped in understanding various trends related to technologies, applications, deployments, and regions. Stakeholders from the demand side, such as Chief Information Officers (CIOs), Chief Technology Officers (CTOs), Chief Strategy Officers (CSOs), and end users using payment gateway solutions, were interviewed to understand the buyer’s perspective on suppliers, products, service providers, and their current usage of payment gateway solutions which would impact the overall payment gateway market.
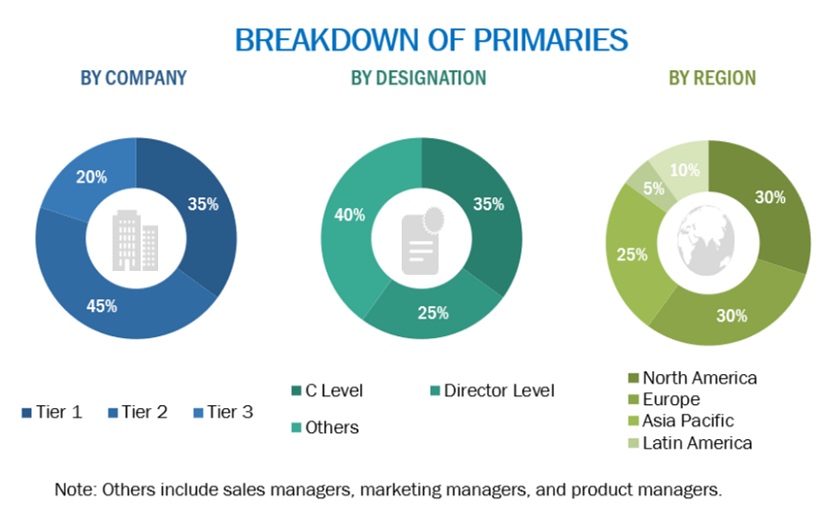
Payment Gateway  Market Size, and Share

To know about the assumptions considered for the study, download the pdf brochure

Market Size Estimation

Multiple approaches were adopted to estimate and forecast the size of the payment gateway market. The first approach involves estimating market size by summing up the revenue generated by companies through the sale of payment gateway offerings.

Both top-down and bottom-up approaches were used to estimate and validate the total size of the payment gateway market. These methods were extensively used to estimate the size of various segments in the market. The research methodology used to estimate the market size includes the following:

  • Key players in the market have been identified through extensive secondary research.
  • In terms of value, the industry’s supply chain and market size have been determined through primary and secondary research processes.
  • All percentage shares, splits, and breakups have been determined using secondary sources and verified through primary sources.

Market Size Estimation Methodology-Bottom-up approach
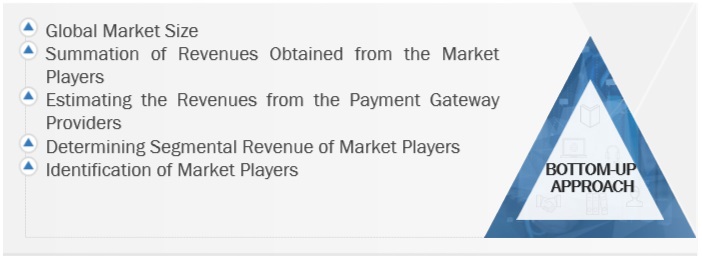
Payment Gateway  Market Bottom Up Approach

To know about the assumptions considered for the study, Request for Free Sample Report

Market Size Estimation Methodology-Top-Down Approach

Payment Gateway  Market Top Down Approach

Data Triangulation

After arriving at the overall market size, the payment gateway market was divided into several segments and subsegments. A data triangulation procedure was used to complete the overall market engineering process and arrive at the exact statistics for all segments and subsegments, wherever applicable. The data was triangulated by studying various factors and trends from the demand and supply sides. Along with data triangulation and market breakdown, the market size was validated by the top-down and bottom-up approaches.

Market Definition

The payment gateway market refers to the sector of the financial technology (fintech) industry focused on providing technology solutions that facilitate the secure transmission of payment data between merchants, consumers, and financial institutions. Payment gateways serve as the intermediary that authorizes and processes electronic transactions, enabling businesses to accept various forms of payment, such as credit cards, debit cards, digital wallets, and alternative payment methods, for goods and services purchased online, in-store, or via mobile devices. These solutions play a crucial role in ensuring the smooth and secure transfer of funds, while also offering features such as fraud prevention, encryption, and compliance with industry standards and regulations such as PCI DSS (Payment Card Industry Data Security Standard). The payment gateway market encompasses a wide range of providers, including traditional financial institutions, fintech startups, and third-party payment service providers, catering to the diverse needs of merchants across various industries and regions.

Key Stakeholders

  • Payment Gateway Providers
  • Merchant
  • Customers
  • Financial Institutions
  • Card Networks
  • Payment Processors
  • Government Agencies
  • Investment Firms
  • Payment gateway Alliances/Groups

Report Objectives

  • To determine, segment, and forecast the payment gateway market by type, vertical, and region in terms of value
  • To forecast the size of the market segments with respect to 5 main regions: North America, Europe, Asia Pacific, Middle East & Africa, and Latin America
  • To provide detailed information about the major factors (drivers, restraints, opportunities, and challenges) influencing the growth of the market
  • To study the complete value chain and related industry segments and perform a value chain analysis of the market landscape
  • To strategically analyze the macro and micro-markets with respect to individual growth trends, prospects, and contributions to the total market
  • To analyze the industry trends, pricing data, patents, and innovations related to the market
  • To analyze the opportunities for stakeholders by identifying the high-growth segments of the market
  • To profile the key players in the market and comprehensively analyze their market share/ranking and core competencies
  • To track and analyze competitive developments, such as mergers & acquisitions, product launches & developments, partnerships, agreements, collaborations, business expansions, and R&D activities

Available Customizations

With the given market data, MarketsandMarkets offers customizations as per the company’s specific needs. The following customization options are available for the report:

  • Country-wise information
  • Analysis for additional countries (up to five)

Company Information

  • Detailed analysis and profiling of additional market players (up to 5)
Custom Market Research Services

We will customize the research for you, in case the report listed above does not meet with your exact requirements. Our custom research will comprehensively cover the business information you require to help you arrive at strategic and profitable business decisions.

Request Customization
Report Code
TC 8989
Published ON
Apr, 2024
Choose License Type
BUY NOW
  • SHARE
X
Request Customization
Speak to Analyst
Speak to Analyst
OR FACE-TO-FACE MEETING
PERSONALIZE THIS RESEARCH
  • Triangulate with your Own Data
  • Get Data as per your Format and Definition
  • Gain a Deeper Dive on a Specific Application, Geography, Customer or Competitor
  • Any level of Personalization
REQUEST A FREE CUSTOMIZATION
LET US HELP YOU!
  • What are the Known and Unknown Adjacencies Impacting the Payment Gateway Market
  • What will your New Revenue Sources be?
  • Who will be your Top Customer; what will make them switch?
  • Defend your Market Share or Win Competitors
  • Get a Scorecard for Target Partners
CUSTOMIZED WORKSHOP REQUEST
knowledgestore logo

Want to explore hidden markets that can drive new revenue in Payment Gateway Market?

Find Hidden Markets
  • Call Us
  • +1-888-600-6441 (Corporate office hours)
  • +1-888-600-6441 (US/Can toll free)
  • +44-800-368-9399 (UK office hours)
CONNECT WITH US
ABOUT TRUST ONLINE
©2024 MarketsandMarkets Research Private Ltd. All rights reserved
DMCA.com Protection Status
Website Feedback