Patient Monitoring Devices Market Size, Share & Trends

Report Code MD 2436
Published in Apr, 2024, By MarketsandMarkets™
Download PDF

Choose License Type

Buy Report Now Inquire Before Buying

Patient Monitoring Devices Market by Product (Cardiac monitoring devices, Pulse Oximeter, Spirometer, Fetal Monitor, Temperature Monitor, blood pressure monitors, ECG, ICP, weight Monitoring), User, Customer Unmet Needs & Region - Global Forecast to 2029

Overview

The global patient monitoring devices market growth forecasted to transform from USD 48.5 billion in 2024 to USD 71.1 billion by 2029, driven by a CAGR of 8.0%. This growth is driven by factors such as the increasing prevalence of chronic disorders, an aging population, advancements in healthcare technology, and the rising adoption of wireless monitoring devices. Major companies in this market include Medtronic, GE Healthcare, Philips Healthcare, Nihon Kohden, Abbott Laboratories, and Mindray Medical. Key product segments are blood glucose monitoring systems, cardiac monitoring devices, multi-parameter monitoring, respiratory monitoring, hemodynamic monitoring, weight monitoring, fetal & neonatal monitoring, neuromonitoring, and temperature monitoring devices. Ambulatory surgical centers are expected to be the fastest-growing end-user segment, while the Asia-Pacific region is anticipated to exhibit the highest CAGR. Despite the high costs and technical expertise required for advanced systems, opportunities for growth lie in AI integration for real-time data analysis and personalized treatment plans. An increase in chronic disorders and the aging population, increasing research & funding initiatives from organizations, and worldwide advancement in surgical procedures are a few drivers that collectively contribute to the growth of the Patient monitoring market, and as healthcare technological advancement continues to evolve, the demand for patient monitoring procedure is expected to rise in the forecasting years. However, challenges for high cost, stringent regulatory policies can limit the market growth.

Attractive Opportunities in the Patient Monitoring Devices Market

ASIA PACIFIC:

The rising prevalence of chronic disorder worldwide, growing funding investments from public & private organizations for research on patient monitoring are expected to drive the market growth in APAC.

Increasing incidence of chronic disorder and research on patient monitoring by key companies have resulted in the development are the major factors driving market growth.

Ongoing research and advancements in patient monitoring technology for chronic disorder is expected to offer growth opportunities for market players

North America holds the largest share of 34.0% of the Patient Monitoring market in 2023.

The market growth in the Asia Pacific region is attributed to the rise in surgical procedures and improving healthcare infrastructure in the region.

Global Patient Monitoring Devices Market Dynamics

DRIVER: Increase adoption of wireless monitoring devices

The healthcare landscape is witnessing a significant shift towards wireless monitoring devices within the broader patient monitoring market. Conventional patient monitoring methods often restrict patient mobility and comfort by tethering them to bedside equipment. Wireless devices address this limitation by facilitating greater freedom of movement, fostering a more patient-centric approach to care delivery. Wireless monitoring facilitates the continuous and real-time capture of vital signs, blood sugar levels, and other health metrics. This uninterrupted data stream offers a more holistic understanding of a patient's health compared to traditional, intermittent measurement.

RESTRAINT: High cost of patient monitoring

Sophisticated patient monitoring systems, like hemodynamic monitors or certain wireless monitoring devices, can be expensive to purchase and install, creating a financial barrier for hospitals and healthcare facilities, particularly smaller institutions. Maintaining and upgrading patient monitoring equipment can add to the ongoing operational costs for healthcare providers. Hospital budget cuts were similar throughout Europe, and are anticipated in the upcoming years. Budget cuts have made cost-containment measures necessary in many areas of healthcare facilities.


OPPORTUNITY: Artificial Intelligence (AI) Integration - growth opportunities

Leveraging artificial intelligence (AI) empowers the analysis of vast datasets generated by patient monitoring systems. This enables real-time generation of actionable insights, facilitates predictive risk stratification, and supports the development of personalized treatment plans for improved patient outcomes. Traditionally, analyzing large datasets from patient monitoring was a time-consuming process. AI algorithms can now analyze this data in real time, identifying critical trends and potential issues as they occur.

CHALLENGE: Technical expertise

Advanced patient monitoring systems, while generating valuable real-time vitals, waveform analysis, and trends, present a data interpretation challenge. Upskilling healthcare personnel, particularly nurses and technicians, is crucial for optimal utilization. However, time-consuming training and potential skill shortages create logistical hurdles for wider adoption in the healthcare industry.

Global Patient Monitoring Devices Market Ecosystem Analysis

Major companies in this market include well-established and financially stable suppliers of Patient monitoring. Prominent companies in this market include Medtronic plc (Ireland), GE Healthcare (US), Philips Healthcare (Netherland), Nihon Kohden Corporation (Japan), Abbott Laboratories (US), Mindray Medical International Ltd (China), Boston Scientific Corporation (US), among several others.


Blood Glucose Monitoring Systems (BGMS) segment to register largest market share of the patient monitoring Devices industry in the year 2023.

Based on the product, the patient monitoring devices market is segmented into Blood glucose monitoring systems, Cardiac Monitoring Devices, Multi-Parameter Monitoring, Respiratory Monitoring Devices, Hemodynamic/ Pressure Monitoring Devices, Weight Monitoring Devices, Fetal & Neonatal Monitoring Devices, Neuromonitoring Devices, Temperature Monitoring Devices and others. BGMS segment to register largest market share in the forecast period of 2024-2029. The Blood glucose monitoring systems are further divided into self-monitoring, continuous glucose monitoring, wearable glucose monitoring. Key drivers are Advancements like continuous glucose monitoring (CGM) have revolutionized blood sugar monitoring by offering a less invasive and more convenient approach compared to traditional finger-stick methods. Furthermore, the growing number of players in the BGMS market is driving innovation and potentially lowering device costs.

Ambulatory Surgical Centers (ASCs) segment of the patient monitoring devices industry is the highest market rate end-user segment in the forecasted year 2024-2029.

The ASCs end user segment of the patient monitoring devices market registers highest market rate in the forecasted year 2024-2029. Key factors driven by Easy-to-use and portable monitoring solutions are crucial to avoid delays and optimize workflow, cost-effectiveness, workflow efficiency, and meeting the specific needs of minimally invasive procedures. Additionally, user-friendly, and delivers value without compromising patient safety. Furthermore, requiring less complex monitoring compared to major surgeries in hospitals.

ASIA PACIFIC Region Holds the Largest Share of the Patient Monitoring Devices Market.

The patient monitoring devices market is divided into key regions: North America, Europe, Asia Pacific, Latin America, and the Middle East & Africa. In 2023, the Asia Pacific region is anticipated to exhibit the highest CAGR during the forecasting year. However, North America held the largest market share in the global Patient monitoring market. This growth is primarily attributed to the a aging population, increasing availability of advanced patient monitoring equipment like wearable devices, wireless monitors, and remote monitoring systems caters to the growing demand for these technologies in APAC countries. The APAC region is emerging as a medical tourism hub, attracting patients seeking high-quality healthcare services, including advancements in surgical techniques and the adoption of advanced Patient monitoring. Additionally, the market in the Asia Pacific region is poised for significant growth due to a combination of demographic, economic, and technological factors.

Recent Developments of Patient Monitoring Devices Market industry

  • In 2023, GE HealthCare’s CARESCAPE Canvas Patient Monitoring Platform Received FDA Clearance. In 2024, GE HealthCare received FDA clearance for an expanded indication for Novii+ maternal and fetal monitoring solution for pregnant patients ≥34 weeks.
  • In 2023, Abbott Receives FDA Clearance For Assert-IG Insertable Cardiac Monitor to Help Doctors Monitor People's Heart Rhythms Long-Term.

Key Market Players

Want to explore hidden markets that can drive new revenue in Patient Monitoring Devices Market?

Scope of the Report

Report Attribute Details
Market Revenue in 2024 $48.5 billion
Projected Revenue by 2029 $71.1 billion
Revenue Rate Poised to Grow at a CAGR of 8.0%
Market Driver Increase adoption of wireless monitoring devices
Market Opportunity Artificial Intelligence (AI) Integration - growth opportunities


Key Questions Addressed by the Report

What is the projected market revenue value of the global patient monitoring Devices market?
The global patient monitoring devices market is projected to grow from USD 48.5 billion in 2024 to USD 71.1 billion by 2029, demonstrating a robust CAGR of 8.0%.
What is the estimated growth rate (CAGR) of the global patient monitoring Devices market?
The global patient monitoring Devices market has an estimated compound annual growth rate (CAGR) of 8.0% and a revenue size in the region of $48.5 billion in 2024. 


Personalize This Research

  • Triangulate with your Own Data
  • Get Data as per your Format and Definition
  • Gain a Deeper Dive on a Specific Application, Geography, Customer or Competitor
  • Any level of Personalization
Request A Free Customisation

Let Us Help You

  • What are the Known and Unknown Adjacencies Impacting the Patient Monitoring Devices Market
  • What will your New Revenue Sources be?
  • Who will be your Top Customer; what will make them switch?
  • Defend your Market Share or Win Competitors
  • Get a Scorecard for Target Partners
Customized Workshop Request

Table of Contents

Exclusive indicates content/data unique to MarketsandMarkets and not available with any competitors.

TITLE
PAGE NO
INTRODUCTION
34
RESEARCH METHODOLOGY
39
EXECUTIVE SUMMARY
56
PREMIUM INSIGHTS
59
MARKET OVERVIEW
63
  • 5.1 INTRODUCTION
  • 5.2 MARKET DYNAMICS
    DRIVERS
    - Emergence of predictive analytics in vital sign monitors
    - Growing preference for wearable patient monitoring devices, biosensors, and smart implants
    - Availability of wireless monitoring devices
    - Expansion of telehealth services and remote monitoring capabilities
    - Growing incidence of chronic diseases
    RESTRAINTS
    - Risks associated with invasive monitoring devices
    - High cost of patient monitoring products and inadequate reimbursement
    OPPORTUNITIES
    - Integration with electronic health records (EHRs)
    - Expansion of remote patient monitoring in home healthcare settings
    CHALLENGES
    - Lack of personnel and limited awareness & education for patient monitoring devices
    - Increased pricing pressure on market players
  • 5.3 PORTER’S FIVE FORCES ANALYSIS
    THREAT OF NEW ENTRANTS
    THREAT OF SUBSTITUTES
    BARGAINING POWER OF SUPPLIERS
    BARGAINING POWER OF BUYERS
    INTENSITY OF COMPETITIVE RIVALRY
  • 5.4 REGULATORY ANALYSIS
  • 5.5 KEY REGULATORY GUIDELINES
    NORTH AMERICA
    - US
    - Canada
    EUROPE
    ASIA PACIFIC
    - Japan
    - India
    - China
  • 5.6 REIMBURSEMENT SCENARIO
  • 5.7 ECOSYSTEM ANALYSIS
  • 5.8 INVESTMENT & FUNDING SCENARIO
  • 5.9 TECHNOLOGY ANALYSIS
    KEY TECHNOLOGIES
    - Smart wearable monitoring devices
    - Vital sign monitors
    COMPLEMENTARY TECHNOLOGIES
    - Remote patient monitors
    - AI & IoT
    - Telehealth
    ADJACENT TECHNOLOGIES
    - IVD
    - Medical imaging
  • 5.10 VALUE CHAIN ANALYSIS
    RESEARCH & DEVELOPMENT
    PROCUREMENT AND PRODUCT DEVELOPMENT
    MARKETING, SALES AND DISTRIBUTION, AND POST-SALES SERVICES
  • 5.11 SUPPLY CHAIN ANALYSIS
    PROMINENT COMPANIES
    SMALL & MEDIUM-SIZED COMPANIES
    END USERS
  • 5.12 PRICING ANALYSIS
  • 5.13 PATENT ANALYSIS
  • 5.14 TRADE ANALYSIS
  • 5.15 KEY CONFERENCES & EVENTS, 2024–2025
  • 5.16 TRENDS/DISRUPTIONS IMPACTING CUSTOMERS’ BUSINESSES
  • 5.17 KEY STAKEHOLDERS & BUYING CRITERIA
    KEY STAKEHOLDERS IN BUYING PROCESS
    BUYING CRITERIA
  • 5.18 PATIENT MONITORING MARKET: RECESSION IMPACT
  • 5.19 UNMET NEEDS & KEY PAIN POINTS
PATIENT MONITORING MARKET, BY PRODUCT
100
  • 6.1 INTRODUCTION
  • 6.2 BLOOD GLUCOSE MONITORING DEVICES
    SELF-MONITORING BLOOD GLUCOSE DEVICES
    - Rising adoption of integrated glucose monitoring devices to drive growth
    CONTINUOUS GLUCOSE MONITORING DEVICES
    - Product launches and evolving reimbursement scenarios for continuous monitoring devices to drive market growth
    WEARABLE GLUCOSE MONITORING DEVICES
    - Growing patient inclination towards wearable monitors to boost market
  • 6.3 CARDIAC MONITORING DEVICES
    ECG DEVICES
    - Low cost and wide applications of ECG devices to drive market growth
    IMPLANTABLE LOOP RECORDERS (ILRS)
    - High cost and limited applications to limit growth
    EVENT MONITORS
    - Emergence of portable and wireless event monitors to drive market growth
    MCT MONITORS
    - Availability of alternate technologies to hinder market growth
    SMART/WEARABLE ECG MONITORS
    - Need to minimize treatment costs for CVD patients to increase adoption of smart/wearable ECG monitors
  • 6.4 MULTIPARAMETER MONITORING DEVICES
    LOW-ACUITY MONITORS
    - Increasing adoption of low-acuity monitors in general wards to drive market growth
    MID-ACUITY MONITORS
    - Rising geriatric population to increase market growth
    HIGH-ACUITY MONITORS
    - Increasing partnerships between manufacturers and hospitals & clinics to drive device sales
  • 6.5 RESPIRATORY MONITORING DEVICES
    PULSE OXIMETERS
    - Rising adoption of pulse oximeters in home care settings to drive market growth
    SPIROMETERS
    - Technological advancements to increase adoption of spirometers
    CAPNOGRAPHS
    - Product development and growing commercial acceptance to drive market growth
    PEAK FLOW METERS
    - Low preference for peak flow meters due to high variability in measurements from different devices to hinder market growth
  • 6.6 TEMPERATURE MONITORING DEVICES
    HANDHELD TEMPERATURE MONITORING DEVICES
    - Advantages associated with handheld temperature monitoring devices to drive market growth
    TABLE-TOP TEMPERATURE MONITORING DEVICES
    - Increasing risks associated with hypothermia during surgeries to drive demand for table-top devices
    WEARABLE CONTINUOUS MONITORING DEVICES
    - Versatile functionalities offered by wearable continuous monitoring devices to drive demand
    INVASIVE TEMPERATURE MONITORING DEVICES
    - Risk of bloodstream infections associated with catheter usage to hinder market for invasive devices
    SMART TEMPERATURE MONITORING PATCHES
    - Long-term monitoring capabilities of smart patches to drive market growth
  • 6.7 HEMODYNAMIC/PRESSURE MONITORING DEVICES
    HEMODYNAMIC MONITORS
    - Influx of VC funding to drive market growth
    BLOOD PRESSURE MONITORS
    - Development of wearable blood pressure monitors to drive market growth
    DISPOSABLES
    - Growing number of surgical procedures to drive growth in disposables market
  • 6.8 FETAL & NEONATAL MONITORING DEVICES
    FETAL MONITORING DEVICES
    - Rising prevalence of obstetric complications to drive market growth
    NEONATAL MONITORING DEVICES
    - Rising number of neonatal care facilities worldwide to drive market
  • 6.9 NEUROMONITORING DEVICES
    EEG MACHINES
    - Growing applications and technological advancements to favor market growth
    EMG MACHINES
    - Availability of reimbursements for EMG-assisted surgeries to boost product demand
    CEREBRAL OXIMETERS
    - Growing cases of hypoxia during surgical procedures to drive market growth
    ICP MONITORS
    - Growing incidence of post-surgical cerebrovascular complications and TBIs to support adoption of ICP monitors
    MEG MACHINES
    - High implementation and maintenance costs of MEG devices to hinder market growth
    TCD MACHINES
    - Rising prevalence of strokes and cerebrovascular disorders to contribute to market growth
  • 6.10 WEIGHT MONITORING DEVICES
    DIGITAL WEIGHT MONITORING DEVICES
    - Consumer preference for digital scales—a key market driver
    ANALOG WEIGHT MONITORING DEVICES
    - Rising prevalence of obesity and low cost of analog scales to support market growth
  • 6.11 OTHER PATIENT MONITORING DEVICES
PATIENT MONITORING MARKET, BY END USER
156
  • 7.1 INTRODUCTION
  • 7.2 HOSPITALS & CLINICS
    ABILITY TO AFFORD HIGH INSTALLATION & MAINTENANCE COSTS OF PATIENT MONITORING TECHNOLOGIES TO BOOST MARKET
  • 7.3 AMBULATORY SURGICAL CENTERS
    COST-EFFECTIVENESS AND CONVENIENCE OF AMBULATORY SURGICAL CENTERS TO DRIVE DEMAND FOR AMBULATORY CARE
  • 7.4 HOME CARE SETTINGS
    REDUCED COST AND CONTINUOUS MONITORING OF VITAL INFORMATION IN HOME SETTINGS TO BOOST GROWTH
  • 7.5 OTHER END USERS
PATIENT MONITORING MARKET, BY REGION
162
  • 8.1 INTRODUCTION
  • 8.2 NORTH AMERICA
    NORTH AMERICA: RECESSON IMPACT
    US
    - Growing number of FDA approvals for patient monitoring devices to support market growth
    CANADA
    - Growing public-private funding for research to drive market growth
  • 8.3 EUROPE
    EUROPE: RECESSION IMPACT
    GERMANY
    - Rising healthcare expenditure and manufacturer expansion to boost market growth
    UK
    - Increasing public & private investments to contribute to market growth
    FRANCE
    - Statutory health insurance system to support market growth
    ITALY
    - Rising incidence of lifestyle diseases to drive adoption of patient monitoring devices
    SPAIN
    - Growing number of surgical procedures to drive market growth in Spain
    REST OF EUROPE
  • 8.4 ASIA PACIFIC
    ASIA PACIFIC: RECESSION IMAPCT
    JAPAN
    - Large geriatric population and favorable reimbursement scenario to support market growth
    CHINA
    - Growing focus of local and international market players to favor market growth
    INDIA
    - Increasing government-implemented healthcare initiatives to support market growth
    AUSTRALIA
    - R&D Tax Incentive Program to support market growth
    SOUTH KOREA
    - Supportive government initiatives to drive market growth
    REST OF ASIA PACIFIC
  • 8.5 LATIN AMERICA
    LATIN AMERICA: RECESSION IMAPCT
    BRAZIL
    - Brazil to dominate LATAM market
    MEXICO
    - Favorable investment scenario for medical device manufacturers to drive market growth
    REST OF LATIN AMERICA
  • 8.6 MIDDLE EAST & AFRICA
    AWARENESS INITIATIVES TO DRIVE ADOPTION OF PATIENT MONITORING DEVICES IN REGION
    MIDDLE EAST & AFRICA: RECESSION IMAPCT
COMPETITIVE LANDSCAPE
297
  • 9.1 OVERVIEW
  • 9.2 KEY PLAYER STRATEGIES/RIGHT TO WIN
    OVERVIEW OF STRATEGIES ADOPTED BY PATIENT MONITORING PLAYERS
  • 9.3 REVENUE ANALYSIS
  • 9.4 MARKET SHARE ANALYSIS
    GLOBAL BLOOD GLUCOSE MONITORING DEVICES MARKET SHARE, BY KEY PLAYER, 2023
    GLOBAL CARDIAC MONITORING DEVICES MARKET SHARE, BY KEY PLAYER, 2023
    GLOBAL MULTIPARAMETER MONITORING DEVICES MARKET SHARE, BY KEY PLAYER, 2023
    GLOBAL HEMODYNAMIC/PRESSURE MONITORING DEVICES MARKET SHARE, BY KEY PLAYER, 2023
    GLOBAL FETAL & NEONATAL MONITORING DEVICES MARKET SHARE, BY KEY PLAYER, 2023
  • 9.5 COMPANY EVALUATION MATRIX: KEY PLAYERS, 2023
    STARS
    EMERGING LEADERS
    PERVASIVE PLAYERS
    PARTICIPANTS
    COMPANY FOOTPRINT: KEY PLAYERS
  • 9.6 COMPANY EVALUATION MATRIX: STARTUPS/SMES, 2023
    PROGRESSIVE COMPANIES
    RESPONSIVE COMPANIES
    DYNAMIC COMPANIES
    STARTING BLOCKS
    COMPETITIVE BENCHMARKING
  • 9.7 COMPETITIVE SCENARIO
    PRODUCT LAUNCHES & APPROVALS
    DEALS
  • 9.8 COMPANY VALUATION & FINANCIAL METRICS
  • 9.9 PRODUCT/BRAND COMPARISON
COMPANY PROFILES
319
  • 10.1 KEY PLAYERS
    MEDTRONIC PLC
    - Business overview
    - Products offered
    - Recent developments
    - MnM view
    ABBOTT LABORATORIES
    - Business overview
    - Products offered
    - Recent developments
    - MnM view
    DEXCOM, INC.
    - Business overview
    - Products offered
    - Recent developments
    - MnM view
    GE HEALTHCARE
    - Business overview
    - Products offered
    - Recent developments
    - MnM view
    PHILIPS HEALTHCARE
    - Business overview
    - Products offered
    - Recent developments
    - MnM view
    NIHON KOHDEN CORPORATION
    - Business overview
    - Products offered
    - Recent developments
    MINDRAY MEDICAL INTERNATIONAL LTD.
    - Business overview
    - Products offered
    - Recent developments
    EDWARDS LIFESCIENCES CORPORATION
    - Business overview
    - Products offered
    GETINGE AB
    - Business overview
    - Products offered
    - Recent developments
    BAXTER INTERNATIONAL (HILL-ROM HOLDINGS, INC.)
    - Business overview
    - Products offered
    - Recent developments
    DRÄGERWERK AG & CO. KGAA
    - Business overview
    - Products offered
    BOSTON SCIENTIFIC CORPORATION
    - Business overview
    - Products offered
    - Recent developments
    MASIMO CORPORATION
    - Business overview
    - Products offered
    - Recent developments
    OMRON CORPORATION
    - Business overview
    - Products offered
    - Recent developments
    ARCHIMED SAS (NATUS MEDICAL)
    - Business overview
    - Products offered
    - Recent developments
    COMPUMEDICS LIMITED
    - Business overview
    - Products offered
    - Recent developments
    NONIN MEDICAL, INC.
    - Business overview
    - Products offered
    - Recent developments
  • 10.2 OTHER PLAYERS
    BIOTRONIK
    SCHILLER AG
    SENSEONICS
    CARDIOMO
    VITLS
    NETEERA
    QARDIO
    VIVIFY HEALTH
    IRHYTHM TECHNOLOGIES, INC.
    OSYPKA MEDICAL
    CARDINAL HEALTH
    MERIT MEDICAL SYSTEMS
APPENDIX
405
  • 11.1 DISCUSSION GUIDE
  • 11.2 KNOWLEDGESTORE: MARKETSANDMARKETS’ SUBSCRIPTION PORTAL
  • 11.3 CUSTOMIZATION OPTIONS
  • 11.4 RELATED REPORTS
  • 11.5 AUTHOR DETAILS
LIST OF TABLES
 
  • TABLE 1 LIMITATIONS AND ASSOCIATED RISKS
  • TABLE 2 PATIENT MONITORING MARKET: PORTER’S FIVE FORCES ANALYSIS
  • TABLE 3 NORTH AMERICA: REGULATORY BODIES, GOVERNMENT AGENCIES, AND OTHER ORGANIZATIONS
  • TABLE 4 EUROPE: REGULATORY BODIES, GOVERNMENT AGENCIES, AND OTHER ORGANIZATIONS
  • TABLE 5 ASIA PACIFIC: REGULATORY BODIES, GOVERNMENT AGENCIES, AND OTHER ORGANIZATIONS
  • TABLE 6 LATIN AMERICA: REGULATORY BODIES, GOVERNMENT AGENCIES, AND OTHER ORGANIZATIONS
  • TABLE 7 MIDDLE EAST & AFRICA: REGULATORY BODIES, GOVERNMENT AGENCIES, AND OTHER ORGANIZATIONS
  • TABLE 8 US: CLASSIFICATION OF MEDICAL EQUIPMENT
  • TABLE 9 US: TIME, COST, AND COMPLEXITY OF REGISTRATION PROCESS
  • TABLE 10 CANADA: LEVEL OF RISK, TIME, COST, AND COMPLEXITY OF REGISTRATION PROCESS
  • TABLE 11 EUROPE: LEVEL OF RISK, TIME, COST, AND COMPLEXITY OF REGISTRATION PROCESS
  • TABLE 12 JAPAN: TIME, COST, AND COMPLEXITY OF REGISTRATION PROCESS
  • TABLE 13 REIMBURSEMENT CODES FOR VARIOUS PROCEDURES
  • TABLE 14 AVERAGE SELLING PRICE OF PATIENT MONITORING MARKET, BY REGION, 2023
  • TABLE 15 IMPORT DATA FOR PATIENT MONITORING DEVICES (HS CODE 9018), BY COUNTRY, 2018–2022 (USD THOUSAND)
  • TABLE 16 EXPORT DATA FOR PATIENT MONITORING DEVICES (HS CODE 9018), BY COUNTRY, 2018–2022 (USD THOUSAND)
  • TABLE 17 PATIENT MONITORING MARKET: DETAILED LIST OF KEY CONFERENCES & EVENTS IN 2024–2025
  • TABLE 18 KEY REQUIREMENTS OF DEPARTMENTS/STAKEHOLDERS WHILE BUYING PATIENT MONITORING DEVICES
  • TABLE 19 INFLUENCE OF STAKEHOLDERS ON BUYING PROCESS FOR KEY PRODUCT SEGMENTS (%)
  • TABLE 20 PATIENT MONITORING MARKET: UNMET CUSTOMER NEEDS & KEY PAIN POINTS
  • TABLE 21 PATIENT MONITORING MARKET, BY PRODUCT, 2022–2029 (USD MILLION)
  • TABLE 22 BLOOD GLUCOSE MONITORING DEVICES MARKET, BY TYPE, 2022–2029 (USD MILLION)
  • TABLE 23 BLOOD GLUCOSE MONITORING DEVICES MARKET, BY REGION, 2022–2029 (USD MILLION)
  • TABLE 24 BLOOD GLUCOSE MONITORING DEVICES MARKET, BY END USER, 2022–2029 (USD MILLION)
  • TABLE 25 SELF-MONITORING BLOOD GLUCOSE DEVICES MARKET, BY REGION, 2022–2029 (USD MILLION)
  • TABLE 26 CONTINUOUS GLUCOSE MONITORING DEVICES MARKET, BY REGION, 2022–2029 (USD MILLION)
  • TABLE 27 WEARABLE GLUCOSE MONITORING DEVICES MARKET, BY REGION, 2022–2029 (USD MILLION)
  • TABLE 28 CARDIAC MONITORING DEVICES MARKET, BY TYPE, 2022–2029 (USD MILLION)
  • TABLE 29 CARDIAC MONITORING DEVICES MARKET, BY REGION, 2022–2029 (USD MILLION)
  • TABLE 30 CARDIAC MONITORING DEVICES MARKET, BY END USER, 2022–2029 (USD MILLION)
  • TABLE 31 ECG DEVICES MARKET, BY REGION, 2022–2029 (USD MILLION)
  • TABLE 32 IMPLANTABLE LOOP RECORDERS MARKET, BY REGION, 2022–2029 (USD MILLION)
  • TABLE 33 EVENT MONITORS MARKET, BY REGION, 2022–2029 (USD MILLION)
  • TABLE 34 MCT MONITORS MARKET, BY REGION, 2022–2029 (USD MILLION)
  • TABLE 35 SMART/WEARABLE ECG MONITORS OFFERED BY MARKET PLAYERS
  • TABLE 36 SMART/WEARABLE ECG MONITORS MARKET, BY REGION, 2022–2029 (USD MILLION)
  • TABLE 37 MULTIPARAMETER MONITORING DEVICES MARKET, BY TYPE, 2022–2029 (USD MILLION)
  • TABLE 38 MULTIPARAMETER MONITORING DEVICES MARKET, BY REGION, 2022–2029 (USD MILLION)
  • TABLE 39 MULTIPARAMETER MONITORING DEVICES MARKET, BY END USER, 2022–2029 (USD MILLION)
  • TABLE 40 LOW-ACUITY MONITORS MARKET, BY REGION, 2022–2029 (USD MILLION)
  • TABLE 41 MID-ACUITY MONITORS MARKET, BY REGION, 2022–2029 (USD MILLION)
  • TABLE 42 HIGH-ACUITY MONITORS MARKET, BY REGION, 2022–2029 (USD MILLION)
  • TABLE 43 RESPIRATORY MONITORING DEVICES MARKET, BY TYPE, 2022–2029 (USD MILLION)
  • TABLE 44 RESPIRATORY MONITORING DEVICES MARKET, BY REGION, 2022–2029 (USD MILLION)
  • TABLE 45 RESPIRATORY MONITORING DEVICES MARKET, BY END USER, 2022–2029 (USD MILLION)
  • TABLE 46 PULSE OXIMETERS MARKET, BY REGION, 2022–2029 (USD MILLION)
  • TABLE 47 SPIROMETERS MARKET, BY REGION, 2022–2029 (USD MILLION)
  • TABLE 48 CAPNOGRAPHS MARKET, BY REGION, 2022–2029 (USD MILLION)
  • TABLE 49 PEAK FLOW METERS MARKET, BY REGION, 2022–2029 (USD MILLION)
  • TABLE 50 TEMPERATURE MONITORING DEVICES MARKET, BY TYPE, 2022–2029 (USD MILLION)
  • TABLE 51 TEMPERATURE MONITORING DEVICES MARKET, BY REGION, 2022–2029 (USD MILLION)
  • TABLE 52 TEMPERATURE MONITORING DEVICES MARKET, BY END USER, 2022–2029 (USD MILLION)
  • TABLE 53 HANDHELD TEMPERATURE MONITORING DEVICES OFFERED BY MARKET PLAYERS
  • TABLE 54 HANDHELD TEMPERATURE MONITORING DEVICES MARKET, BY REGION, 2022–2029 (USD MILLION)
  • TABLE 55 TABLE-TOP TEMPERATURE MONITORING DEVICES MARKET, BY REGION, 2022–2029 (USD MILLION)
  • TABLE 56 WEARABLE CONTINUOUS MONITORING DEVICES OFFERED BY MARKET PLAYERS
  • TABLE 57 WEARABLE CONTINUOUS MONITORING DEVICES MARKET, BY REGION, 2022–2029 (USD MILLION)
  • TABLE 58 INVASIVE TEMPERATURE MONITORING DEVICES MARKET, BY REGION, 2022–2029 (USD MILLION)
  • TABLE 59 SMART TEMPERATURE MONITORING PATCHES OFFERED BY MARKET PLAYERS
  • TABLE 60 SMART TEMPERATURE MONITORING PATCHES MARKET, BY REGION, 2022–2029 (USD MILLION)
  • TABLE 61 HEMODYNAMIC/PRESSURE MONITORING DEVICES MARKET, BY TYPE, 2022–2029 (USD MILLION)
  • TABLE 62 HEMODYNAMIC/PRESSURE MONITORING DEVICES MARKET, BY REGION, 2022–2029 (USD MILLION)
  • TABLE 63 HEMODYNAMIC/PRESSURE MONITORING DEVICES MARKET, BY END USER, 2022–2029 (USD MILLION)
  • TABLE 64 HEMODYNAMIC MONITORS MARKET, BY REGION, 2022–2029 (USD MILLION)
  • TABLE 65 WEARABLE BLOOD PRESSURE MONITORS OFFERED BY MARKET PLAYERS
  • TABLE 66 BLOOD PRESSURE MONITORS MARKET, BY REGION, 2022–2029 (USD MILLION)
  • TABLE 67 HEMODYNAMIC/PRESSURE MONITORING DISPOSABLES MARKET, BY REGION, 2022–2029 (USD MILLION)
  • TABLE 68 FETAL & NEONATAL MONITORING DEVICES MARKET, BY TYPE, 2022–2029 (USD MILLION)
  • TABLE 69 FETAL & NEONATAL MONITORING DEVICES MARKET, BY REGION, 2022–2029 (USD MILLION)
  • TABLE 70 FETAL & NEONATAL MONITORING DEVICES MARKET, BY END USER, 2022–2029 (USD MILLION)
  • TABLE 71 WEARABLE FETAL MONITORING & OBSTETRIC DEVICES OFFERED BY MARKET PLAYERS
  • TABLE 72 FETAL MONITORING DEVICES MARKET, BY REGION, 2022–2029 (USD MILLION)
  • TABLE 73 NEONATAL MONITORING DEVICES MARKET, BY REGION, 2022–2029 (USD MILLION)
  • TABLE 74 NEUROMONITORING DEVICES MARKET, BY TYPE, 2022–2029 (USD MILLION)
  • TABLE 75 NEUROMONITORING DEVICES MARKET, BY REGION, 2022–2029 (USD MILLION)
  • TABLE 76 NEUROMONITORING DEVICES MARKET, BY END USER, 2022–2029 (USD MILLION)
  • TABLE 77 EEG MACHINES MARKET, BY REGION, 2022–2029 (USD MILLION)
  • TABLE 78 EMG MACHINES MARKET, BY REGION, 2022–2029 (USD MILLION)
  • TABLE 79 CEREBRAL OXIMETERS MARKET, BY REGION, 2022–2029 (USD MILLION)
  • TABLE 80 ICP MONITORS MARKET, BY REGION, 2022–2029 (USD MILLION)
  • TABLE 81 MEG MACHINES MARKET, BY REGION, 2022–2029 (USD MILLION)
  • TABLE 82 TCD MACHINES MARKET, BY REGION, 2022–2029 (USD MILLION)
  • TABLE 83 WEIGHT MONITORING DEVICES MARKET, BY TYPE, 2022–2029 (USD MILLION)
  • TABLE 84 WEIGHT MONITORING DEVICES MARKET, BY REGION, 2022–2029 (USD MILLION)
  • TABLE 85 WEIGHT MONITORING DEVICES MARKET, BY END USER, 2022–2029 (USD MILLION)
  • TABLE 86 DIGITAL WEIGHT MONITORING DEVICES MARKET, BY REGION, 2022–2029 (USD MILLION)
  • TABLE 87 ANALOG WEIGHT MONITORING DEVICES MARKET, BY REGION, 2022–2029 (USD MILLION)
  • TABLE 88 POLYSOMNOGRAPHY DEVICES OFFERED BY VARIOUS PLAYERS
  • TABLE 89 WEARABLE SLEEP MONITORING DEVICES OFFERED BY MARKET PLAYERS
  • TABLE 90 OTHER PATIENT MONITORING DEVICES MARKET, BY REGION, 2022–2029 (USD MILLION)
  • TABLE 91 OTHER PATIENT MONITORING DEVICES MARKET, BY END USER, 2022–2029 (USD MILLION)
  • TABLE 92 PATIENT MONITORING MARKET, BY END USER, 2022–2029 (USD MILLION)
  • TABLE 93 PATIENT MONITORING MARKET FOR HOSPITALS & CLINICS, BY TYPE, 2022–2029 (USD MILLION)
  • TABLE 94 PATIENT MONITORING MARKET FOR HOSPITALS & CLINICS, BY REGION, 2022–2029 (USD MILLION)
  • TABLE 95 PATIENT MONITORING MARKET FOR AMBULATORY SURGICAL CENTERS, BY REGION, 2022–2029 (USD MILLION)
  • TABLE 96 PATIENT MONITORING MARKET FOR HOME CARE SETTINGS, BY REGION, 2022–2029 (USD MILLION)
  • TABLE 97 PATIENT MONITORING MARKET FOR OTHER END USERS, BY REGION, 2022–2029 (USD MILLION)
  • TABLE 98 PATIENT MONITORING MARKET, BY REGION, 2022–2029 (USD MILLION)
  • TABLE 99 NORTH AMERICA: PATIENT MONITORING MARKET, BY COUNTRY, 2022–2029 (USD MILLION)
  • TABLE 100 NORTH AMERICA: PATIENT MONITORING MARKET, BY PRODUCT, 2022–2029 (USD MILLION)
  • TABLE 101 NORTH AMERICA: BLOOD GLUCOSE MONITORING DEVICES MARKET, BY TYPE, 2022–2029 (USD MILLION)
  • TABLE 102 NORTH AMERICA: CARDIAC MONITORING DEVICES MARKET, BY TYPE, 2022–2029 (USD MILLION)
  • TABLE 103 NORTH AMERICA: MULTIPARAMETER MONITORING DEVICES MARKET, BY TYPE, 2022–2029 (USD MILLION)
  • TABLE 104 NORTH AMERICA: RESPIRATORY MONITORING DEVICES MARKET, BY TYPE, 2022–2029 (USD MILLION)
  • TABLE 105 NORTH AMERICA: TEMPERATURE MONITORING DEVICES MARKET, BY TYPE, 2022–2029 (USD MILLION)
  • TABLE 106 NORTH AMERICA: HEMODYNAMIC/PRESSURE MONITORING DEVICES MARKET, BY TYPE, 2022–2029 (USD MILLION)
  • TABLE 107 NORTH AMERICA: FETAL & NEONATAL MONITORING DEVICES MARKET, BY TYPE, 2022–2029 (USD MILLION)
  • TABLE 108 NORTH AMERICA: NEUROMONITORING DEVICES MARKET, BY TYPE, 2022–2029 (USD MILLION)
  • TABLE 109 NORTH AMERICA: WEIGHT MONITORING DEVICES MARKET, BY TYPE, 2022–2029 (USD MILLION)
  • TABLE 110 NORTH AMERICA: PATIENT MONITORING MARKET, BY END USER, 2022–2029 (USD MILLION)
  • TABLE 111 VC FUNDING IN PATIENT MONITORING MARKET IN US
  • TABLE 112 US: PATIENT MONITORING MARKET, BY PRODUCT, 2022–2029 (USD MILLION)
  • TABLE 113 US: BLOOD GLUCOSE MONITORING DEVICES MARKET, BY TYPE, 2022–2029 (USD MILLION)
  • TABLE 114 US: CARDIAC MONITORING DEVICES MARKET, BY TYPE, 2022–2029 (USD MILLION)
  • TABLE 115 US: MULTIPARAMETER MONITORING DEVICES MARKET, BY TYPE, 2022–2029 (USD MILLION)
  • TABLE 116 US: RESPIRATORY MONITORING DEVICES MARKET, BY TYPE, 2022–2029 (USD MILLION)
  • TABLE 117 US: TEMPERATURE MONITORING DEVICES MARKET, BY TYPE, 2022–2029 (USD MILLION)
  • TABLE 118 US: HEMODYNAMIC/PRESSURE MONITORING DEVICES MARKET, BY TYPE, 2022–2029 (USD MILLION)
  • TABLE 119 US: FETAL & NEONATAL MONITORING DEVICES MARKET, BY TYPE, 2022–2029 (USD MILLION)
  • TABLE 120 US: NEUROMONITORING DEVICES MARKET, BY TYPE, 2022–2029 (USD MILLION)
  • TABLE 121 US: WEIGHT MONITORING DEVICES MARKET, BY TYPE, 2022–2029 (USD MILLION)
  • TABLE 122 RESEARCH GRANTS IN PATIENT MONITORING MARKET IN CANADA
  • TABLE 123 RECENT DEVELOPMENTS IN CANADIAN PATIENT MONITORING MARKET
  • TABLE 124 CANADA: PATIENT MONITORING MARKET, BY PRODUCT, 2022–2029 (USD MILLION)
  • TABLE 125 CANADA: BLOOD GLUCOSE MONITORING DEVICES MARKET, BY TYPE, 2022–2029 (USD MILLION)
  • TABLE 126 CANADA: CARDIAC MONITORING DEVICES MARKET, BY TYPE, 2022–2029 (USD MILLION)
  • TABLE 127 CANADA: MULTIPARAMETER MONITORING DEVICES MARKET, BY TYPE, 2022–2029 (USD MILLION)
  • TABLE 128 CANADA: RESPIRATORY MONITORING DEVICES MARKET, BY TYPE, 2022–2029 (USD MILLION)
  • TABLE 129 CANADA: TEMPERATURE MONITORING DEVICES MARKET, BY TYPE, 2022–2029 (USD MILLION)
  • TABLE 130 CANADA: HEMODYNAMIC/PRESSURE MONITORING DEVICES MARKET, BY TYPE, 2022–2029 (USD MILLION)
  • TABLE 131 CANADA: FETAL & NEONATAL MONITORING DEVICES MARKET, BY TYPE, 2022–2029 (USD MILLION)
  • TABLE 132 CANADA: NEUROMONITORING DEVICES MARKET, BY TYPE, 2022–2029 (USD MILLION)
  • TABLE 133 CANADA: WEIGHT MONITORING DEVICES MARKET, BY TYPE, 2022–2029 (USD MILLION)
  • TABLE 134 PRODUCT APPROVALS IN EUROPEAN PATIENT MONITORING MARKET
  • TABLE 135 EUROPE: PATIENT MONITORING MARKET, BY COUNTRY, 2022–2029 (USD MILLION)
  • TABLE 136 EUROPE: PATIENT MONITORING MARKET, BY PRODUCT, 2022–2029 (USD MILLION)
  • TABLE 137 EUROPE: BLOOD GLUCOSE MONITORING DEVICES MARKET, BY TYPE, 2022–2029 (USD MILLION)
  • TABLE 138 EUROPE: CARDIAC MONITORING DEVICES MARKET, BY TYPE, 2022–2029 (USD MILLION)
  • TABLE 139 EUROPE: MULTIPARAMETER MONITORING DEVICES MARKET, BY TYPE, 2022–2029 (USD MILLION)
  • TABLE 140 EUROPE: RESPIRATORY MONITORING DEVICES MARKET, BY TYPE, 2022–2029 (USD MILLION)
  • TABLE 141 EUROPE: TEMPERATURE MONITORING DEVICES MARKET, BY TYPE, 2022–2029 (USD MILLION)
  • TABLE 142 EUROPE: HEMODYNAMIC/PRESSURE MONITORING DEVICES MARKET, BY TYPE, 2022–2029 (USD MILLION)
  • TABLE 143 EUROPE: FETAL & NEONATAL MONITORING DEVICES MARKET, BY TYPE, 2022–2029 (USD MILLION)
  • TABLE 144 EUROPE: NEUROMONITORING DEVICES MARKET, BY TYPE, 2022–2029 (USD MILLION)
  • TABLE 145 EUROPE: WEIGHT MONITORING DEVICES MARKET, BY TYPE, 2022–2029 (USD MILLION)
  • TABLE 146 EUROPE: PATIENT MONITORING MARKET, BY END USER, 2022–2029 (USD MILLION)
  • TABLE 147 GERMANY: PATIENT MONITORING MARKET, BY PRODUCT, 2022–2029 (USD MILLION)
  • TABLE 148 GERMANY: BLOOD GLUCOSE MONITORING DEVICES MARKET, BY TYPE, 2022–2029 (USD MILLION)
  • TABLE 149 GERMANY: CARDIAC MONITORING DEVICES MARKET, BY TYPE, 2022–2029 (USD MILLION)
  • TABLE 150 GERMANY: MULTIPARAMETER MONITORING DEVICES MARKET, BY TYPE, 2022–2029 (USD MILLION)
  • TABLE 151 GERMANY: RESPIRATORY MONITORING DEVICES MARKET, BY TYPE, 2022–2029 (USD MILLION)
  • TABLE 152 GERMANY: TEMPERATURE MONITORING DEVICES MARKET, BY TYPE, 2022–2029 (USD MILLION)
  • TABLE 153 GERMANY: HEMODYNAMIC/PRESSURE MONITORING DEVICES MARKET, BY TYPE, 2022–2029 (USD MILLION)
  • TABLE 154 GERMANY: FETAL & NEONATAL MONITORING DEVICES MARKET, BY TYPE, 2022–2029 (USD MILLION)
  • TABLE 155 GERMANY: NEUROMONITORING DEVICES MARKET, BY TYPE, 2022–2029 (USD MILLION)
  • TABLE 156 GERMANY: WEIGHT MONITORING DEVICES MARKET, BY TYPE, 2022–2029 (USD MILLION)
  • TABLE 157 UK: PATIENT MONITORING MARKET, BY PRODUCT, 2022–2029 (USD MILLION)
  • TABLE 158 UK: BLOOD GLUCOSE MONITORING DEVICES MARKET, BY TYPE, 2022–2029 (USD MILLION)
  • TABLE 159 UK: CARDIAC MONITORING DEVICES MARKET, BY TYPE, 2022–2029 (USD MILLION)
  • TABLE 160 UK: MULTIPARAMETER MONITORING DEVICES MARKET, BY TYPE, 2022–2029 (USD MILLION)
  • TABLE 161 UK: RESPIRATORY MONITORING DEVICES MARKET, BY TYPE, 2022–2029 (USD MILLION)
  • TABLE 162 UK: TEMPERATURE MONITORING DEVICES MARKET, BY TYPE, 2022–2029 (USD MILLION)
  • TABLE 163 UK: HEMODYNAMIC/PRESSURE MONITORING DEVICES MARKET, BY TYPE, 2022–2029 (USD MILLION)
  • TABLE 164 UK: FETAL & NEONATAL MONITORING DEVICES MARKET, BY TYPE, 2022–2029 (USD MILLION)
  • TABLE 165 UK: NEUROMONITORING DEVICES MARKET, BY TYPE, 2022–2029 (USD MILLION)
  • TABLE 166 UK: WEIGHT MONITORING DEVICES MARKET, BY TYPE, 2022–2029 (USD MILLION)
  • TABLE 167 FRANCE: PATIENT MONITORING MARKET, BY PRODUCT, 2022–2029 (USD MILLION)
  • TABLE 168 FRANCE: BLOOD GLUCOSE MONITORING DEVICES MARKET, BY TYPE, 2022–2029 (USD MILLION)
  • TABLE 169 FRANCE: CARDIAC MONITORING DEVICES MARKET, BY TYPE, 2022–2029 (USD MILLION)
  • TABLE 170 FRANCE: MULTIPARAMETER MONITORING DEVICES MARKET, BY TYPE, 2022–2029 (USD MILLION)
  • TABLE 171 FRANCE: RESPIRATORY MONITORING DEVICES MARKET, BY TYPE, 2022–2029 (USD MILLION)
  • TABLE 172 FRANCE: TEMPERATURE MONITORING DEVICES MARKET, BY TYPE, 2022–2029 (USD MILLION)
  • TABLE 173 FRANCE: HEMODYNAMIC/PRESSURE MONITORING DEVICES MARKET, BY TYPE, 2022–2029 (USD MILLION)
  • TABLE 174 FRANCE: FETAL & NEONATAL MONITORING DEVICES MARKET, BY TYPE, 2022–2029 (USD MILLION)
  • TABLE 175 FRANCE: NEUROMONITORING DEVICES MARKET, BY TYPE, 2022–2029 (USD MILLION)
  • TABLE 176 FRANCE: WEIGHT MONITORING DEVICES MARKET, BY TYPE, 2022–2029 (USD MILLION)
  • TABLE 177 ITALY: PATIENT MONITORING MARKET, BY PRODUCT, 2022–2029 (USD MILLION)
  • TABLE 178 ITALY: BLOOD GLUCOSE MONITORING DEVICES MARKET, BY TYPE, 2022–2029 (USD MILLION)
  • TABLE 179 ITALY: CARDIAC MONITORING DEVICES MARKET, BY TYPE, 2022–2029 (USD MILLION)
  • TABLE 180 ITALY: MULTIPARAMETER MONITORING DEVICES MARKET, BY TYPE, 2022–2029 (USD MILLION)
  • TABLE 181 ITALY: RESPIRATORY MONITORING DEVICES MARKET, BY TYPE, 2022–2029 (USD MILLION)
  • TABLE 182 ITALY: TEMPERATURE MONITORING DEVICES MARKET, BY TYPE, 2022–2029 (USD MILLION)
  • TABLE 183 ITALY: HEMODYNAMIC/PRESSURE MONITORING DEVICES MARKET, BY TYPE, 2022–2029 (USD MILLION)
  • TABLE 184 ITALY: FETAL & NEONATAL MONITORING DEVICES MARKET, BY TYPE, 2022–2029 (USD MILLION)
  • TABLE 185 ITALY: NEUROMONITORING DEVICES MARKET, BY TYPE, 2022–2029 (USD MILLION)
  • TABLE 186 ITALY: WEIGHT MONITORING DEVICES MARKET, BY TYPE, 2022–2029 (USD MILLION)
  • TABLE 187 SPAIN: PATIENT MONITORING MARKET, BY PRODUCT, 2022–2029 (USD MILLION)
  • TABLE 188 SPAIN: BLOOD GLUCOSE MONITORING DEVICES MARKET, BY TYPE, 2022–2029 (USD MILLION)
  • TABLE 189 SPAIN: CARDIAC MONITORING DEVICES MARKET, BY TYPE, 2022–2029 (USD MILLION)
  • TABLE 190 SPAIN: MULTIPARAMETER MONITORING DEVICES MARKET, BY TYPE, 2022–2029 (USD MILLION)
  • TABLE 191 SPAIN: RESPIRATORY MONITORING DEVICES MARKET, BY TYPE, 2022–2029 (USD MILLION)
  • TABLE 192 SPAIN: TEMPERATURE MONITORING DEVICES MARKET, BY TYPE, 2022–2029 (USD MILLION)
  • TABLE 193 SPAIN: HEMODYNAMIC/PRESSURE MONITORING DEVICES MARKET, BY TYPE, 2022–2029 (USD MILLION)
  • TABLE 194 SPAIN: FETAL & NEONATAL MONITORING DEVICES MARKET, BY TYPE, 2022–2029 (USD MILLION)
  • TABLE 195 SPAIN: NEUROMONITORING DEVICES MARKET, BY TYPE, 2022–2029 (USD MILLION)
  • TABLE 196 SPAIN: WEIGHT MONITORING DEVICES MARKET, BY TYPE, 2022–2029 (USD MILLION)
  • TABLE 197 KEY MERGERS & ACQUISITIONS AND PARTNERSHIPS IN PATIENT MONITORING MARKET IN ROE
  • TABLE 198 REST OF EUROPE: PATIENT MONITORING MARKET, BY PRODUCT, 2022–2029 (USD MILLION)
  • TABLE 199 REST OF EUROPE: BLOOD GLUCOSE MONITORING DEVICES MARKET, BY TYPE, 2022–2029 (USD MILLION)
  • TABLE 200 REST OF EUROPE: CARDIAC MONITORING DEVICES MARKET, BY TYPE, 2022–2029 (USD MILLION)
  • TABLE 201 REST OF EUROPE: MULTIPARAMETER MONITORING DEVICES MARKET, BY TYPE, 2022–2029 (USD MILLION)
  • TABLE 202 REST OF EUROPE: RESPIRATORY MONITORING DEVICES MARKET, BY TYPE, 2022–2029 (USD MILLION)
  • TABLE 203 REST OF EUROPE: TEMPERATURE MONITORING DEVICES MARKET, BY TYPE, 2022–2029 (USD MILLION)
  • TABLE 204 REST OF EUROPE: HEMODYNAMIC/PRESSURE MONITORING DEVICES MARKET, BY TYPE, 2022–2029 (USD MILLION)
  • TABLE 205 REST OF EUROPE: FETAL & NEONATAL MONITORING DEVICES MARKET, BY TYPE, 2022–2029 (USD MILLION)
  • TABLE 206 REST OF EUROPE: NEUROMONITORING DEVICES MARKET, BY TYPE, 2022–2029 (USD MILLION)
  • TABLE 207 REST OF EUROPE: WEIGHT MONITORING DEVICES MARKET, BY TYPE, 2022–2029 (USD MILLION)
  • TABLE 208 ASIA PACIFIC: PATIENT MONITORING MARKET, BY COUNTRY, 2022–2029 (USD MILLION)
  • TABLE 209 ASIA PACIFIC: PATIENT MONITORING MARKET, BY PRODUCT, 2022–2029 (USD MILLION)
  • TABLE 210 ASIA PACIFIC: BLOOD GLUCOSE MONITORING DEVICES MARKET, BY TYPE, 2022–2029 (USD MILLION)
  • TABLE 211 ASIA PACIFIC: CARDIAC MONITORING DEVICES MARKET, BY TYPE, 2022–2029 (USD MILLION)
  • TABLE 212 ASIA PACIFIC: MULTIPARAMETER MONITORING DEVICES MARKET, BY TYPE, 2022–2029 (USD MILLION)
  • TABLE 213 ASIA PACIFIC: RESPIRATORY MONITORING DEVICES MARKET, BY TYPE, 2022–2029 (USD MILLION)
  • TABLE 214 ASIA PACIFIC: TEMPERATURE MONITORING DEVICES MARKET, BY TYPE, 2022–2029 (USD MILLION)
  • TABLE 215 ASIA PACIFIC: HEMODYNAMIC/PRESSURE MONITORING DEVICES MARKET, BY TYPE, 2022–2029 (USD MILLION)
  • TABLE 216 ASIA PACIFIC: FETAL & NEONATAL MONITORING DEVICES MARKET, BY TYPE, 2022–2029 (USD MILLION)
  • TABLE 217 ASIA PACIFIC: NEUROMONITORING DEVICES MARKET, BY TYPE, 2022–2029 (USD MILLION)
  • TABLE 218 ASIA PACIFIC: WEIGHT MONITORING DEVICES MARKET, BY TYPE, 2022–2029 (USD MILLION)
  • TABLE 219 ASIA PACIFIC: PATIENT MONITORING MARKET, BY END USER, 2022–2029 (USD MILLION)
  • TABLE 220 RECENT DEVELOPMENTS IN PATIENT MONITORING MARKET IN JAPAN
  • TABLE 221 JAPAN: PATIENT MONITORING MARKET, BY PRODUCT, 2022–2029 (USD MILLION)
  • TABLE 222 JAPAN: BLOOD GLUCOSE MONITORING DEVICES MARKET, BY TYPE, 2022–2029 (USD MILLION)
  • TABLE 223 JAPAN: CARDIAC MONITORING DEVICES MARKET, BY TYPE, 2022–2029 (USD MILLION)
  • TABLE 224 JAPAN: MULTIPARAMETER MONITORING DEVICES MARKET, BY TYPE, 2022–2029 (USD MILLION)
  • TABLE 225 JAPAN: RESPIRATORY MONITORING DEVICES MARKET, BY TYPE, 2022–2029 (USD MILLION)
  • TABLE 226 JAPAN: TEMPERATURE MONITORING DEVICES MARKET, BY TYPE, 2022–2029 (USD MILLION)
  • TABLE 227 JAPAN: HEMODYNAMIC/PRESSURE MONITORING DEVICES MARKET, BY TYPE, 2022–2029 (USD MILLION)
  • TABLE 228 JAPAN: FETAL & NEONATAL MONITORING DEVICES MARKET, BY TYPE, 2022–2029 (USD MILLION)
  • TABLE 229 JAPAN: NEUROMONITORING DEVICES MARKET, BY TYPE, 2022–2029 (USD MILLION)
  • TABLE 230 JAPAN: WEIGHT MONITORING DEVICES MARKET, BY TYPE, 2022–2029 (USD MILLION)
  • TABLE 231 RECENT DEVELOPMENTS IN PATIENT MONITORING MARKET IN CHINA
  • TABLE 232 CHINA: PATIENT MONITORING MARKET, BY PRODUCT, 2022–2029 (USD MILLION)
  • TABLE 233 CHINA: BLOOD GLUCOSE MONITORING DEVICES MARKET, BY TYPE, 2022–2029 (USD MILLION)
  • TABLE 234 CHINA: CARDIAC MONITORING DEVICES MARKET, BY TYPE, 2022–2029 (USD MILLION)
  • TABLE 235 CHINA: MULTIPARAMETER MONITORING DEVICES MARKET, BY TYPE, 2022–2029 (USD MILLION)
  • TABLE 236 CHINA: RESPIRATORY MONITORING DEVICES MARKET, BY TYPE, 2022–2029 (USD MILLION)
  • TABLE 237 CHINA: TEMPERATURE MONITORING DEVICES MARKET, BY TYPE, 2022–2029 (USD MILLION)
  • TABLE 238 CHINA: HEMODYNAMIC/PRESSURE MONITORING DEVICES MARKET, BY TYPE, 2022–2029 (USD MILLION)
  • TABLE 239 CHINA: FETAL & NEONATAL MONITORING DEVICES MARKET, BY TYPE, 2022–2029 (USD MILLION)
  • TABLE 240 CHINA: NEUROMONITORING DEVICES MARKET, BY TYPE, 2022–2029 (USD MILLION)
  • TABLE 241 CHINA: WEIGHT MONITORING DEVICES MARKET, BY TYPE, 2022–2029 (USD MILLION)
  • TABLE 242 INDIA: PATIENT MONITORING MARKET, BY PRODUCT, 2022–2029 (USD MILLION)
  • TABLE 243 INDIA: BLOOD GLUCOSE MONITORING DEVICES MARKET, BY TYPE, 2022–2029 (USD MILLION)
  • TABLE 244 INDIA: CARDIAC MONITORING DEVICES MARKET, BY TYPE, 2022–2029 (USD MILLION)
  • TABLE 245 INDIA: MULTIPARAMETER MONITORING DEVICES MARKET, BY TYPE, 2022–2029 (USD MILLION)
  • TABLE 246 INDIA: RESPIRATORY MONITORING DEVICES MARKET, BY TYPE, 2022–2029 (USD MILLION)
  • TABLE 247 INDIA: TEMPERATURE MONITORING DEVICES MARKET, BY TYPE, 2022–2029 (USD MILLION)
  • TABLE 248 INDIA: HEMODYNAMIC/PRESSURE MONITORING DEVICES MARKET, BY TYPE, 2022–2029 (USD MILLION)
  • TABLE 249 INDIA: FETAL & NEONATAL MONITORING DEVICES MARKET, BY TYPE, 2022–2029 (USD MILLION)
  • TABLE 250 INDIA: NEUROMONITORING DEVICES MARKET, BY TYPE, 2022–2029 (USD MILLION)
  • TABLE 251 INDIA: WEIGHT MONITORING DEVICES MARKET, BY TYPE, 2022–2029 (USD MILLION)
  • TABLE 252 AUSTRALIA: PATIENT MONITORING MARKET, BY PRODUCT, 2022–2029 (USD MILLION)
  • TABLE 253 AUSTRALIA: BLOOD GLUCOSE MONITORING DEVICES MARKET, BY TYPE, 2022–2029 (USD MILLION)
  • TABLE 254 AUSTRALIA: CARDIAC MONITORING DEVICES MARKET, BY TYPE, 2022–2029 (USD MILLION)
  • TABLE 255 AUSTRALIA: MULTIPARAMETER MONITORING DEVICES MARKET, BY TYPE, 2022–2029 (USD MILLION)
  • TABLE 256 AUSTRALIA: RESPIRATORY MONITORING DEVICES MARKET, BY TYPE, 2022–2029 (USD MILLION)
  • TABLE 257 AUSTRALIA: TEMPERATURE MONITORING DEVICES MARKET, BY TYPE, 2022–2029 (USD MILLION)
  • TABLE 258 AUSTRALIA: HEMODYNAMIC/PRESSURE MONITORING DEVICES MARKET, BY TYPE, 2022–2029 (USD MILLION)
  • TABLE 259 AUSTRALIA: FETAL & NEONATAL MONITORING DEVICES MARKET, BY TYPE, 2022–2029 (USD MILLION)
  • TABLE 260 AUSTRALIA: NEUROMONITORING DEVICES MARKET, BY TYPE, 2022–2029 (USD MILLION)
  • TABLE 261 AUSTRALIA: WEIGHT MONITORING DEVICES MARKET, BY TYPE, 2022–2029 (USD MILLION)
  • TABLE 262 SOUTH KOREA: PATIENT MONITORING MARKET, BY PRODUCT, 2022–2029 (USD MILLION)
  • TABLE 263 SOUTH KOREA: BLOOD GLUCOSE MONITORING DEVICES MARKET, BY TYPE, 2022–2029 (USD MILLION)
  • TABLE 264 SOUTH KOREA: CARDIAC MONITORING DEVICES MARKET, BY TYPE, 2022–2029 (USD MILLION)
  • TABLE 265 SOUTH KOREA: MULTIPARAMETER MONITORING DEVICES MARKET, BY TYPE, 2022–2029 (USD MILLION)
  • TABLE 266 SOUTH KOREA: RESPIRATORY MONITORING DEVICES MARKET, BY TYPE, 2022–2029 (USD MILLION)
  • TABLE 267 SOUTH KOREA: TEMPERATURE MONITORING DEVICES MARKET, BY TYPE, 2022–2029 (USD MILLION)
  • TABLE 268 SOUTH KOREA: HEMODYNAMIC/PRESSURE MONITORING DEVICES MARKET, BY TYPE, 2022–2029 (USD MILLION)
  • TABLE 269 SOUTH KOREA: FETAL & NEONATAL MONITORING DEVICES MARKET, BY TYPE, 2022–2029 (USD MILLION)
  • TABLE 270 SOUTH KOREA: NEUROMONITORING DEVICES MARKET, BY TYPE, 2022–2029 (USD MILLION)
  • TABLE 271 SOUTH KOREA: WEIGHT MONITORING DEVICES MARKET, BY TYPE, 2022–2029 (USD MILLION)
  • TABLE 272 RECENT DEVELOPMENTS IN PATIENT MONITORING MARKET IN ROAPAC
  • TABLE 273 REST OF ASIA PACIFIC: PATIENT MONITORING MARKET, BY PRODUCT, 2022–2029 (USD MILLION)
  • TABLE 274 REST OF ASIA PACIFIC: BLOOD GLUCOSE MONITORING DEVICES MARKET, BY TYPE, 2022–2029 (USD MILLION)
  • TABLE 275 REST OF ASIA PACIFIC: CARDIAC MONITORING DEVICES MARKET, BY TYPE, 2022–2029 (USD MILLION)
  • TABLE 276 REST OF ASIA PACIFIC: MULTIPARAMETER MONITORING DEVICES MARKET, BY TYPE, 2022–2029 (USD MILLION)
  • TABLE 277 REST OF ASIA PACIFIC: RESPIRATORY MONITORING DEVICES MARKET, BY TYPE, 2022–2029 (USD MILLION)
  • TABLE 278 REST OF ASIA PACIFIC: TEMPERATURE MONITORING DEVICES MARKET, BY TYPE, 2022–2029 (USD MILLION)
  • TABLE 279 REST OF ASIA PACIFIC: HEMODYNAMIC/PRESSURE MONITORING DEVICES MARKET, BY TYPE, 2022–2029 (USD MILLION)
  • TABLE 280 REST OF ASIA PACIFIC: FETAL & NEONATAL MONITORING DEVICES MARKET, BY TYPE, 2022–2029 (USD MILLION)
  • TABLE 281 REST OF ASIA PACIFIC: NEUROMONITORING DEVICES MARKET, BY TYPE, 2022–2029 (USD MILLION)
  • TABLE 282 REST OF ASIA PACIFIC: WEIGHT MONITORING DEVICES MARKET, BY TYPE, 2022–2029 (USD MILLION)
  • TABLE 283 LATIN AMERICA: PATIENT MONITORING MARKET, BY COUNTRY, 2022–2029 (USD MILLION)
  • TABLE 284 LATIN AMERICA: PATIENT MONITORING MARKET, BY PRODUCT, 2022–2029 (USD MILLION)
  • TABLE 285 LATIN AMERICA: BLOOD GLUCOSE MONITORING DEVICES MARKET, BY TYPE, 2022–2029 (USD MILLION)
  • TABLE 286 LATIN AMERICA: CARDIAC MONITORING DEVICES MARKET, BY TYPE, 2022–2029 (USD MILLION)
  • TABLE 287 LATIN AMERICA: MULTIPARAMETER MONITORING DEVICES MARKET, BY TYPE, 2022–2029 (USD MILLION)
  • TABLE 288 LATIN AMERICA: RESPIRATORY MONITORING DEVICES MARKET, BY TYPE, 2022–2029 (USD MILLION)
  • TABLE 289 LATIN AMERICA: TEMPERATURE MONITORING DEVICES MARKET, BY TYPE, 2022–2029 (USD MILLION)
  • TABLE 290 LATIN AMERICA: HEMODYNAMIC/PRESSURE MONITORING DEVICES MARKET, BY TYPE, 2022–2029 (USD MILLION)
  • TABLE 291 LATIN AMERICA: FETAL & NEONATAL MONITORING DEVICES MARKET, BY TYPE, 2022–2029 (USD MILLION)
  • TABLE 292 LATIN AMERICA: NEUROMONITORING DEVICES MARKET, BY TYPE, 2022–2029 (USD MILLION)
  • TABLE 293 LATIN AMERICA: WEIGHT MONITORING DEVICES MARKET, BY TYPE, 2022–2029 (USD MILLION)
  • TABLE 294 LATIN AMERICA: PATIENT MONITORING MARKET, BY END USER, 2022–2029 (USD MILLION)
  • TABLE 295 BRAZIL: PATIENT MONITORING MARKET, BY PRODUCT, 2022–2029 (USD MILLION)
  • TABLE 296 BRAZIL: BLOOD GLUCOSE MONITORING DEVICES MARKET, BY TYPE, 2022–2029 (USD MILLION)
  • TABLE 297 BRAZIL: CARDIAC MONITORING DEVICES MARKET, BY TYPE, 2022–2029 (USD MILLION)
  • TABLE 298 BRAZIL: MULTIPARAMETER MONITORING DEVICES MARKET, BY TYPE, 2022–2029 (USD MILLION)
  • TABLE 299 BRAZIL: RESPIRATORY MONITORING DEVICES MARKET, BY TYPE, 2022–2029 (USD MILLION)
  • TABLE 300 BRAZIL: TEMPERATURE MONITORING DEVICES MARKET, BY TYPE, 2022–2029 (USD MILLION)
  • TABLE 301 BRAZIL: HEMODYNAMIC/PRESSURE MONITORING DEVICES MARKET, BY TYPE, 2022–2029 (USD MILLION)
  • TABLE 302 BRAZIL: FETAL & NEONATAL MONITORING DEVICES MARKET, BY TYPE, 2022–2029 (USD MILLION)
  • TABLE 303 BRAZIL: NEUROMONITORING DEVICES MARKET, BY TYPE, 2022–2029 (USD MILLION)
  • TABLE 304 BRAZIL: WEIGHT MONITORING DEVICES MARKET, BY TYPE, 2022–2029 (USD MILLION)
  • TABLE 305 MEXICO: PATIENT MONITORING MARKET, BY PRODUCT, 2022–2029 (USD MILLION)
  • TABLE 306 MEXICO: BLOOD GLUCOSE MONITORING DEVICES MARKET, BY TYPE, 2022–2029 (USD MILLION)
  • TABLE 307 MEXICO: CARDIAC MONITORING DEVICES MARKET, BY TYPE, 2022–2029 (USD MILLION)
  • TABLE 308 MEXICO: MULTIPARAMETER MONITORING DEVICES MARKET, BY TYPE, 2022–2029 (USD MILLION)
  • TABLE 309 MEXICO: RESPIRATORY MONITORING DEVICES MARKET, BY TYPE, 2022–2029 (USD MILLION)
  • TABLE 310 MEXICO: TEMPERATURE MONITORING DEVICES MARKET, BY TYPE, 2022–2029 (USD MILLION)
  • TABLE 311 MEXICO: HEMODYNAMIC/PRESSURE MONITORING DEVICES MARKET, BY TYPE, 2022–2029 (USD MILLION)
  • TABLE 312 MEXICO: FETAL & NEONATAL MONITORING DEVICES MARKET, BY TYPE, 2022–2029 (USD MILLION)
  • TABLE 313 MEXICO: NEUROMONITORING DEVICES MARKET, BY TYPE, 2022–2029 (USD MILLION)
  • TABLE 314 MEXICO: WEIGHT MONITORING DEVICES MARKET, BY TYPE, 2022–2029 (USD MILLION)
  • TABLE 315 REST OF LATIN AMERICA: PATIENT MONITORING MARKET, BY PRODUCT, 2022–2029 (USD MILLION)
  • TABLE 316 REST OF LATIN AMERICA: BLOOD GLUCOSE MONITORING DEVICES MARKET, BY TYPE, 2022–2029 (USD MILLION)
  • TABLE 317 REST OF LATIN AMERICA: CARDIAC MONITORING DEVICES MARKET, BY TYPE, 2022–2029 (USD MILLION)
  • TABLE 318 REST OF LATIN AMERICA: MULTIPARAMETER MONITORING DEVICES MARKET, BY TYPE, 2022–2029 (USD MILLION)
  • TABLE 319 REST OF LATIN AMERICA: RESPIRATORY MONITORING DEVICES MARKET, BY TYPE, 2022–2029 (USD MILLION)
  • TABLE 320 REST OF LATIN AMERICA: TEMPERATURE MONITORING DEVICES MARKET, BY TYPE, 2022–2029 (USD MILLION)
  • TABLE 321 REST OF LATIN AMERICA: HEMODYNAMIC/PRESSURE MONITORING DEVICES MARKET, BY TYPE, 2022–2029 (USD MILLION)
  • TABLE 322 REST OF LATIN AMERICA: FETAL & NEONATAL MONITORING DEVICES MARKET, BY TYPE, 2022–2029 (USD MILLION)
  • TABLE 323 REST OF LATIN AMERICA: NEUROMONITORING DEVICES MARKET, BY TYPE, 2022–2029 (USD MILLION)
  • TABLE 324 REST OF LATIN AMERICA: WEIGHT MONITORING DEVICES MARKET, BY TYPE, 2022–2029 (USD MILLION)
  • TABLE 325 MIDDLE EAST & AFRICA: PATIENT MONITORING MARKET, BY PRODUCT, 2022–2029 (USD MILLION)
  • TABLE 326 MIDDLE EAST & AFRICA: BLOOD GLUCOSE MONITORING DEVICES MARKET, BY TYPE, 2022–2029 (USD MILLION)
  • TABLE 327 MIDDLE EAST & AFRICA: CARDIAC MONITORING DEVICES MARKET, BY TYPE, 2022–2029 (USD MILLION)
  • TABLE 328 MIDDLE EAST & AFRICA: MULTIPARAMETER MONITORING DEVICES MARKET, BY TYPE, 2022–2029 (USD MILLION)
  • TABLE 329 MIDDLE EAST & AFRICA: RESPIRATORY MONITORING DEVICES MARKET, BY TYPE, 2022–2029 (USD MILLION)
  • TABLE 330 MIDDLE EAST & AFRICA: TEMPERATURE MONITORING DEVICES MARKET, BY TYPE, 2022–2029 (USD MILLION)
  • TABLE 331 MIDDLE EAST & AFRICA: HEMODYNAMIC/PRESSURE MONITORING DEVICES MARKET, BY TYPE, 2022–2029 (USD MILLION)
  • TABLE 332 MIDDLE EAST & AFRICA: FETAL & NEONATAL MONITORING DEVICES MARKET, BY TYPE, 2022–2029 (USD MILLION)
  • TABLE 333 MIDDLE EAST & AFRICA: NEUROMONITORING DEVICES MARKET, BY TYPE, 2022–2029 (USD MILLION)
  • TABLE 334 MIDDLE EAST & AFRICA: WEIGHT MONITORING DEVICES MARKET, BY TYPE, 2022–2029 (USD MILLION)
  • TABLE 335 MIDDLE EAST & AFRICA: PATIENT MONITORING MARKET, BY END USER, 2022–2029 (USD MILLION)
  • TABLE 336 PATIENT MONITORING MARKET: DEGREE OF COMPETITION
  • TABLE 337 PRODUCT FOOTPRINT (20 COMPANIES)
  • TABLE 338 END USER FOOTPRINT (20 COMPANIES)
  • TABLE 339 REGIONAL FOOTPRINT (20 COMPANIES)
  • TABLE 340 PATIENT MONITORING MARKET: DETAILED LIST OF KEY EMERGING PLAYERS/STARTUPS
  • TABLE 341 PATIENT MONITORING MARKET: COMPETITIVE BENCHMARKING OF KEY EMERGING PLAYERS/STARTUPS
  • TABLE 342 PATIENT MONITORING MARKET: PRODUCT LAUNCHES & APPROVALS, JANUARY 2021–OCTOBER 2023
  • TABLE 343 PATIENT MONITORING MARKET: DEALS, JANUARY 2021–FEBRUARY 2024
  • TABLE 344 MEDTRONIC PLC: COMPANY OVERVIEW
  • TABLE 345 MEDTRONIC PLC: PRODUCTS OFFERED
  • TABLE 346 MEDTRONIC PLC: PRODUCT LAUNCHES & APPROVALS
  • TABLE 347 MEDTRONIC PLC: DEALS
  • TABLE 348 ABBOTT LABORATORIES: COMPANY OVERVIEW
  • TABLE 349 ABBOTT LABORATORIES: PRODUCTS OFFERED
  • TABLE 350 ABBOTT LABORATORIES: PRODUCT LAUNCHES & APPROVALS
  • TABLE 351 ABBOTT LABORATORIES: DEALS
  • TABLE 352 DEXCOM, INC.: COMPANY OVERVIEW
  • TABLE 353 DEXCOM, INC.: PRODUCTS OFFERED
  • TABLE 354 DEXCOM, INC.: PRODUCT LAUNCHES & APPROVALS
  • TABLE 355 GE HEALTHCARE: COMPANY OVERVIEW
  • TABLE 356 GE HEALTHCARE: PRODUCTS OFFERED
  • TABLE 357 GE HEALTHCARE: PRODUCT LAUNCHES & APPROVALS
  • TABLE 358 GE HEALTHCARE: DEALS
  • TABLE 359 PHILIPS HEALTHCARE: COMPANY OVERVIEW
  • TABLE 360 PHILIPS HEALTHCARE: PRODUCTS OFFERED
  • TABLE 361 PHILIPS HEALTHCARE: PRODUCT LAUNCHES & APPROVALS
  • TABLE 362 PHILIPS HEALTHCARE: DEALS
  • TABLE 363 NIHON KOHDEN CORPORATION: COMPANY OVERVIEW
  • TABLE 364 NIHON KOHDEN CORPORATION: PRODUCTS OFFERED
  • TABLE 365 NIHON KOHDEN CORPORATION: PRODUCT LAUNCHES & APPROVALS
  • TABLE 366 MINDRAY MEDICAL INTERNATIONAL LTD.: COMPANY OVERVIEW
  • TABLE 367 MINDRAY MEDICAL INTERNATIONAL LTD.: PRODUCTS OFFERED
  • TABLE 368 MINDRAY MEDICAL INTERNATIONAL LTD.: PRODUCT LAUNCHES & APPROVALS
  • TABLE 369 MINDRAY MEDICAL INTERNATIONAL LTD.: DEALS
  • TABLE 370 EDWARDS LIFESCIENCES CORPORATION: COMPANY OVERVIEW
  • TABLE 371 EDWARDS LIFESCIENCES CORPORATION: PRODUCTS OFFERED
  • TABLE 372 GETINGE AB: COMPANY OVERVIEW
  • TABLE 373 GETINGE AB: PRODUCTS OFFERED
  • TABLE 374 GETINGE AB: PRODUCT LAUNCHES & APPROVALS
  • TABLE 375 GETINGE AB: DEALS
  • TABLE 376 BAXTER INTERNATIONAL: COMPANY OVERVIEW
  • TABLE 377 BAXTER INTERNATIONAL: PRODUCTS OFFERED
  • TABLE 378 BAXTER INTERNATIONAL: PRODUCT LAUNCHES, ENHANCEMENTS, AND APPROVALS
  • TABLE 379 BAXTER INTERNATIONAL: DEALS
  • TABLE 380 DRÄGERWERK AG & CO. KGAA: COMPANY OVERVIEW
  • TABLE 381 DRÄGERWERK AG & CO. KGAA: PRODUCTS OFFERED
  • TABLE 382 BOSTON SCIENTIFIC CORPORATION: COMPANY OVERVIEW
  • TABLE 383 BOSTON SCIENTIFIC CORPORATION: PRODUCTS OFFERED
  • TABLE 384 BOSTON SCIENTIFIC CORPORATION: PRODUCT LAUNCHES & APPROVALS
  • TABLE 385 BOSTON SCIENTIFIC CORPORATION: DEALS
  • TABLE 386 MASIMO CORPORATION: COMPANY OVERVIEW
  • TABLE 387 MASIMO CORPORATION: PRODUCTS OFFERED
  • TABLE 388 MASIMO CORPORATION: PRODUCT LAUNCHES & APPROVALS
  • TABLE 389 MASIMO CORPORATION: DEALS
  • TABLE 390 OMRON CORPORATION: COMPANY OVERVIEW
  • TABLE 391 OMRON CORPORATION: PRODUCTS OFFERED
  • TABLE 392 OMRON CORPORATION: PRODUCT LAUNCHES & APPROVALS
  • TABLE 393 OMRON CORPORATION: DEALS
  • TABLE 394 ARCHIMED SAS (NATUS MEDICAL): BUSINESS OVERVIEW
  • TABLE 395 ARCHIMED SAS (NATUS MEDICAL): PRODUCTS OFFERED
  • TABLE 396 ARCHIMED SAS (NATUS MEDICAL): DEALS
  • TABLE 397 COMPUMEDICS LIMITED: BUSINESS OVERVIEW
  • TABLE 398 COMPUMEDICS LIMITED: PRODUCTS OFFERED
  • TABLE 399 COMPUMEDICS LIMITED: PRODUCT LAUNCHES & APPROVALS
  • TABLE 400 COMPUMEDICS LIMITED: DEALS
  • TABLE 401 NONIN MEDICAL, INC.: BUSINESS OVERVIEW
  • TABLE 402 NONIN MEDICAL, INC.: PRODUCTS OFFERED
  • TABLE 403 NONIN MEDICAL, INC.: PRODUCT LAUNCHES & APPROVALS
LIST OF FIGURES
 
  • FIGURE 1 KEY DATA FROM SECONDARY SOURCES
  • FIGURE 2 BREAKDOWN OF PRIMARY INTERVIEWS: SUPPLY-SIDE AND DEMAND-SIDE PARTICIPANTS
  • FIGURE 3 BREAKDOWN OF PRIMARY INTERVIEWS: BY COMPANY TYPE, DESIGNATION, AND REGION
  • FIGURE 4 RESEARCH METHODOLOGY: HYPOTHESIS BUILDING
  • FIGURE 5 PATIENT MONITORING MARKET SIZE ESTIMATION: APPROACH 1 (COMPANY REVENUE ESTIMATION)
  • FIGURE 6 PATIENT MONITORING MARKET SIZE ESTIMATION: BOTTOM-UP APPROACH
  • FIGURE 7 PATIENT MONITORING MARKET SIZE ESTIMATION: TOP-DOWN APPROACH
  • FIGURE 8 DATA TRIANGULATION METHODOLOGY
  • FIGURE 9 GROWTH PROJECTIONS WERE BASED ON REVENUE IMPACT OF KEY MACROINDICATORS
  • FIGURE 10 PATIENT MONITORING MARKET, BY PRODUCT, 2024 VS. 2029 (USD MILLION)
  • FIGURE 11 PATIENT MONITORING MARKET, BY END USER, 2024 VS. 2029 (USD MILLION)
  • FIGURE 12 GEOGRAPHICAL SNAPSHOT OF PATIENT MONITORING MARKET
  • FIGURE 13 GROWING ADOPTION OF WIRELESS MONITORING DEVICES TO DRIVE MARKET GROWTH
  • FIGURE 14 ASIA PACIFIC MARKET TO REGISTER HIGHEST GROWTH RATE DURING FORECAST PERIOD
  • FIGURE 15 HOSPITALS & CLINICS SEGMENT ACCOUNTED FOR LARGEST MARKET SHARE IN 2023
  • FIGURE 16 JAPAN TO REGISTER HIGHEST GROWTH RATE DURING FORECAST PERIOD
  • FIGURE 17 PATIENT MONITORING MARKET: DRIVERS, RESTRAINTS, OPPORTUNITIES, AND CHALLENGES
  • FIGURE 18 NUMBER OF DEALS & FUNDINGS IN PATIENT MONITORING MARKET, 2018-2022 (USD MILLION)
  • FIGURE 19 NUMBER OF INVESTOR DEALS IN PATIENT MONITORING MARKET, BY KEY PLAYER, 2018–2022
  • FIGURE 20 VALUE OF INVESTOR DEALS IN PATIENT MONITORING MARKET, BY KEY PLAYER, 2018–2022 (USD MILLION)
  • FIGURE 21 PATIENT MONITORING MARKET: VALUE CHAIN ANALYSIS
  • FIGURE 22 PATIENT MONITORING MARKET: SUPPLY CHAIN ANALYSIS
  • FIGURE 23 AVERAGE SELLING PRICE OF PATIENT MONITORING DEVICES, BY PRODUCT (FY 2021–2023)
  • FIGURE 24 AVERAGE SELLING PRICE TREND OF PATIENT MONITORING DEVICES, BY REGION, 2021–2023 (USD)
  • FIGURE 25 PATENT DETAILS FOR PATIENT MONITORING DEVICES (JANUARY 2013–DECEMBER 2023)
  • FIGURE 26 EMERGING TRENDS AND OPPORTUNITIES AFFECTING FUTURE REVENUE MIX
  • FIGURE 27 BUYING CRITERIA
  • FIGURE 28 INFLUENCE OF STAKEHOLDERS ON BUYING PROCESS OF PATIENT MONITORING DEVICES
  • FIGURE 29 NORTH AMERICA: PATIENT MONITORING MARKET SNAPSHOT
  • FIGURE 30 ASIA PACIFIC: PATIENT MONITORING MARKET SNAPSHOT
  • FIGURE 31 REVENUE ANALYSIS OF TOP PLAYERS IN PATIENT MONITORING MARKET, 2019–2023 (USD MILLION)
  • FIGURE 32 BLOOD GLUCOSE MONITORING DEVICES MARKET SHARE ANALYSIS, 2023
  • FIGURE 33 CARDIAC MONITORING DEVICES MARKET SHARE ANALYSIS, 2023
  • FIGURE 34 MULTIPARAMETER MONITORING DEVICES MARKET SHARE ANALYSIS, 2023
  • FIGURE 35 HEMODYNAMIC/PRESSURE MONITORING DEVICES MARKET SHARE ANALYSIS, 2023
  • FIGURE 36 FETAL & NEONATAL MONITORING DEVICES MARKET SHARE ANALYSIS, 2023
  • FIGURE 37 PATIENT MONITORING MARKET: COMPANY EVALUATION MATRIX (KEY PLAYERS), 2023
  • FIGURE 38 COMPANY FOOTPRINT (20 COMPANIES)
  • FIGURE 39 PATIENT MONITORING MARKET: COMPANY EVALUATION MATRIX (STARTUPS/SMES), 2023
  • FIGURE 40 EV/EBITDA OF KEY VENDORS
  • FIGURE 41 5-YEAR STOCK BETA OF KEY VENDORS
  • FIGURE 42 BRAND/PRODUCT COMPARATIVE ANALYSIS, BY MODEL (2023)
  • FIGURE 43 MEDTRONIC PLC: COMPANY SNAPSHOT (2023)
  • FIGURE 44 ABBOTT LABORATORIES: COMPANY SNAPSHOT (2022)
  • FIGURE 45 DEXCOM, INC.: COMPANY SNAPSHOT (2023)
  • FIGURE 46 GE HEALTHCARE: COMPANY SNAPSHOT (2023)
  • FIGURE 47 PHILIPS HEALTHCARE: COMPANY SNAPSHOT (2023)
  • FIGURE 48 NIHON KOHDEN CORPORATION: COMPANY SNAPSHOT (2023)
  • FIGURE 49 MINDRAY MEDICAL INTERNATIONAL LTD.: COMPANY SNAPSHOT (2022)
  • FIGURE 50 EDWARDS LIFESCIENCES CORPORATION: COMPANY SNAPSHOT (2023)
  • FIGURE 51 GETINGE AB.: COMPANY SNAPSHOT (2023)
  • FIGURE 52 BAXTER INTERNATIONAL: COMPANY SNAPSHOT (2023)
  • FIGURE 53 DRÄGERWERK AG & CO. KGAA: COMPANY SNAPSHOT (2023)
  • FIGURE 54 BOSTON SCIENTIFIC CORPORATION: COMPANY SNAPSHOT (2022)
  • FIGURE 55 MASIMO CORPORATION: COMPANY SNAPSHOT (2023)
  • FIGURE 56 OMRON CORPORATION: COMPANY SNAPSHOT (2022)
  • FIGURE 57 COMPUMEDICS LIMITED: COMPANY SNAPSHOT (2023)

This study involved the extensive use of both primary and secondary sources. The research process involved the study of various factors affecting the industry to identify the segmentation types, industry trends, key players, competitive landscape, key market dynamics, and key player strategies.

Secondary Research

The secondary research process involves the widespread use of secondary sources, directories, databases (such as Bloomberg Businessweek, Factiva, and D&B Hoovers), white papers, annual reports, company house documents, investor presentations, and SEC filings of companies. Secondary research was used to identify and collect information useful for the extensive, technical, market-oriented, and commercial study of the Patient monitoring market. It was also used to obtain important information about the key players and market classification & segmentation according to industry trends to the bottom-most level and key developments related to market and technology perspectives. A database of the key industry leaders was also prepared using secondary research.

Primary Research

In the primary research process, various sources from both the supply and demand sides were interviewed to obtain qualitative and quantitative information for this report. The primary sources from the supply side include industry experts such as CEOs, vice presidents, marketing and sales directors, technology & innovation directors, and related key executives from various key companies and organizations in product therapy markets. The primary sources from the demand side include medical OEMs, Analytical instrument OEMs, CDMOs, and service providers, among others. Primary research was conducted to validate the market segmentation, identify key players in the market, and gather insights on key industry trends & key market dynamics.

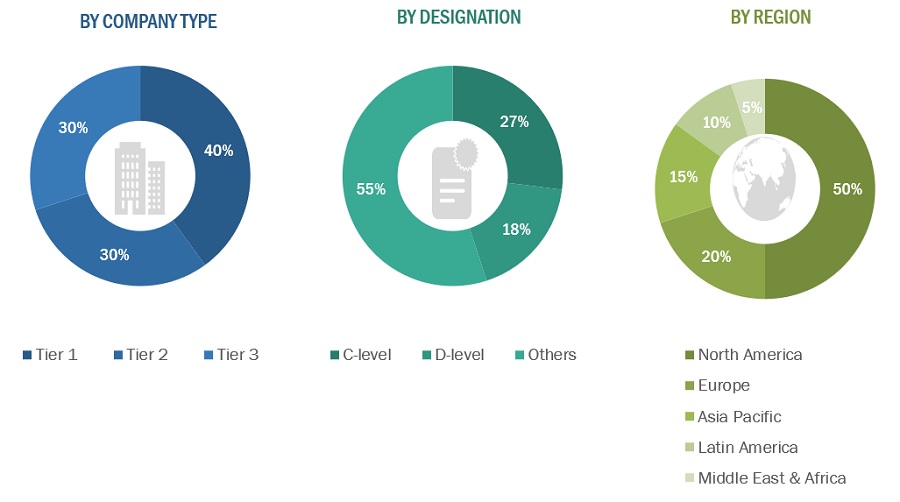
A breakdown of the primary respondents is provided below:
Patient  Monitoring Devices Market Size, and Share

*Others include sales managers, marketing managers, business development managers, product managers, distributors, and suppliers.

Note: Companies are classified into tiers based on their total revenue. As of 2021, Tier 1 = >USD 2 billion, Tier 2 = USD 50 million to USD 2 billion, and Tier 3 = <USD 50 million.

To know about the assumptions considered for the study, download the pdf brochure

Market Estimation Methodology

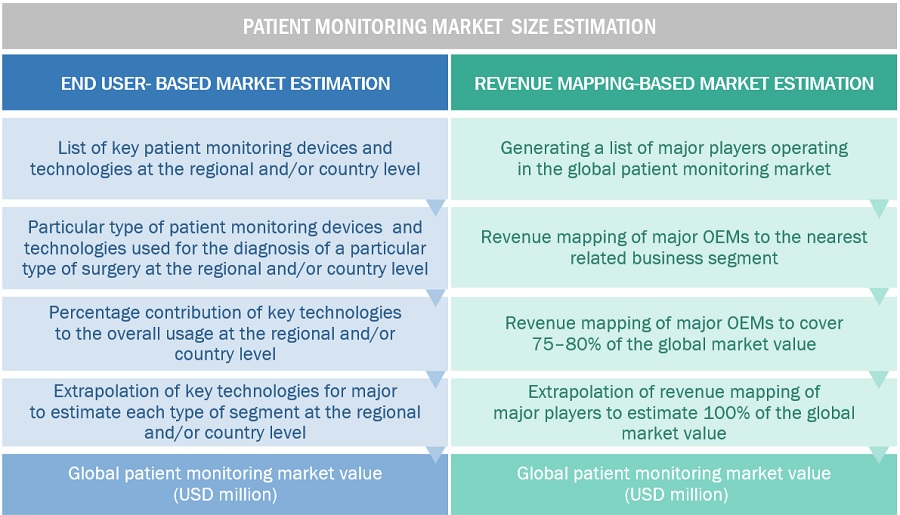
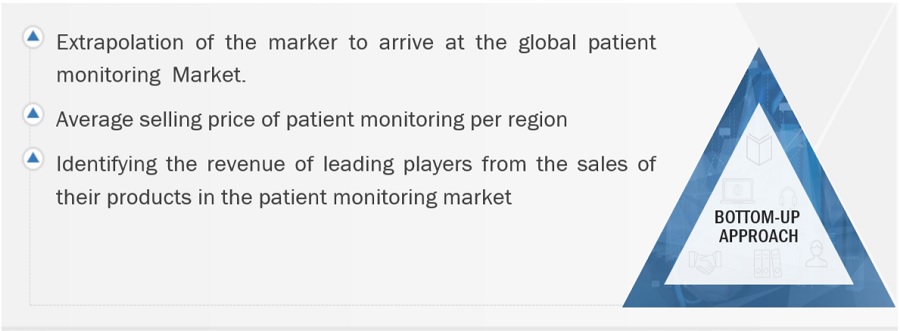
In this report, the patient monitoring market size was determined using the revenue share analysis of leading players. For this purpose, key players in the market were identified, and their revenues from the patient monitoring market business were determined through various insights gathered during the primary and secondary research phases. Secondary research included the study of the annual and financial reports of the top market players. In contrast, primary research included extensive interviews with key opinion leaders, such as CEOs, directors, and key marketing executives.

To calculate the global market value, segmental revenues were calculated based on the revenue mapping of major solution/service providers. This process involved the following steps:

  • Generating a list of major global players operating in the patient monitoring market.
  • Mapping annual revenues generated by major global players from the patient monitoring market(or nearest reported business unit/product category).
  • Revenue mapping of key players to cover a major share of the global market, as of 2022
  • Extrapolating the global value of the patient monitoring market.

Global Patient Monitoring Market: Bottom-Up Approach
Patient  Monitoring Devices Market Size, and Share

To know about the assumptions considered for the study, Request for Free Sample Report

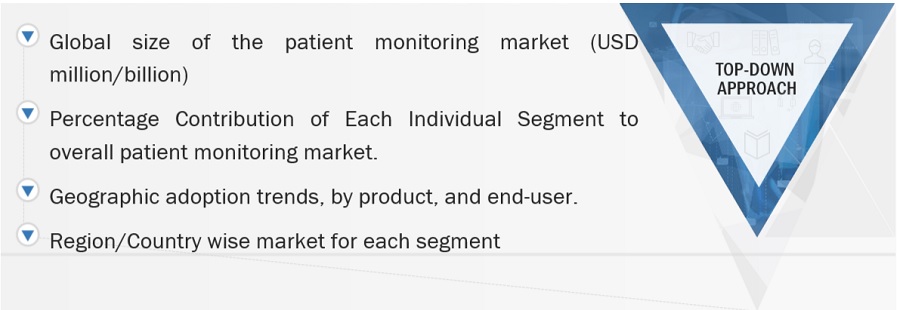
Global Patient Monitoring Market : Top-Down Approach
Patient  Monitoring Devices Market Size, and Share

Patient  Monitoring Devices Market Size, and Share

Data Triangulation

After arriving at the overall market size from the market size estimation process explained above, the patient monitoring market was split into segments and subsegments. Data triangulation and market breakdown procedures were employed to complete the overall market engineering process and arrive at the exact statistics for all segments and subsegments. The data was triangulated by studying various factors and trends from both the demand and supply sides. Additionally, the patient monitoring market was validated using both top-down and bottom-up approaches.

Market Definition

Patient monitoring involves continuously or intermittently observing and evaluating a patient's physiological parameters, vital signs, and clinical condition to track their health status and response to medical treatment. This process utilizes various medical devices and technologies to measure and track parameters such as heart rate, blood pressure, oxygen saturation, respiratory rate, temperature, and electrocardiography (ECG) readings. Modern patient monitoring systems utilize advanced medical devices, sensors, telemetry systems, and software platforms to capture, display, analyze, and transmit patient data in real-time.

Key Stakeholders

  • Manufacturers and distributors of patient monitoring devices
  • Healthcare institutions (Hospitals and clinics)
  • Ambulatory surgical centers
  • Healthcare institutions (hospitals and cardiac centers)
  • Research institutions
  • Research and consulting firms
  • Contract research organizations (CROs) and contract manufacturing organizations (CMOs)
  • Academic medical centers and universities
  • Market research and consulting firms
  • Clinical research organizations
  • Ambulatory Surgery Centers
  • Group Purchasing Organizations (GPOs)
  • Medical Research Laboratories
  • Academic Medical Centers and Universities
  • Accountable Care Organizations (ACOs)

Objectives of the Study

  • To define, describe, and forecast the patient monitoring market on Product and end user.
  • To provide detailed information regarding the major factors influencing the market growth (such as drivers, restraints, opportunities, and challenges).
  • To strategically analyze the micro markets concerning individual growth trends, prospects, and contributions to the total market.
  • To analyze the opportunities in the market for stakeholders and provide details of the competitive landscape for market leaders.
  • To profile the key market players and comprehensively analyze their market shares and core competencies.
  • To forecast the revenue of the market segments concerning five main regions, namely, North America (US and Canada), Europe (Germany, France, the UK, Italy, Spain, and Rest of Europe), the Asia Pacific (China, Japan, India, South Korea, Australia, and Rest of Asia Pacific), Latin America (Brazil, Mexico, and Rest of Latin America), and the Middle East & Africa.
  • To track and analyze competitive developments such as new product launches and approvals; agreements, partnerships, expansions, acquisitions; and collaborations in the patient monitoring market.

Available Customizations

With the given market data, MarketsandMarkets offers customizations as per the company’s specific needs. The following customization options are available for the present global patient monitoring market

Product Analysis

  • Product matrix, which gives a detailed comparison of the product portfolios of the top thirteen companies.

Company Information

  • Detailed analysis and profiling of additional market players (up to 15)

Geographic Analysis

  • Further breakdown of the Rest of Europe's patient monitoring market Russia, Belgium, the Netherlands, Switzerland, Austria, Finland, Sweden, Poland, and Portugal among other
  • Further breakdown of the Rest of Asia Pacific patient monitoring market Singapore, Taiwan, New Zealand, Philippines, Malaysia, and other APAC countries
  • Further breakdown of the Rest of the world patient monitoring market Latin America, MEA, and Africa

Previous Versions of this Report

Patient Monitoring Devices Market by Product (EEG, MEG, TCD, Pulse Oximeter, Spirometer, Fetal Monitor, Temperature Monitor, MCOT, ECG, ICP, ILRs, Multi-parameter Monitoring, Weight Monitoring), End-User (Hospital, ASCs) - Global Forecast to 2027

Report Code MD 2436
Published in Sep, 2022, By MarketsandMarkets™

Patient Monitoring Devices Market by Product (EEG, MEG, TCD, Pulse Oximeter, Spirometer, Fetal Monitor, Temperature Monitoring, MCOT, ECG, ICP, ILRs, Blood Glucose Monitoring, Blood Pressure Monitor), End-User (Hospitals, ASCs) - Global Forecast to 2025

Report Code MD 2436
Published in Oct, 2020, By MarketsandMarkets™

Patient Monitoring Device/System/Equipment Market by Product (EEG, EMG, MEG, TCD, Peak Flow Meter, Pulse Oximeter, Fetal Monitoring, Temperature Monitoring Devices, MCOT, ECG, Hemodynamic Monitoring System), End User (Home, Hospital) - Global Forecast to 2023

Report Code MD 2436
Published in May, 2018, By MarketsandMarkets™

Patient Monitoring Device/Equipment/System Market by Product (Blood Glucose, EEG, ECG, Capnography, Spirometer, Sleep Apnea, Pulse Oximeter, Fetal Doppler, Ultiparameter, Remote, Weight, Temperature), End-User (Hospitals, Home) - Global Forecast to 2020

Report Code MD 2436
Published in Jan, 2016, By MarketsandMarkets™

Patient Monitoring Device / Equipment / System Market by Product (Blood Glucose, EEG, ECG, Capnography, Spirometer, Sleep Apnea, Pulse Oximeter, Fetal Doppler, Multiparameter, Remote, Weight, Temperature), End-user (Hospitals, Home) - Global Forecast to 2018

Report Code MD 2436
Published in Apr, 2014, By MarketsandMarkets™

Patient Monitoring Device / Equipment / System Market by Product (Blood Glucose, EEG, ECG, Capnography, Spirometer, Sleep Apnea, Pulse Oximeter, Fetal Doppler, Multiparameter, Remote, Weight, Temperature), End-user (Hospitals, Home) - Global Forecast to 2018

Report Code MD 2436
Published in Apr, 2013, By MarketsandMarkets™
"Our USP is "providing game-changing business opportunities reports with free customization" - so please feel free to provide us with your specific areas of interest / business challenges in much greater detail !!"

We appreciate your interest in this report. Once you fill out the form, you'll be immediately directed to an exclusive solution tailored to your needs. This high-value offering can help boost your revenue by 30% - a must-see opportunity for anyone looking to maximize growth.


By clicking the "Submit" button, you are agreeing to the Terms of Use and Privacy Policy.

Custom Market Research Services

We Will Customise The Research For You, In Case The Report Listed Above Does Not Meet With Your Requirements

Get 10% Free Customisation

Growth opportunities and latent adjacency in Patient Monitoring Devices Market

DMCA.com Protection Status