
OTR Tires Market Size, Share & Analysis

OTR Tires Market by Application (Construction & Mining Equipment, Agriculture Tractors, ATVs, Industrial Equipment), Agriculture Tractor by Power Output, Tire Type (Radial, Solid, Bias), Rim Size, Retreading (Application & Process), Aftermarket, Region - Global Forecast to 2032


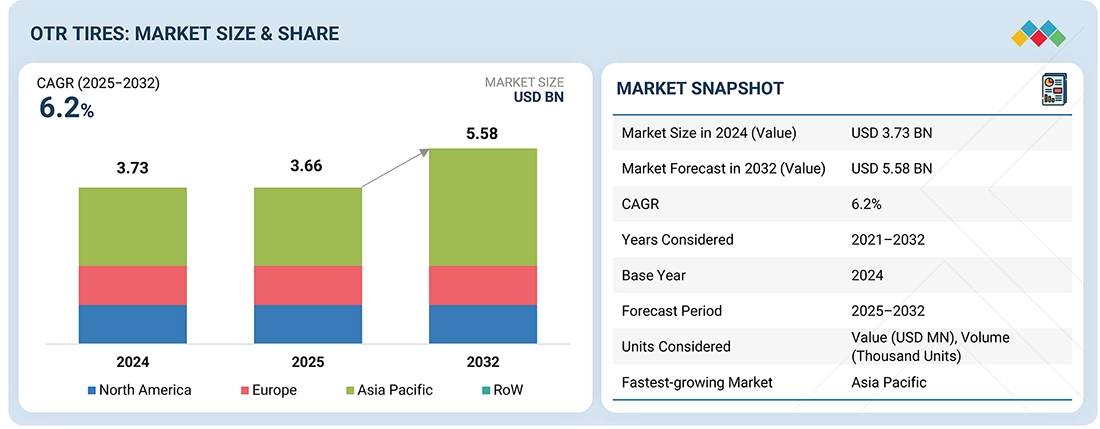
OVERVIEW
Source: Secondary Research, Interviews with Experts, MarketsandMarkets Analysis
The global OTR tires market is expected to grow from USD 3.66 billion in 2025 to USD 5.58 billion by 2032 at a CAGR of 6.2%. OEMs and fleet operators are increasingly adopting larger, high-load-bearing OTR tires designed to manage higher torque from electrified drivetrains and longer duty cycles in quarrying, aggregates, and heavy haul operations. The shift toward radialization and advanced compound formulations is improving performance by reducing rolling resistance, enhancing heat dissipation, and increasing tread life, which in turn boosts replacement demand. Integration of digitalized tire monitoring systems (TPMS/IoT) is becoming a key factor for operational efficiency. However, adoption faces challenges due to supply chain limitations in natural rubber and specialty materials, lengthy lead times for ultra-large sizes, and high replacement costs, which can delay procurement despite clear operational benefits.
KEY TAKEAWAYS
-
BY EQUIPMENT TYPERigid dump trucks dominate the OTR tires market in the equipment sector. It is crucial for heavy-duty mining and construction to increasingly adopt large-diameter radial OTR tires (320/85R24 to 800/70R38) for heat dissipation and load capacity. Growing mining and infrastructure projects in the Asia Pacific, Latin America, Australia, and Africa are boosting demand for high-capacity models like Caterpillar 797 and Komatsu HD785.
-
AGRICULTURE TRACTOR MARKET, BY POWER OUTPUT31–70 HP tractors dominate the OTR tires market with >80% demand from the Asia Pacific region, with China, India, and Japan contributing most of the demand. For 31–70 HP tractors, rear tire sizes 12.4–28, 13.6–28, and 14.9–28 dominate due to their balance of traction and cost efficiency, while front sizes like 7.50–16 and 8.3–20 are preferred for stability and maneuverability.
-
OTR TIRES MARKET FOR INDUSTRIAL EQUIPMENT, BY TYPEGrowing port and logistics activity makes container handlers the leading segment for industrial OTR tires in 2025. These radial tires, usually sized 12.00-24 to 16.00-25 inches, are built for heavy lifting and transportation in ports. Major projects like Italy’s Port of Genoa (USD 1B) and the Netherlands’ Port of Rotterdam (USD 1.1B) by 2026 are expected to increase demand for high-capacity container handlers and their specialized OTR tires.
-
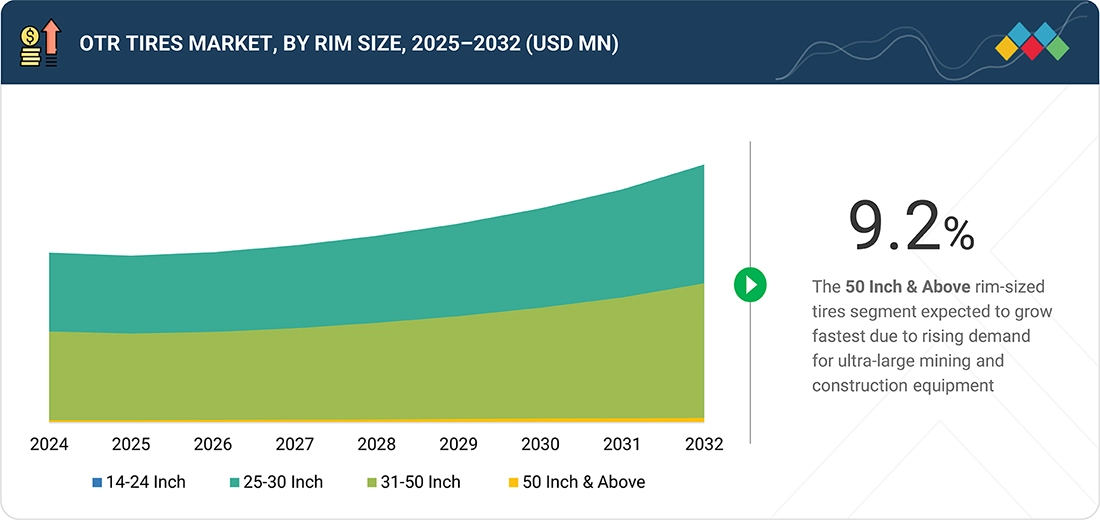
BY TIRE SIZEThe 25–30-inch rim size segment leads the OTR tire market, driven by demand in construction, agriculture, and industrial equipment for its durability, load capacity, and traction. Larger tires improve stability, flotation, and soil protection, aligning with trends toward bigger tractors and heavier machinery.
-
BY REGIONAsia Pacific is the largest market for OTR tires, driven by increasing capital infrastructure projects, construction activities, and a rise in construction and agriculture equipment sales.
-
COMPETITIVE LANDSCAPEThe OTR tires market has a few globally established players, such as Continental AG (Germany), Bridgestone Corporation (Japan), Michelin (France), and Pirelli (Italy). To maintain their market positions, they have expanded into various regions through partnership agreements, plant expansions, and acquisitions with other industry players.
The market growth is due to rising demand for construction, mining, agricultural, and industrial equipment. The increasing need for new infrastructure is expected to boost the demand for construction machinery and OTR tires worldwide.
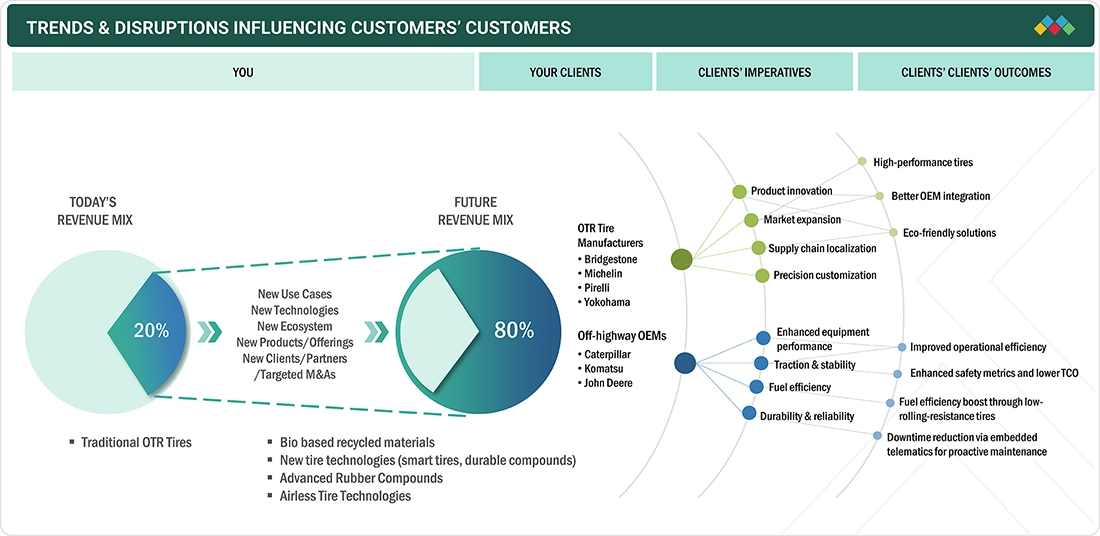
TRENDS & DISRUPTIONS IMPACTING CUSTOMERS' CUSTOMERS
The current revenue mix is dominated by traditional OTR tires used in off-highway vehicles, but it is shifting toward smart tires, advanced rubber compounds, and airless tire technologies. Short-term growth will come from advanced radial OTR tires with better heat dissipation, reinforced sidewalls, and low-pressure/high-flotation designs for construction, agriculture, and mining. At the same time, long-term opportunities include intelligent tires with embedded TPMS/IoT sensors, airless or hybrid tires, retreading innovations, and sustainable materials like bio-based elastomers and recycled rubber.
Source: Secondary Research, Interviews with Experts, MarketsandMarkets Analysis
MARKET DYNAMICS
Level
-
Infrastructure development and growth in construction and mining activities

-
Shift toward mechanization

Level
-
Commercial use of integrated advanced sensor-based technologies

-
Availability of low-cost tires from unorganized markets

Level
-
Focus on sustainable manufacturing techniques

-
Rising adoption of retreading method

Level
-
High R&D cost and regulatory compliance

Source: Secondary Research, Interviews with Experts, MarketsandMarkets Analysis
Driver: Infrastructure development and growth in construction and mining activities
Growing infrastructure, construction, and mining activities drive demand for OTR tires worldwide. India’s USD 138?billion 2025 infrastructure plan, Europe’s sustainable urbanization efforts, and expanding mining projects in Africa and Latin America contribute to the need for haul truck, loader, and excavator tires. At the same time, the shift to electric off-highway vehicles, supported by regulations like Australia’s New Vehicle Efficiency Standard and Europe’s strict emissions standards, is boosting demand for electric OTR tires in the construction and mining industries.
Restraint: Commercial use of integrated advanced sensor-based technologies
Advanced sensor-based tire monitoring systems like Goodyear’s Proactive Solutions TPMS, Bridgestone’s B-TAG, and Michelin’s MEMS Evolution3 extend OTR tire life by 10–15% and reduce failures by enabling predictive maintenance. While improving operational efficiency for fleet operators, these innovations decrease replacement frequency, which directly limits aftermarket demand and slows overall market growth.
Opportunity: Focus on sustainable manufacturing techniques
OTR tire OEMs like Bridgestone, Michelin, and Nokian Tyres are adopting recycled and bio-based materials (e.g., dandelion rubber, rice husk silica) and circular economy practices such as retreading to lower emissions, costs, and waste. Strict regulations, including the EU Green Deal’s 55% emissions reduction by 2030, the US EPA Clean Air Act standards, and India’s EPR guidelines, further encourage sustainable manufacturing, opening opportunities for innovation and competitive differentiation in the market.
Challenge: High R&D cost and regulatory compliance
OTR tire manufacturing requires significant R&D investment to develop specialized designs, advanced rubber compounds, and technologies like TPMS and CTIS, which increase costs by USD 15–30 per tire. Fluctuating raw material prices and diverse applications further escalate expenses. Stricter emission standards, such as Euro 7, compel OEMs to innovate with low-emission, durable tires, adding complexity and cost while challenging profitability.
OTR Tires Market: COMMERCIAL USE CASES ACROSS INDUSTRIES
| COMPANY | USE CASE DESCRIPTION | BENEFITS |
|---|---|---|
 |
Supply advanced rubber compounds, synthetic elastomers, and reinforcing materials (carbon black, silica) tailored for OTR tires to enhance durability, cut/heat resistance, and performance in harsh operating conditions | Improves tire lifespan, reduces replacement frequency, and enhances performance efficiency in mining, construction, and agriculture applications |
 |
Design and manufacture specialized OTR tires for mining trucks, loaders, tractors, and construction machinery with focus on traction, heat dissipation, and load-bearing capacity | Delivers higher productivity, safety, and operational reliability; supports OEM and aftermarket demand across multiple heavy-duty applications |
 |
Integrate OTR tires into farm tractors, combines, loaders, and mining trucks, ensuring compatibility with machine power, weight, and operating conditions | Optimizes machine performance, reduces downtime, and enhances operator safety and efficiency |
 |
Provide tire retreading and recycling services for worn-out OTR tires, extending their usable life and reducing total cost of ownership for operators | Lowers operational costs, supports sustainability goals, and reduces raw material dependence |
Logos and trademarks shown above are the property of their respective owners. Their use here is for informational and illustrative purposes only.
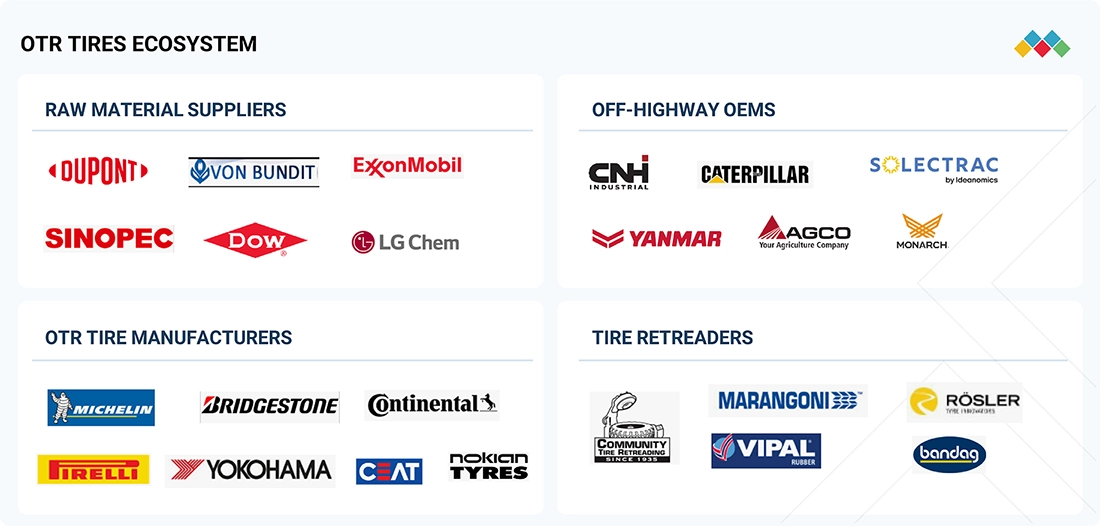
MARKET ECOSYSTEM
The ecosystem highlights various OTR tire market players, including raw material suppliers, OTR tire manufacturers, off-highway OEMs, and tire retreaders. The leading players in the OTR tire market are Bridgestone Corporation (Japan), Continental AG (Germany), Michelin (France), and Pirelli & C. S.p.A (Italy), among others, which offer advanced OTR tires with a strong distribution network worldwide.
Logos and trademarks shown above are the property of their respective owners. Their use here is for informational and illustrative purposes only.
MARKET SEGMENTS
Source: Secondary Research, Interviews with Experts, MarketsandMarkets Analysis
OTR Tires Market, By Tire Type
Radial tires dominate the OTR market because of their high performance and durability. They have a superior structural design that places cord plies at 90-degree angles to the direction of travel, creating a larger contact patch with the ground. This design improves traction, stability, load-carrying capacity, and overall performance. Additionally, radial OTR tires cost 10-30% more than bias tires due to their construction. In developed economies like Europe and North America, radial tires hold the largest market share. Meanwhile, emerging markets such as Asia Pacific and the Rest of the World are gradually shifting toward radial tires because of their benefits.
OTR Tires Market, By Application
Agricultural tractors is the fastest-growing segment of the OTR tires market due to rising global food demand, farming mechanization, and government support for modernizing agricultural equipment. Countries such as India, China, the US, Brazil, Germany, and Turkey have the highest sales volumes for farm tractors. In the Asia Pacific region, 31–70 HP tractors are in high demand because of limited farmland. Conversely, the US shows greater demand for < 30 HP tractors, while European countries prefer tractors above 130 HP due to the availability of large farmland. Farm tractors with lower HP typically use smaller front and larger rear OTR tires (e.g., Deere 5100ML: front 12.5/80-18, rear 19.5L-24), whereas higher HP tractors worldwide feature similar-sized OTR tires on both axles.
Construction Equipment OTR Tires Market, By Type
Solid tires are becoming more popular in the construction industry, especially for compact equipment like skid-steer loaders, RTLT telescopes, and small wheeled loaders. These tires are made from solid rubber or similar materials and provide several benefits over pneumatic tires, such as greater durability, puncture resistance, lower maintenance costs, and the ability to operate continuously with minimal downtime.
OTR Tires Retreading Market, By Process
The mold cure process leads OTR tire retreading because of its superior performance, durability, and cost efficiency, nearly matching new tire quality. Widely used in North America and Europe, it supports heavy-duty applications in construction and mining. Meanwhile, the Asia Pacific region is transitioning from pre-cure to mold cure, due to infrastructure growth. Major companies like Continental, Michelin, and Pirelli are expanding retreading operations, increasing efficiency and revenue in the segment.
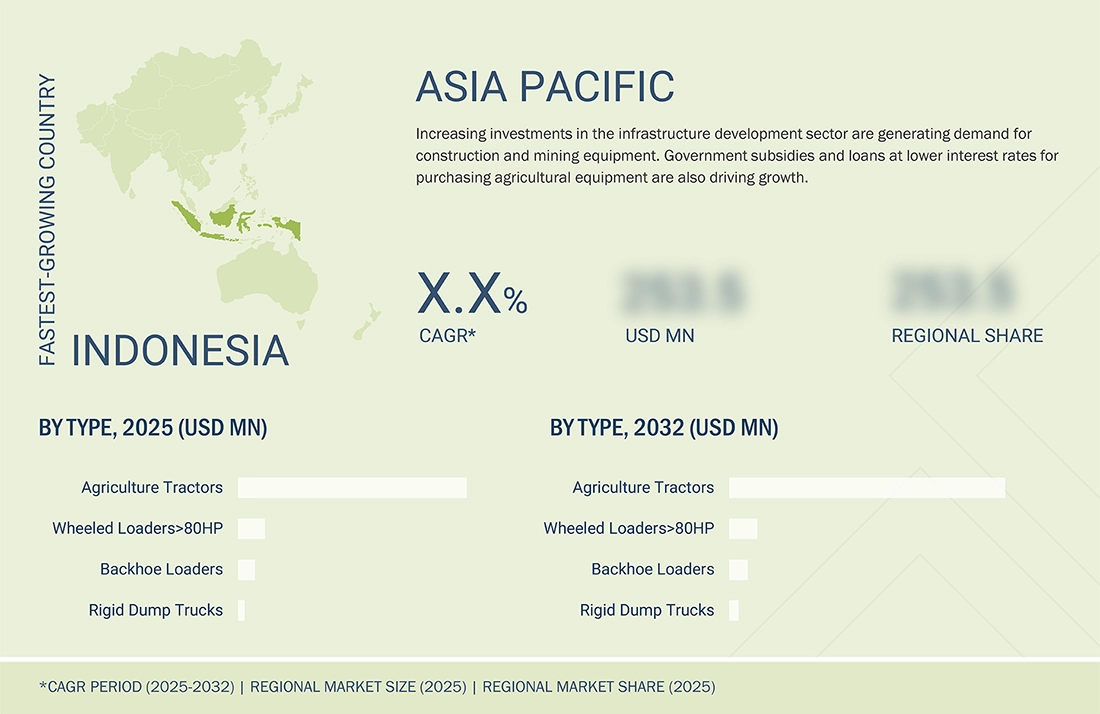
REGION
During the forecast period, Asia Pacific is expected to be the largest region in the global OTR tires market.
The Asia Pacific region leads the global OTR tires market, with countries like China, India, Japan, and South Korea playing key roles. Rapid urbanization in nations such as China and India for the electrification of off-highway vehicles has boosted demand for heavy-duty equipment with OTR tires. This region holds the largest market share for 25–30-inch OTR tires used in construction, mining, and agricultural tractors. All these factors are expected to drive higher demand for OTR tires in Asia Pacific. Investment in infrastructure development in the area has also increased the need for OTR tires. An article published by the Asian Development Bank in March 2025 states that countries in the region will invest USD 43 trillion annually from 2020 to 2035 in infrastructure projects, addressing infrastructure needs. These developments are likely to further raise the demand for OTR tires.
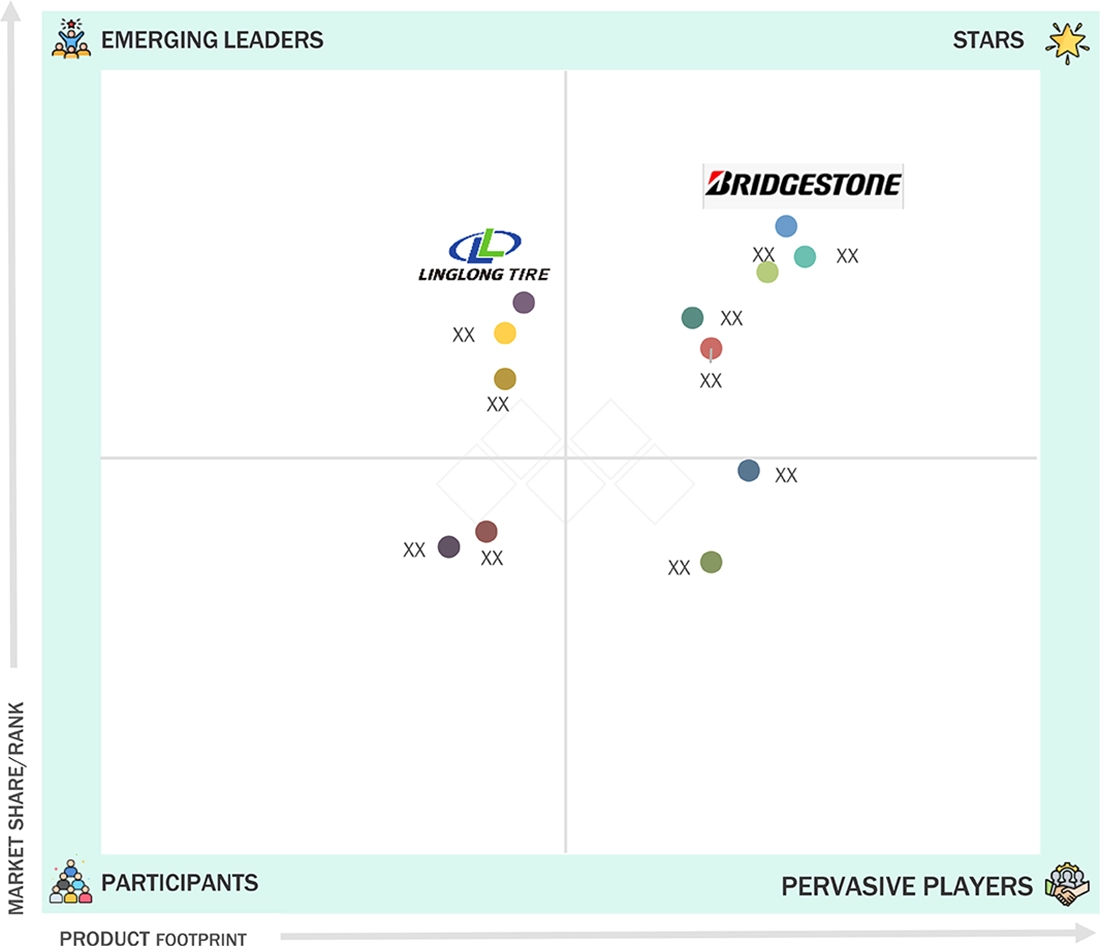
OTR Tires Market: COMPANY EVALUATION MATRIX
Bridgestone Corporation (Star) maintains a strong market presence and offers a wide range of products in the OTR tires market, enabling widespread adoption in construction and agriculture industries. Linglong Tires (Emerging Leader) is gaining traction with innovative OTR tire solutions that support various equipment types.
Source: Secondary Research, Interviews with Experts, MarketsandMarkets Analysis
KEY MARKET PLAYERS
MARKET SCOPE
| REPORT METRIC | DETAILS |
|---|---|
| Market Size in 2024 (Value) | 3.73 Billion |
| Market Forecast in 2032 (Value) | 5.58 Billion |
| Growth Rate | CAGR of 6.2% from 2025 to 2032 |
| Years Considered | 2021-2032 |
| Base Year | 2024 |
| Forecast Period | 2025-2032 |
| Units Considered | Value (USD Million), Volume (Thousand Units) |
| Report Coverage | Revenue forecast, company ranking, competitive landscape, growth factors, and trends |
| Segments Covered |
|
| Regional Scope | Asia Pacific, Europe, North America, and Rest of the World |
WHAT IS IN IT FOR YOU: OTR Tires Market REPORT CONTENT GUIDE
DELIVERED CUSTOMIZATIONS
We have successfully delivered the following deep-dive customizations:
| CLIENT REQUEST | CUSTOMIZATION DELIVERED | VALUE ADDS |
|---|---|---|
| Granular insights on the shift from standard OTR tires to specialized EV & sustainability-focused OTR tires | Detailed segmentation of OTR tires by application (construction, mining, agriculture, container handlers, rigid dump trucks) and by technology (radial, bias, sensor-integrated, sustainable compounds) | Enables clients to anticipate shifts in demand, align product strategies, and prioritize high-growth segments |
| Understand demand outlook for key OTR tire segments | In-depth market sizing and forecasting for standard and advanced OTR tire types, with regional breakdowns | Provides a clear roadmap for investment, R&D allocation, and market entry strategies |
| Segmented analysis of conventional vs. advanced OTR tire solutions | Comparative analysis of standard bias/radial tires vs. low rolling resistance, sensor-enabled, and sustainable compound tires | Supports portfolio optimization, product innovation, and differentiation in competitive markets |
| Clear view of shifting demand driven by electrification, sustainability mandates, and equipment optimization | Strategic foresight integrating regulatory trends, sustainability frameworks, and customer requirements | Enables strategic portfolio realignment, targeted R&D, and long-term competitiveness |
RECENT DEVELOPMENTS
- April 2025 : ZC Rubber introduced a new line of Off-The-Road (OTR) tires made for mining, construction, and industrial use. The tires focus on durability, load capacity, and better wear resistance. The new range includes both radial and bias tires built for tough operating conditions.
- February 2025 : The Goodyear Tire & Rubber Company completed the previously announced sale of its off-the-road (OTR) tire division to The Yokohama Rubber Company, Limited, valued at approximately USD 905 million.
- February 2025 : Triangle Tyre announced it will showcase its latest innovations in Off-The-Road (OTR) tires and Tire Pressure Monitoring Systems (TPMS) at Bauma 2025, highlighting advancements in durability, load capacity, and safety. The exhibit will feature tires designed for mining, construction, and port operations, along with TPMS solutions that improve efficiency and reduce downtime.
- September 2024 : Michelin introduced two new tire sizes, VF900/65R46 CFO and VF800/70R46 CFO, through an exclusive partnership with New Holland for the CR11 combine harvester. These tires, equipped with Michelin's ULTRAFLEX technology, reduce soil compaction, improve fuel efficiency, and boost productivity. The new sizes provide a 23% larger footprint, 7% lower ground pressure, and a 10 km/h cyclic load boost.
- April 2024 : Michelin introduced the MICHELIN XTRA DEFEND tire range, built for loaders and articulated dump trucks. This new tire provides an enhanced load capacity of up to 25,400 kg and a speed of up to 14 kph, making it ideal for high-productivity cycles in quarries. The range is offered in six sizes, features 50% more metal mass for increased durability, and offers improved versatility for loaders and dump trucks. The tire is also retreadable, increasing its cost-efficiency.
- March 2024 : Bridgestone Americas introduced its new VZT 25" construction tire at the AGG1 Expo in Nashville, Tennessee. The tire, made for loaders and graders, provides increased durability and better traction. The company also displayed its engineering solutions to improve productivity and lower operational costs. Bridgestone’s presence at the event underscores its commitment to sustainability through its E8 values.
Table of Contents
 Exclusive indicates content/data unique to MarketsandMarkets and not available with any competitors.
Methodology
Various secondary sources, directories, and databases have been used to identify and collect information for an extensive OTR tires market study. The study involved four main activities in estimating the current size of the market: secondary research, validation through primary research, assumptions, and market analysis. Exhaustive secondary research was carried out to collect information on the market, such as different rim sizes, OTR tire types, and upcoming technologies and trends. The next step was to validate these findings, assumptions, and market analysis with industry experts across the value chain through primary research. The top-down approach was employed to estimate the complete market size for different segments considered in this study.
Secondary Research
In the secondary research process, various secondary sources were used to identify and collect helpful information for an extensive commercial study of the OTR tires market. Secondary sources include company annual reports/presentations, press releases, industry association publications [such as publications on Committee for European Electric Off-highway Vehicle (CECE), Environmental Protection Agency (EPA), Agriculture Equipment Manufacturers Union (AXEMA), Association of Equipment Manufacturers (AEM), Italian Agricultural Machinery Manufacturers Federation (FEDERUNACOMA), Japan Agricultural Machinery Manufacturers Association (JAMMA), China Agricultural Machinery Distribution Association (CAMDA), VDMA (Verband Deutscher Maschinen- und Anlagenbau), Russian Association of Specialized Machinery and Equipment Manufacturers (ROSSPETSMASH), Brazilian Association of Industrial Machinery and Equipment (ABIMAQ), Agricultural Engineers Association (AEA), and the OTR tires related magazine articles, directories, technical handbooks, World Economic Outlook, trade websites, and technical articles. Additionally, secondary research and model mapping was carried out to understand the average cost of OTR tires, which come with different OTR tire rim sizes, and the historical sales of OTR tires.
Primary Research
In the primary research process, various primary sources from both the supply and demand sides were interviewed to obtain qualitative and quantitative information on the market. The primary sources from the supply side included industry experts such as CXOs, vice presidents, directors from business development, marketing, product development/innovation teams, and related key executives from various key companies. Various system integrators, industry associations, independent consultants/industry veterans, and key opinion leaders were also interviewed.
In the primary research process, various sources from both the supply and demand sides were interviewed to obtain qualitative and quantitative information for this report. The primary sources from the supply side include industry experts such as research and development experts, CEOs, CTOs, COOs, vice presidents, marketing directors, technology and innovation directors, and related key executives from different vital companies operating in the OTR tires market.
After the complete market engineering, which includes calculations for market statistics, market breakdown, market size estimations, market forecasting, and data triangulation, extensive primary research was conducted to gather information and verify and validate the critical numbers arrived at. Primary research was also undertaken to identify and validate the segmentation, industry trends, key players, competitive landscape, and market dynamics, such as drivers, restraints, opportunities, challenges, and key strategies. Extensive qualitative and quantitative analyses were performed on the complete market engineering process to list key information/insights throughout the report.
After interacting with industry experts, we also conducted brief sessions with highly experienced independent consultants to reinforce the findings from primary interviews. This, along with the opinions of in-house experts, led us to the conclusions described in the remainder of this report.

Note 1: Others include sales managers, marketing managers, and product managers.
Note 2: Tier 1 companies’ revenues are more than USD 10 billion; tier 2 companies’ revenues range between USD 1 and 10 billion; and tier 3 companies’ revenues range between USD 500 million and USD 1 billion.
Source: Industry Experts
To know about the assumptions considered for the study, download the pdf brochure
Market Size Estimation
A detailed market estimation approach was followed to estimate and validate the value and volume of the OTR tires market and other dependent submarkets, as mentioned below:
- The bottom-up approach was used to estimate and validate the size of the OTR tires market. The market size by application, in terms of volume, was derived by estimating the annual sales (units) of construction and mining equipment and agriculture tractors at the country level.
- The number of OTR tires in each application (construction and mining equipment, farm tractors, and others) was estimated through an indicative model mapping different OTR tire sizes, aspect ratio, horsepower, and rim sizes from secondary sources and validated through primary sources at a regional level.
- This was further multiplied by the regional-level sales and the number of tires used in each application (construction and mining equipment, agriculture tractors, industrial equipment, and ATVs).
- The market was projected based on various parameters such as analysis of historical data, market trends, and growth of drivers such as increasing off-highway equipment sales, an increase in infrastructural development activities, and growing aftermarket sales. The forecast was based on equipment sales, dependent on economic conditions and market demand. Also, with increased infrastructure and agricultural activities, the working hours for equipment increased. Factors like future infrastructure projects, investments, and farm mechanization rates were studied while estimating the aftermarket demand.
- The country-level OTR tires market by application (volume) was multiplied by the country-level average selling price (ASP) for each application to derive the market by value for each application.
- The summation of the country-level market would help derive the regional level. Then, further additions were provided to the global market through applications (construction and mining, agriculture tractors, industrial equipment, and ATVs). The total value of each country was then summed up to derive the total value of the market by application.
- All key macro indicators affecting the revenue growth of the market segments and subsegments were accounted for, viewed in extensive detail, verified through primary research, and analyzed to get the validated and verified quantitative and qualitative data.
- The market data was consolidated and added with detailed input, analyzed, and presented in this report.
OTR Tires Market : Top-Down and Bottom-Up Approach

Data Triangulation
After arriving at the overall market size of the global market through the methodology mentioned above, this market was split into several segments and subsegments. The data triangulation and market breakdown procedures were employed, wherever applicable, to complete the overall market engineering process and arrive at the exact data for the market by value for the key segments and subsegments. The extrapolated market data was triangulated by studying various macro indicators and regional trends from both the demand and supply-side participants.
Market Definition
OTR Tires: Tires used for OTR equipment are known as off-the-road (OTR) tires. These tires vary from automotive tires in size and durability. Tires used in off-highway equipment have a tread design with interlocked tread elements. This design offers the benefit of traction in various conditions, such as paved and gravel surfaces, mud, dirt, snow, and others. The OTR tires market study considers tires used in construction and mining equipment, agricultural tractors, and industrial equipment. The lifespan of off-highway tires is higher than that of automotive tires, and hence, these tires are more expensive. Retreading is done to recycle and reuse the tires for their optimum life span.
Retreading vs. Aftermarket:
- Retreading is defined as recycling the original tire casing and applying new treads to increase the service life of a tire. Retreading helps protect the environment by reducing oil consumption. The cost of retreading is less than the cost of a new tire. Hence, all commercial fleets and off-highway vehicles prefer retreading over replacement with new tires.
- The aftermarket or replacement market supplies new tires that replace a vehicle's original tires. The aftermarket is divided into Original Equipment Supplier (OES) and Independent Aftermarket (IAM). The cost of replacement tires is higher than that of retread tires.
Stakeholders
- Aftermarket and Tire Retreading Associations
- Construction, Mining, and Agriculture Equipment OEMs
- National and Regional Environmental Regulatory Agencies or Organizations
- Manufacturers of OTR Tires
- Organized and Unorganized Aftermarket Suppliers
- Raw Material Manufacturers of Tires/Tire Components (Suppliers for Tier I)
- Regional Manufacturers' Associations
- Tire Retreading Companies
- Traders, Distributors, and Suppliers of Tires, Tire Components, and Raw Materials
Report Objectives
- To define, describe, and forecast the off-the-road (OTR) tires market concerning individual growth trends and prospects, and determine the contribution of each segment to the total market.
- To forecast the OTR tires market size by volume and value based on
- Equipment Type (Articulated Dump Truck, Asphalt Finisher, Backhoe Loader, Motor Grader, Rigid Dump Truck, RTLT-Telescope, Skid-steer Loader, Wheeled Excavator, Wheeled Loader <80 HP, Wheeled Loader >80 HP, Agriculture Tractor, and Other Equipment Types)
- Agriculture Tractors Tires, By Power Output (<30 HP, 31–70 HP, 71–130 HP, 131–250 HP, and >250 HP)
- Agriculture Tractor Tracks, By Power Output (131–250 HP and >250 HP)
- Industrial Equipment By Type (Forklift, Tow Tractor, and Container Handler)
- Tire Type (Radial, Bias, and Solid)
- OTR Tires for Construction Equipment, By Tire Type (Radial, Bias, and Solid)
- Rim Size (14-24 Inches, 25-30 Inches, 31–50 Inches, and > 50 Inches)
- Retreading By Process (Pre-cure and Mold-cure)
- Retreading By Application (Construction and Mining Equipment and Agriculture Tractors)
- By Application (Construction and Mining Equipment, Agriculture Tractors, Industrial Equipment, and All-Terrain Vehicles)
- Aftermarket, By Equipment Type [Articulated Dump Truck, Asphalt Finisher, Backhoe Loader, Motor Grader, Rigid Dump Truck, RTLT-Telescope, Skid-steer Loader, Wheeled Excavator, Wheeled Loader (<80 HP), Wheeled Loader (>80 HP)]
- By Region - Asia Pacific (China, India, Japan, Australia, South Korea, Indonesia, and Rest of Asia Pacific), Europe (Germany, UK, France, Spain, Italy, Poland, Turkey, Russia, and Rest of Europe), North America (US, Canada, and Mexico), and Rest of the World (Brazil, Chile, Peru, Argentina, South Africa, UAE, Saudi Arabia)
- To provide detailed information regarding the major factors influencing the growth of the market (drivers, restraints, opportunities, and challenges)
- To understand the market dynamics (Drivers, Restraints, Opportunities, and Challenges) and conduct Patent Analysis, Pricing Analysis, Key Buying Criteria, Trade Analysis, Technology Analysis, ASP Analysis, Case Study Analysis, Supply Chain Analysis, Regulatory Analysis, Key Conference and Events, OEM Analysis, Bill of Materials, and Investment Scenario
- To analyze the market share of leading players in the OTR tires market and evaluate the competitive leadership mapping
- To understand the dynamics of the market players and distinguish them into stars, emerging leaders, pervasive players, and participants according to their product portfolio strength and business strategies
- To strategically analyze markets concerning individual growth trends, prospects, and contributions to the total market
- To analyze recent developments, such as partnerships, supply agreements, joint ventures/mergers and acquisitions, geographic expansions, and product developments of key players in the market
Available Customizations
OTR TIRES MARKET, BY ASPECT RATIO
- 28
- 30
- 34
- 38
- 42
- 46
- 50
OTR TIRES MARKET
- OEMs
- Aftermarkets
Key Questions Addressed by the Report
What is the current size of the OTR tires market?
The global OTR tires market is expected to grow from USD 3.66 billion in 2025 to USD 5.58 billion in 2032 at a CAGR of 6.2% during the forecast period.
Who are the top key players in the OTR tires market?
Global players dominate the OTR tires market, which also comprises several regional players, including Continental AG (Germany), Bridgestone Corporation (Japan), Michelin (France), The Yokohama Rubber Co., Ltd. (Japan), and Pirelli & C. S.p.A. (Italy).
What are the trends in the OTR tires market?
Wheeled loaders have the largest share by volume in the construction and mining equipment segment.
Industrial equipment is expected to be the fastest-growing application segment of the OTR tires market.
Radial tires hold the majority share of the market by tire type as OEMs move away from bias tires to improve safety.
Which are the most prominent factors driving the OTR tires market?
Growing infrastructural and mining activities around the world
Rising level of mechanization of agricultural equipment
What are the challenges faced by OTR tire manufacturers globally?
The stringent emission norms are the biggest challenge.
Need a Tailored Report?
Customize this report to your needs
Get 10% FREE Customization
Customize This ReportPersonalize This Research
- Triangulate with your Own Data
- Get Data as per your Format and Definition
- Gain a Deeper Dive on a Specific Application, Geography, Customer or Competitor
- Any level of Personalization
Let Us Help You
- What are the Known and Unknown Adjacencies Impacting the OTR Tires Market
- What will your New Revenue Sources be?
- Who will be your Top Customer; what will make them switch?
- Defend your Market Share or Win Competitors
- Get a Scorecard for Target Partners

Custom Market Research Services
We Will Customise The Research For You, In Case The Report Listed Above Does Not Meet With Your Requirements
Get 10% Free Customisation


Growth opportunities and latent adjacency in OTR Tires Market