Orthopedic Implants Market: Growth, Size, Share, and Trends

Report Code MD 9225
Published in Dec, 2024, By MarketsandMarkets™
Download PDF

Choose License Type

Buy Report Now Inquire Before Buying

Orthopedic Implants Market by Product (Knee, Hip, Elbow, Ankle, Shoulder, Foot, Wrist), Material (Metals: Stainless Steel, Titanium Alloy, Cobalt Chromium, Nitinol; Polymers, Ceramics, Hybrid), End user (Hospitals, ASCs, Trauma) - Global Forecast to 2029

Overview

The global orthopedic implants market, valued at US$20.13 billion in 2023, is forecasted to grow at a robust CAGR of 4.8%, reaching US$20.94 billion in 2024 and an impressive US$26.47 billion by 2029. Major drivers are the rising prevalence of orthopedic disorders, particularly among the aging population. In addition, strategies adopted by key market players, such as innovative product launches and collaborative efforts, are driving the growth of the market. Additionally, the increasing number of hospitals, disposable income, and access to healthcare services in emerging markets have further fueled the demand for orthopedic implants.

Orthopedic Implants Market

Attractive Opportunities in the Orthopedic Implants Market

North America

North America is expected to be the largest region in the market, owing to the high healthcare spending in the region, rising prevalence of orthopedic disorders, and presence of key players.

Market growth can be attributed to factors such as increasing prevalence of orthopedic disorders, Increasing demand for minimally invasive orthopedic surgical procedures, and rising number of sport injuries

Rising number of hospitals, the shift towards outpatient care, and advancements in robotic surgeries may create opportunities for market players in the next five years.

Europe is the second-largest market for orthopedic implants owing to rising need to curtail healthcare costs, and the rising prevalence of orthopedic disorders.

Emerging economies such as India and China offer several opportunities for market growth.

Global Orthopedic Implants Market Dynamics

DRIVER: Rising prevalence of orthopedic diseases and disorders

Demographic changes have led to an increase in the geriatric population worldwide. As per the UN report, the population aged 65 years or older was 727 million globally in 2020, which is expected to increase to 1.5 billion by 2050. Moreover, as per the US National Institute on Aging, the number of people over 65 is forecasted to rise twofold from 2005 to 2030. Such dynamics are reported in Japan, where it is anticipated that by 2060, about 40% of residents will be over 65 (source: WHO).

As bone-related disorders are more prevalent among the older generation, age-related bone disease is categorized under geriatric diseases. Osteoporosis, which refers to the loss of bone mass, is one of the most common bone diseases in the older population. There is a consistent decline in bone mass as people age. Transformation of the bone structure enhances the risk for osteoporosis and causes hip and vertebral compressive fractures in the older population. Per the CDC, every year, 300,000 patients in the 65 and above age group are hospitalized due to hip fractures in the US.

RESTRAINT: High cost of orthopedic surgery

Orthopedic treatments such as knee and hip replacement surgeries are expensive. Most of these treatments require complex materials, engineering precision, and innovative technologies. All of these factors increase costs. Post-surgery treatment and follow-ups add to the expense. This may limit access to these treatments, especially in areas with lower insurance coverage and disposable income. High costs also pose a challenge, as healthcare providers must balance affordability and longevity against implant quality. For example, knee replacement surgery is one of the most commonly performed and effective orthopedic surgeries; it is also expensive. The average cost of knee replacement in India ranges from USD 5,500 to USD 11,500. According to a report published by NCBI, robotic total knee replacement in the US in 2022 was 10% more expensive than traditional total knee replacement.


OPPORTUNITY: Advancements in robot-assisted surgery and 3D printing

Knee replacement surgeries are witnessing a rise worldwide. The increasing number of patients suffering from osteoarthritis supports the need for minimally invasive surgical solutions. Minimally invasive procedures use tiny incisions, resulting in less post-operative discomfort, faster recovery, and shorter hospital stays. Robot-assisted technology is implemented in tiny 3D cameras and dime-sized surgical instruments inserted inside the patient’s body, allowing orthopedic surgeons to view fine details in otherwise inaccessible surgical areas.

The high success rate of robot-assisted joint replacement surgery (approximately 95%) has been responsible for the surge in joint replacement surgeries. In November 2023, KIMS Hospital in the UK announced that it was now adding Stryker’s Mako Smart Robotics for total knee replacement. According to a study published in the Global Health Journal, 3D models created using 3D printing can aid in surgical planning and help reduce the overall development costs of implants used in orthopedic procedures. With 3D printing, or additive manufacturing, different 3D models of knees, hips, and shoulders can be used to create personalized implants for specific patients.

CHALLENGES: Dearth of skilled surgeons

The high prevalence of orthopedic diseases and the increasing number of surgical procedures are accelerating the requirement for specialists to treat orthopedic conditions. This is a significant limitation in the market, impacting the accessibility and availability of these highly specialized treatments. This shortage results in patients waiting long periods for surgery, reducing their acceptance rate for high-tech orthopedic implants. A shrinking workforce also puts pressure on the few surgeons available, which can negatively affect patient care and outcomes. According to the American Academy of Orthopaedic Surgeons report, the total number of knee replacement surgeries will increase to 3.5 million procedures annually in the US by 2030. The Health Resources and Services Administration has predicted that, by 2025, the US will experience a shortage of approximately 5,080 orthopedic surgeons.

Furthermore, many orthopedic surgeons are nearing retirement. Around 60% of active surgeons are over 55 and plan to retire in the US within the next 15 years (Source: AMN Healthcare Company Merritt Hawkins). According to the US CDC, hip replacements performed on individuals 45 and older rose from 138,700 to 310,800 in the first decade of this century. However, the rate of those procedures increased from 142 per 100,000 people to 257 per 100,000 (Source: CDC).

Global Orthopedic Implants Market Ecosystem Analysis

The orthopedic implants market has a dynamic ecosystem. The infographic includes all kinds of orthopedic implant providers, end users, and distributors in the market. The device manufacturers play a crucial role in developing innovative equipment based on various technologies. Distributors facilitate access to this equipment for different end users in the market. The ecosystem helps to streamline the product availability and supply chain.

Orthopedic Implants Market
 

By type, the knee implants segment accounted for the largest share in 2023.

Based on type, the market is segmented into knee, hip, elbow, shoulder, wrist, foot & ankle, and other implants. In 2023, the knee implants segment accounted for the largest market share of the orthopedic implants market. According to the American Academy of Orthopedic Surgeons, the incidence of knee osteoarthritis in the US was estimated at 240 per 100,000 people per year in 2021. The increasing prevalence of knee osteoarthritis (OA) and the significant rise in the incidence of knee injuries are driving the growth of the segment. The onset of symptoms of knee osteoarthritis in 2021 is 3.8% and is expected to increase by 10% in the 60-year population. Also, the development of novel knee implants drives the adoption in this segment. For instance, in November 2022, Zimmer Biomet (US) received FDA clearance for its new Persona OsseoTi Keel Tibi knee implant.

Metals and metal alloys held the largest market share, by material, in 2023.

The orthopedic implants market is segmented based on material into metals & metal alloys, ceramics, polymers, and hybrid implants. The rising use of metals such as stainless steel and titanium alloys is driving the growth of this segment. Their longevity and mechanical strength, which help withstand stress & wear resistance, make them ideal for joint replacement surgeries. Metals such as titanium and cobalt-chromium alloys are also corrosion-resistant, preventing adverse reactions. The property of metals to mold into complex shapes is required for customized implants. A similar modulus of elasticity helps reduce stress shielding and improves integration with implants. The rising need for minimally invasive surgeries and a consistent rise in the demand for hip and knee replacement surgeries drive market growth.

By end user, hospitals & surgical centers held the largest share.

The end-user market is segmented into hospitals & surgical centers and ambulatory & trauma care centers. While hospitals & surgical centers will hold the larger market share, ambulatory & trauma care centers are expected to grow at a higher CAGR.

The increasing numbers of hospitals within emerging economies and government initiatives toward quality treatment also drive this segment. According to the American Hospital Association’s Annual Survey, there were ~34 million patient admissions in 6,129 hospitals in the US in 2023. Increasing per capita income in Asian and Latin American national markets enables more healthcare spending, prompting various governments to invest in healthcare delivery infrastructure. Newly created demand has simultaneously driven the requirement for more computer-assisted surgery. The development of private enterprises offering modern and well-equipped state-run healthcare facilities drives the number of hospital patients undergoing surgery. In China, the private hospital market is set to continue to increase by double digits in line with regulatory changes, market demand, and investments. The rise in number of knee replacement surgeries and increasing prevalence of obesity have contributed to the growth of this segment.

By region, North America is expected to be the largest market by 2029.

The US and Canada accounted for a significant market share in 2023. Several factors, such as the increasing incidence of orthopedic disorders, increasing geriatric and obese populations, increasing road accidents, growing patient preference for minimally invasive procedures, the recent launch of technologically advanced hybrid implants, and increasing awareness among physicians and patients about newly introduced treatment procedures and technologies in the market, are driving the growth of the orthopedic implants market in North America. In the US, about 1.5 million people suffer from osteoporosis. The number of osteoporosis fractures is expected to increase from 1.9 million in 2018 to 3.2 million by 2040 (Source: Amgen). In 2022, more than 1.5 million people in the US have been diagnosed with rheumatoid arthritis (Source: American College of Rheumatology, 2022).

HIGHEST CAGR MARKET IN 2023
US FASTEST GROWING MARKET IN THE REGION
Orthopedic Implants Market

Recent Developments of Orthopedic Implants Market

  • In September 2024, Stryker (US) acquired osteotomy and ankle truss systems from 4WEB Medical to expand foot and ankle portfolios.
  • In July 2024, Smith+Nephew (UK) partnered with Healthcare Outcomes Performance Company. This deal focused on offering enhanced solutions for healthcare professionals, patients, and ambulatory surgery centers (ASCs) through the digital and analytics platform of the Healthcare Outcomes Performance Company.
  • In October 2024, Smith+Nephew (UK) announced that its LEGION Hinged Knee (HK) System is available in the US.
  • In October 2023, Johnson & Johnson MedTech (US) received 510(K) clearances from the US FDA for its TriLEAP System. It includes a range of specially shaped and standard plates that fit different screw sizes. It also includes tools to reduce, fix, and fuse bones or bone fragments during surgery.

Key Market Players

KEY PLAYERS IN THE ORTHOPEDIC IMPLANTS MARKET INCLUDE

Want to explore hidden markets that can drive new revenue in Orthopedic Implants Market?

Scope of the Report

Report Metric Details
Market size available for years 2022-2029
Base Year Considered 2023
Forecast period 2024-2029
Forecast units Value (USD)
Segments covered Type, material, end user, and region
Geographies covered North America, Europe, Asia Pacific, Latin America, Middle East and Africa

Key Questions Addressed by the Report

What is the expected addressable market value of the global orthopedic implants market over six years?
The global orthopedic implants market is expected to reach USD 26.47 billion by 2029 from USD 20.94 billion in 2024, at a CAGR of 4.8% from 2024 to 2029.
Which segment based on type is expected to garner the highest traction within the orthopedic implants market?
Based on the type, the knee implants segment is expected to grow at the highest rate.
What strategies are top market players adopting to penetrate emerging regions?
Market leaders adopt research collaboration, distribution partnerships/ agreements, and expansion as key growth strategies.
What are the major limiting factors for the growth of the orthopedic implants market?
The primary challenges to market growth include high costs of surgery and a shortage of skilled personnel to conduct these procedures.
Which are the major companies in the orthopedic implants market?
The major companies in the market include Stryker Corporation, Johnson & Johnson MedTech, Zimmer Biomet Holdings, Smith+Nephew, and B. Braun.
Which material segment holds the largest share of the orthopedic implants market?
Metals and metal alloys hold the largest share of the materials market.
Which factors are responsible for market growth in North America?
The increasing incidence of orthopedic disorders, growing patient preference for minimally invasive procedures, increasing geriatric & obese populations, increasing road accidents, and the launch of technologically advanced hybrid implants.


Personalize This Research

  • Triangulate with your Own Data
  • Get Data as per your Format and Definition
  • Gain a Deeper Dive on a Specific Application, Geography, Customer or Competitor
  • Any level of Personalization
Request A Free Customisation

Let Us Help You

  • What are the Known and Unknown Adjacencies Impacting the Orthopedic Implants Market
  • What will your New Revenue Sources be?
  • Who will be your Top Customer; what will make them switch?
  • Defend your Market Share or Win Competitors
  • Get a Scorecard for Target Partners
Customized Workshop Request

Table of Contents

Exclusive indicates content/data unique to MarketsandMarkets and not available with any competitors.

TITLE
PAGE NO
INTRODUCTION
22
RESEARCH METHODOLOGY
25
EXECUTIVE SUMMARY
37
PREMIUM INSIGHTS
40
MARKET OVERVIEW
44
  • 5.1 INTRODUCTION
  • 5.2 MARKET DYNAMICS
    DRIVERS
    - Rising prevalence of orthopedic diseases and disorders
    - Increasing demand for minimally invasive surgery
    - Rising number of sports injuries
    - Increasing research funding and awareness initiatives
    RESTRAINTS
    - Risks and complications associated with orthopedic surgical procedures
    - High cost of orthopedic surgery
    OPPORTUNITIES
    - Advancements in robotic surgery and 3D printing
    - Growth opportunities in emerging markets
    CHALLENGES
    - Dearth of skilled orthopedic surgeons
  • 5.3 VALUE CHAIN ANALYSIS
    RESEARCH & PRODUCT DEVELOPMENT
    RAW MATERIAL PROCUREMENT AND MANUFACTURING
    DISTRIBUTION, MARKETING & SALES, AND POST-SALES SERVICES
  • 5.4 SUPPLY CHAIN ANALYSIS
    MANUFACTURERS
    - Prominent companies
    - Small and medium-sized enterprises
    END USERS
  • 5.5 ECOSYSTEM ANALYSIS
  • 5.6 REGULATORY LANDSCAPE
    REGULATORY BODIES, GOVERNMENT AGENCIES, AND OTHER ORGANIZATIONS
    REGULATORY ANALYSIS
    - North America
    - Europe
    - Asia Pacific
    - Latin America
    REGULATORY APPROVALS
  • 5.7 REIMBURSEMENT SCENARIO
  • 5.8 INVESTMENT AND FUNDING SCENARIO
  • 5.9 PRICING ANALYSIS
    AVERAGE SELLING PRICE, BY REGION
    AVERAGE SELLING PRICE, BY KEY PLAYER
  • 5.10 TRADE ANALYSIS
    IMPORT DATA FOR HS CODE 9021
    EXPORT DATA FOR HS CODE 9021
  • 5.11 PATENT ANALYSIS
  • 5.12 PORTER’S FIVE FORCES ANALYSIS
    THREAT OF NEW ENTRANTS
    THREAT OF SUBSTITUTES
    BARGAINING POWER OF SUPPLIERS
    BARGAINING POWER OF BUYERS
    INTENSITY OF COMPETITIVE RIVALRY
  • 5.13 KEY STAKEHOLDERS AND BUYING CRITERIA
    KEY STAKEHOLDERS IN BUYING PROCESS
    KEY BUYING CRITERIA
  • 5.14 KEY CONFERENCES AND EVENTS, 2024–2025
  • 5.15 CASE STUDY ANALYSIS
    DIGITAL PLATFORM DESIGNED TO IMPROVE PATIENT CARE PATHWAYS
    PARTIAL KNEE ARTHROPLASTY PERFORMED WITH ROSA PARTIAL KNEE SYSTEM
    ACCURATE DATA GENERATION WITH SHAPEGRABBER 3D
  • 5.16 TECHNOLOGY ANALYSIS
    KEY TECHNOLOGIES
    - 3D printing/additive manufacturing
    COMPLEMENTARY TECHNOLOGIES
    - Robotic orthopedic surgery
    ADJACENT TECHNOLOGIES
    - Diagnostic imaging
  • 5.17 TRENDS/DISRUPTIONS IMPACTING CUSTOMER’S BUSINESS
  • 5.18 UNMET NEEDS
  • 5.19 IMPACT OF AI/GEN AI ON ORTHOPEDIC IMPLANTS MARKET
    KEY USE CASES
ORTHOPEDIC IMPLANTS MARKET, BY TYPE
88
  • 6.1 INTRODUCTION
  • 6.2 KNEE IMPLANTS
    ONGOING INNOVATION IN KNEE IMPLANTS TO SUPPORT GROWTH
  • 6.3 HIP IMPLANTS
    RISING NUMBER OF HIP FRACTURES AND INCREASING SUCCESS RATE OF HIP ARTHROPLASTY TO SUPPORT MARKET GROWTH
  • 6.4 SHOULDER IMPLANTS
    LAUNCH OF NEW SHOULDER REPLACEMENT IMPLANTS AND RISING POPULARITY OF REVERSE SHOULDER ARTHROPLASTY TO SUPPORT MARKET GROWTH
  • 6.5 ELBOW IMPLANTS
    INCREASING FREQUENCY OF ELBOW JOINT FRACTURES AND GROWTH IN ELDERLY POPULATION TO DRIVE MARKET
  • 6.6 FOOT & ANKLE IMPLANTS
    RISING NUMBER OF ANKLE REPLACEMENT PROCEDURES TO FUEL MARKET GROWTH
  • 6.7 WRIST IMPLANTS
    GROWING NUMBER OF WRIST REPLACEMENT PROCEDURES TO DRIVE MARKET
  • 6.8 OTHER IMPLANTS
ORTHOPEDIC IMPLANTS MARKET, BY MATERIAL
96
  • 7.1 INTRODUCTION
  • 7.2 HYBRID IMPLANTS
    IMPROVED BIOCOMPATIBILITY, BETTER MECHANICAL PERFORMANCE, AND REDUCED RISKS OF REVISION SURGERIES TO DRIVE MARKET
  • 7.3 METALS & METAL ALLOYS
    STAINLESS STEEL
    - Growing affordability and availability of stainless steel to drive market
    TITANIUM ALLOYS
    - Biocompatibility and ability to withstand high stress to propel adoption
    OTHER METALS & METAL ALLOYS
  • 7.4 POLYMERS
    DESIGN FLEXIBILITY AND TUNABLE PROPERTIES OF POLYMERS TO PROPEL GROWTH
  • 7.5 CERAMICS
    LOW FRICTIONAL PROPERTIES AND RESISTANCE AGAINST WEAR TO FUEL MARKET
ORTHOPEDIC IMPLANTS MARKET, BY END USER
103
  • 8.1 INTRODUCTION
  • 8.2 HOSPITALS & SURGICAL CENTERS
    RISING NUMBER OF ORTHOPEDIC SURGERIES TO DRIVE MARKET
  • 8.3 AMBULATORY & TRAUMA CARE CENTERS
    COST-EFFECTIVE TREATMENT OFFERED BY AMBULATORY CARE CENTERS TO PROPEL MARKET GROWTH
ORTHOPEDIC IMPLANTS MARKET, BY REGION
107
  • 9.1 INTRODUCTION
  • 9.2 NORTH AMERICA
    MACROECONOMIC OUTLOOK FOR NORTH AMERICA
    US
    - US to dominate North American orthopedic implants market during forecast period
    CANADA
    - Rising incidence of degenerative bone diseases to support market growth
  • 9.3 EUROPE
    MACROECONOMIC OUTLOOK FOR EUROPE
    GERMANY
    - Germany to account for largest market share in Europe
    FRANCE
    - Increasing obesity and significant adoption of orthopedic implants to support market growth
    UK
    - Increasing awareness of orthopedic conditions to drive adoption of innovative treatments
    ITALY
    - Increasing awareness of preventive care for musculoskeletal injuries to drive market
    SPAIN
    - Growing preference for minimally invasive surgical procedures to drive market
    REST OF EUROPE
  • 9.4 ASIA PACIFIC
    MACROECONOMIC OUTLOOK FOR ASIA PACIFIC
    JAPAN
    - Rapidly growing geriatric population to propel market
    CHINA
    - Expanding target patient population to drive market
    INDIA
    - Increasing number of hospitals adopting robotic-assisted joint replacement surgery to support market growth
    AUSTRALIA
    - Favorable government initiatives to promote market growth
    SOUTH KOREA
    - Rising R&D and funding to drive market
    REST OF ASIA PACIFIC
  • 9.5 LATIN AMERICA
    MACROECONOMIC OUTLOOK FOR LATIN AMERICA
    BRAZIL
    - Strong presence of global players to drive market
    MEXICO
    - Favorable investment scenario for medical device manufacturers to favor market growth
    REST OF LATIN AMERICA
  • 9.6 MIDDLE EAST & AFRICA
    GROWING AVAILABILITY OF HIGH-QUALITY TREATMENTS TO DRIVE MARKET
    MACROECONOMIC OUTLOOK FOR MIDDLE EAST & AFRICA
COMPETITIVE LANDSCAPE
143
  • 10.1 OVERVIEW
  • 10.2 KEY PLAYER STRATEGIES/RIGHT TO WIN, 2021-2024
    OVERVIEW OF STRATEGIES ADOPTED BY PLAYERS IN ORTHOPEDIC IMPLANTS MARKET
  • 10.3 REVENUE ANALYSIS, 2019−2023
  • 10.4 MARKET SHARE ANALYSIS
  • 10.5 COMPANY EVALUATION MATRIX: KEY PLAYERS, 2023
    STARS
    EMERGING LEADERS
    PERVASIVE PLAYERS
    PARTICIPANTS
    COMPANY FOOTPRINT: KEY PLAYERS, 2023
    - Company footprint
    - Region footprint
    - Type footprint
    - Material footprint
    - End-user footprint
  • 10.6 COMPANY EVALUATION MATRIX: STARTUPS/SMES, 2023
    PROGRESSIVE COMPANIES
    RESPONSIVE COMPANIES
    DYNAMIC COMPANIES
    STARTING BLOCKS
    COMPETITIVE BENCHMARKING: STARTUPS/SMES, 2023
  • 10.7 VALUATION & FINANCIAL METRICS
    FINANCIAL METRICS
    COMPANY VALUATION
  • 10.8 BRAND/PRODUCT COMPARISON
  • 10.9 COMPETITIVE SCENARIO
    PRODUCT LAUNCHES & APPROVALS
    DEALS
    EXPANSIONS
COMPANY PROFILES
163
  • 11.1 KEY PLAYERS
    ZIMMER BIOMET HOLDINGS, INC.
    - Business overview
    - Products offered
    - Recent developments
    - MnM view
    STRYKER CORPORATION
    - Business overview
    - Products offered
    - Recent developments
    - MnM view
    JOHNSON & JOHNSON MEDTECH
    - Business overview
    - Products offered
    - Recent developments
    - MnM view
    SMITH+NEPHEW
    - Business overview
    - Products offered
    - Recent developments
    B. BRAUN
    - Business overview
    - Products offered
    GLOBUS MEDICAL, INC.
    - Business overview
    - Products offered
    - Recent developments
    ARTHREX, INC.
    - Business overview
    - Products offered
    ENOVIS
    - Business overview
    - Products offered
    - Recent developments
    ACUMED LLC
    - Business overview
    - Products offered
    - Recent developments
    ORTHOFIX MEDICAL INC.
    - Business overview
    - Products offered
    - Recent developments
    MICROPORT SCIENTIFIC CORPORATION
    - Business overview
    - Products offered
    - Recent developments
    CONMED CORPORATION
    - Business overview
    - Products offered
    - Recent developments
    MEDACTA INTERNATIONAL
    - Business overview
    - Products offered
    - Recent developments
    PARAGON 28, INC.
    - Business overview
    - Products offered
    - Recent developments
    MERIL LIFE SCIENCES PVT. LTD.
    - Business overview
    - Products offered
    - Recent developments
  • 11.2 OTHER PLAYERS
    FH ORTHO SAS
    SYMBIOS ORTHOPÉDIE S.A.
    MADISON ORTHO
    GREEN SURGICALS PVT. LTD.
    SIORA SURGICALS PRIVATE LIMITED
    ORTHOPEDIATRICS CORP.
    RESTOR3D
    DOUBLE MEDICAL TECHNOLOGY INC.
    TREACE MEDICAL CONCEPTS, INC.
    AK MEDICAL HOLDINGS LIMITED
APPENDIX
252
  • 12.1 DISCUSSION GUIDE
  • 12.2 KNOWLEDGESTORE: MARKETSANDMARKETS’ SUBSCRIPTION PORTAL
  • 12.3 CUSTOMIZATION OPTIONS
  • 12.4 RELATED REPORTS
  • 12.5 AUTHOR DETAILS
LIST OF TABLES
 
  • TABLE 1 ORTHOPEDIC IMPLANTS MARKET: INCLUSIONS AND EXCLUSIONS
  • TABLE 2 GRANTS AND FUNDING OPPORTUNITIES IN ORTHOPEDIC IMPLANTS MARKET
  • TABLE 3 ORTHOPEDIC IMPLANTS MARKET: ROLE OF COMPANIES IN ECOSYSTEM
  • TABLE 4 NORTH AMERICA: KEY REGULATORY BODIES, GOVERNMENT AGENCIES, AND OTHER ORGANIZATIONS
  • TABLE 5 EUROPE: KEY REGULATORY BODIES, GOVERNMENT AGENCIES, AND OTHER ORGANIZATIONS
  • TABLE 6 ASIA PACIFIC: KEY REGULATORY BODIES, GOVERNMENT AGENCIES, AND OTHER ORGANIZATIONS
  • TABLE 7 LATIN AMERICA: KEY REGULATORY BODIES, GOVERNMENT AGENCIES, AND OTHER ORGANIZATIONS
  • TABLE 8 MIDDLE EAST & AFRICA: KEY REGULATORY BODIES, GOVERNMENT AGENCIES, AND OTHER ORGANIZATIONS
  • TABLE 9 US FDA: MEDICAL DEVICE CLASSIFICATION
  • TABLE 10 US: MEDICAL DEVICE REGULATORY APPROVAL PROCESS
  • TABLE 11 US: CLASSIFICATION OF ORTHOPEDIC IMPLANTS
  • TABLE 12 CANADA: MEDICAL DEVICE REGULATORY APPROVAL PROCESS
  • TABLE 13 JAPAN: MEDICAL DEVICE CLASSIFICATION UNDER PHARMACEUTICAL AND MEDICAL DEVICE AGENCY (PMDA)
  • TABLE 14 CHINA: CLASSIFICATION OF MEDICAL DEVICES
  • TABLE 15 REGULATORY APPROVALS FOR ORTHOPEDIC IMPLANTS, BY COUNTRY
  • TABLE 16 MEDICAL REIMBURSEMENT CODES FOR ORTHOPEDIC IMPLANTATION SERVICES, 2023
  • TABLE 17 AVERAGE SELLING PRICE TREND OF ORTHOPEDIC IMPLANTS, BY REGION, 2021–2023 (USD)
  • TABLE 18 AVERAGE SELLING PRICE OF ORTHOPEDIC IMPLANTS, BY KEY PLAYER, 2023 (USD)
  • TABLE 19 IMPORT DATA FOR ORTHOPEDIC IMPLANTS (HS CODE 9021), BY COUNTRY, 2019–2023 (USD THOUSAND)
  • TABLE 20 EXPORT DATA FOR ORTHOPEDIC IMPLANTS (HS CODE 9021), BY COUNTRY, 2019–2023 (USD THOUSAND)
  • TABLE 21 INNOVATIONS AND PATENT REGISTRATIONS, JANUARY 2021–SEPTEMBER 2024
  • TABLE 22 ORTHOPEDIC IMPLANTS MARKET: PORTER’S FIVE FORCES
  • TABLE 23 INFLUENCE OF KEY STAKEHOLDERS ON BUYING PROCESS OF ORTHOPEDIC IMPLANTS
  • TABLE 24 INFLUENCE OF END USERS ON PURCHASE OF ORTHOPEDIC IMPLANTS, BY END USER
  • TABLE 25 ORTHOPEDIC IMPLANTS MARKET: LIST OF CONFERENCES AND EVENTS
  • TABLE 26 ORTHOPEDIC IMPLANTS MARKET: CURRENT UNMET NEEDS
  • TABLE 27 ORTHOPEDIC IMPLANTS MARKET: INTENSITY OF CURRENT UNMET NEEDS
  • TABLE 28 ORTHOPEDIC IMPLANTS MARKET, BY TYPE, 2022–2029 (USD MILLION)
  • TABLE 29 KNEE IMPLANTS MARKET, BY REGION, 2022–2029 (USD MILLION)
  • TABLE 30 HIP IMPLANTS MARKET, BY REGION, 2022–2029 (USD MILLION)
  • TABLE 31 SHOULDER IMPLANTS MARKET, BY REGION, 2022–2029 (USD MILLION)
  • TABLE 32 ELBOW IMPLANTS MARKET, BY REGION, 2022–2029 (USD MILLION)
  • TABLE 33 FOOT & ANKLE IMPLANTS MARKET, BY REGION, 2022–2029 (USD MILLION)
  • TABLE 34 WRIST IMPLANTS MARKET, BY REGION, 2022–2029 (USD MILLION)
  • TABLE 35 OTHER ORTHOPEDIC IMPLANTS MARKET, BY REGION, 2022–2029 (USD MILLION)
  • TABLE 36 ORTHOPEDIC IMPLANTS MARKET, BY MATERIAL, 2022–2029 (USD MILLION)
  • TABLE 37 HYBRID IMPLANTS MARKET, BY REGION, 2022–2029 (USD MILLION)
  • TABLE 38 METAL & METAL ALLOY IMPLANTS MARKET, BY TYPE, 2022–2029 (USD MILLION)
  • TABLE 39 METAL & METAL ALLOY IMPLANTS MARKET, BY REGION, 2022–2029 (USD MILLION)
  • TABLE 40 STAINLESS STEEL IMPLANTS MARKET, BY REGION, 2022–2029 (USD MILLION)
  • TABLE 41 TITANIUM ALLOY IMPLANTS MARKET, BY REGION, 2022–2029 (USD MILLION)
  • TABLE 42 OTHER METAL & METAL ALLOY IMPLANTS MARKET, BY REGION, 2022–2029 (USD MILLION)
  • TABLE 43 POLYMER IMPLANTS MARKET, BY REGION, 2022–2029 (USD MILLION)
  • TABLE 44 CERAMIC IMPLANTS MARKET, BY REGION, 2022–2029 (USD MILLION)
  • TABLE 45 ORTHOPEDIC IMPLANTS MARKET, BY END USER, 2022–2029 (USD MILLION)
  • TABLE 46 ORTHOPEDIC IMPLANTS MARKET FOR HOSPITALS & SURGICAL CENTERS BY REGION, 2022–2029 (USD MILLION)
  • TABLE 47 ORTHOPEDIC IMPLANTS MARKET FOR AMBULATORY & TRAUMA CARE CENTERS, BY REGION, 2022–2029 (USD MILLION)
  • TABLE 48 ORTHOPEDIC IMPLANTS MARKET, BY REGION, 2022–2029 (USD MILLION)
  • TABLE 49 NORTH AMERICA: ORTHOPEDIC IMPLANTS MARKET, BY COUNTRY, 2022–2029 (USD MILLION)
  • TABLE 50 NORTH AMERICA: ORTHOPEDIC IMPLANTS MARKET, BY TYPE, 2022–2029 (USD MILLION)
  • TABLE 51 NORTH AMERICA: ORTHOPEDIC IMPLANTS MARKET, BY MATERIAL, 2022–2029 (USD MILLION)
  • TABLE 52 NORTH AMERICA: METAL & METAL ALLOY IMPLANTS MARKET, BY TYPE, 2022–2029 (USD MILLION)
  • TABLE 53 NORTH AMERICA: ORTHOPEDIC IMPLANTS MARKET, BY END USER, 2022–2029 (USD MILLION)
  • TABLE 54 NORTH AMERICA: KEY MACROINDICATORS
  • TABLE 55 US: ORTHOPEDIC IMPLANTS MARKET, BY TYPE, 2022–2029 (USD MILLION)
  • TABLE 56 CANADA: ORTHOPEDIC IMPLANTS MARKET, BY TYPE, 2022–2029 (USD MILLION)
  • TABLE 57 EUROPE: KEY MACROINDICATORS
  • TABLE 58 EUROPE: ORTHOPEDIC IMPLANTS MARKET, BY COUNTRY, 2022–2029 (USD MILLION)
  • TABLE 59 EUROPE: ORTHOPEDIC IMPLANTS MARKET, BY TYPE, 2022–2029 (USD MILLION)
  • TABLE 60 EUROPE: ORTHOPEDIC IMPLANTS MARKET, BY MATERIAL, 2022–2029 (USD MILLION)
  • TABLE 61 EUROPE: METAL & METAL ALLOY IMPLANTS MARKET, BY TYPE, 2022–2029 (USD MILLION)
  • TABLE 62 EUROPE: ORTHOPEDIC IMPLANTS MARKET, BY END USER, 2022–2029 (USD MILLION)
  • TABLE 63 GERMANY: ORTHOPEDIC IMPLANTS MARKET, BY TYPE, 2022–2029 (USD MILLION)
  • TABLE 64 FRANCE: ORTHOPEDIC IMPLANTS MARKET, BY TYPE, 2022–2029 (USD MILLION)
  • TABLE 65 UK: ORTHOPEDIC IMPLANTS MARKET, BY TYPE, 2022–2029 (USD MILLION)
  • TABLE 66 ITALY: ORTHOPEDIC IMPLANTS MARKET, BY TYPE, 2022–2029 (USD MILLION)
  • TABLE 67 SPAIN: ORTHOPEDIC IMPLANTS MARKET, BY TYPE, 2022–2029 (USD MILLION)
  • TABLE 68 REST OF EUROPE: ORTHOPEDIC IMPLANTS MARKET, BY TYPE, 2022–2029 (USD MILLION)
  • TABLE 69 ASIA PACIFIC: KEY MACROINDICATORS
  • TABLE 70 ASIA PACIFIC: ORTHOPEDIC IMPLANTS MARKET, BY COUNTRY, 2022–2029 (USD MILLION)
  • TABLE 71 ASIA PACIFIC: ORTHOPEDIC IMPLANTS MARKET, BY TYPE, 2022–2029 (USD MILLION)
  • TABLE 72 ASIA PACIFIC: ORTHOPEDIC IMPLANTS MARKET, BY MATERIAL, 2022–2029 (USD MILLION)
  • TABLE 73 ASIA PACIFIC: METAL & METAL ALLOY IMPLANTS MARKET, BY TYPE, 2022–2029 (USD MILLION)
  • TABLE 74 ASIA PACIFIC: ORTHOPEDIC IMPLANTS MARKET, BY END USER, 2022–2029 (USD MILLION)
  • TABLE 75 JAPAN: ORTHOPEDIC IMPLANTS MARKET, BY TYPE, 2022–2029 (USD MILLION)
  • TABLE 76 CHINA: ORTHOPEDIC IMPLANTS MARKET, BY TYPE, 2022–2029 (USD MILLION)
  • TABLE 77 INDIA: ORTHOPEDIC IMPLANTS MARKET, BY TYPE, 2022–2029 (USD MILLION)
  • TABLE 78 AUSTRALIA: ORTHOPEDIC IMPLANTS MARKET, BY TYPE, 2022–2029 (USD MILLION)
  • TABLE 79 SOUTH KOREA: ORTHOPEDIC IMPLANTS MARKET, BY TYPE, 2022–2029 (USD MILLION)
  • TABLE 80 REST OF ASIA PACIFIC: ORTHOPEDIC IMPLANTS MARKET, BY TYPE, 2022–2029 (USD MILLION)
  • TABLE 81 LATIN AMERICA: KEY MACROINDICATORS
  • TABLE 82 LATIN AMERICA: ORTHOPEDIC IMPLANTS MARKET, BY COUNTRY, 2022–2029 (USD MILLION)
  • TABLE 83 LATIN AMERICA: ORTHOPEDIC IMPLANTS MARKET, BY TYPE, 2022–2029 (USD MILLION)
  • TABLE 84 LATIN AMERICA: ORTHOPEDIC IMPLANTS MARKET, BY MATERIAL, 2022–2029 (USD MILLION)
  • TABLE 85 LATIN AMERICA: METAL & METAL ALLOY IMPLANTS MARKET, BY TYPE, 2022–2029 (USD MILLION)
  • TABLE 86 LATIN AMERICA: ORTHOPEDIC IMPLANTS MARKET, BY END USER, 2022–2029 (USD MILLION)
  • TABLE 87 BRAZIL: ORTHOPEDIC IMPLANTS MARKET, BY TYPE, 2022–2029 (USD MILLION)
  • TABLE 88 MEXICO: ORTHOPEDIC IMPLANTS MARKET, BY TYPE, 2022–2029 (USD MILLION)
  • TABLE 89 REST OF LATIN AMERICA: ORTHOPEDIC IMPLANTS MARKET, BY TYPE, 2022–2029 (USD MILLION)
  • TABLE 90 MIDDLE EAST & AFRICA: KEY MACROINDICATORS
  • TABLE 91 MIDDLE EAST & AFRICA: ORTHOPEDIC IMPLANTS MARKET, BY REGION, 2022–2029 (USD MILLION)
  • TABLE 92 MIDDLE EAST & AFRICA: ORTHOPEDIC IMPLANTS MARKET, BY TYPE, 2022–2029 (USD MILLION)
  • TABLE 93 MIDDLE EAST & AFRICA: ORTHOPEDIC IMPLANTS MARKET, BY MATERIAL, 2022–2029 (USD MILLION)
  • TABLE 94 MIDDLE EAST & AFRICA: METAL & METAL ALLOY IMPLANTS MARKET, BY TYPE, 2022–2029 (USD MILLION)
  • TABLE 95 MIDDLE EAST & AFRICA: ORTHOPEDIC IMPLANTS MARKET, BY END USER, 2022–2029 (USD MILLION)
  • TABLE 96 ORTHOPEDIC IMPLANTS MARKET: OVERVIEW OF STRATEGIES DEPLOYED BY KEY MANUFACTURING COMPANIES, 2021−2024
  • TABLE 97 ORTHOPEDIC IMPLANTS MARKET: DEGREE OF COMPETITION
  • TABLE 98 ORTHOPEDIC IMPLANTS MARKET: REGION FOOTPRINT
  • TABLE 99 ORTHOPEDIC IMPLANTS MARKET: TYPE FOOTPRINT
  • TABLE 100 ORTHOPEDIC IMPLANTS MARKET: MATERIAL FOOTPRINT
  • TABLE 101 ORTHOPEDIC IMPLANTS MARKET: END-USER FOOTPRINT
  • TABLE 102 ORTHOPEDIC IMPLANTS MARKET: DETAILED LIST OF KEY STARTUP/SME PLAYERS
  • TABLE 103 ORTHOPEDIC IMPLANTS MARKET: COMPETITIVE BENCHMARKING OF KEY EMERGING PLAYERS/STARTUPS
  • TABLE 104 ORTHOPEDIC IMPLANTS MARKET: PRODUCT LAUNCHES & APPROVALS, JANUARY 2021– OCTOBER 2024
  • TABLE 105 ORTHOPEDIC IMPLANTS MARKET: DEALS, JANUARY 2021– OCTOBER 2024
  • TABLE 106 ORTHOPEDIC IMPLANTS MARKET: EXPANSIONS, JANUARY 2021–OCTOBER 2024
  • TABLE 107 ZIMMER BIOMET HOLDINGS: COMPANY OVERVIEW
  • TABLE 108 ZIMMER BIOMET HOLDINGS: PRODUCTS OFFERED
  • TABLE 109 ZIMMER BIOMET HOLDINGS: PRODUCT APPROVALS, JANUARY 2021−SEPTEMBER 2024
  • TABLE 110 ZIMMER BIOMET HOLDINGS: DEALS, JANUARY 2021−SEPTEMBER 2024
  • TABLE 111 STRYKER CORPORATION: COMPANY OVERVIEW
  • TABLE 112 STRYKER CORPORATION: PRODUCTS OFFERED
  • TABLE 113 STRYKER CORPORATION: DEALS, JANUARY 2021−SEPTEMBER 2024
  • TABLE 114 STRYKER CORPORATION: EXPANSIONS, JANUARY 2021−SEPTEMBER 2024
  • TABLE 115 JOHNSON & JOHNSON MEDTECH: COMPANY OVERVIEW
  • TABLE 116 JOHNSON & JOHNSON MEDTECH: PRODUCTS OFFERED
  • TABLE 117 JOHNSON & JOHNSON MEDTECH: PRODUCT LAUNCHES & APPROVALS, JANUARY 2021−SEPTEMBER 2024
  • TABLE 118 JOHNSON & JOHNSON MEDTECH: DEALS, JANUARY 2021−SEPTEMBER 2024
  • TABLE 119 SMITH+NEPHEW: COMPANY OVERVIEW
  • TABLE 120 SMITH+NEPHEW: PRODUCTS OFFERED
  • TABLE 121 SMITH+NEPHEW: PRODUCT LAUNCHES & APPROVALS, JANUARY 2021−SEPTEMBER 2024
  • TABLE 122 SMITH+NEPHEW: DEALS, JANUARY 2021−SEPTEMBER 2024
  • TABLE 123 SMITH+NEPHEW: EXPANSIONS, JANUARY 2021− AUGUST 2024
  • TABLE 124 B. BRAUN: COMPANY OVERVIEW
  • TABLE 125 B. BRAUN: PRODUCTS OFFERED
  • TABLE 126 GLOBUS MEDICAL: COMPANY OVERVIEW
  • TABLE 127 GLOBUS MEDICAL: PRODUCTS OFFERED
  • TABLE 128 GLOBUS MEDICAL: PRODUCT LAUNCHES & APPROVALS, JANUARY 2021−SEPTEMBER 2024
  • TABLE 129 GLOBUS MEDICAL: DEALS, JANUARY 2021−SEPTEMBER 2024
  • TABLE 130 ARTHREX: COMPANY OVERVIEW
  • TABLE 131 ARTHREX: PRODUCTS OFFERED
  • TABLE 132 ENOVIS: COMPANY OVERVIEW
  • TABLE 133 ENOVIS: PRODUCTS OFFERED
  • TABLE 134 ENOVIS: PRODUCT LAUNCHES, JANUARY 2021−SEPTEMBER 2024
  • TABLE 135 ENOVIS: DEALS, JANUARY 2021−SEPTEMBER 2024
  • TABLE 136 ENOVIS: EXPANSIONS, JANUARY 2021− AUGUST 2024
  • TABLE 137 ACUMED: COMPANY OVERVIEW
  • TABLE 138 ACUMED: PRODUCTS OFFERED
  • TABLE 139 ACUMED: PRODUCT LAUNCHES, JANUARY 2021−SEPTEMBER 2024
  • TABLE 140 ACUMED: DEALS, JANUARY 2021−SEPTEMBER 2024
  • TABLE 141 ACUMED: EXPANSIONS, JANUARY 2021− AUGUST 2024
  • TABLE 142 ORTHOFIX MEDICAL: COMPANY OVERVIEW
  • TABLE 143 ORTHOFIX MEDICAL: PRODUCTS OFFERED
  • TABLE 144 ORTHOFIX MEDICAL: PRODUCT LAUNCHES & APPROVALS, JANUARY 2021−SEPTEMBER 2024
  • TABLE 145 ORTHOFIX MEDICAL: DEALS, JANUARY 2021−SEPTEMBER 2024
  • TABLE 146 MICROPORT SCIENTIFIC CORPORATION: COMPANY OVERVIEW
  • TABLE 147 MICROPORT SCIENTIFIC CORPORATION: PRODUCTS OFFERED
  • TABLE 148 MICROPORT SCIENTIFIC CORPORATION: PRODUCT LAUNCHES, JANUARY 2021−SEPTEMBER 2024
  • TABLE 149 MICROPORT SCIENTIFIC CORPORATION: DEALS, JANUARY 2021−SEPTEMBER 2024
  • TABLE 150 CONMED CORPORATION: COMPANY OVERVIEW
  • TABLE 151 CONMED CORPORATION: PRODUCTS OFFERED
  • TABLE 152 CONMED CORPORATION: DEALS, JANUARY 2021−SEPTEMBER 2024
  • TABLE 153 MEDACTA INTERNATIONAL: COMPANY OVERVIEW
  • TABLE 154 MEDACTA INTERNATIONAL: PRODUCTS OFFERED
  • TABLE 155 MEDACTA INTERNATIONAL: PRODUCT APPROVALS, JANUARY 2021−SEPTEMBER 2024
  • TABLE 156 MEDACTA INTERNATIONAL: DEALS, JANUARY 2021−SEPTEMBER 2024
  • TABLE 157 MEDACTA INTERNATIONAL: EXPANSIONS, JANUARY 2021−SEPTEMBER 2024
  • TABLE 158 PARAGON 28: COMPANY OVERVIEW
  • TABLE 159 PARAGON 28: PRODUCTS OFFERED
  • TABLE 160 PARAGON 28: PRODUCT LAUNCHES & APPROVALS, JANUARY 2021−SEPTEMBER 2024
  • TABLE 161 PARAGON 28: DEALS, JANUARY 2021−SEPTEMBER 2024
  • TABLE 162 MERIL LIFE SCIENCES: COMPANY OVERVIEW
  • TABLE 163 MERIL LIFE SCIENCES: PRODUCTS OFFERED
  • TABLE 164 MERIL LIFE SCIENCES: EXPANSIONS, JANUARY 2021−SEPTEMBER 2024
LIST OF FIGURES
 
  • FIGURE 1 ORTHOPEDIC IMPLANTS MARKET SEGMENTATION
  • FIGURE 2 ORTHOPEDIC IMPLANTS MARKET: RESEARCH DESIGN
  • FIGURE 3 ORTHOPEDIC IMPLANTS MARKET: KEY PRIMARY SOURCES (DEMAND- AND SUPPLY-SIDE PARTICIPANTS)
  • FIGURE 4 ORTHOPEDIC IMPLANTS: KEY INSIGHTS FROM PRIMARY INTERVIEWS
  • FIGURE 5 BREAKDOWN OF PRIMARY INTERVIEWS: SUPPLY- AND DEMAND-SIDE PARTICIPANTS
  • FIGURE 6 BREAKDOWN OF PRIMARY INTERVIEWS: BY COMPANY TYPE, DESIGNATION, AND REGION
  • FIGURE 7 RESEARCH METHODOLOGY: HYPOTHESIS BUILDING
  • FIGURE 8 ORTHOPEDIC IMPLANTS MARKET SIZE ESTIMATION: COMPANY REVENUE ESTIMATION
  • FIGURE 9 ORTHOPEDIC IMPLANTS MARKET SIZE ESTIMATION: BOTTOM-UP APPROACH
  • FIGURE 10 CAGR PROJECTION: SUPPLY-SIDE ANALYSIS
  • FIGURE 11 DATA TRIANGULATION METHODOLOGY
  • FIGURE 12 ORTHOPEDIC IMPLANTS MARKET, BY TYPE, 2024 VS. 2029 (USD MILLION)
  • FIGURE 13 ORTHOPEDIC IMPLANTS MARKET, BY MATERIAL, 2024 VS. 2029 (USD MILLION)
  • FIGURE 14 ORTHOPEDIC IMPLANTS MARKET, BY END USER, 2024 VS. 2029 (USD MILLION)
  • FIGURE 15 GEOGRAPHIC SNAPSHOT OF ORTHOPEDIC IMPLANTS MARKET
  • FIGURE 16 RISING PREVALENCE OF ORTHOPEDIC DISEASES AND DISORDERS TO DRIVE MARKET GROWTH
  • FIGURE 17 HIP IMPLANTS SEGMENT TO REGISTER SIGNIFICANT GROWTH IN NORTH AMERICAN MARKET
  • FIGURE 18 HYBRID IMPLANTS TO HOLD LARGEST SHARE IN EUROPE
  • FIGURE 19 HOSPITALS & SURGICAL CENTERS SEGMENT TO REGISTER SIGNIFICANT GROWTH IN APAC END-USER MARKET
  • FIGURE 20 CHINA TO WITNESS HIGHEST GROWTH DURING FORECAST PERIOD
  • FIGURE 21 ORTHOPEDIC IMPLANTS MARKET: DRIVERS, RESTRAINTS, OPPORTUNITIES, AND CHALLENGES
  • FIGURE 22 ORTHOPEDIC IMPLANTS MARKET: VALUE CHAIN ANALYSIS
  • FIGURE 23 ORTHOPEDIC IMPLANTS MARKET: SUPPLY CHAIN ANALYSIS
  • FIGURE 24 ORTHOPEDIC IMPLANTS MARKET: ECOSYSTEM ANALYSIS
  • FIGURE 25 PREMARKET NOTIFICATION: 510(K) APPROVALS FOR MEDICAL DEVICES
  • FIGURE 26 CANADA: REGULATORY APPROVAL PROCESS FOR MEDICAL DEVICES
  • FIGURE 27 EUROPE: CE APPROVAL PROCESS FOR MEDICAL DEVICES
  • FIGURE 28 INVESTMENT AND FUNDING SCENARIO IN ORTHOPEDIC IMPLANTS MARKET, 2019−2023 (USD MILLION)
  • FIGURE 29 NUMBER OF INVESTOR DEALS IN ORTHOPEDIC IMPLANTS MARKET, BY KEY PLAYER, 2019−2023 (UNIT)
  • FIGURE 30 VALUE OF INVESTOR DEALS IN ORTHOPEDIC IMPLANTS MARKET, BY KEY PLAYER, 2018–2022 (USD MILLION)
  • FIGURE 31 AVERAGE SELLING PRICE OF ORTHOPEDIC IMPLANTS, BY PRODUCT, 2023 (USD)
  • FIGURE 32 AVERAGE SELLING PRICE OF ORTHOPEDIC IMPLANTS, BY REGION, 2023 (USD)
  • FIGURE 33 ORTHOPEDIC IMPLANTS MARKET: PATENT ANALYSIS, 2013–2023
  • FIGURE 34 ORTHOPEDIC IMPLANTS MARKET: PORTER’S FIVE FORCES ANALYSIS
  • FIGURE 35 INFLUENCE OF STAKEHOLDERS ON BUYING PROCESS OF ORTHOPEDIC IMPLANTS
  • FIGURE 36 KEY BUYING CRITERIA, BY END USER
  • FIGURE 37 NEW REVENUE POCKETS FOR PLAYERS IN ORTHOPEDIC IMPLANTS MARKET
  • FIGURE 38 MARKET POTENTIAL OF AI/GENERATIVE AI IN ORTHOPEDIC IMPLANTS MARKET
  • FIGURE 39 NORTH AMERICA: ORTHOPEDIC IMPLANTS MARKET SNAPSHOT
  • FIGURE 40 ASIA PACIFIC: ORTHOPEDIC IMPLANTS MARKET SNAPSHOT
  • FIGURE 41 REVENUE SHARE ANALYSIS OF KEY PLAYERS IN ORTHOPEDIC IMPLANTS MARKET (2019−2023)
  • FIGURE 42 MARKET SHARE ANALYSIS OF KEY PLAYERS (2023)
  • FIGURE 43 ORTHOPEDIC IMPLANTS MARKET: COMPANY EVALUATION MATRIX (KEY PLAYERS), 2023
  • FIGURE 44 ORTHOPEDIC IMPLANTS MARKET: COMPANY FOOTPRINT
  • FIGURE 45 ORTHOPEDIC IMPLANTS MARKET: COMPANY EVALUATION MATRIX (STARTUPS/SMES), 2023
  • FIGURE 46 EV/EBITDA OF KEY VENDORS
  • FIGURE 47 YEAR-TO-DATE (YTD) PRICE TOTAL RETURN AND 5-YEAR STOCK BETA OF KEY VENDORS
  • FIGURE 48 ORTHOPEDIC IMPLANTS MARKET: BRAND/PRODUCT COMPARATIVE ANALYSIS
  • FIGURE 49 ZIMMER BIOMET HOLDINGS: COMPANY SNAPSHOT (2023)
  • FIGURE 50 STRYKER CORPORATION: COMPANY SNAPSHOT (2023)
  • FIGURE 51 JOHNSON & JOHNSON MEDTECH: COMPANY SNAPSHOT (2023)
  • FIGURE 52 SMITH+NEPHEW: COMPANY SNAPSHOT (2023)
  • FIGURE 53 B. BRAUN: COMPANY SNAPSHOT (2023)
  • FIGURE 54 GLOBUS MEDICAL: COMPANY SNAPSHOT (2023)
  • FIGURE 55 ENOVIS: COMPANY SNAPSHOT (2023)
  • FIGURE 56 ORTHOFIX MEDICAL: COMPANY SNAPSHOT (2023)
  • FIGURE 57 MICROPORT SCIENTIFIC CORPORATION: COMPANY SNAPSHOT (2023)
  • FIGURE 58 CONMED CORPORATION: COMPANY SNAPSHOT (2023)
  • FIGURE 59 MEDACTA INTERNATIONAL: COMPANY SNAPSHOT (2023)
  • FIGURE 60 PARAGON 28: COMPANY SNAPSHOT (2023)

The study involved four major activities in estimating the current size of the orthopedic implants market. Exhaustive secondary research was done to collect information on the market, peer, and parent markets. The next step was to validate these findings, assumptions, and sizing with industry experts across the value chain through primary research. Both top-down and bottom-up approaches were employed to estimate the complete market size. After that, market breakdown and data triangulation were used to estimate the market size of segments and subsegments.

Secondary Research

The secondary research process involves the widespread use of secondary sources, directories, databases (such as Bloomberg Businessweek, Factiva, and D&B Hoovers), white papers, annual reports, company house documents, investor presentations, and SEC filings of companies. Secondary research was used to identify and collect information useful for the extensive, technical, market-oriented, and commercial orthopedic implants market study. It was also used to obtain important information about the key players and market classification & segmentation according to industry trends to the bottom-most level, and key developments related to market and technology perspectives. A database of the key industry leaders was also prepared using secondary research.

Primary Research

In the primary research process, various supply and demand sources were interviewed to obtain qualitative and quantitative information for this report. The primary sources from the supply side include industry experts such as Chief Executive Officers (CEOs), vice presidents (VPs), marketing and sales directors, technology & innovation directors, and related key executives from various key companies and organizations in the orthopedic implants market. The primary sources from the demand side include hospitals & surgical centers and ambulatory & trauma care centers. Primary research was conducted to validate the market segmentation, identify key players, and gather insights on key industry trends & key market dynamics.

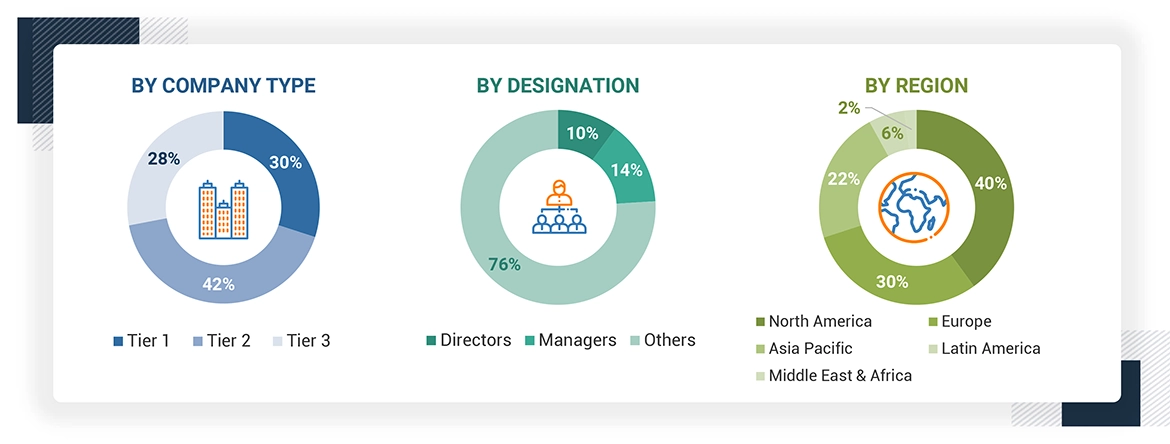
A breakdown of the primary respondents is provided below:
Orthopedic Implants Market

*Others include sales managers, marketing managers, business development managers, product managers, distributors, and suppliers.

The tiers of the companies are defined based on their total revenue. As of 2023: Tier 1 => USD 1 billion, Tier 2 = USD 200-500 million to USD 1 billion, and Tier 3 =< USD 200 million

To know about the assumptions considered for the study, download the pdf brochure

Market Size Estimation

Both top-down and bottom-up approaches were used to estimate and validate the total size of the orthopedic implants market.These methods were also used extensively to estimate the size of various subsegments in the market . The research methodology used to estimate the market size includes the following:

Orthopedic Implants Market

Data Triangulation

After arriving at the overall market size from the market size estimation process explained above, the orthopedic implants market was split into segments and subsegments. Data triangulation and market breakdown procedures were employed to complete the overall market engineering process and arrive at the exact statistics for all segments and subsegments. The data was triangulated by studying various factors and trends from both the demand and supply sides. Additionally, the orthopedic implants market was validated using top-down and bottom-up approaches.

Market Definition

An orthopedic implant is a medical device used to correct bone, joint, and other tissue disorders, injuries, or diseases. The implants are utilized for multiple applications, including fractures and related surgeries, where a support or replacement part is installed in the bone. These implants are manufactured using biocompatible materials such as metals and metal alloys, polymers, ceramics, and hybrid materials. The primary end users of this market are hospitals, surgical centers, ambulatory surgical centers, and trauma care centers.

Stakeholders

  • Orthopedic implant Manufacturers
  • Trauma care centers
  • Ambulatory surgical centers
  • Hospitals
  • Orthopedic implants distributors and suppliers
  • Orthopedic surgeons

Report Objectives

  • To define, describe, and forecast the orthopedic implants market based on type, material,  end user, and region
  • To provide detailed information regarding the major factors influencing the growth of the market (drivers, restraints, opportunities, and challenges)
  • To strategically analyze micro markets with respect to individual growth trends, prospects, and contributions to the total market
  • To analyze opportunities in the market for stakeholders and provide details of the competitive landscape for market leaders
  • To forecast the revenue of the market segments with respect to five regions, namely, North America, Europe, the Asia Pacific, Latin America, Middle East and Africa
  • To profile the key players and comprehensively analyze their market ranking and core competencies
  • To benchmark players within the market using a proprietary competitive leadership mapping framework, which analyzes market players on various parameters within the broad categories of  market share and product footprint

Previous Versions of this Report

"Our USP is "providing game-changing business opportunities reports with free customization" - so please feel free to provide us with your specific areas of interest / business challenges in much greater detail !!"

We appreciate your interest in this report. Once you fill out the form, you'll be immediately directed to an exclusive solution tailored to your needs. This high-value offering can help boost your revenue by 30% - a must-see opportunity for anyone looking to maximize growth.


By clicking the "Submit" button, you are agreeing to the Terms of Use and Privacy Policy.

Custom Market Research Services

We Will Customise The Research For You, In Case The Report Listed Above Does Not Meet With Your Requirements

Get 10% Free Customisation

Growth opportunities and latent adjacency in Orthopedic Implants Market

DMCA.com Protection Status