Open Banking Solutions Market

Open Banking Solutions Market by Solutions (Payment Initiation, Account Information, Identity Verification & Authentication, API Management), Application (Payment, Banking, Digital Lending, Wealth Management), End User (Account provider, TPP) - Global Forecast to 2028

Report Code: TC 8968 Mar, 2024, by marketsandmarkets.com

Open Banking Solutions Market - Analysis, Industry Size & Forecast

The Open Banking Solutions Market size was valued at USD 5.5 billion in 2023 and is expected to grow at a CAGR of 16.0% from 2023 to 2028. The revenue forecast for 2028 is projected to reach $11.7 billion. The base year for estimation is 2022, and the historical data spans from 2023 to 2028.

The impact of the recession (before, during, and after the recession) on the market is covered throughout the report. Banks and financial institutions are embracing digital transformation initiatives, adopting open banking to enhance customer experience and drive operational efficiency. Open banking enables international trade and transactions, addressing the requirements of both businesses and individuals (individual users) in the diverse and growing economies of the region.

Open Banking Solutions Market

To know about the assumptions considered for the study, Request for Free Sample Report

Open Banking Solutions Market Opportunities

To know about the assumptions considered for the study, download the pdf brochure

Recession Impact on the Global Open Banking Solutions Market

A recession can significantly impact the Open banking solutions market across organizations, industry verticals, and regions. Businesses may delay investments in these technologies as they prioritize cost-cutting over innovation. Startups in the field may struggle to secure funding as investors become more risk-averse. The demand for open banking solutions may increase during a recession as businesses seek more efficient financial management tools. However, the overall market growth might slow down due to reduced investment and consumer spending. Fintech companies offering open banking solutions may face challenges acquiring funding and retaining customers. Still, their services could be increasingly sought after by businesses looking to optimize their financial operations in challenging economic times. Government stimulus and investments in technology development can also help mitigate the recession's impact. In the end, the extent of the effect varies by region, industry, and the severity of the economic downturn.

Open Banking Solutions Market Dynamics

Drivers: There is a growing need to meet the compliance requirements of new data laws and regulations

Several Financial institutions must make significant changes to their business processes to meet new data privacy and regulation policies, such as the Second Payment Services Directive (PSD2) and open banking APIs. PSD2 enables banks to explore new business opportunities and transform digitally. Furthermore, PSD2 regulation enables third parties to access customer information to provide secured payment services. These regulations allow financial institutions to offer their customers innovative and competitive products and services in an open and secure environment. The regulations also provide a frictionless customer experience.

Restraints: Lack of digital literacy in emerging countries

Digital literacy is still lacking in many emerging nations, making it difficult for online and mobile payments to be widely accepted. This adversely affects the market expansion of Open Banking platforms and solutions. A wide range of abilities, including reading and comprehending technical information, are included in digital literacy. These abilities enable people to operate and utilize digital devices. Because most African nations have poor digital literacy rates, people cannot fully use the promise of digital technologies. Because there aren't many digital transactions, technology companies are likewise reluctant to make investments. Therefore, it is anticipated that the market for open banking solutions will grow more slowly in emerging nations due to low levels of digital literacy.

Opportunities: State-of-the-art innovation and improved personalization

Open banking unveils vast amounts (s) of financial data that can be leveraged to drive innovation and personalize financial services. By accessing real-time data from multiple sources, including bank accounts, credit cards, investments, financial institutions, and TPPs, they can develop innovative solutions tailored to individual consumer needs. These solutions may/can include personalized budgeting tools, automated savings plans, and customized investment recommendations. By harnessing open banking APIs, companies can offer more relevant and targeted financial products and services, enhancing the overall customer experience and increasing engagement and loyalty.

Challenges: Technical glitch leading to losses

Due to their reliance on digital platforms, banks are vulnerable to significant losses in the event of system failure or coding errors. Millions of dollars could be lost by a bank due to a single technological problem that shuts it down for the day. It can also create panic for bank customers who cannot make payments or conduct transactions when the site is down. A significant chunk of consumers now use a mobile banking app. So, it is vital not just for banks to have their online platforms running smoothly but also for their mobile apps. A loss of funds or data due to a crash can be very threatening for bank customers.

Open Banking Solutions Market Ecosystem

Top Companies in Open Banking Solutions Market

Based on the offering segment, Solutions will hold a larger market share in the Open banking solutions market during the forecast period.

Open Banking solutions include innovative tools and technologies designed to revolutionize the financial services industry by enabling secure data sharing, fostering collaboration between financial institutions, third-party providers, and consumers, and driving digital transformation. Payment initiation solutions allow businesses and consumers to initiate payments directly from their bank accounts, bypassing traditional payment methods and facilitating faster, more convenient transactions. Account information solutions aggregate and analyze comprehensive financial data from multiple sources, providing businesses with valuable insights for personalized marketing, risk assessment, and product development. API management solutions play a crucial role in facilitating seamless integration between different systems and enabling the development of innovative applications and services on top of existing platforms through open APIs. Identity verification and authentication solutions ensure secure access to financial data and services, leveraging advanced technologies to combat identity theft and fraud.

Based on solutions, the API management segment will record the highest CAGR in the Open banking solutions market during the forecast period.

API management solutions facilitate seamless integration, innovation, and collaboration across the financial ecosystem. As the gatekeeper between disparate systems and applications, API management solutions orchestrate data and transactions with precision and efficiency. These solutions provide developers, financial institutions, and third-party providers with standardized interfaces and protocols for accessing and exchanging financial data securely and transparently. API management solutions ensure compliance with regulatory requirements and protect sensitive information from unauthorized access or misuse by offering robust security measures, rate limiting, and access controls. Moreover, API management solutions foster innovation by enabling the rapid development and deployment of new financial products and services through open APIs, driving forward a future where interoperability and connectivity redefine the economic landscape.

Europe will hold the largest Open banking solutions market share during the forecast period.

The adoption of open banking solutions in the European region has gained considerable momentum, positioning the region at the forefront of the field/market. According to experts, Europe is expected to have the highest adoption rate of Open Banking solutions and associated services compared to other regions. This is due to the rising interest of European households in innovative, advanced technologies and the increasing investment of European companies in advanced technologies such as data integration, data visualization, middleware, API management, and blockchain, incorporated into/run by Open Banking solutions vendors and service providers.

Despite a continually evolving regulatory environment, Europe has witnessed significant economic growth in recent years. This growth can be attributed to the increasing expectations of businesses in the region to improve efficiency, save time, and reduce operating costs. As a result, several major US-based Open banking solutions market companies have expanded their operations in Europe, built up a solid clientele base, and established an overseas presence. Regional technology providers collaborate with global Open banking solutions market providers to stay competitive, retain existing customers, and attract new ones.

Europe Open Banking Solutions Market Size, and Share

Key market players

The Open banking solutions market is dominated both by established companies as well as startups such as Plaid (US), Envestnet (US), MX Technologies (US), Finicity (US), Tink (Sweden), Worldline (France), Trustly (Sweden), Axway Software (US), Volt.io (UK), Temenos (Switzerland). These vendors have a large customer base, a strong geographic footprint, and organized distribution channels. They incorporate organic and inorganic growth strategies, including product launches, deals, and business expansions, boosting revenue generation.

The study includes an in-depth competitive analysis of these critical Open banking solutions market players with their company profiles, recent developments, and key market strategies.

Want to explore hidden markets that can drive new revenue in Open Banking Solutions Market?

Scope of the Report

Report Metrics

Details

Market size available for years

2019-2028

Base year considered

2022

Forecast period

2023–2028

Forecast units

Value (USD Billion)

Segments Covered

Offering, Solutions, Services, Application, Digital channel, Deployment Model, and End users

Regions covered

North America, Europe, Asia Pacific, Middle East & Africa, and Latin America

Companies covered

Plaid (US), Envestnet (US), MX technologies (US), Finicity (US), Tink (Sweden), Worldline (France), Trustly (Sweden), Axway software (US), Volt.io (UK), Temenos (Switzerland), Fabrick (Italy), Intuit (US), ndgit (Germany), Akana (US), Yapily (UK), Salt Edge (Canada), Token.io (Germany), Fiorano (US), TrueLayer (UK), Bud Financial (UK), OpenPayd (UK), Finastra (UK), Google (US), Sopra Banking software (France), BBVA (Spain)

This research report categorizes the Open banking solutions market to forecast revenue and analyze trends in each of the following submarkets:

Based on Offering:
  • Solutions
    • Payment initiation
    • Account information
    • Identity verification & authentication
    • API management
    • Other Solutions
  • Services
    • Professional services
    • Managed services
Based on Application:
Based on Deployment model:
  • On-premises
  • Cloud
Based on Digital channel:
  • Web portals
  • Mobile apps
Based on End users:
  • Third-party providers (TPPs)
  • Account providers
Based on Region:
  • North America
    • US
    • Canada
  • Europe
    • UK
    • Germany
    • France
    • Italy
    • Rest of Europe
  • Asia Pacific
    • China
    • Japan
    • India
    • Rest of Asia Pacific
  • Middle East & Africa
    • GCC
    • South Africa
    • Rest of the Middle East & Africa
  • Latin America
    • Brazil
    • Mexico
    • Rest of Latin America

Recent Developments

  • In February 2024, MX Technologies partnered with Trustly, intending to integrate MX's data enhancement services into Trustly's Open Banking product suite, thereby enriching the payment experiences of 8,300+ international merchants and their consumers who utilize Trustly's 'Pay with Bank' method. Using its proficiency in open finance APIs, Trustly will assist businesses in maximizing the potential of their financial data. Merchants can delve deeper into consumer behaviors by refining and categorizing transaction data, obtaining more accurate insights. This service empowers merchants to deliver personalized marketing promotions and loyalty programs, enriching the consumer journey and nurturing stronger bonds between merchants and their clientele.
  • In January 2024, Risk Signals was launched by Tink, which conducts real-time risk checks during the payment process. Risk Signals provides a quick assessment of transactions in seconds while the payer progresses through the payment process, resulting in less disruption to the user experience. Risk Signals formulates a suite of demonstrated risk checks for each bank and market based on Tink's pan-European bank connectivity. Risk Signals' key features are live balances for real-time verification of a user's ability to pay, transaction history to assess fraud risk, and velocity checks to mark suspicious transaction activities.
  • In October 2023, Plaid entered into a deal with Fiserv to enable secure and reliable data sharing through APIs while addressing growing consumer demand to access their financial information according to their suitable time, location, and manner. With this deal, consumers who bank with nearly 3,000 bank and credit union clients hosted by Fiserv will now have secure, credential-less API-based connectivity to more than 8,000 applications and services on the Plaid network via Fiserv's AllData Connect, allowing consumers to share their financial information with the third-party financial apps and services of their choice.
  • In October 2023, Envestnet launched its embedded investment solution to provide a digitalized process for banks, credit unions, and financial advisors that will offer investing solutions within their (the banks, credit union entities) own apps and websites to customers within their existing banking experience. The service, consisting of diversified portfolios invested in exchange-traded funds (ETFs) and optional thematic stocks, enables financial institutions to retain deposits within their ecosystem and serve smaller account sizes digitally.
  • In June 2023, Financial institutions and fintech firms can now exchange vital fraud intelligence across Plaid thanks to the launch of Beacon by Plaid, a cooperative anti-fraud network.

Frequently Asked Questions (FAQ):

To speak to our analyst for a discussion on the above findings, click Speak to Analyst

Exclusive indicates content/data unique to MarketsandMarkets and not available with any competitors.

INTRODUCTION
31
RESEARCH METHODOLOGY
37
EXECUTIVE SUMMARY
52
PREMIUM INSIGHTS
56
MARKET OVERVIEW AND INDUSTRY TRENDS
60
  • 5.1 INTRODUCTION
  • 5.2 MARKET DYNAMICS
    DRIVERS
    - Increased consumer demand and adoption of cloud-based solutions by financial institutions
    - Increasing compliance requirements of new data laws and regulations
    - Need for greater visibility and options for borrowers and lenders
    - Focus on development of innovative product offerings with evolving consumer requirements
    RESTRAINTS
    - Lack of digital literacy in certain emerging countries
    OPPORTUNITIES
    - Gradual adoption of open-banking APIs
    - Growing demand for state-of-the-art innovations and improved personalization
    - Emphasis on better collaboration and partnership among key players
    CHALLENGES
    - Data privacy issues, security concerns, and threat of ransomware
    - Technical glitches leading to losses
  • 5.3 CASE STUDY ANALYSIS
    ZIP ACHIEVED COST REDUCTION AND IMPROVED COMPLIANCE ADHERENCE WITH PLAID MONITOR
    CLEO ADOPTED STRIPE SOLUTIONS TO MITIGATE FRAUD OCCURRENCES
    ANNA DEPLOYED OPTIMIZED TRANSACTION MODULE WITH HELP OF TRUELAYER API
    MONEYWIZ ADOPTED SALT EDGE TOOLS FOR AUTOMATED DATA EXTRACTION AND TRANSFORMATION
    BNP PARIBAS DEPLOYED AMPLIFY CATALOG TO PROVIDE API GATEWAYS ACROSS BUSINESSES
  • 5.4 ECOSYSTEM ANALYSIS
  • 5.5 VALUE CHAIN ANALYSIS
    DATA PROVIDERS
    DATA AGGREGATORS
    API PROVIDERS
    OPEN BANKING PLATFORM PROVIDERS
    IMPLEMENTATION AND INTEGRATION
    END USERS
  • 5.6 TECHNOLOGY ANALYSIS
    KEY TECHNOLOGIES
    - APIS
    - Security
  • 5.7 COMPLEMENTARY TECHNOLOGIES
    DATA ANALYTICS
    ARTIFICIAL INTELLIGENCE & MACHINE LEARNING
  • 5.8 ADJACENT TECHNOLOGIES
    BLOCKCHAIN & DISTRIBUTED LEDGER TECHNOLOGY (DLT)
    INTERNET OF THINGS (IOT)
  • 5.9 PRICING ANALYSIS
    INDICATIVE PRICING ANALYSIS
    - AVERAGE SELLING PRICE TREND
  • 5.10 INVESTMENT LANDSCAPE
  • 5.11 BUSINESS MODEL ANALYSIS
    API INFRASTRUCTURE
    DATA ACCESS AND AGGREGATION
    SECURITY AND COMPLIANCE
    MONETIZATION STRATEGY
    - Subscription-based models
    - Cloud-based and usage-based pricing
    PARTNERSHIPS AND COLLABORATIONS
  • 5.12 PATENT ANALYSIS
  • 5.13 PORTER'S FIVE FORCES ANALYSIS
    THREAT OF NEW ENTRANTS
    THREAT OF SUBSTITUTES
    BARGAINING POWER OF SUPPLIERS
    BARGAINING POWER OF BUYERS
    INTENSITY OF COMPETITIVE RIVALRY
  • 5.14 REGULATORY IMPLICATIONS AND INDUSTRY STANDARDS
    PAYMENT SERVICES DIRECTIVE 2 (PSD2)
    GENERAL DATA PROTECTION REGULATION (GDPR)
    COMPETITION AND MARKETS AUTHORITY (CMA) ORDER
    CALIFORNIA CONSUMER PRIVACY ACT (CCPA)
    CONSUMER DATA RIGHT ACT (CDR)
    FINTECH LAW
    REGULATORY LANDSCAPE
  • 5.15 KEY CONFERENCES AND EVENTS
  • 5.16 TRENDS AND DISRUPTIONS IMPACTING CUSTOMERS’ BUSINESSES
  • 5.17 KEY STAKEHOLDERS AND BUYING CRITERIA
    KEY STAKEHOLDERS IN BUYING PROCESS
    BUYING CRITERIA
OPEN BANKING SOLUTIONS MARKET, BY OFFERING
90
  • 6.1 INTRODUCTION
    OFFERINGS: OPEN BANKING SOLUTIONS MARKET DRIVERS
  • 6.2 SOLUTIONS
    PAYMENT INITIATION
    - Increased demand for frictionless transactions and real-time payments to drive segment
    - Account-to-account (A2A) payments
    - Bulk payment processing
    - Variable recurring payments
    - Payment request
    - Invoice generation & management
    ACCOUNT INFORMATION
    - Increased consumer demand for personalized financial services and insights to propel segment
    - Account aggregation
    - Investment portfolio aggregation
    - Transaction categorization
    - Budgeting & expense tracking
    - Real-time balance check
    IDENTITY VERIFICATION & AUTHENTICATION
    - Escalating cybersecurity threats and regulatory compliance requirements to drive segment
    - Optical character recognition verification
    - Biometric authentication
    - Knowledge-based authentication
    - Know-your-customer verification
    - Anti-money laundering (AML)
    API MANAGEMENT
    - Need for seamless integration, collaboration, and innovation in financial ecosystem to propel segment
    - API design & development
    - API gateway & security
    - API lifecycle management
    - API analytics & monitoring
    - Compliance & governance
    OTHER SOLUTIONS
  • 6.3 SERVICES
    PROFESSIONAL SERVICES
    - Enhanced open banking potential through proper implementation and compliance to propel segment
    - Consulting & advisory
    - Implementation & integration
    - Training & education
    MANAGED SERVICES
    - Rise in need for streamlined business operations and enhanced system performance to propel segment
    - Support & maintenance
    - Performance monitoring & optimization
    - Vendor selection & procurement
OPEN BANKING SOLUTIONS MARKET, BY APPLICATION
115
  • 7.1 INTRODUCTION
    APPLICATIONS: OPEN BANKING SOLUTIONS MARKET DRIVERS
  • 7.2 PAYMENT
    GROWING REQUIREMENT FOR ENHANCED TRANSPARENCY IN FINANCIAL TRANSACTIONS TO FUEL SEGMENT
    PAYMENT PROCESSING
    MOBILE WALLETS
    CROSS-BORDER PAYMENTS
    PAYMENT GATEWAYS
    OTHER PAYMENT APPLICATIONS
  • 7.3 BANKING
    RISE IN DEMAND FOR QUICK AND SECURE CUSTOMER ONBOARDING TO DRIVE SEGMENT
    DIGITAL BANKING
    ACCOUNT SWITCHING
    PERSONAL FINANCE MANAGEMENT
    LOAN MANAGEMENT
    OTHER BANKING APPLICATIONS
  • 7.4 DIGITAL LENDING
    GROWING NEED FOR ACCURATE RISK ASSESSMENT AND FASTER LOAN APPROVALS TO PROPEL SEGMENT
    ONLINE LOAN ORIGINATION
    PEER-TO-PEER LENDING
    AUTOMATED LOAN UNDERWRITING
    CREDIT SCORING
    OTHER DIGITAL LENDING APPLICATIONS
  • 7.5 WEALTH MANAGEMENT
    RISING DEMAND FOR PERSONALIZED INVESTMENT STRATEGIES AND ENHANCED RISK TOLERANCE TO FUEL SEGMENT GROWTH
    INVESTMENT PORTFOLIO MANAGEMENT
    ROBO-ADVISORY
    GOAL-BASED INVESTMENT
    TAX OPTIMIZATION
    OTHER WEALTH MANAGEMENT APPLICATIONS
  • 7.6 OTHER APPLICATIONS
OPEN BANKING SOLUTIONS MARKET, BY DEPLOYMENT MODEL
128
  • 8.1 INTRODUCTION
    DEPLOYMENT MODELS: OPEN BANKING SOLUTIONS MARKET DRIVERS
  • 8.2 CLOUD
    NEED FOR SEAMLESS CONNECTIVITY BETWEEN BANKS, THIRD-PARTY PROVIDERS, AND CONSUMERS TO FUEL SEGMENT
  • 8.3 ON-PREMISES
    REQUIREMENT FOR INCREASED CONTROL OVER DATA TO PROPEL SEGMENT
OPEN BANKING SOLUTIONS MARKET, BY DIGITAL CHANNEL
133
  • 9.1 INTRODUCTION
    DIGITAL CHANNELS: OPEN BANKING SOLUTIONS MARKET DRIVERS
  • 9.2 MOBILE APPS
    FOCUS ON AUGMENTED CONVENIENCE AND ACCESSIBILITY TO DRIVE SEGMENT
  • 9.3 WEB PORTALS
    DEMAND FOR CONVENIENT AND SECURE ACCESS TO FINANCES TO BOOST SEGMENT
OPEN BANKING SOLUTIONS MARKET, BY END USER
138
  • 10.1 INTRODUCTION
    END USERS: OPEN BANKING SOLUTIONS MARKET DRIVERS
  • 10.2 THIRD-PARTY PROVIDERS
    NEED FOR ACCESS TO WIDE RANGE OF SERVICES TO BOOST SEGMENT
    ACCOUNT INFORMATION SERVICE PROVIDER
    PAYMENT INITIATION SERVICE PROVIDER
  • 10.3 ACCOUNT PROVIDERS
    INCREASED DEMAND FOR SEAMLESS PAYMENT INITIATION TO DRIVE SEGMENT
    TRADITIONAL BANKS
    - Retail banks
    - Commercial banks
    DIGITAL BANKS
    INVESTMENT BANKS
OPEN BANKING SOLUTIONS MARKET, BY REGION
144
  • 11.1 INTRODUCTION
  • 11.2 NORTH AMERICA
    NORTH AMERICA: OPEN BANKING SOLUTIONS MARKET DRIVERS
    NORTH AMERICA: RECESSION IMPACT
    US
    - Surge in demand for effective implementation of solutions to drive market
    CANADA
    - Need for cloud-based platforms and on-demand services to propel market
  • 11.3 EUROPE
    EUROPE: OPEN BANKING SOLUTIONS MARKET DRIVERS
    EUROPE: RECESSION IMPACT
    UK
    - Rise in demand for innovative solutions that help leverage competition to drive market
    GERMANY
    - Increased demand for transparent and convenient financial services to propel market
    FRANCE
    - Robust regulatory policies and technological innovations to drive market
    ITALY
    - Rise in demand for flexible and scalable solutions from banks to boost market
    REST OF EUROPE
  • 11.4 ASIA PACIFIC
    ASIA PACIFIC: OPEN BANKING SOLUTIONS MARKET DRIVERS
    ASIA PACIFIC: RECESSION IMPACT
    CHINA
    - FinTech giants leveraging their technological capabilities drive market
    JAPAN
    - Introduction of innovative financial products and services to propel market
    INDIA
    - Growing popularity and adoption of UPI products to boost market
    REST OF ASIA PACIFIC
  • 11.5 MIDDLE EAST & AFRICA
    MIDDLE EAST & AFRICA: OPEN BANKING SOLUTIONS MARKET DRIVERS
    MIDDLE EAST & AFRICA: RECESSION IMPACT
    GCC COUNTRIES
    - Kingdom of Saudi Arabia
    - UAE
    - Other GCC Countries
    SOUTH AFRICA
    - Rise in adoption of mobile technologies to contribute to market growth
    REST OF MIDDLE EAST & AFRICA
  • 11.6 LATIN AMERICA
    LATIN AMERICA: OPEN BANKING SOLUTIONS MARKET DRIVERS
    LATIN AMERICA: RECESSION IMPACT
    BRAZIL
    - Strategic shift from traditional banking to open banking solutions to drive market
    MEXICO
    - Increased demand for digital financial services to drive market
    REST OF LATIN AMERICA
COMPETITIVE LANDSCAPE
200
  • 12.1 INTRODUCTION
  • 12.2 KEY PLAYER STRATEGIES/RIGHT TO WIN
  • 12.3 MARKET SHARE ANALYSIS
  • 12.4 OPEN BANKING SOLUTIONS MARKET: VENDOR BRANDS COMPARISON
  • 12.5 REVENUE ANALYSIS
  • 12.6 COMPANY EVALUATION MATRIX: KEY PLAYERS, 2023
    STARS
    EMERGING LEADERS
    PERVASIVE PLAYERS
    PARTICIPANTS
    COMPANY FOOTPRINT: KEY PLAYERS
  • 12.7 COMPANY EVALUATION MATRIX: STARTUPS/SMES, 2023
    RESPONSIVE COMPANIES
    PROGRESSIVE COMPANIES
    DYNAMIC COMPANIES
    STARTING BLOCKS
    COMPETITIVE BENCHMARKING: STARTUPS/SMES
    - Detailed list of key startups/SMEs
    - Competitive benchmarking of key startups/SMEs
  • 12.8 COMPANY VALUATION AND FINANCIAL METRICS OF KEY VENDORS
  • 12.9 COMPETITIVE SCENARIO AND TRENDS
    PRODUCT/SOLUTION/SERVICE LAUNCHES
    DEALS
COMPANY PROFILES
227
  • 13.1 INTRODUCTION
  • 13.2 KEY PLAYERS
    PLAID
    - Business overview
    - Products/Solutions/Services offered
    - Recent developments
    - MnM view
    ENVESTNET
    - Business overview
    - Products/Solutions/Services offered
    - Recent developments
    - MnM view
    TINK
    - Business overview
    - Products/Solutions/Services offered
    - Recent developments
    - MnM view
    MX TECHNOLOGIES
    - Business overview
    - Products/Solutions/Services offered
    - Recent developments
    - MnM view
    FINICITY
    - Business overview
    - Products/Solutions/Services offered
    - Recent developments
    - MnM view
    WORLDLINE
    - Business overview
    - Products/Solutions/Services offered
    - Recent developments
    TRUSTLY
    - Business overview
    - Products/Solutions/Services offered
    - Recent developments
    BBVA
    - Business overview
    - Products/Solutions/Services offered
    - Recent developments
    GOCARDLESS
    - Business overview
    - Products/Solutions/Services offered
    - Recent developments
    TEMENOS
    - Business overview
    - Products/Solutions/Services offered
    - Recent developments
    VOLT
    - Business overview
    - Products/Solutions/Services offered
    - Recent developments
    AXWAY SOFTWARE
    - Business overview
    - Products/Solutions/Services offered
    - Recent developments
  • 13.3 OTHER PLAYERS
    FABRICK
    AKANA
    YAPILY
    SALT EDGE
    TOKEN.IO
    FIORANO
    TRUELAYER
    BUD FINANCIAL
    OPENPAYD
    FINASTRA
    GOOGLE
    SOPRA BANKING SOFTWARE
    INTUIT
    NDGIT
    TESOBE
    DIRECTID
ADJACENT AND RELATED MARKETS
290
  • 14.1 INTRODUCTION
    RELATED MARKETS
  • 14.2 DIGITAL LENDING MARKET
  • 14.3 DIGITAL BANKING PLATFORMS MARKET
APPENDIX
297
  • 15.1 DISCUSSION GUIDE
  • 15.2 KNOWLEDGESTORE: MARKETSANDMARKETS’ SUBSCRIPTION PORTAL
  • 15.3 CUSTOMIZATION OPTIONS
  • 15.4 RELATED REPORTS
  • 15.5 AUTHOR DETAILS
LIST OF TABLES
 
  • TABLE 1 USD EXCHANGE RATES, 2019–2022
  • TABLE 2 FACTOR ANALYSIS
  • TABLE 3 INDICATIVE PRICING ANALYSIS OF OPEN BANKING SOLUTIONS MARKET, BY KEY PLAYER
  • TABLE 4 GLOBAL TOP TEN PATENT OWNERS, 2023
  • TABLE 5 OPEN BANKING SOLUTIONS MARKET: IMPACT OF PORTER'S FIVE FORCES
  • TABLE 6 NORTH AMERICA: REGULATORY BODIES, GOVERNMENT AGENCIES, AND OTHER ORGANIZATIONS
  • TABLE 7 EUROPE: REGULATORY BODIES, GOVERNMENT AGENCIES, AND OTHER ORGANIZATIONS
  • TABLE 8 ASIA PACIFIC: REGULATORY BODIES, GOVERNMENT AGENCIES, AND OTHER ORGANIZATIONS
  • TABLE 9 REST OF THE WORLD: REGULATORY BODIES, GOVERNMENT AGENCIES, AND OTHER ORGANIZATIONS
  • TABLE 10 KEY CONFERENCES AND EVENTS, 2024–2025
  • TABLE 11 INFLUENCE OF STAKEHOLDERS ON BUYING PROCESS FOR END USERS
  • TABLE 12 KEY BUYING CRITERIA FOR END USERS
  • TABLE 13 OPEN BANKING SOLUTIONS MARKET, BY OFFERING, 2019–2022 (USD MILLION)
  • TABLE 14 OPEN BANKING SOLUTIONS MARKET, BY OFFERING, 2023–2028 (USD MILLION)
  • TABLE 15 OPEN BANKING SOLUTIONS MARKET, BY SOLUTION, 2019–2022 (USD MILLION)
  • TABLE 16 OPEN BANKING SOLUTIONS MARKET, BY SOLUTION, 2023–2028 (USD MILLION)
  • TABLE 17 SOLUTIONS: OPEN BANKING SOLUTIONS MARKET, BY REGION, 2019–2022 (USD MILLION)
  • TABLE 18 SOLUTIONS: OPEN BANKING SOLUTIONS MARKET, BY REGION, 2023–2028 (USD MILLION)
  • TABLE 19 PAYMENT INITIATION: MARKET, BY REGION, 2019–2022 (USD MILLION)
  • TABLE 20 PAYMENT INITIATION: MARKET, BY REGION, 2023–2028 (USD MILLION)
  • TABLE 21 ACCOUNT INFORMATION: MARKET, BY REGION, 2019–2022 (USD MILLION)
  • TABLE 22 ACCOUNT INFORMATION: MARKET, BY REGION, 2023–2028 (USD MILLION)
  • TABLE 23 IDENTITY VERIFICATION & AUTHENTICATION: MARKET, BY REGION, 2019–2022 (USD MILLION)
  • TABLE 24 IDENTITY VERIFICATION & AUTHENTICATION: MARKET, BY REGION, 2023–2028 (USD MILLION)
  • TABLE 25 API MANAGEMENT: MARKET, BY REGION, 2019–2022 (USD MILLION)
  • TABLE 26 API MANAGEMENT: MARKET, BY REGION, 2023–2028 (USD MILLION)
  • TABLE 27 OTHER SOLUTIONS: MARKET, BY REGION, 2019–2022 (USD MILLION)
  • TABLE 28 OTHER SOLUTIONS: MARKET, BY REGION, 2023–2028 (USD MILLION)
  • TABLE 29 MARKET, BY SERVICE, 2019–2022 (USD MILLION)
  • TABLE 30 MARKET, BY SERVICE, 2023–2028 (USD MILLION)
  • TABLE 31 SERVICES: MARKET, BY REGION, 2019–2022 (USD MILLION)
  • TABLE 32 SERVICES: MARKET, BY REGION, 2023–2028 (USD MILLION)
  • TABLE 33 PROFESSIONAL SERVICES: MARKET, BY REGION, 2019–2022 (USD MILLION)
  • TABLE 34 PROFESSIONAL SERVICES: MARKET, BY REGION, 2023–2028 (USD MILLION)
  • TABLE 35 MANAGED SERVICES: MARKET, BY REGION, 2019–2022 (USD MILLION)
  • TABLE 36 MANAGED SERVICES: MARKET, BY REGION, 2023–2028 (USD MILLION)
  • TABLE 37 MARKET, BY APPLICATION, 2019–2022 (USD MILLION)
  • TABLE 38 MARKET, BY APPLICATION, 2023–2028 (USD MILLION)
  • TABLE 39 PAYMENT: MARKET, BY REGION, 2019–2022 (USD MILLION)
  • TABLE 40 PAYMENT: MARKET, BY REGION, 2023–2028 (USD MILLION)
  • TABLE 41 BANKING: MARKET, BY REGION, 2019–2022 (USD MILLION)
  • TABLE 42 BANKING: MARKET, BY REGION, 2023–2028 (USD MILLION)
  • TABLE 43 DIGITAL LENDING: MARKET, BY REGION, 2019–2022 (USD MILLION)
  • TABLE 44 DIGITAL LENDING: MARKET, BY REGION, 2023–2028 (USD MILLION)
  • TABLE 45 WEALTH MANAGEMENT: MARKET, BY REGION, 2019–2022 (USD MILLION)
  • TABLE 46 WEALTH MANAGEMENT: MARKET, BY REGION, 2023–2028 (USD MILLION)
  • TABLE 47 OTHER APPLICATIONS: MARKET, BY REGION, 2019–2022 (USD MILLION)
  • TABLE 48 OTHER APPLICATIONS: MARKET, BY REGION, 2023–2028 (USD MILLION)
  • TABLE 49 MARKET, BY DEPLOYMENT MODEL, 2019–2022 (USD MILLION)
  • TABLE 50 MARKET, BY DEPLOYMENT MODEL, 2023–2028 (USD MILLION)
  • TABLE 51 CLOUD: MARKET, BY REGION, 2019–2022 (USD MILLION)
  • TABLE 52 CLOUD: MARKET, BY REGION, 2023–2028 (USD MILLION)
  • TABLE 53 ON-PREMISES: MARKET, BY REGION, 2019–2022 (USD MILLION)
  • TABLE 54 ON-PREMISES: MARKET, BY REGION, 2023–2028 (USD MILLION)
  • TABLE 55 MARKET, BY DIGITAL CHANNEL, 2019–2022 (USD MILLION)
  • TABLE 56 MARKET, BY DIGITAL CHANNEL, 2023–2028 (USD MILLION)
  • TABLE 57 MOBILE APPS: MARKET, BY REGION, 2019–2022 (USD MILLION)
  • TABLE 58 MOBILE APPS: MARKET, BY REGION, 2023–2028 (USD MILLION)
  • TABLE 59 WEB PORTALS: MARKET, BY REGION, 2019–2022 (USD MILLION)
  • TABLE 60 WEB PORTALS: MARKET, BY REGION, 2023–2028 (USD MILLION)
  • TABLE 61 MARKET, BY END USER, 2019–2022 (USD MILLION)
  • TABLE 62 MARKET, BY END USER, 2023–2028 (USD MILLION)
  • TABLE 63 THIRD-PARTY PROVIDERS: MARKET, BY REGION, 2019–2022 (USD MILLION)
  • TABLE 64 THIRD-PARTY PROVIDERS: MARKET, BY REGION, 2023–2028 (USD MILLION)
  • TABLE 65 ACCOUNT PROVIDERS: MARKET, BY REGION, 2019–2022 (USD MILLION)
  • TABLE 66 ACCOUNT PROVIDERS: MARKET, BY REGION, 2023–2028 (USD MILLION)
  • TABLE 67 MARKET, BY REGION, 2019–2022 (USD MILLION)
  • TABLE 68 MARKET, BY REGION, 2023–2028 (USD MILLION)
  • TABLE 69 NORTH AMERICA: MARKET, BY OFFERING, 2019–2022 (USD MILLION)
  • TABLE 70 NORTH AMERICA: MARKET, BY OFFERING, 2023–2028 (USD MILLION)
  • TABLE 71 NORTH AMERICA: MARKET, BY SOLUTION, 2019–2022 (USD MILLION)
  • TABLE 72 NORTH AMERICA: MARKET, BY SOLUTION, 2023–2028 (USD MILLION)
  • TABLE 73 NORTH AMERICA: MARKET, BY SERVICE, 2019–2022 (USD MILLION)
  • TABLE 74 NORTH AMERICA: MARKET, BY SERVICE, 2023–2028 (USD MILLION)
  • TABLE 75 NORTH AMERICA: MARKET, BY APPLICATION, 2019–2022 (USD MILLION)
  • TABLE 76 NORTH AMERICA: MARKET, BY APPLICATION, 2023–2028 (USD MILLION)
  • TABLE 77 NORTH AMERICA: MARKET, BY DEPLOYMENT MODEL, 2019–2022 (USD MILLION)
  • TABLE 78 NORTH AMERICA: MARKET, BY DEPLOYMENT MODEL, 2023–2028 (USD MILLION)
  • TABLE 79 NORTH AMERICA: MARKET, BY DIGITAL CHANNEL, 2019–2022 (USD MILLION)
  • TABLE 80 NORTH AMERICA: MARKET, BY DIGITAL CHANNEL, 2023–2028 (USD MILLION)
  • TABLE 81 NORTH AMERICA: MARKET, BY END USER, 2019–2022 (USD MILLION)
  • TABLE 82 NORTH AMERICA: MARKET, BY END USER, 2023–2028 (USD MILLION)
  • TABLE 83 NORTH AMERICA: MARKET, BY COUNTRY, 2019–2022 (USD MILLION)
  • TABLE 84 NORTH AMERICA: MARKET, BY COUNTRY, 2023–2028 (USD MILLION)
  • TABLE 85 US: MARKET, BY OFFERING, 2019–2022 (USD MILLION)
  • TABLE 86 US: MARKET, BY OFFERING, 2023–2028 (USD MILLION)
  • TABLE 87 US: MARKET, BY DEPLOYMENT MODEL, 2019–2022 (USD MILLION)
  • TABLE 88 US: MARKET, BY DEPLOYMENT MODEL, 2023–2028 (USD MILLION)
  • TABLE 89 CANADA: MARKET, BY OFFERING, 2019–2022 (USD MILLION)
  • TABLE 90 CANADA: MARKET, BY OFFERING, 2023–2028 (USD MILLION)
  • TABLE 91 CANADA: MARKET, BY DEPLOYMENT MODEL, 2019–2022 (USD MILLION)
  • TABLE 92 CANADA: MARKET, BY DEPLOYMENT MODEL, 2023–2028 (USD MILLION)
  • TABLE 93 EUROPE: MARKET, BY OFFERING, 2019–2022 (USD MILLION)
  • TABLE 94 EUROPE: MARKET, BY OFFERING, 2023–2028 (USD MILLION)
  • TABLE 95 EUROPE: MARKET, BY SOLUTION, 2019–2022 (USD MILLION)
  • TABLE 96 EUROPE: MARKET, BY SOLUTION, 2023–2028 (USD MILLION)
  • TABLE 97 EUROPE: MARKET, BY SERVICE, 2019–2022 (USD MILLION)
  • TABLE 98 EUROPE: MARKET, BY SERVICE, 2023–2028 (USD MILLION)
  • TABLE 99 EUROPE: MARKET, BY APPLICATION, 2019–2022 (USD MILLION)
  • TABLE 100 EUROPE: MARKET, BY APPLICATION, 2023–2028 (USD MILLION)
  • TABLE 101 EUROPE: MARKET, BY DEPLOYMENT MODEL, 2019–2022 (USD MILLION)
  • TABLE 102 EUROPE: MARKET, BY DEPLOYMENT MODEL, 2023–2028 (USD MILLION)
  • TABLE 103 EUROPE: MARKET, BY DIGITAL CHANNEL, 2019–2022 (USD MILLION)
  • TABLE 104 EUROPE: MARKET, BY DIGITAL CHANNEL, 2023–2028 (USD MILLION)
  • TABLE 105 EUROPE: MARKET, BY END USER, 2019–2022 (USD MILLION)
  • TABLE 106 EUROPE: MARKET, BY END USER, 2023–2028 (USD MILLION)
  • TABLE 107 EUROPE: MARKET, BY COUNTRY, 2019–2022 (USD MILLION)
  • TABLE 108 EUROPE: MARKET, BY COUNTRY, 2023–2028 (USD MILLION)
  • TABLE 109 UK: MARKET, BY OFFERING, 2019–2022 (USD MILLION)
  • TABLE 110 UK: MARKET, BY OFFERING, 2023–2028 (USD MILLION)
  • TABLE 111 UK: MARKET, BY DEPLOYMENT MODEL, 2019–2022 (USD MILLION)
  • TABLE 112 UK: MARKET, BY DEPLOYMENT MODEL, 2023–2028 (USD MILLION)
  • TABLE 113 GERMANY: MARKET, BY OFFERING, 2019–2022 (USD MILLION)
  • TABLE 114 GERMANY: MARKET, BY OFFERING, 2023–2028 (USD MILLION)
  • TABLE 115 GERMANY: MARKET, BY DEPLOYMENT MODEL, 2019–2022 (USD MILLION)
  • TABLE 116 GERMANY: MARKET, BY DEPLOYMENT MODEL, 2023–2028 (USD MILLION)
  • TABLE 117 FRANCE: MARKET, BY OFFERING, 2019–2022 (USD MILLION)
  • TABLE 118 FRANCE: MARKET, BY OFFERING, 2023–2028 (USD MILLION)
  • TABLE 119 FRANCE: MARKET, BY DEPLOYMENT MODEL, 2019–2022 (USD MILLION)
  • TABLE 120 FRANCE: MARKET, BY DEPLOYMENT MODEL, 2023–2028 (USD MILLION)
  • TABLE 121 ITALY: MARKET, BY OFFERING, 2019–2022 (USD MILLION)
  • TABLE 122 ITALY: MARKET, BY OFFERING, 2023–2028 (USD MILLION)
  • TABLE 123 ITALY: MARKET, BY DEPLOYMENT MODEL, 2019–2022 (USD MILLION)
  • TABLE 124 ITALY: MARKET, BY DEPLOYMENT MODEL, 2023–2028 (USD MILLION)
  • TABLE 125 REST OF EUROPE: MARKET, BY OFFERING, 2019–2022 (USD MILLION)
  • TABLE 126 REST OF EUROPE: MARKET, BY OFFERING, 2023–2028 (USD MILLION)
  • TABLE 127 REST OF EUROPE: MARKET, BY DEPLOYMENT MODEL, 2019–2022 (USD MILLION)
  • TABLE 128 REST OF EUROPE: MARKET, BY DEPLOYMENT MODEL, 2023–2028 (USD MILLION)
  • TABLE 129 ASIA PACIFIC: MARKET, BY OFFERING, 2019–2022 (USD MILLION)
  • TABLE 130 ASIA PACIFIC: MARKET, BY OFFERING, 2023–2028 (USD MILLION)
  • TABLE 131 ASIA PACIFIC: MARKET, BY SOLUTION, 2019–2022 (USD MILLION)
  • TABLE 132 ASIA PACIFIC: MARKET, BY SOLUTION, 2023–2028 (USD MILLION)
  • TABLE 133 ASIA PACIFIC: MARKET, BY SERVICE, 2019–2022 (USD MILLION)
  • TABLE 134 ASIA PACIFIC: MARKET, BY SERVICE, 2023–2028 (USD MILLION)
  • TABLE 135 ASIA PACIFIC: MARKET, BY APPLICATION, 2019–2022 (USD MILLION)
  • TABLE 136 ASIA PACIFIC: MARKET, BY APPLICATION, 2023–2028 (USD MILLION)
  • TABLE 137 ASIA PACIFIC: MARKET, BY DEPLOYMENT MODEL, 2019–2022 (USD MILLION)
  • TABLE 138 ASIA PACIFIC: MARKET, BY DEPLOYMENT MODEL, 2023–2028 (USD MILLION)
  • TABLE 139 ASIA PACIFIC: MARKET, BY DIGITAL CHANNEL, 2019–2022 (USD MILLION)
  • TABLE 140 ASIA PACIFIC: MARKET, BY DIGITAL CHANNEL, 2023–2028 (USD MILLION)
  • TABLE 141 ASIA PACIFIC: MARKET, BY END USER, 2019–2022 (USD MILLION)
  • TABLE 142 ASIA PACIFIC: MARKET, BY END USER, 2023–2028 (USD MILLION)
  • TABLE 143 ASIA PACIFIC: MARKET, BY COUNTRY, 2019–2022 (USD MILLION)
  • TABLE 144 ASIA PACIFIC: MARKET, BY COUNTRY, 2023–2028 (USD MILLION)
  • TABLE 145 CHINA: MARKET, BY OFFERING, 2019–2022 (USD MILLION)
  • TABLE 146 CHINA: MARKET, BY OFFERING, 2023–2028 (USD MILLION)
  • TABLE 147 CHINA: MARKET, BY DEPLOYMENT MODEL, 2019–2022 (USD MILLION)
  • TABLE 148 CHINA: MARKET, BY DEPLOYMENT MODEL, 2023–2028 (USD MILLION)
  • TABLE 149 JAPAN: MARKET, BY OFFERING, 2019–2022 (USD MILLION)
  • TABLE 150 JAPAN: MARKET, BY OFFERING, 2023–2028 (USD MILLION)
  • TABLE 151 JAPAN: MARKET, BY DEPLOYMENT MODEL, 2019–2022 (USD MILLION)
  • TABLE 152 JAPAN: MARKET, BY DEPLOYMENT MODEL, 2023–2028 (USD MILLION)
  • TABLE 153 INDIA: MARKET, BY OFFERING, 2019–2022 (USD MILLION)
  • TABLE 154 INDIA: MARKET, BY OFFERING, 2023–2028 (USD MILLION)
  • TABLE 155 INDIA: MARKET, BY DEPLOYMENT MODEL, 2019–2022 (USD MILLION)
  • TABLE 156 INDIA: MARKET, BY DEPLOYMENT MODEL, 2023–2028 (USD MILLION)
  • TABLE 157 REST OF ASIA PACIFIC: MARKET, BY OFFERING, 2019–2022 (USD MILLION)
  • TABLE 158 REST OF ASIA PACIFIC: MARKET, BY OFFERING, 2023–2028 (USD MILLION)
  • TABLE 159 REST OF ASIA PACIFIC: MARKET, BY DEPLOYMENT MODEL, 2019–2022 (USD MILLION)
  • TABLE 160 REST OF ASIA PACIFIC: MARKET, BY DEPLOYMENT MODEL, 2023–2028 (USD MILLION)
  • TABLE 161 MIDDLE EAST & AFRICA: MARKET, BY OFFERING, 2019–2022 (USD MILLION)
  • TABLE 162 MIDDLE EAST & AFRICA: MARKET, BY OFFERING, 2023–2028 (USD MILLION)
  • TABLE 163 MIDDLE EAST & AFRICA: MARKET, BY SOLUTION, 2019–2022 (USD MILLION)
  • TABLE 164 MIDDLE EAST & AFRICA: MARKET, BY SOLUTION, 2023–2028 (USD MILLION)
  • TABLE 165 MIDDLE EAST & AFRICA: MARKET, BY SERVICE, 2019–2022 (USD MILLION)
  • TABLE 166 MIDDLE EAST & AFRICA: MARKET, BY SERVICE, 2023–2028 (USD MILLION)
  • TABLE 167 MIDDLE EAST & AFRICA: MARKET, BY APPLICATION, 2019–2022 (USD MILLION)
  • TABLE 168 MIDDLE EAST & AFRICA: MARKET, BY APPLICATION, 2023–2028 (USD MILLION)
  • TABLE 169 MIDDLE EAST & AFRICA: MARKET, BY DEPLOYMENT MODEL, 2019–2022 (USD MILLION)
  • TABLE 170 MIDDLE EAST & AFRICA: MARKET, BY DEPLOYMENT MODEL, 2023–2028 (USD MILLION)
  • TABLE 171 MIDDLE EAST & AFRICA: MARKET, BY DIGITAL CHANNEL, 2019–2022 (USD MILLION)
  • TABLE 172 MIDDLE EAST & AFRICA: MARKET, BY DIGITAL CHANNEL, 2023–2028 (USD MILLION)
  • TABLE 173 MIDDLE EAST & AFRICA: MARKET, BY END USER, 2019–2022 (USD MILLION)
  • TABLE 174 MIDDLE EAST & AFRICA: MARKET, BY END USER, 2023–2028 (USD MILLION)
  • TABLE 175 MIDDLE EAST & AFRICA: MARKET, BY COUNTRY, 2019–2022 (USD MILLION)
  • TABLE 176 MIDDLE EAST & AFRICA: MARKET, BY COUNTRY, 2023–2028 (USD MILLION)
  • TABLE 177 GCC COUNTRIES: MARKET, BY OFFERING, 2019–2022 (USD MILLION)
  • TABLE 178 GCC COUNTRIES: MARKET, BY OFFERING, 2023–2028 (USD MILLION)
  • TABLE 179 GCC COUNTRIES: MARKET, BY DEPLOYMENT MODEL, 2019–2022 (USD MILLION)
  • TABLE 180 GCC COUNTRIES: MARKET, BY DEPLOYMENT MODEL, 2023–2028 (USD MILLION)
  • TABLE 181 GCC COUNTRIES: MARKET, BY COUNTRY, 2019–2022 (USD MILLION)
  • TABLE 182 GCC COUNTRIES: MARKET, BY COUNTRY, 2023–2028 (USD MILLION)
  • TABLE 183 SOUTH AFRICA: MARKET, BY OFFERING, 2019–2022 (USD MILLION)
  • TABLE 184 SOUTH AFRICA: MARKET, BY OFFERING, 2023–2028 (USD MILLION)
  • TABLE 185 SOUTH AFRICA: MARKET, BY DEPLOYMENT MODEL, 2019–2022 (USD MILLION)
  • TABLE 186 SOUTH AFRICA: MARKET, BY DEPLOYMENT MODEL, 2023–2028 (USD MILLION)
  • TABLE 187 REST OF MIDDLE EAST & AFRICA: MARKET, BY OFFERING, 2019–2022 (USD MILLION)
  • TABLE 188 REST OF MIDDLE EAST & AFRICA: MARKET, BY OFFERING, 2023–2028 (USD MILLION)
  • TABLE 189 REST OF MIDDLE EAST & AFRICA: MARKET, BY DEPLOYMENT MODEL, 2019–2022 (USD MILLION)
  • TABLE 190 REST OF MIDDLE EAST & AFRICA: MARKET, BY DEPLOYMENT MODEL, 2023–2028 (USD MILLION)
  • TABLE 191 LATIN AMERICA: MARKET, BY OFFERING, 2019–2022 (USD MILLION)
  • TABLE 192 LATIN AMERICA: MARKET, BY OFFERING, 2023–2028 (USD MILLION)
  • TABLE 193 LATIN AMERICA: MARKET, BY SOLUTION, 2019–2022 (USD MILLION)
  • TABLE 194 LATIN AMERICA: MARKET, BY SOLUTION, 2023–2028 (USD MILLION)
  • TABLE 195 LATIN AMERICA: MARKET, BY SERVICE, 2019–2022 (USD MILLION)
  • TABLE 196 LATIN AMERICA: MARKET, BY SERVICE, 2023–2028 (USD MILLION)
  • TABLE 197 LATIN AMERICA: MARKET, BY APPLICATION, 2019–2022 (USD MILLION)
  • TABLE 198 LATIN AMERICA: MARKET, BY APPLICATION, 2023–2028 (USD MILLION)
  • TABLE 199 LATIN AMERICA: MARKET, BY DEPLOYMENT MODEL, 2019–2022 (USD MILLION)
  • TABLE 200 LATIN AMERICA: MARKET, BY DEPLOYMENT MODEL, 2023–2028 (USD MILLION)
  • TABLE 201 LATIN AMERICA: MARKET, BY DIGITAL CHANNEL, 2019–2022 (USD MILLION)
  • TABLE 202 LATIN AMERICA: MARKET, BY DIGITAL CHANNEL, 2023–2028 (USD MILLION)
  • TABLE 203 LATIN AMERICA: MARKET, BY END USER, 2019–2022 (USD MILLION)
  • TABLE 204 LATIN AMERICA: MARKET, BY END USER, 2023–2028 (USD MILLION)
  • TABLE 205 LATIN AMERICA: MARKET, BY COUNTRY, 2019–2022 (USD MILLION)
  • TABLE 206 LATIN AMERICA: MARKET, BY COUNTRY, 2023–2028 (USD MILLION)
  • TABLE 207 BRAZIL: MARKET, BY OFFERING, 2019–2022 (USD MILLION)
  • TABLE 208 BRAZIL: MARKET, BY OFFERING, 2023–2028 (USD MILLION)
  • TABLE 209 BRAZIL: MARKET, BY DEPLOYMENT MODEL, 2019–2022 (USD MILLION)
  • TABLE 210 BRAZIL: MARKET, BY DEPLOYMENT MODEL, 2023–2028 (USD MILLION)
  • TABLE 211 MEXICO: MARKET, BY OFFERING, 2019–2022 (USD MILLION)
  • TABLE 212 MEXICO: MARKET, BY OFFERING, 2023–2028 (USD MILLION)
  • TABLE 213 MEXICO: MARKET, BY DEPLOYMENT MODEL, 2019–2022 (USD MILLION)
  • TABLE 214 MEXICO: MARKET, BY DEPLOYMENT MODEL, 2023–2028 (USD MILLION)
  • TABLE 215 REST OF LATIN AMERICA: MARKET, BY OFFERING, 2019–2022 (USD MILLION)
  • TABLE 216 REST OF LATIN AMERICA: MARKET, BY OFFERING, 2023–2028 (USD MILLION)
  • TABLE 217 REST OF LATIN AMERICA: MARKET, BY DEPLOYMENT MODEL, 2019–2022 (USD MILLION)
  • TABLE 218 REST OF LATIN AMERICA: MARKET, BY DEPLOYMENT MODEL, 2023–2028 (USD MILLION)
  • TABLE 219 OVERVIEW OF STRATEGIES ADOPTED BY KEY VENDORS
  • TABLE 220 MARKET SHARE OF KEY VENDORS, 2022
  • TABLE 221 COMPARISON OF VENDORS’ BRANDS
  • TABLE 222 MARKET: REGIONAL FOOTPRINT
  • TABLE 223 MARKET: SOLUTION FOOTPRINT
  • TABLE 224 MARKET: APPLICATION FOOTPRINT
  • TABLE 225 MARKET: KEY STARTUPS/SMES
  • TABLE 226 MARKET: COMPETITIVE BENCHMARKING OF KEY STARTUPS/SMES
  • TABLE 227 MARKET: PRODUCT/SOLUTION/SERVICE LAUNCHES, SEPTEMBER 2020–JANUARY 2024
  • TABLE 228 MARKET: DEALS, NOVEMBER 2020–FEBRUARY 2024
  • TABLE 229 PLAID: BUSINESS OVERVIEW
  • TABLE 230 PLAID: PRODUCTS/SOLUTIONS/SERVICES OFFERED
  • TABLE 231 PLAID: PRODUCTS/SOLUTIONS/SERVICES LAUNCHES
  • TABLE 232 PLAID: DEALS
  • TABLE 233 ENVESTNET: BUSINESS OVERVIEW
  • TABLE 234 ENVESTNET: PRODUCTS/SOLUTIONS/SERVICES OFFERED
  • TABLE 235 ENVESTNET: PRODUCTS/SOLUTIONS/SERVICES LAUNCHES
  • TABLE 236 ENVESTNET: DEALS
  • TABLE 237 TINK: BUSINESS OVERVIEW
  • TABLE 238 TINK: PRODUCTS/SOLUTIONS/SERVICES OFFERED
  • TABLE 239 TINK: PRODUCTS/SOLUTIONS/SERVICES LAUNCHES
  • TABLE 240 TINK: DEALS
  • TABLE 241 MX TECHNOLOGIES: BUSINESS OVERVIEW
  • TABLE 242 MX TECHNOLOGIES: PRODUCTS/SOLUTIONS/SERVICES OFFERED
  • TABLE 243 MX TECHNOLOGIES: PRODUCTS/SOLUTIONS/SERVICES LAUNCHES
  • TABLE 244 MX TECHNOLOGIES: DEALS
  • TABLE 245 FINICITY: BUSINESS OVERVIEW
  • TABLE 246 FINICITY: PRODUCTS/SOLUTIONS/SERVICES OFFERED
  • TABLE 247 FINICITY: PRODUCTS/SOLUTIONS/SERVICES LAUNCHES
  • TABLE 248 FINICITY: DEALS
  • TABLE 249 WORLDLINE: BUSINESS OVERVIEW
  • TABLE 250 WORLDLINE: PRODUCTS/SOLUTIONS/SERVICES OFFERED
  • TABLE 251 WORLDLINE: PRODUCTS/SOLUTIONS/SERVICES LAUNCHES
  • TABLE 252 WORLDLINE: DEALS
  • TABLE 253 TRUSTLY: BUSINESS OVERVIEW
  • TABLE 254 TRUSTLY: PRODUCTS/SOLUTIONS/SERVICES OFFERED
  • TABLE 255 TRUSTLY: PRODUCTS/SOLUTIONS/SERVICES LAUNCHES
  • TABLE 256 TRUSTLY: DEALS
  • TABLE 257 BBVA: BUSINESS OVERVIEW
  • TABLE 258 BBVA: PRODUCTS/SOLUTIONS/SERVICES OFFERED
  • TABLE 259 BBVA: PRODUCTS/SOLUTIONS/SERVICES LAUNCHES
  • TABLE 260 BBVA: DEALS
  • TABLE 261 GOCARDLESS: COMPANY OVERVIEW
  • TABLE 262 GOCARDLESS: PRODUCTS/SOLUTIONS/SERVICES OFFERED
  • TABLE 263 GOCARDLESS: PRODUCTS/SOLUTIONS/SERVICES LAUNCHES
  • TABLE 264 GOCARDLESS: DEALS
  • TABLE 265 TEMENOS: BUSINESS OVERVIEW
  • TABLE 266 TEMENOS: PRODUCTS/SOLUTIONS/SERVICES OFFERED
  • TABLE 267 TEMENOS: PRODUCTS/SOLUTIONS/SERVICES LAUNCHES
  • TABLE 268 TEMENOS: DEALS
  • TABLE 269 VOLT: BUSINESS OVERVIEW
  • TABLE 270 VOLT: PRODUCTS/SOLUTIONS/SERVICES OFFERED
  • TABLE 271 VOLT: PRODUCTS/SOLUTIONS/SERVICES LAUNCHES
  • TABLE 272 VOLT: DEALS
  • TABLE 273 AXWAY SOFTWARE: BUSINESS OVERVIEW
  • TABLE 274 AXWAY SOFTWARE: PRODUCTS/SOLUTIONS/SERVICES OFFERED
  • TABLE 275 AXWAY SOFTWARE: DEALS
  • TABLE 276 DIGITAL LENDING MARKET, BY OFFERING, 2017–2020 (USD MILLION)
  • TABLE 277 DIGITAL LENDING MARKET, BY OFFERING, 2021–2026 (USD MILLION)
  • TABLE 278 DIGITAL LENDING MARKET, BY SOLUTION, 2017–2020 (USD MILLION)
  • TABLE 279 DIGITAL LENDING MARKET, BY SOLUTION, 2021–2026 (USD MILLION)
  • TABLE 280 DIGITAL LENDING MARKET, BY SERVICE, 2017–2020 (USD MILLION)
  • TABLE 281 DIGITAL LENDING MARKET, BY SERVICE, 2021–2026 (USD MILLION)
  • TABLE 282 DIGITAL LENDING MARKET, BY DEPLOYMENT MODE, 2017–2020 (USD MILLION)
  • TABLE 283 DIGITAL LENDING MARKET, BY DEPLOYMENT MODE, 2021–2026 (USD MILLION)
  • TABLE 284 DIGITAL LENDING MARKET, BY END USER, 2017–2020 (USD MILLION)
  • TABLE 285 DIGITAL LENDING MARKET, BY END USER, 2021–2026 (USD MILLION)
  • TABLE 286 DIGITAL LENDING MARKET, BY REGION, 2017–2020 (USD MILLION)
  • TABLE 287 DIGITAL LENDING MARKET, BY REGION, 2021–2026 (USD MILLION)
  • TABLE 288 DIGITAL BANKING PLATFORMS MARKET, BY COMPONENT, 2017–2020 (USD MILLION)
  • TABLE 289 DIGITAL BANKING PLATFORMS MARKET, BY COMPONENT, 2021–2026 (USD MILLION)
  • TABLE 290 DIGITAL BANKING PLATFORMS MARKET, BY BANKING TYPE, 2017–2020 (USD MILLION)
  • TABLE 291 DIGITAL BANKING PLATFORMS MARKET, BY BANKING TYPE, 2021–2026 (USD MILLION)
  • TABLE 292 DIGITAL BANKING PLATFORMS MARKET, BY BANKING MODE, 2017–2020 (USD MILLION)
  • TABLE 293 DIGITAL BANKING PLATFORMS MARKET, BY BANKING MODE, 2021–2026 (USD MILLION)
  • TABLE 294 DIGITAL BANKING PLATFORMS MARKET, BY DEPLOYMENT TYPE, 2017–2020 (USD MILLION)
  • TABLE 295 DIGITAL BANKING PLATFORMS MARKET, BY DEPLOYMENT TYPE, 2021–2026 (USD MILLION)
  • TABLE 296 DIGITAL BANKING PLATFORMS MARKET, BY REGION, 2017–2020 (USD MILLION)
  • TABLE 297 DIGITAL BANKING PLATFORMS MARKET, BY REGION, 2021–2026 (USD MILLION)
LIST OF FIGURES
 
  • FIGURE 1 MARKET: RESEARCH DESIGN
  • FIGURE 2 OPEN BANKING SOLUTIONS MARKET: MARKET BREAKUP AND DATA TRIANGULATION
  • FIGURE 3 OPEN BANKING SOLUTIONS MARKET: TOP-DOWN AND BOTTOM-UP APPROACHES
  • FIGURE 4 MARKET SIZE ESTIMATION METHODOLOGY: TOP-DOWN APPROACH
  • FIGURE 5 MARKET SIZE ESTIMATION METHODOLOGY: BOTTOM-UP APPROACH
  • FIGURE 6 OPEN BANKING SOLUTIONS MARKET: RESEARCH FLOW
  • FIGURE 7 MARKET SIZE ESTIMATION METHODOLOGY: SUPPLY-SIDE ANALYSIS
  • FIGURE 8 MARKET SIZE ESTIMATION METHODOLOGY: APPROACH 1, BOTTOM-UP (SUPPLY SIDE)– COLLECTIVE REVENUE GENERATED FROM VENDORS
  • FIGURE 9 MARKET SIZE ESTIMATION METHODOLOGY: APPROACH 2, SUPPLY-SIDE ANALYSIS
  • FIGURE 10 MARKET SIZE ESTIMATION METHODOLOGY: APPROACH 3, TOP-DOWN (DEMAND SIDE)
  • FIGURE 11 SEGMENTS WITH SIGNIFICANT GROWTH RATES
  • FIGURE 12 OPEN BANKING SOLUTIONS MARKET: REGIONAL SNAPSHOT
  • FIGURE 13 COMPLIANCE WITH REGULATORY STANDARDS, BOTH REGIONAL AND GLOBAL, TO SUPPORT GROWTH OF OPEN BANKING SOLUTIONS MARKET
  • FIGURE 14 SOLUTIONS SEGMENT TO ACCOUNT FOR LARGER MARKET SHARE DURING FORECAST PERIOD
  • FIGURE 15 PAYMENT INITIATION SEGMENT TO ACCOUNT FOR LARGEST MARKET SHARE DURING FORECAST PERIOD
  • FIGURE 16 PROFESSIONAL SERVICES SEGMENT TO HOLD LARGER MARKET SHARE DURING FORECAST PERIOD
  • FIGURE 17 PAYMENT SEGMENT TO HOLD LARGEST MARKET SHARE DURING FORECAST PERIOD
  • FIGURE 18 WEB PORTALS SEGMENT TO HOLD LARGER MARKET SHARE DURING FORECAST PERIOD
  • FIGURE 19 THIRD-PARTY PROVIDERS SEGMENT TO HOLD LARGER MARKET SHARE DURING FORECAST PERIOD
  • FIGURE 20 MIDDLE EAST & AFRICA TO EMERGE AS LUCRATIVE MARKET FOR INVESTMENTS IN NEXT FIVE YEARS
  • FIGURE 21 OPEN BANKING SOLUTIONS MARKET: DRIVERS, RESTRAINTS, OPPORTUNITIES, AND CHALLENGES
  • FIGURE 22 ECOSYSTEM MAPPING
  • FIGURE 23 VALUE CHAIN ANALYSIS
  • FIGURE 24 LEADING MAJOR OPEN BANKING SOLUTIONS MARKET VENDORS, BY NUMBER OF INVESTORS AND FUNDING ROUNDS, 2023
  • FIGURE 25 NUMBER OF PATENTS PUBLISHED, 2012–2023
  • FIGURE 26 GLOBAL TOP FIVE PATENT OWNERS, 2023
  • FIGURE 27 PORTER'S FIVE FORCES ANALYSIS
  • FIGURE 28 REVENUE SHIFT AND NEW REVENUE POCKETS FOR PLAYERS IN OPEN BANKING SOLUTIONS MARKET
  • FIGURE 29 INFLUENCE OF STAKEHOLDERS ON BUYING PROCESS FOR END USERS
  • FIGURE 30 KEY BUYING CRITERIA FOR END USERS
  • FIGURE 31 SERVICES SEGMENT TO GROW AT HIGHER CAGR DURING FORECAST PERIOD
  • FIGURE 32 API MANAGEMENT SEGMENT TO GROW AT HIGHEST CAGR DURING FORECAST PERIOD
  • FIGURE 33 MANAGED SERVICES SEGMENT TO GROW AT HIGHEST CAGR DURING FORECAST PERIOD
  • FIGURE 34 WEALTH MANAGEMENT SEGMENT TO GROW AT HIGHEST CAGR DURING FORECAST PERIOD
  • FIGURE 35 CLOUD SEGMENT TO GROW AT HIGHER CAGR DURING FORECAST PERIOD
  • FIGURE 36 MOBILE APPS SEGMENT TO GROW AT HIGHER CAGR DURING FORECAST PERIOD
  • FIGURE 37 THIRD-PARTY PROVIDERS SEGMENT TO GROW AT HIGHER CAGR DURING FORECAST PERIOD
  • FIGURE 38 MIDDLE EAST & AFRICA TO GROW AT HIGHEST CAGR DURING FORECAST PERIOD
  • FIGURE 39 NORTH AMERICA: MARKET SNAPSHOT
  • FIGURE 40 ASIA PACIFIC: MARKET SNAPSHOT
  • FIGURE 41 OPEN BANKING SOLUTIONS MARKET: MARKET SHARE ANALYSIS, 2022
  • FIGURE 42 HISTORICAL REVENUE ANALYSIS, 2018–2022 (USD MILLION)
  • FIGURE 43 COMPANY EVALUATION MATRIX FOR KEY PLAYERS: CRITERIA WEIGHTAGE
  • FIGURE 44 COMPANY EVALUATION MATRIX: KEY PLAYERS, 2023
  • FIGURE 45 OPEN BANKING SOLUTIONS MARKET: COMPANY FOOTPRINT
  • FIGURE 46 COMPANY EVALUATION MATRIX FOR STARTUPS/SMES: CRITERIA WEIGHTAGE
  • FIGURE 47 COMPANY EVALUATION MATRIX: STARTUPS/SMES, 2023
  • FIGURE 48 COMPANY VALUATION AND FINANCIAL METRICS OF KEY VENDORS
  • FIGURE 49 YEAR-TO-DATE (YTD) PRICE TOTAL RETURN AND 5-YEAR STOCK BETA OF KEY VENDORS
  • FIGURE 50 ENVESTNET: COMPANY SNAPSHOT
  • FIGURE 51 WORLDLINE: COMPANY SNAPSHOT
  • FIGURE 52 BBVA: COMPANY SNAPSHOT
  • FIGURE 53 TEMENOS: COMPANY SNAPSHOT
  • FIGURE 54 AXWAY SOFTWARE: COMPANY SNAPSHOT


The study covered four main actions to estimate the current market size of the Open Banking solutions market. We conducted significant secondary research to gather data on the market, the competing market, and the parent market. The following stage involved conducting primary research to confirm these conclusions' hypotheses and sizing with industry experts throughout the value chain. A combination of top-down and bottom-up methods was used to assess the overall market size. We then estimated the market sizes of the leading Open Banking solutions segments using the market breakup and data triangulation techniques.

Secondary Research

A wide range of secondary sources, directories, and databases were employed in this research project, including product demos, vendor data sheets, D&B Hoovers, DiscoverOrg, Factiva, Vendor Surveys, Global Findex database, Association for Financial Technology (AFT), and Company Websites/Annual Reports/SEC Filings. We referred to sources to locate and gather important data for this technical, commercial, and market-focused analysis of the Open Banking solutions market.

Primary Research

Several industry experts from the core and related industries and providers of preferred software  developers, distributors, service providers, technology developers, alliances, and organisations connected to every link in the industry value chain were the primary sources of information. Key industry participants, subject-matter experts, C-level executives of major market players, and industry consultants were among the primary respondents with whom in-depth interviews were conducted to gather and validate crucial qualitative and quantitative data and evaluate the market's potential.

To obtain information, we conducted primary interviews on market statistics, the most recent trends that are upending the industry, newly implemented use cases, data on revenue generated by goods and services, market segmentation, market size estimations, market forecasts, and data triangulation. Understanding different technological developments, segmentation types, industry trends, and geographical areas was also aided by primary research. To understand the buyer's perspective on suppliers, open banking solution providers, and their current use cases, which would affect the overall Open Banking solutions market, demand-side stakeholders, such as Chief Executive Officers (CEOs), Chief Information Officers (CIOs), Chief Technology Officers (CTOs), Vice Presidents (VPs), and Chief Security Officers (CSOs), as well as the installation teams of governments/end users using Open Banking solutions, and digital initiatives project teams, were interviewed.
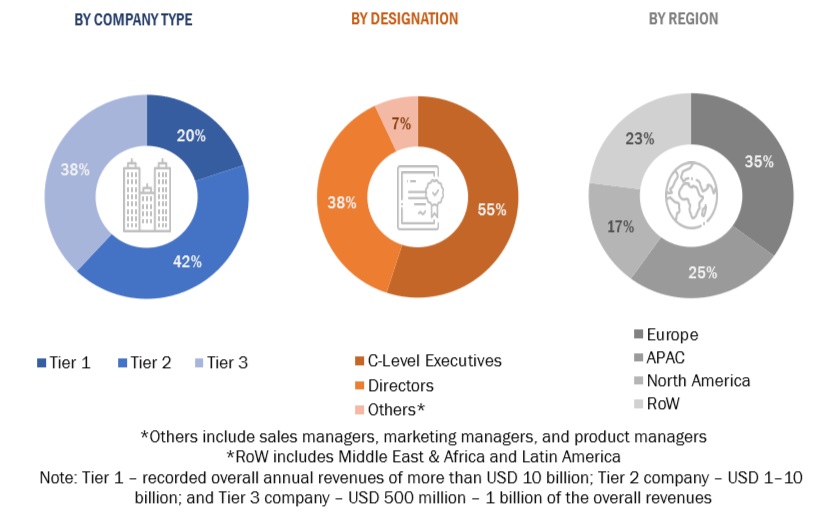
Open Banking Solutions  Market Size, and Share

To know about the assumptions considered for the study, download the pdf brochure

Market Size Estimation

We employed top-down and bottom-up methodologies to estimate and forecast the Open Banking solutions market and other associated submarkets. Using the revenues and product offerings of the major market players, the bottom-up approach assisted in determining the overall market size. This research ascertained and validated the precise value of the total parent market size through data triangulation techniques and primary interview validation. Using percentage splits of the market segments, we were able to estimate the size of other specific markets using the overall market size via the top-down approach.

The bottom-up approach identified the trend of Open Banking solutions adoption among industry verticals in critical countries that contribute the most to the market. The adoption trend of Open Banking solutions and varying cases of use concerning their business segments were identified and extrapolated for cross-validation. We gave weightage to the use cases identified in different solution areas for the calculation. We prepared an exhaustive list of all vendors offering Open Banking solutions. Using annual reports, news releases, fundraising, investor presentations, paid databases, and primary interviews, we calculated the revenue contribution of each vendor in the market.. We evaluated each vendor based on its service offerings across verticals. To get the entire market size, we extrapolated the total revenue of all businesses. The market size and geographical penetration of each subsegment were examined and analysed. We determined the region split through primary and secondary sources based on these numbers.

The top-down approach prepared an exhaustive list of all vendors in the Open Banking solutions market. We estimated the revenue contribution of all vendors in the market through their annual reports, press releases, funding, investor presentations, paid databases, and primary interviews. We estimated the market size from revenues generated by vendors from different Open Banking solutions offerings. Using secondary and primary sources, we located additional vendors and the income produced by each service type, which we then aggregated to calculate the market size. Additionally, the procedure included a regional penetration analysis of the Open Banking solutions market. The investigation was utilized to ascertain and validate the precise values of the market sizes for Open Banking solutions and its sectors, using the data triangulation process and primary data validation. The main procedure to gather essential insights was conducting in-depth interviews with CEOs, CTOs, CIOs, VPs, directors, and marketing executives. To confirm, we further triangulated market numbers using the current MarketsandMarkets repository.

Open Banking solutions Market: Top-Down and Bottom-Up approaches
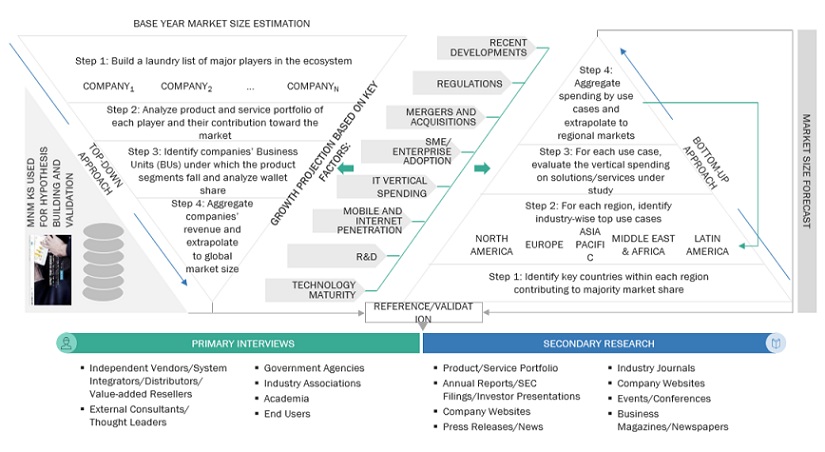
Open Banking Solutions  Market Top Down and Bottom Up Approach

To know about the assumptions considered for the study, Request for Free Sample Report

Data Triangulation

The market was divided into several segments and subsegments using the previously described market size estimation procedures once the overall market size was determined. When required, market breakdown and data triangulation procedures were employed to complete the market engineering process and specify the exact figures for every market segment and subsegment. The data was triangulated by examining several variables and patterns from government entities' supply and demand sides.

Market Definition

Considering the views of various sources (Software AG company) and associations on Open Banking solutions, MarketsandMarkets defines Open Banking solutions as “a banking practice and regulatory framework that allows customers to grant third-party financial service providers access to their financial data held by traditional banks or financial institutions through secure Application Programming Interfaces (APIs). This sharing of data enables third-party developers to create innovative financial products and services, such as budgeting apps, payment solutions, investment platforms, and lending services, tailored to the individual needs and preferences of customers. Open Banking aims to promote competition, innovation, and transparency in the financial services industry, empowering customers with greater control over their financial data and fostering a more interconnected and dynamic ecosystem of financial services".

Key Stakeholders

  • Banks and Financial Institutions
  • Fintech Companies
  • Investors
  • Regulatory Bodies
  • Technology Providers
  • Third-Party Providers (TPPs)
  • Government Agencies
  • Industry Associations
  • Consulting Firms
  • Customers

Report Objectives

  • To define, describe, and forecast the Open Banking Solutions market based on offering, application, digital channel, deployment model, end user, and region
  • To offer comprehensive details regarding the primary variables impacting the market's growth (drivers, restraints, opportunities, and challenges)
  • To determine the high-growth market sectors in order to assess the opportunities for stakeholders in the market
  • To forecast the market size with respect to five main regions—North America, Europe, Asia Pacific, the Middle East & Africa, and Latin America
  • To analyze the subsegments of the market with respect to individual growth trends, prospects, and contributions to the overall market
  • To profile the key players of the market and comprehensively analyze their market size and core competencies
  • To track and analyze the competitive developments, such as product enhancements, product launches, acquisitions, partnerships, and collaborations, in the Open Banking Solutions market globally.

Available Customizations

With the given market data, MarketsandMarkets offers customizations per the company's specific needs. The following customization options are available for the report:

Product Analysis

  • The product matrix provides a detailed comparison of the product portfolio of each company.

Geographic Analysis

  • Further breakup of the Asia Pacific market into countries contributing 75% to the regional market size
  • Further breakup of the North American market into countries contributing 75% to the regional market size
  • Further breakup of the Latin American market into countries contributing 75% to the regional market size
  • Further breakup of the Middle Eastern & African market into countries contributing 75% to the regional market size
  • Further breakup of the European market into countries contributing 75% to the regional market size

Company Information

  • Detailed analysis and profiling of additional market players (up to 5)
Custom Market Research Services

We will customize the research for you, in case the report listed above does not meet with your exact requirements. Our custom research will comprehensively cover the business information you require to help you arrive at strategic and profitable business decisions.

Request Customization
Report Code
TC 8968
Published ON
Mar, 2024
Choose License Type
BUY NOW
  • SHARE
X
Request Customization
Speak to Analyst
Speak to Analyst
OR FACE-TO-FACE MEETING
PERSONALIZE THIS RESEARCH
  • Triangulate with your Own Data
  • Get Data as per your Format and Definition
  • Gain a Deeper Dive on a Specific Application, Geography, Customer or Competitor
  • Any level of Personalization
REQUEST A FREE CUSTOMIZATION
LET US HELP YOU!
  • What are the Known and Unknown Adjacencies Impacting the Open Banking Solutions Market
  • What will your New Revenue Sources be?
  • Who will be your Top Customer; what will make them switch?
  • Defend your Market Share or Win Competitors
  • Get a Scorecard for Target Partners
CUSTOMIZED WORKSHOP REQUEST
knowledgestore logo

Want to explore hidden markets that can drive new revenue in Open Banking Solutions Market?

Find Hidden Markets
  • Call Us
  • +1-888-600-6441 (Corporate office hours)
  • +1-888-600-6441 (US/Can toll free)
  • +44-800-368-9399 (UK office hours)
CONNECT WITH US
ABOUT TRUST ONLINE
©2024 MarketsandMarkets Research Private Ltd. All rights reserved
DMCA.com Protection Status
Website Feedback