Non Invasive Prenatal Testing Market by Product (Consumables, Reagent, Ultrasound, NGS, PCR, Microarray), Services, Method (cfDNA, Biochemical Markers), Application (Aneuploidy, Microdeletion) & End-User (Hospital, Labs) - Global Forecasts to 2029
Market Growth Outlook Summary
The global non invasive prenatal testing market growth forecasted to transform from USD 7.2 billion in 2024 to USD 14.1 billion by 2029, driven by a CAGR of 14.5%. The primary growth factors propelling this market include spiking investments, incentives, and support from both state governments and private companies, which are driving access to and demand for NIPT technologies. Also, the growing shift from invasive techniques to non-invasive ones is a crucial market growth driver. Since these tests provide a secure option for the identification of genetic defects in the fetus and do not pose problems similar to invasive methods like amniocentesis, this is another area of importance that research has indicated. Nevertheless, the market expansion still has some roadblocks to tackle. These reasons include the high price of NIPT, which has made it difficult to access in low and middle-income countries. However, the pace of technological advancement and the growing end-user awareness will ensure that the market continues to expand in the coming years.
Non Invasive Prenatal Testing Market Trends
To know about the assumptions considered for the study, Request for Free Sample Report
Non Invasive Prenatal Testing Market Dynamics
DRIVER: Growing preference for non-invasive techniques over invasive methods
Invasive prenatal diagnostic tests have been in use for years, such as amniocentesis and chorionic villus sampling. Usually, they are applied when anomalies are indicated by ultrasonography and biochemical screening tests. Although they have diagnostic value, they are risky and can lead to miscarriage. The American Pregnancy Association says the risk of miscarriage from amniocentesis is between 1 in 400 and 1 in 200; the more frequently they are performed, the lower the risk—closer to 1 in 400. The miscarriages from these procedures may be a result of uterine infections, premature rupture of membranes, or early labor. This is nearly the same as the rate associated with CVS; about 1 procedure in 100 cases results in a miscarriage.
As a reaction to the cited risks, new non-invasive prenatal testing technologies have emerged as a safer and better alternative. It tends to have much-prolonged benefits, which include more safety in the procedure, no operative complications, and no risk to the pregnancy and the unborn child. This method uses effective means in screening aneuploidies without incurring the risk of causing a miscarriage. Considering that there is major technological progress, the NIPT technologies have become of interest to expectant mothers and their respective healthcare providers. This means that NIPT has gained more popularity in many countries as the standard practice for pregnant women screening; thus, the global market of NIPT has been picking up steadily.
RESTRAINT: High cost of procedures
The high cost of non-invasive prenatal testing procedures limits its wide-scale adoption. NIPT technologies require state-of-the-art laboratory set-ups and specialized techniques for analyzing cell-free fetal DNA. These are highly complex processes that come with the cost of development and operation, which may be transferred to the healthcare providers and reflected in the fees charged to the patient. NIPT, therefore, may turn out to be much more expensive than the conventional forms of prenatal screening. It may be unaffordable for the majority of expectant parents, given how much of the global population lacks adequate insurance or lives in areas with limited health care coverage. The resulting high cost prohibits the use of this technology despite the fact that NIPT can correctly identify cases of chromosomal abnormalities with minimum risk compared to the invasive procedures of amniocentesis or chorionic villus sampling. Because of the uncertainty of reimbursement models or low reimbursement rates from insurance companies, healthcare providers and institutions do not readily purchase NIPT infrastructure.
The return on investment in relation to providing NIPT services may be challenging to achieve financially, especially in environments where patient volumes are low or healthcare budgets are tight. For instance, although the price for an NIPT test may differ from USD 100 to over USD 2,000 in the US, it differs between USD 60 and USD 600 in India. Such costs may vary due to local health infrastructure, insurance policies, and the balance between private and public health systems. This economic challenge is considered to be a main restraint for the global NIPT market.
OPPORTUNITY: Technological advancement
Recent technological advances have only made non-invasive prenatal testing more precise and increased scope. Using next-generation sequencing, together with bioinformatics algorithms, allows comprehensive screening and detection of major chromosomal abnormalities, including but not limited to Down syndrome, Edwards syndrome, and Patau syndrome, to be conducted very sensitively and specifically. Greater accuracy allows less follow-up of additional invasive procedures and helps in raising confidence, increasing NIPT’s uptake. The aggregate effect of these new technologies is to ensure the efficacy of and extend NIPT diagnostics to more types of conditions, including microdeletion syndrome and single-gene disorders, thus becoming a more comprehensive method of prenatal diagnostics. This creates a feature that boosts clinical utility and, therefore, the market potential.
The other source of the rising cost for NIPT is the cost reductions from technological advancements, which are increasing through better laboratory automation, efficient data analysis, and streamlined sample processing. These cost reductions make even NIPT more affordable, particularly in cost-sensitive markets and places where expensive procedures are unavailable. The process of sample collection and processing has also been augmented technologically and significantly simplified, such that only very small amounts of blood are needed, and the turnaround times have been reduced drastically.
CHALLENGE: Lack of skilled professionals
The job requirements are enormous: personnel assigned to NIPT must be familiar with or able to work on sequencing systems, PCR systems, and ultrasound equipment while still processing large chunks of data. For instance, the US alone faces a challenging shortage of more than 7,000 lab professionals for its laboratories on an annual basis. The country has to contend with the fact that the annual production of laboratory technical workforce education programs is only 6,000. Another 20,000 to 25,000 laboratory technologists are required for the industry, with only 335,000 in employment, which highlights a deficit of 7% in the number of technologists needed to meet the needs of every 1,000 citizens.
This gap in skilled labor creates large barriers to the application of proper genetic analysis testing methods, which critically depend on the knowledge of proper techniques and instruments. Unskilled personnel can lead to unproductive practices and misinterpretation of sequencing data, bringing about wrong diagnoses and critical delays. This undermines the benefits of NIPT, reduces consumer confidence in the test results, and has the potential to slow down the market.
Non-Invasive Prenatal Testing Market Ecosystem
In this report, the non-invasive prenatal testing market is segmented based on product & service, method, application, end user, and region.
Products segment has accounted for the largest market share in the non invasive prenatal testing industry, by product and service.
The products segment should hold the largest share in the non invasive prenatal testing market, based on the type of product and service, due to the growing demand for increased and advanced accurate detection of fetal genetic conditions at an early stage. This can be attributed to a few market drivers, such as significant technological advancement, high awareness levels among expectant parents, and an increased incidence of chromosomal disorders. In addition, increased adoption has also resulted from the fact that the nature of the tests allows adopting it in a manner that reduces the hazard to both the mother and the fetus substantially compared to the nature of the invasive approaches. As a result, these non-invasive tests of prenatal nature have become the favorite in prenatal screening. The high preference that is racked by these tests has gained the market of the product large hikes in demand and enough dominance.
By method, cfDNA in maternal plasma test segment has accounted for the second-largest market share in the non invasive prenatal testing industry.
The non invasive prenatal testing market has been studied on the basis of the techniques used, which have been classified as segments. These include biochemical screening, ultrasound detection, and cell-free DNA (cfDNA) tests. These cfDNA in maternal plasma tests are associated with high accuracy and the possibility of early detection. Firstly, cfDNA tests are characterized by high sensitivity and specificity in detecting chromosomal abnormalities such as Down, Edwards, and Patau syndromes. The tests can be conducted as early as the 10th week of pregnancy, allowing early enough reassurance and enabling timely decision-making. The technique is also absolutely safe for the fetus itself compared to invasive procedures, such as amniocentesis, which only increases the popularity and fast implementation of cfDNA testing in practice.
Trisomy segment accounted for the largest market share in the non invasive prenatal testing industry, by application.
In the market for non invasive prenatal testing applications, the dominant segment has been trisomy. The demand for trisomy detection is the primary growth driver for this market. Technological upgrades have bolstered the test’s precision and accuracy, increasing the confidence of expectant parents and healthcare providers in these tests. Better accuracy in diagnosis and determining trisomy 21, trisomy 18, and trisomy 13 ensures an early diagnosis and a successful outcome of a pregnancy. Technological advancements will support the adoption of NIPT among healthcare providers and patients; it is expected to become the preferred method of screening for trisomy.
By end user type, diagnostic laboratories segment witnessed the fastest CAGR in the non invasive prenatal testing industry
The diagnostic laboratories segment is projected to be the fastest-growing segment in the non invasive prenatal testing market, primarily due to the increasing adoption of advanced technologies for genetic testing worldwide. These laboratories have always been pioneers in high-end NIPT platforms with a high degree of sensitivity and specificity in detecting chromosomal abnormalities. The increasing demand from healthcare providers and parents for accurate and early detection alternatives stimulates a constant increase in the capabilities of diagnostic laboratories. This growth is driven by the laboratories’ commitment to providing cutting-edge, non-invasive, cost-effective testing solutions in a manner that further accelerates their market expansion.
North America accounted for the largest market share in the non invasive prenatal testing industry during the forecast period.
North America leads in the market for non-invasive prenatal testing due to the region’s sound healthcare infrastructure. The fallout of well-established healthcare infrastructure across the US and Canada is the wide availability of up-to-date medical technologies, firmly established healthcare set-ups, and sustainable frameworks corresponding to genetic research and development. Further, the dominance of the North American region in the NIPT market stems from the high awareness and acceptance of prenatal testing among healthcare providers and expecting parents, coupled with favorable government policies and insurance coverage. This entire infrastructure makes early adoption and consistent growth in the services of NIPT possible across this region.
To know about the assumptions considered for the study, download the pdf brochure
Key players in the non-invasive prenatal testing market include Illumina, Inc. (US), Natera, Inc. (US), Laboratory Corporation of America Holdings (US), Eurofins Scientific (France), F. Hoffmann-La Roche AG (Switzerland), Revvity, Inc. (US), Thermo Fisher Scientific Inc. (US), Agilent Technologies (US), GE HealthCare Technologies Inc. (US), Quest Diagnostics Incorporated (US), Sonic Healthcare Limited (Australia), CENTOGENE N.V. (GERMANY), QIAGEN N.V. (GERMANY), PathWest Laboratory Medicine WA (Australia), Myriad Genetics Inc. (US), BGI Genomics Co., Ltd. (China), Oxford Nanopore Technologies Plc. (UK), MedGenome (India), Neuberg Diagnostics (India), Annoroad Gene Technology (China), Next Biosciences (South Africa), Lilac Insights (India), Invitae Corporation (US), Baylor Genetics (US), and Ravgen (US).
Non Invasive Prenatal Testing Market Report Scope
Report Metric |
Details |
Market Revenue Size in 2024 |
$7.2 billion |
Projected Revenue Size by 2029 |
$4.1 billion |
Industry Growth Rate |
Poised to Grow at a CAGR of 14.5% |
Market Driver |
Growing preference for non-invasive techniques over invasive methods |
Market Opportunity |
Technological advancement |
The research report categorizes the non invasive prenatal testing market to forecast revenue and analyze trends in each of the following submarkets:
By Product Service
- Products
- Services
By Method
- Ultrasound Detection
- Biochemical Screening Tests
- Cell-free DNA in Maternal Plasma Tests
By Application
- Trisomy
- Microdeletion Syndrome
- Other Applications
By End User
- Diagnostic Laboratories
- Hospitals
By Region
-
North America
- US
- Canada
-
Europe
- Germany
- UK
- France
- Spain
- Italy
- Rest of Europe
-
Asia Pacific
- Japan
- China
- India
- Australia
- South Korea
- Rest of Asia Pacific (RoAPAC)
-
Latin America
- Brazil
- Mexico
- Rest of Latin America (RoLA)
-
Middle East & Africa
- GCC Countries
- Rest of Middle East and Africa
Recent Developments Non Invasive Prenatal Testing Market
- In June 2024, Illumina, Inc. (US) announced the launch of DRAGEN v4.3, the latest version of its DRAGEN software, part of the Illumina Connected Software portfolio, for analysis of next-generation sequencing data.
- In January 2024, Natera, Inc. (US) announced that it had acquired certain assets from Invitae Corporation (US) related to Invitae’s non-invasive prenatal screening and carrier screening business.
- In August 2023, Illumina, Inc. (US) announced a new office and state-of-the-art Illumina Solutions Center in Bengaluru, India.
- In April 2023, PerkinElmer, Inc. (US) completed the divestiture of its Applied, Food, and Enterprise Services businesses to New Mountain Capital. As a result, Post-spinoff, PerkinElmer, Inc. (US) rebranded the remaining Diagnostics and Life Sciences business as Revvity, Inc. (US).
Frequently Asked Questions (FAQ):
What is the projected growth rate of the global non-invasive prenatal testing (NIPT) market between 2024 and 2029?
The global non invasive prenatal testing market is projected to grow from USD 7.2 billion in 2024 to USD 14.1 billion by 2029, demonstrating a robust CAGR of 14.5%.
What are the key drivers of the non-invasive prenatal testing market?
The key drivers include the growing preference for non-invasive techniques over invasive methods like amniocentesis, increased safety for both mother and fetus, and rising awareness about the advantages of NIPT.
What challenges does the NIPT market face?
The high cost of NIPT procedures and the lack of skilled professionals to perform these complex tests are significant challenges limiting the widespread adoption of the technology.
How does technological advancement impact the NIPT market?
Technological advancements, such as next-generation sequencing and bioinformatics, have improved the accuracy and scope of NIPT, enabling the detection of a broader range of genetic abnormalities with higher precision.
Which segment holds the largest share of the NIPT market?
The products segment holds the largest share, driven by growing demand for early detection of fetal genetic conditions and significant advancements in NIPT technologies.
How does the cost of NIPT affect its market growth?
The high cost of NIPT, especially in low and middle-income countries, limits its widespread adoption despite its safety advantages over invasive prenatal diagnostic tests.
What are the main applications of NIPT?
Trisomy detection, especially for Down syndrome (trisomy 21), is the primary application of NIPT. Other applications include detecting Edwards syndrome (trisomy 18) and Patau syndrome (trisomy 13).
What is the role of cfDNA in maternal plasma testing in the NIPT market?
cfDNA in maternal plasma testing plays a critical role in NIPT, offering high sensitivity and specificity in detecting chromosomal abnormalities as early as the 10th week of pregnancy.
What opportunities are emerging in the NIPT market?
Technological advancements, such as improved laboratory automation and data analysis, are creating opportunities to expand NIPT’s diagnostic scope and reduce costs, making it more affordable and accessible.
How does the shortage of skilled professionals impact the NIPT market?
The lack of skilled professionals, particularly in genetic testing and sequencing technologies, poses a challenge to the NIPT market, leading to delays and inaccuracies in test results.
To speak to our analyst for a discussion on the above findings, click Speak to Analyst
Exclusive indicates content/data unique to MarketsandMarkets and not available with any competitors.
- 5.1 INTRODUCTION
-
5.2 MARKET DYNAMICSDRIVERS- High risk of chromosomal abnormalities with increasing maternal age- Growing preference for noninvasive techniques over invasive methods- Improving reimbursement scenario- Initiatives to spread awarenessRESTRAINTS- High cost of procedures- Lack of insurance coverageOPPORTUNITIES- Untapped emerging markets- Technological advancementsCHALLENGES- Reliability of test results- Lack of skilled professionals
-
5.3 INDUSTRY TRENDSDETECTION BEYOND TRISOMIESEARLIER GESTATIONAL AGE TESTINGINTEGRATION WITH NGS
-
5.4 TECHNOLOGY ANALYSISKEY TECHNOLOGIES- Cell-free DNA analysis- NGS- Digital PCRCOMPLEMENTARY TECHNOLOGIES- Microfluidics- Nanotechnology- Epigenetics analysisADJACENT TECHNOLOGIES- Ultrasound imaging- Genome editing (CRISPR/Cas9)- Liquid biopsy
- 5.5 VALUE CHAIN ANALYSIS
- 5.6 ECOSYSTEM ANALYSIS
- 5.7 SUPPLY CHAIN ANALYSIS
-
5.8 PORTER’S FIVE FORCE ANALYSISTHREAT OF NEW ENTRANTSTHREAT OF SUBSTITUTESBARGAINING POWER OF SUPPLIERSBARGAINING POWER OF BUYERSINTENSITY OF COMPETITIVE RIVALRY
-
5.9 KEY STAKEHOLDERS AND BUYING CRITERIAKEY STAKEHOLDERS IN BUYING PROCESSBUYING CRITERIA
-
5.10 REGULATORY LANDSCAPEREGULATORY ANALYSISREGULATORY BODIES, GOVERNMENT AGENCIES, AND OTHER ORGANIZATIONS
-
5.11 PATENT ANALYSISPATENT PUBLICATION TRENDSINSIGHTS: JURISDICTION AND TOP APPLICANT ANALYSIS
-
5.12 TRADE ANALYSISTRADE ANALYSIS FOR DIAGNOSTIC AND LABORATORY REAGENTS
-
5.13 PRICING ANALYSISAVERAGE SELLING PRICE TREND, BY PRODUCTAVERAGE SELLING PRICE TREND, BY REGION
- 5.14 REIMBURSEMENT ANALYSIS
- 5.15 KEY CONFERENCES AND EVENTS, 2024–2025
- 5.16 UNMET NEEDS/END-USER EXPECTATIONS
-
5.17 CASE STUDIESEVALUATION OF NIFTY TEST IN DETECTING FETAL CHROMOSOMAL ABNORMALITIES IN ASIAN POPULATIONSCLINICAL UTILITY OF HARMONY PRENATAL TEST IN A COHORT OF PREGNANT WOMENASSESSMENT OF PANORAMA TEST IN DETECTING FETAL GENETIC CONDITIONS
- 5.18 ADJACENT MARKET ANALYSIS
- 5.19 INVESTMENT & FUNDING SCENARIO
- 5.20 TRENDS/DISRUPTIONS IMPACTING CUSTOMERS’ BUSINESSES
- 5.21 IMPACT OF ARTIFICIAL INTELLIGENCE ON NON-INVASIVE PRENATAL TESTING MARKET
- 6.1 INTRODUCTION
-
6.2 PRODUCTSCONSUMABLES- Assay kits & reagents- DisposablesINSTRUMENTS- Ultrasound devices- NGS systems- PCR instruments- Microarrays- Other instruments
-
6.3 SERVICESNORTH AMERICA TO REGISTER HIGHEST DEMAND FOR TESTING SERVICES
- 7.1 INTRODUCTION
-
7.2 ULTRASOUND DETECTIONULTRASOUND DETECTION TO DOMINATE NIPT MARKET
-
7.3 BIOCHEMICAL SCREENING TESTSHIGH INCIDENCE OF GENETIC DISORDERS AND INCREASING FOCUS ON PRENATAL TESTING TO SUPPORT MARKET GROWTH
-
7.4 CFDNA IN MATERNAL PLASMA TESTSCFDNA IN MATERNAL PLASMA TESTS SEGMENT TO REGISTER HIGHEST CAGR
- 8.1 INTRODUCTION
-
8.2 TRISOMYTRISOMY TO HOLD LARGEST SHARE OF APPLICATIONS MARKET AND SHOW HIGHEST GROWTH
-
8.3 MICRODELETION SYNDROMEINCREASING AWARENESS TO SUPPORT DEMAND FOR TESTING
- 8.4 OTHER APPLICATIONS
- 9.1 INTRODUCTION
-
9.2 DIAGNOSTIC LABORATORIESRISING RESEARCH INTENSITY TO DRIVE USAGE OF NIPT PRODUCTS IN DIAGNOSTIC LABS
-
9.3 HOSPITALSRISING INCIDENCE OF GENETIC DISORDERS AND INCREASING FOCUS ON PRENATAL TESTING TO PROPEL MARKET
- 10.1 INTRODUCTION
-
10.2 NORTH AMERICANORTH AMERICA: MACROECONOMIC OUTLOOKUS- High incidence of chromosomal syndromes to drive demandCANADA- Unfavorable reimbursement scenario for NIPT to challenge market growth
-
10.3 EUROPEEUROPE: MACROECONOMIC OUTLOOKUK- High incidence of genetic abnormalities to increase demand for prenatal testingGERMANY- Strong R&D and increasing healthcare spending to drive marketFRANCE- Favorable insurance coverage for prenatal testing to increase adoption of NIPTITALY- Favorable funding scenario for genomics to drive marketSPAIN- Rising funding and expanding research infrastructure to propel market growthREST OF EUROPE
-
10.4 ASIA PACIFICASIA PACIFIC: MACROECONOMIC OUTLOOKJAPAN- Rising maternal age to propel incidence of chromosomal disordersCHINA- China to register highest growth in Asia Pacific marketINDIA- Rising disposable income and demand for better health to support market growthAUSTRALIA- Strong research ecosystem for NIPT to drive marketSOUTH KOREA- Increasing scope for genomic research to support market growthREST OF ASIA PACIFIC
-
10.5 LATIN AMERICALATIN AMERICA: MACROECONOMIC OUTLOOKBRAZIL- Rising focus on clinical genomics to drive demand for NIPTMEXICO- High incidence of Down syndrome to propel demandREST OF LATIN AMERICA
-
10.6 MIDDLE EAST & AFRICAMIDDLE EAST & AFRICA: MACROECONOMIC OUTLOOKGCC COUNTRIES- Launch of genomic initiatives to drive marketREST OF MIDDLE EAST & AFRICA
- 11.1 OVERVIEW
-
11.2 KEY PLAYER STRATEGIES/RIGHT TO WINOVERVIEW OF STRATEGIES ADOPTED BY PLAYERS IN NON-INVASIVE PRENATAL TESTING MARKET
- 11.3 REVENUE ANALYSIS
- 11.4 MARKET SHARE ANALYSIS
- 11.5 R&D EXPENDITURE OF KEY PLAYERS
-
11.6 COMPANY EVALUATION MATRIX: KEY PLAYERS, 2023STARSEMERGING LEADERSPERVASIVE PLAYERSPARTICIPANTSCOMPANY FOOTPRINT: KEY PLAYERS, 2023- Company footprint- Product & service footprint- Method footprint- Application footprint- End-user footprint- Region footprint
-
11.7 COMPANY EVALUATION MATRIX: STARTUPS/SMES, 2023PROGRESSIVE COMPANIESDYNAMIC COMPANIESSTARTING BLOCKSRESPONSIVE COMPANIESCOMPETITIVE BENCHMARKING: STARTUPS/SMES, 2023
- 11.8 VALUATION & FINANCIAL METRICS
- 11.9 BRAND/PRODUCT COMPARATIVE ANALYSIS
-
11.10 COMPETITIVE SCENARIOPRODUCT & SERVICE LAUNCHESDEALSEXPANSIONSOTHER DEVELOPMENTS
-
12.1 KEY PLAYERSILLUMINA, INC.- Business overview- Products & services offered- Recent developments- MnM viewNATERA, INC.- Business overview- Products & services offered- Recent developments- MnM viewLABORATORY CORPORATION OF AMERICA HOLDINGS- Business overview- Products & services offered- Recent developments- MnM viewEUROFINS SCIENTIFIC- Business overview- Products & services offered- Recent developments- MnM viewF. HOFFMANN-LA ROCHE AG- Business overview- Products & services offered- Recent developments- MnM viewREVVITY, INC.- Business overview- Products & services offered- Recent developmentsTHERMO FISHER SCIENTIFIC INC.- Business overview- Products & services offered- Recent developmentsAGILENT TECHNOLOGIES- Business overview- Products & services offered- Recent developmentsGE HEALTHCARE TECHNOLOGIES INC.- Business overview- Products & services offered- Recent developmentsQUEST DIAGNOSTICS INCORPORATED- Business overview- Products & services offered- Recent developmentsSONIC HEALTHCARE LIMITED- Business overview- Products & services offered- Recent developmentsCENTOGENE N.V.- Business overview- Products & services offered- Recent developmentsQIAGEN N.V.- Business overview- Products & services offered- Recent developmentsPATHWEST LABORATORY MEDICINE WA- Business overview- Products & services offeredMYRIAD GENETICS, INC.- Business overview- Products & services offered
-
12.2 OTHER PLAYERSBGI GENOMICS CO., LTD.OXFORD NANOPORE TECHNOLOGIES PLCMEDGENOMENEUBERG DIAGNOSTICSANNOROAD GENE TECHNOLOGYNEXT BIOSCIENCESLILAC INSIGHTSINVITAE CORPORATIONBAYLOR GENETICSRAVGEN
- 13.1 DISCUSSION GUIDE
- 13.2 KNOWLEDGESTORE: MARKETSANDMARKETS’ SUBSCRIPTION PORTAL
- 13.3 CUSTOMIZATION OPTIONS
- 13.4 RELATED REPORTS
- 13.5 AUTHOR DETAILS
- TABLE 1 STANDARD CURRENCY CONVERSION RATES (UNIT OF USD)
- TABLE 2 RISK OF DOWN SYNDROME WITH INCREASING MATERNAL AGE
- TABLE 3 INCIDENCE RATE OF TRISOMY
- TABLE 4 COMPARISON OF NONINVASIVE AND INVASIVE PRENATAL TESTING
- TABLE 5 NIPT REIMBURSEMENT SCENARIO, BY COUNTRY
- TABLE 6 PUBLIC HEALTHCARE EXPENDITURE (% OF GDP)
- TABLE 7 NIPT MARKET: ECOSYSTEM ANALYSIS
- TABLE 8 NIPT MARKET: PORTER’S FIVE FORCES ANALYSIS
- TABLE 9 INFLUENCE OF STAKEHOLDERS ON BUYING PROCESS OF NIPT PRODUCTS
- TABLE 10 KEY BUYING CRITERIA FOR NIPT PRODUCTS
- TABLE 11 NORTH AMERICA: REGULATORY BODIES, GOVERNMENT AGENCIES, AND OTHER ORGANIZATIONS
- TABLE 12 EUROPE: REGULATORY BODIES, GOVERNMENT AGENCIES, AND OTHER ORGANIZATIONS
- TABLE 13 ASIA PACIFIC: REGULATORY BODIES, GOVERNMENT AGENCIES, AND OTHER ORGANIZATIONS
- TABLE 14 LATIN AMERICA: REGULATORY BODIES, GOVERNMENT AGENCIES, AND OTHER ORGANIZATIONS
- TABLE 15 MIDDLE EAST & AFRICA: REGULATORY BODIES, GOVERNMENT AGENCIES, AND OTHER ORGANIZATIONS
- TABLE 16 LIST OF PATENTS IN NIPT MARKET, 2014–2024
- TABLE 17 IMPORT AND EXPORT DATA FOR NEXT-GENERATION SEQUENCING PRODUCTS, BY COUNTRY
- TABLE 18 AVERAGE SELLING PRICE TREND OF NIPT PRODUCTS, BY TYPE
- TABLE 19 AVERAGE SELLING PRICE TREND OF NIPT PRODUCTS, BY REGION
- TABLE 20 NIPT MARKET: LIST OF KEY CONFERENCES AND EVENTS DURING 2024–2025
- TABLE 21 NIPT MARKET: UNMET NEEDS
- TABLE 22 NIPT MARKET: END-USER EXPECTATIONS
- TABLE 23 NIPT MARKET: IMPACT AND APPLICATIONS OF ARTIFICIAL INTELLIGENCE
- TABLE 24 NIPT MARKET, BY PRODUCT & SERVICE, 2021–2023 (USD MILLION)
- TABLE 25 NIPT MARKET, BY PRODUCT & SERVICE, 2024–2029 (USD MILLION)
- TABLE 26 NIPT PRODUCTS MARKET, BY TYPE, 2021–2023 (USD MILLION)
- TABLE 27 NIPT PRODUCTS MARKET, BY TYPE, 2024–2029 (USD MILLION)
- TABLE 28 NIPT PRODUCTS MARKET, BY COUNTRY, 2021–2023 (USD MILLION)
- TABLE 29 NIPT PRODUCTS MARKET, BY COUNTRY, 2024–2029 (USD MILLION)
- TABLE 30 NIPT CONSUMABLES MARKET, BY TYPE, 2021–2023 (USD MILLION)
- TABLE 31 NIPT CONSUMABLES MARKET, BY TYPE, 2024–2029 (USD MILLION)
- TABLE 32 NIPT CONSUMABLES MARKET, BY COUNTRY, 2021–2023 (USD MILLION)
- TABLE 33 NIPT CONSUMABLES MARKET, BY COUNTRY, 2024–2029 (USD MILLION)
- TABLE 34 ASSAY KITS & REAGENTS MARKET, BY COUNTRY, 2021–2023 (USD MILLION)
- TABLE 35 ASSAY KITS & REAGENTS MARKET, BY COUNTRY, 2024–2029 (USD MILLION)
- TABLE 36 DISPOSABLES MARKET, BY COUNTRY, 2021–2023 (USD MILLION)
- TABLE 37 DISPOSABLES MARKET, BY COUNTRY, 2024–2029 (USD MILLION)
- TABLE 38 NIPT INSTRUMENTS MARKET, BY TYPE, 2021–2023 (USD MILLION)
- TABLE 39 NIPT INSTRUMENTS MARKET, BY TYPE, 2024–2029 (USD MILLION)
- TABLE 40 NIPT INSTRUMENTS MARKET, BY COUNTRY, 2021–2023 (USD MILLION)
- TABLE 41 NIPT INSTRUMENTS MARKET, BY COUNTRY, 2024–2029 (USD MILLION)
- TABLE 42 ULTRASOUND DEVICES MARKET, BY COUNTRY, 2021–2023 (USD MILLION)
- TABLE 43 ULTRASOUND DEVICES MARKET, BY COUNTRY, 2024–2029 (USD MILLION)
- TABLE 44 NGS SYSTEMS MARKET, BY COUNTRY, 2021–2023 (USD MILLION)
- TABLE 45 NGS SYSTEMS MARKET, BY COUNTRY, 2024–2029 (USD MILLION)
- TABLE 46 PCR INSTRUMENTS MARKET, BY COUNTRY, 2021–2023 (USD MILLION)
- TABLE 47 PCR INSTRUMENTS MARKET, BY COUNTRY, 2024–2029 (USD MILLION)
- TABLE 48 MICROARRAYS MARKET, BY COUNTRY, 2021–2023 (USD MILLION)
- TABLE 49 MICROARRAYS MARKET, BY COUNTRY, 2024–2029 (USD MILLION)
- TABLE 50 OTHER NIPT INSTRUMENTS MARKET, BY COUNTRY, 2021–2023 (USD MILLION)
- TABLE 51 OTHER NIPT INSTRUMENTS MARKET, BY COUNTRY, 2024–2029 (USD MILLION)
- TABLE 52 NIPT SERVICES MARKET, BY COUNTRY, 2021–2023 (USD MILLION)
- TABLE 53 NIPT SERVICES MARKET, BY COUNTRY, 2024–2029 (USD MILLION)
- TABLE 54 NIPT MARKET, BY METHOD, 2021–2023 (USD MILLION)
- TABLE 55 NIPT MARKET, BY METHOD, 2024–2029 (USD MILLION)
- TABLE 56 ULTRASOUND DETECTION MARKET, BY COUNTRY, 2021–2023 (USD MILLION)
- TABLE 57 ULTRASOUND DETECTION MARKET, BY COUNTRY, 2024–2029 (USD MILLION)
- TABLE 58 BIOCHEMICAL SCREENING TESTS MARKET, BY COUNTRY, 2021–2023 (USD MILLION)
- TABLE 59 BIOCHEMICAL SCREENING TESTS MARKET, BY COUNTRY, 2024–2029 (USD MILLION)
- TABLE 60 CFDNA IN MATERNAL PLASMA TESTS MARKET, BY COUNTRY, 2021–2023 (USD MILLION)
- TABLE 61 CFDNA IN MATERNAL PLASMA TESTS MARKET, BY COUNTRY, 2024–2029 (USD MILLION)
- TABLE 62 NIPT MARKET, BY APPLICATION, 2021–2023 (USD MILLION)
- TABLE 63 NIPT MARKET, BY APPLICATION, 2024–2029 (USD MILLION)
- TABLE 64 NIPT MARKET FOR TRISOMY, BY COUNTRY, 2021–2023 (USD MILLION)
- TABLE 65 NIPT MARKET FOR TRISOMY, BY COUNTRY, 2024–2029 (USD MILLION)
- TABLE 66 NIPT MARKET FOR MICRODELETION SYNDROME, BY COUNTRY, 2021–2023 (USD MILLION)
- TABLE 67 NIPT MARKET FOR MICRODELETION SYNDROME, BY COUNTRY, 2024–2029 (USD MILLION)
- TABLE 68 NIPT MARKET FOR OTHER APPLICATIONS, BY COUNTRY, 2021–2023 (USD MILLION)
- TABLE 69 NIPT MARKET FOR OTHER APPLICATIONS, BY COUNTRY, 2024–2029 (USD MILLION)
- TABLE 70 NIPT MARKET, BY END USER, 2021–2023 (USD MILLION)
- TABLE 71 NIPT MARKET, BY END USER, 2024–2029 (USD MILLION)
- TABLE 72 NIPT MARKET FOR DIAGNOSTIC LABORATORIES, BY COUNTRY, 2021–2023 (USD MILLION)
- TABLE 73 NIPT MARKET FOR DIAGNOSTIC LABORATORIES, BY COUNTRY, 2024–2029 (USD MILLION)
- TABLE 74 NIPT MARKET FOR HOSPITALS, BY COUNTRY, 2021–2023 (USD MILLION)
- TABLE 75 NIPT MARKET FOR HOSPITALS, BY COUNTRY, 2024–2029 (USD MILLION)
- TABLE 76 NIPT MARKET, BY REGION, 2021–2023 (USD MILLION)
- TABLE 77 NIPT MARKET, BY REGION, 2024–2029 (USD MILLION)
- TABLE 78 NORTH AMERICA: NIPT MARKET, BY COUNTRY, 2021–2023 (USD MILLION)
- TABLE 79 NORTH AMERICA: NIPT MARKET, BY COUNTRY, 2024–2029 (USD MILLION)
- TABLE 80 NORTH AMERICA: NIPT MARKET, BY PRODUCT & SERVICE, 2021–2023 (USD MILLION)
- TABLE 81 NORTH AMERICA: NIPT MARKET, BY PRODUCT & SERVICE, 2024–2029 (USD MILLION)
- TABLE 82 NORTH AMERICA: NIPT PRODUCTS MARKET, BY TYPE, 2021–2023 (USD MILLION)
- TABLE 83 NORTH AMERICA: NIPT PRODUCTS MARKET, BY TYPE, 2024–2029 (USD MILLION)
- TABLE 84 NORTH AMERICA: NIPT CONSUMABLES MARKET, BY TYPE, 2021–2023 (USD MILLION)
- TABLE 85 NORTH AMERICA: NIPT CONSUMABLES MARKET, BY TYPE, 2024–2029 (USD MILLION)
- TABLE 86 NORTH AMERICA: NIPT INSTRUMENTS MARKET, BY TYPE, 2021–2023 (USD MILLION)
- TABLE 87 NORTH AMERICA: NIPT INSTRUMENTS MARKET, BY TYPE, 2024–2029 (USD MILLION)
- TABLE 88 NORTH AMERICA: NIPT MARKET, BY METHOD, 2021–2023 (USD MILLION)
- TABLE 89 NORTH AMERICA: NIPT MARKET, BY METHOD, 2024–2029 (USD MILLION)
- TABLE 90 NORTH AMERICA: NIPT MARKET, BY APPLICATION, 2021–2023 (USD MILLION)
- TABLE 91 NORTH AMERICA: NIPT MARKET, BY APPLICATION, 2024–2029 (USD MILLION)
- TABLE 92 NORTH AMERICA: NIPT MARKET, BY END USER, 2021–2023 (USD MILLION)
- TABLE 93 NORTH AMERICA: NIPT MARKET, BY END USER, 2024–2029 (USD MILLION)
- TABLE 94 US: KEY MACROINDICATORS
- TABLE 95 US: NIPT MARKET, BY PRODUCT & SERVICE, 2021–2023 (USD MILLION)
- TABLE 96 US: NIPT MARKET, BY PRODUCT & SERVICE, 2024–2029 (USD MILLION)
- TABLE 97 US: NIPT PRODUCTS MARKET, BY TYPE, 2021–2023 (USD MILLION)
- TABLE 98 US: NIPT PRODUCTS MARKET, BY TYPE, 2024–2029 (USD MILLION)
- TABLE 99 US: NIPT CONSUMABLES MARKET, BY TYPE, 2021–2023 (USD MILLION)
- TABLE 100 US: NIPT CONSUMABLES MARKET, BY TYPE, 2024–2029 (USD MILLION)
- TABLE 101 US: NIPT INSTRUMENTS MARKET, BY TYPE, 2021–2023 (USD MILLION)
- TABLE 102 US: NIPT INSTRUMENTS MARKET, BY TYPE, 2024–2029 (USD MILLION)
- TABLE 103 US: NIPT MARKET, BY METHOD, 2021–2023 (USD MILLION)
- TABLE 104 US: NIPT MARKET, BY METHOD, 2024–2029 (USD MILLION)
- TABLE 105 US: NIPT MARKET, BY APPLICATION, 2021–2023 (USD MILLION)
- TABLE 106 US: NIPT MARKET, BY APPLICATION, 2024–2029 (USD MILLION)
- TABLE 107 US: NIPT MARKET, BY END USER, 2021–2023 (USD MILLION)
- TABLE 108 US: NIPT MARKET, BY END USER, 2024–2029 (USD MILLION)
- TABLE 109 CANADA: KEY MACROINDICATORS
- TABLE 110 CANADA: NIPT MARKET, BY PRODUCT & SERVICE, 2021–2023 (USD MILLION)
- TABLE 111 CANADA: NIPT MARKET, BY PRODUCT & SERVICE, 2024–2029 (USD MILLION)
- TABLE 112 CANADA: NIPT PRODUCTS MARKET, BY TYPE, 2021–2023 (USD MILLION)
- TABLE 113 CANADA: NIPT PRODUCTS MARKET, BY TYPE, 2024–2029 (USD MILLION)
- TABLE 114 CANADA: NIPT CONSUMABLES MARKET, BY TYPE, 2021–2023 (USD MILLION)
- TABLE 115 CANADA: NIPT CONSUMABLES MARKET, BY TYPE, 2024–2029 (USD MILLION)
- TABLE 116 CANADA: NIPT INSTRUMENTS MARKET, BY TYPE, 2021–2023 (USD MILLION)
- TABLE 117 CANADA: NIPT INSTRUMENTS MARKET, BY TYPE, 2024–2029 (USD MILLION)
- TABLE 118 CANADA: NIPT MARKET, BY METHOD, 2021–2023 (USD MILLION)
- TABLE 119 CANADA: NIPT MARKET, BY METHOD, 2024–2029 (USD MILLION)
- TABLE 120 CANADA: NIPT MARKET, BY APPLICATION, 2021–2023 (USD MILLION)
- TABLE 121 CANADA: NIPT MARKET, BY APPLICATION, 2024–2029 (USD MILLION)
- TABLE 122 CANADA: NIPT MARKET, BY END USER, 2021–2023 (USD MILLION)
- TABLE 123 CANADA: NIPT MARKET, BY END USER, 2024–2029 (USD MILLION)
- TABLE 124 EUROPE: NIPT MARKET, BY COUNTRY, 2021–2023 (USD MILLION)
- TABLE 125 EUROPE: NIPT MARKET, BY COUNTRY, 2024–2029 (USD MILLION)
- TABLE 126 EUROPE: NIPT MARKET, BY PRODUCT & SERVICE, 2021–2023 (USD MILLION)
- TABLE 127 EUROPE: NIPT MARKET, BY PRODUCT & SERVICE, 2024–2029 (USD MILLION)
- TABLE 128 EUROPE: NIPT PRODUCTS MARKET, BY TYPE, 2021–2023 (USD MILLION)
- TABLE 129 EUROPE: NIPT PRODUCTS MARKET, BY TYPE, 2024–2029 (USD MILLION)
- TABLE 130 EUROPE: NIPT CONSUMABLES MARKET, BY TYPE, 2021–2023 (USD MILLION)
- TABLE 131 EUROPE: NIPT CONSUMABLES MARKET, BY TYPE, 2024–2029 (USD MILLION)
- TABLE 132 EUROPE: NIPT INSTRUMENTS MARKET, BY TYPE, 2021–2023 (USD MILLION)
- TABLE 133 EUROPE: NIPT INSTRUMENTS MARKET, BY TYPE, 2024–2029 (USD MILLION)
- TABLE 134 EUROPE: NIPT MARKET, BY METHOD, 2021–2023 (USD MILLION)
- TABLE 135 EUROPE: NIPT MARKET, BY METHOD, 2024–2029 (USD MILLION)
- TABLE 136 EUROPE: NIPT MARKET, BY APPLICATION, 2021–2023 (USD MILLION)
- TABLE 137 EUROPE: NIPT MARKET, BY APPLICATION, 2024–2029 (USD MILLION)
- TABLE 138 EUROPE: NIPT MARKET, BY END USER, 2021–2023 (USD MILLION)
- TABLE 139 EUROPE: NIPT MARKET, BY END USER, 2024–2029 (USD MILLION)
- TABLE 140 UK: KEY MACROINDICATORS
- TABLE 141 UK: NIPT MARKET, BY PRODUCT & SERVICE, 2021–2023 (USD MILLION)
- TABLE 142 UK: NIPT MARKET, BY PRODUCT & SERVICE, 2024–2029 (USD MILLION)
- TABLE 143 UK: NIPT PRODUCTS MARKET, BY TYPE, 2021–2023 (USD MILLION)
- TABLE 144 UK: NIPT PRODUCTS MARKET, BY TYPE, 2024–2029 (USD MILLION)
- TABLE 145 UK: NIPT CONSUMABLES MARKET, BY TYPE, 2021–2023 (USD MILLION)
- TABLE 146 UK: NIPT CONSUMABLES MARKET, BY TYPE, 2024–2029 (USD MILLION)
- TABLE 147 UK: NIPT INSTRUMENTS MARKET, BY TYPE, 2021–2023 (USD MILLION)
- TABLE 148 UK: NIPT INSTRUMENTS MARKET, BY TYPE, 2024–2029 (USD MILLION)
- TABLE 149 UK: NIPT MARKET, BY METHOD, 2021–2023 (USD MILLION)
- TABLE 150 UK: NIPT MARKET, BY METHOD, 2024–2029 (USD MILLION)
- TABLE 151 UK: NIPT MARKET, BY APPLICATION, 2021–2023 (USD MILLION)
- TABLE 152 UK: NIPT MARKET, BY APPLICATION, 2024–2029 (USD MILLION)
- TABLE 153 UK: NIPT MARKET, BY END USER, 2021–2023 (USD MILLION)
- TABLE 154 UK: NIPT MARKET, BY END USER, 2024–2029 (USD MILLION)
- TABLE 155 GERMANY: KEY MACROINDICATORS
- TABLE 156 GERMANY: NIPT MARKET, BY PRODUCT & SERVICE, 2021–2023 (USD MILLION)
- TABLE 157 GERMANY: NIPT MARKET, BY PRODUCT & SERVICE, 2024–2029 (USD MILLION)
- TABLE 158 GERMANY: NIPT PRODUCTS MARKET, BY TYPE, 2021–2023 (USD MILLION)
- TABLE 159 GERMANY: NIPT PRODUCTS MARKET, BY TYPE, 2024–2029 (USD MILLION)
- TABLE 160 GERMANY: NIPT CONSUMABLES MARKET, BY TYPE, 2021–2023 (USD MILLION)
- TABLE 161 GERMANY: NIPT CONSUMABLES MARKET, BY TYPE, 2024–2029 (USD MILLION)
- TABLE 162 GERMANY: NIPT INSTRUMENTS MARKET, BY TYPE, 2021–2023 (USD MILLION)
- TABLE 163 GERMANY: NIPT INSTRUMENTS MARKET, BY TYPE, 2024–2029 (USD MILLION)
- TABLE 164 GERMANY: NIPT MARKET, BY METHOD, 2021–2023 (USD MILLION)
- TABLE 165 GERMANY: NIPT MARKET, BY METHOD, 2024–2029 (USD MILLION)
- TABLE 166 GERMANY: NIPT MARKET, BY APPLICATION, 2021–2023 (USD MILLION)
- TABLE 167 GERMANY: NIPT MARKET, BY APPLICATION, 2024–2029 (USD MILLION)
- TABLE 168 GERMANY: NIPT MARKET, BY END USER, 2021–2023 (USD MILLION)
- TABLE 169 GERMANY: NIPT MARKET, BY END USER, 2024–2029 (USD MILLION)
- TABLE 170 FRANCE: KEY MACROINDICATORS
- TABLE 171 FRANCE: NIPT MARKET, BY PRODUCT & SERVICE, 2021–2023 (USD MILLION)
- TABLE 172 FRANCE: NIPT MARKET, BY PRODUCT & SERVICE, 2024–2029 (USD MILLION)
- TABLE 173 FRANCE: NIPT PRODUCTS MARKET, BY TYPE, 2021–2023 (USD MILLION)
- TABLE 174 FRANCE: NIPT PRODUCTS MARKET, BY TYPE, 2024–2029 (USD MILLION)
- TABLE 175 FRANCE: NIPT CONSUMABLES MARKET, BY TYPE, 2021–2023 (USD MILLION)
- TABLE 176 FRANCE: NIPT CONSUMABLES MARKET, BY TYPE, 2024–2029 (USD MILLION)
- TABLE 177 FRANCE: NIPT INSTRUMENTS MARKET, BY TYPE, 2021–2023 (USD MILLION)
- TABLE 178 FRANCE: NIPT INSTRUMENTS MARKET, BY TYPE, 2024–2029 (USD MILLION)
- TABLE 179 FRANCE: NIPT MARKET, BY METHOD, 2021–2023 (USD MILLION)
- TABLE 180 FRANCE: NIPT MARKET, BY METHOD, 2024–2029 (USD MILLION)
- TABLE 181 FRANCE: NIPT MARKET, BY APPLICATION, 2021–2023 (USD MILLION)
- TABLE 182 FRANCE: NIPT MARKET, BY APPLICATION, 2024–2029 (USD MILLION)
- TABLE 183 FRANCE: NIPT MARKET, BY END USER, 2021–2023 (USD MILLION)
- TABLE 184 FRANCE: NIPT MARKET, BY END USER, 2024–2029 (USD MILLION)
- TABLE 185 ITALY: KEY MACROINDICATORS
- TABLE 186 ITALY: NIPT MARKET, BY PRODUCT & SERVICE, 2021–2023 (USD MILLION)
- TABLE 187 ITALY: NIPT MARKET, BY PRODUCT & SERVICE, 2024–2029 (USD MILLION)
- TABLE 188 ITALY: NIPT PRODUCTS MARKET, BY TYPE, 2021–2023 (USD MILLION)
- TABLE 189 ITALY: NIPT PRODUCTS MARKET, BY TYPE, 2024–2029 (USD MILLION)
- TABLE 190 ITALY: NIPT CONSUMABLES MARKET, BY TYPE, 2021–2023 (USD MILLION)
- TABLE 191 ITALY: NIPT CONSUMABLES MARKET, BY TYPE, 2024–2029 (USD MILLION)
- TABLE 192 ITALY: NIPT INSTRUMENTS MARKET, BY TYPE, 2021–2023 (USD MILLION)
- TABLE 193 ITALY: NIPT INSTRUMENTS MARKET, BY TYPE, 2024–2029 (USD MILLION)
- TABLE 194 ITALY: NIPT MARKET, BY METHOD, 2021–2023 (USD MILLION)
- TABLE 195 ITALY: NIPT MARKET, BY METHOD, 2024–2029 (USD MILLION)
- TABLE 196 ITALY: NIPT MARKET, BY APPLICATION, 2021–2023 (USD MILLION)
- TABLE 197 ITALY: NIPT MARKET, BY APPLICATION, 2024–2029 (USD MILLION)
- TABLE 198 ITALY: NIPT MARKET, BY END USER, 2021–2023 (USD MILLION)
- TABLE 199 ITALY: NIPT MARKET, BY END USER, 2024–2029 (USD MILLION)
- TABLE 200 SPAIN: KEY MACROINDICATORS
- TABLE 201 SPAIN: NIPT MARKET, BY PRODUCT & SERVICE, 2021–2023 (USD MILLION)
- TABLE 202 SPAIN: NIPT MARKET, BY PRODUCT & SERVICE, 2024–2029 (USD MILLION)
- TABLE 203 SPAIN: NIPT PRODUCTS MARKET, BY TYPE, 2021–2023 (USD MILLION)
- TABLE 204 SPAIN: NIPT PRODUCTS MARKET, BY TYPE, 2024–2029 (USD MILLION)
- TABLE 205 SPAIN: NIPT CONSUMABLES MARKET, BY TYPE, 2021–2023 (USD MILLION)
- TABLE 206 SPAIN: NIPT CONSUMABLES MARKET, BY TYPE, 2024–2029 (USD MILLION)
- TABLE 207 SPAIN: NIPT INSTRUMENTS MARKET, BY TYPE, 2021–2023 (USD MILLION)
- TABLE 208 SPAIN: NIPT INSTRUMENTS MARKET, BY TYPE, 2024–2029 (USD MILLION)
- TABLE 209 SPAIN: NIPT MARKET, BY METHOD, 2021–2023 (USD MILLION)
- TABLE 210 SPAIN: NIPT MARKET, BY METHOD, 2024–2029 (USD MILLION)
- TABLE 211 SPAIN: NIPT MARKET, BY APPLICATION, 2021–2023 (USD MILLION)
- TABLE 212 SPAIN: NIPT MARKET, BY APPLICATION, 2024–2029 (USD MILLION)
- TABLE 213 SPAIN: NIPT MARKET, BY END USER, 2021–2023 (USD MILLION)
- TABLE 214 SPAIN: NIPT MARKET, BY END USER, 2024–2029 (USD MILLION)
- TABLE 215 REST OF EUROPE: NIPT MARKET, BY PRODUCT & SERVICE, 2021–2023 (USD MILLION)
- TABLE 216 REST OF EUROPE: NIPT MARKET, BY PRODUCT & SERVICE, 2024–2029 (USD MILLION)
- TABLE 217 REST OF EUROPE: NIPT PRODUCTS MARKET, BY TYPE, 2021–2023 (USD MILLION)
- TABLE 218 REST OF EUROPE: NIPT PRODUCTS MARKET, BY TYPE, 2024–2029 (USD MILLION)
- TABLE 219 REST OF EUROPE: NIPT CONSUMABLES MARKET, BY TYPE, 2021–2023 (USD MILLION)
- TABLE 220 REST OF EUROPE: NIPT CONSUMABLES MARKET, BY TYPE, 2024–2029 (USD MILLION)
- TABLE 221 REST OF EUROPE: NIPT INSTRUMENTS MARKET, BY TYPE, 2021–2023 (USD MILLION)
- TABLE 222 REST OF EUROPE: NIPT INSTRUMENTS MARKET, BY TYPE, 2024–2029 (USD MILLION)
- TABLE 223 REST OF EUROPE: NIPT MARKET, BY METHOD, 2021–2023 (USD MILLION)
- TABLE 224 REST OF EUROPE: NIPT MARKET, BY METHOD, 2024–2029 (USD MILLION)
- TABLE 225 REST OF EUROPE: NIPT MARKET, BY APPLICATION, 2021–2023 (USD MILLION)
- TABLE 226 REST OF EUROPE: NIPT MARKET, BY APPLICATION, 2024–2029 (USD MILLION)
- TABLE 227 REST OF EUROPE: NIPT MARKET, BY END USER, 2021–2023 (USD MILLION)
- TABLE 228 REST OF EUROPE: NIPT MARKET, BY END USER, 2024–2029 (USD MILLION)
- TABLE 229 ASIA PACIFIC: NIPT MARKET, BY COUNTRY, 2021–2023 (USD MILLION)
- TABLE 230 ASIA PACIFIC: NIPT MARKET, BY COUNTRY, 2024–2029 (USD MILLION)
- TABLE 231 ASIA PACIFIC: NIPT MARKET, BY PRODUCT & SERVICE, 2021–2023 (USD MILLION)
- TABLE 232 ASIA PACIFIC: NIPT MARKET, BY PRODUCT & SERVICE, 2024–2029 (USD MILLION)
- TABLE 233 ASIA PACIFIC: NIPT PRODUCTS MARKET, BY TYPE, 2021–2023 (USD MILLION)
- TABLE 234 ASIA PACIFIC: NIPT PRODUCTS MARKET, BY TYPE, 2024–2029 (USD MILLION)
- TABLE 235 ASIA PACIFIC: NIPT CONSUMABLES MARKET, BY TYPE, 2021–2023 (USD MILLION)
- TABLE 236 ASIA PACIFIC: NIPT CONSUMABLES MARKET, BY TYPE, 2024–2029 (USD MILLION)
- TABLE 237 ASIA PACIFIC: NIPT INSTRUMENTS MARKET, BY TYPE, 2021–2023 (USD MILLION)
- TABLE 238 ASIA PACIFIC: NIPT INSTRUMENTS MARKET, BY TYPE, 2024–2029 (USD MILLION)
- TABLE 239 ASIA PACIFIC: NIPT MARKET, BY METHOD, 2021–2023 (USD MILLION)
- TABLE 240 ASIA PACIFIC: NIPT MARKET, BY METHOD, 2024–2029 (USD MILLION)
- TABLE 241 ASIA PACIFIC: NIPT MARKET, BY APPLICATION, 2021–2023 (USD MILLION)
- TABLE 242 ASIA PACIFIC: NIPT MARKET, BY APPLICATION, 2024–2029 (USD MILLION)
- TABLE 243 ASIA PACIFIC: NIPT MARKET, BY END USER, 2021–2023 (USD MILLION)
- TABLE 244 ASIA PACIFIC: NIPT MARKET, BY END USER, 2024–2029 (USD MILLION)
- TABLE 245 JAPAN: KEY MACROINDICATORS
- TABLE 246 JAPAN: NIPT MARKET, BY PRODUCT & SERVICE, 2021–2023 (USD MILLION)
- TABLE 247 JAPAN: NIPT MARKET, BY PRODUCT & SERVICE, 2024–2029 (USD MILLION)
- TABLE 248 JAPAN: NIPT PRODUCTS MARKET, BY TYPE, 2021–2023 (USD MILLION)
- TABLE 249 JAPAN: NIPT PRODUCTS MARKET, BY TYPE, 2024–2029 (USD MILLION)
- TABLE 250 JAPAN: NIPT CONSUMABLES MARKET, BY TYPE, 2021–2023 (USD MILLION)
- TABLE 251 JAPAN: NIPT CONSUMABLES MARKET, BY TYPE, 2024–2029 (USD MILLION)
- TABLE 252 JAPAN: NIPT INSTRUMENTS MARKET, BY TYPE, 2021–2023 (USD MILLION)
- TABLE 253 JAPAN: NIPT INSTRUMENTS MARKET, BY TYPE, 2024–2029 (USD MILLION)
- TABLE 254 JAPAN: NIPT MARKET, BY METHOD, 2021–2023 (USD MILLION)
- TABLE 255 JAPAN: NIPT MARKET, BY METHOD, 2024–2029 (USD MILLION)
- TABLE 256 JAPAN: NIPT MARKET, BY APPLICATION, 2021–2023 (USD MILLION)
- TABLE 257 JAPAN: NIPT MARKET, BY APPLICATION, 2024–2029 (USD MILLION)
- TABLE 258 JAPAN: NIPT MARKET, BY END USER, 2021–2023 (USD MILLION)
- TABLE 259 JAPAN: NIPT MARKET, BY END USER, 2024–2029 (USD MILLION)
- TABLE 260 CHINA: KEY MACROINDICATORS
- TABLE 261 CHINA: NIPT MARKET, BY PRODUCT & SERVICE, 2021–2023 (USD MILLION)
- TABLE 262 CHINA: NIPT MARKET, BY PRODUCT & SERVICE, 2024–2029 (USD MILLION)
- TABLE 263 CHINA: NIPT PRODUCTS MARKET, BY TYPE, 2021–2023 (USD MILLION)
- TABLE 264 CHINA: NIPT PRODUCTS MARKET, BY TYPE, 2024–2029 (USD MILLION)
- TABLE 265 CHINA: NIPT CONSUMABLES MARKET, BY TYPE, 2021–2023 (USD MILLION)
- TABLE 266 CHINA: NIPT CONSUMABLES MARKET, BY TYPE, 2024–2029 (USD MILLION)
- TABLE 267 CHINA: NIPT INSTRUMENTS MARKET, BY TYPE, 2021–2023 (USD MILLION)
- TABLE 268 CHINA: NIPT INSTRUMENTS MARKET, BY TYPE, 2024–2029 (USD MILLION)
- TABLE 269 CHINA: NIPT MARKET, BY METHOD, 2021–2023 (USD MILLION)
- TABLE 270 CHINA: NIPT MARKET, BY METHOD, 2024–2029 (USD MILLION)
- TABLE 271 CHINA: NIPT MARKET, BY APPLICATION, 2021–2023 (USD MILLION)
- TABLE 272 CHINA: NIPT MARKET, BY APPLICATION, 2024–2029 (USD MILLION)
- TABLE 273 CHINA: NIPT MARKET, BY END USER, 2021–2023 (USD MILLION)
- TABLE 274 CHINA: NIPT MARKET, BY END USER, 2024–2029 (USD MILLION)
- TABLE 275 INDIA: KEY MACROINDICATORS
- TABLE 276 INDIA: NIPT MARKET, BY PRODUCT & SERVICE, 2021–2023 (USD MILLION)
- TABLE 277 INDIA: NIPT MARKET, BY PRODUCT & SERVICE, 2024–2029 (USD MILLION)
- TABLE 278 INDIA: NIPT PRODUCTS MARKET, BY TYPE, 2021–2023 (USD MILLION)
- TABLE 279 INDIA: NIPT PRODUCTS MARKET, BY TYPE, 2024–2029 (USD MILLION)
- TABLE 280 INDIA: NIPT CONSUMABLES MARKET, BY TYPE, 2021–2023 (USD MILLION)
- TABLE 281 INDIA: NIPT CONSUMABLES MARKET, BY TYPE, 2024–2029 (USD MILLION)
- TABLE 282 INDIA: NIPT INSTRUMENTS MARKET, BY TYPE, 2021–2023 (USD MILLION)
- TABLE 283 INDIA: NIPT INSTRUMENTS MARKET, BY TYPE, 2024–2029 (USD MILLION)
- TABLE 284 INDIA: NIPT MARKET, BY METHOD, 2021–2023 (USD MILLION)
- TABLE 285 INDIA: NIPT MARKET, BY METHOD, 2024–2029 (USD MILLION)
- TABLE 286 INDIA: NIPT MARKET, BY APPLICATION, 2021–2023 (USD MILLION)
- TABLE 287 INDIA: NIPT MARKET, BY APPLICATION, 2024–2029 (USD MILLION)
- TABLE 288 INDIA: NIPT MARKET, BY END USER, 2021–2023 (USD MILLION)
- TABLE 289 INDIA: NIPT MARKET, BY END USER, 2024–2029 (USD MILLION)
- TABLE 290 AUSTRALIA: KEY MACROINDICATORS
- TABLE 291 AUSTRALIA: NIPT MARKET, BY PRODUCT & SERVICE, 2021–2023 (USD MILLION)
- TABLE 292 AUSTRALIA: NIPT MARKET, BY PRODUCT & SERVICE, 2024–2029 (USD MILLION)
- TABLE 293 AUSTRALIA: NIPT PRODUCTS MARKET, BY TYPE, 2021–2023 (USD MILLION)
- TABLE 294 AUSTRALIA: NIPT PRODUCTS MARKET, BY TYPE, 2024–2029 (USD MILLION)
- TABLE 295 AUSTRALIA: NIPT CONSUMABLES MARKET, BY TYPE, 2021–2023 (USD MILLION)
- TABLE 296 AUSTRALIA: NIPT CONSUMABLES MARKET, BY TYPE, 2024–2029 (USD MILLION)
- TABLE 297 AUSTRALIA: NIPT INSTRUMENTS MARKET, BY TYPE, 2021–2023 (USD MILLION)
- TABLE 298 AUSTRALIA: NIPT INSTRUMENTS MARKET, BY TYPE, 2024–2029 (USD MILLION)
- TABLE 299 AUSTRALIA: NIPT MARKET, BY METHOD, 2021–2023 (USD MILLION)
- TABLE 300 AUSTRALIA: NIPT MARKET, BY METHOD, 2024–2029 (USD MILLION)
- TABLE 301 AUSTRALIA: NIPT MARKET, BY APPLICATION, 2021–2023 (USD MILLION)
- TABLE 302 AUSTRALIA: NIPT MARKET, BY APPLICATION, 2024–2029 (USD MILLION)
- TABLE 303 AUSTRALIA: NIPT MARKET, BY END USER, 2021–2023 (USD MILLION)
- TABLE 304 AUSTRALIA: NIPT MARKET, BY END USER, 2024–2029 (USD MILLION)
- TABLE 305 SOUTH KOREA: KEY MACROINDICATORS
- TABLE 306 SOUTH KOREA: NIPT MARKET, BY PRODUCT & SERVICE, 2021–2023 (USD MILLION)
- TABLE 307 SOUTH KOREA: NIPT MARKET, BY PRODUCT & SERVICE, 2024–2029 (USD MILLION)
- TABLE 308 SOUTH KOREA: NIPT PRODUCTS MARKET, BY TYPE, 2021–2023 (USD MILLION)
- TABLE 309 SOUTH KOREA: NIPT PRODUCTS MARKET, BY TYPE, 2024–2029 (USD MILLION)
- TABLE 310 SOUTH KOREA: NIPT CONSUMABLES MARKET, BY TYPE, 2021–2023 (USD MILLION)
- TABLE 311 SOUTH KOREA: NIPT CONSUMABLES MARKET, BY TYPE, 2024–2029 (USD MILLION)
- TABLE 312 SOUTH KOREA: NIPT INSTRUMENTS MARKET, BY TYPE, 2021–2023 (USD MILLION)
- TABLE 313 SOUTH KOREA: NIPT INSTRUMENTS MARKET, BY TYPE, 2024–2029 (USD MILLION)
- TABLE 314 SOUTH KOREA: NIPT MARKET, BY METHOD, 2021–2023 (USD MILLION)
- TABLE 315 SOUTH KOREA: NIPT MARKET, BY METHOD, 2024–2029 (USD MILLION)
- TABLE 316 SOUTH KOREA: NIPT MARKET, BY APPLICATION, 2021–2023 (USD MILLION)
- TABLE 317 SOUTH KOREA: NIPT MARKET, BY APPLICATION, 2024–2029 (USD MILLION)
- TABLE 318 SOUTH KOREA: NIPT MARKET, BY END USER, 2021–2023 (USD MILLION)
- TABLE 319 SOUTH KOREA: NIPT MARKET, BY END USER, 2024–2029 (USD MILLION)
- TABLE 320 REST OF ASIA PACIFIC: NIPT MARKET, BY PRODUCT & SERVICE, 2021–2023 (USD MILLION)
- TABLE 321 REST OF ASIA PACIFIC: NIPT MARKET, BY PRODUCT & SERVICE, 2024–2029 (USD MILLION)
- TABLE 322 REST OF ASIA PACIFIC: NIPT PRODUCTS MARKET, BY TYPE, 2021–2023 (USD MILLION)
- TABLE 323 REST OF ASIA PACIFIC: NIPT PRODUCTS MARKET, BY TYPE, 2024–2029 (USD MILLION)
- TABLE 324 REST OF ASIA PACIFIC: NIPT CONSUMABLES MARKET, BY TYPE, 2021–2023 (USD MILLION)
- TABLE 325 REST OF ASIA PACIFIC: NIPT CONSUMABLES MARKET, BY TYPE, 2024–2029 (USD MILLION)
- TABLE 326 REST OF ASIA PACIFIC: NIPT INSTRUMENTS MARKET, BY TYPE, 2021–2023 (USD MILLION)
- TABLE 327 REST OF ASIA PACIFIC: NIPT INSTRUMENTS MARKET, BY TYPE, 2024–2029 (USD MILLION)
- TABLE 328 REST OF ASIA PACIFIC: NIPT MARKET, BY METHOD, 2021–2023 (USD MILLION)
- TABLE 329 REST OF ASIA PACIFIC: NIPT MARKET, BY METHOD, 2024–2029 (USD MILLION)
- TABLE 330 REST OF ASIA PACIFIC: NIPT MARKET, BY APPLICATION, 2021–2023 (USD MILLION)
- TABLE 331 REST OF ASIA PACIFIC: NIPT MARKET, BY APPLICATION, 2024–2029 (USD MILLION)
- TABLE 332 REST OF ASIA PACIFIC: NIPT MARKET, BY END USER, 2021–2023 (USD MILLION)
- TABLE 333 REST OF ASIA PACIFIC: NIPT MARKET, BY END USER, 2024–2029 (USD MILLION)
- TABLE 334 LATIN AMERICA: NIPT MARKET, BY COUNTRY, 2021–2023 (USD MILLION)
- TABLE 335 LATIN AMERICA: NIPT MARKET, BY COUNTRY, 2024–2029 (USD MILLION)
- TABLE 336 LATIN AMERICA: NIPT MARKET, BY PRODUCT & SERVICE, 2021–2023 (USD MILLION)
- TABLE 337 LATIN AMERICA: NIPT MARKET, BY PRODUCT & SERVICE, 2024–2029 (USD MILLION)
- TABLE 338 LATIN AMERICA: NIPT PRODUCTS MARKET, BY TYPE, 2021–2023 (USD MILLION)
- TABLE 339 LATIN AMERICA: NIPT PRODUCTS MARKET, BY TYPE, 2024–2029 (USD MILLION)
- TABLE 340 LATIN AMERICA: NIPT CONSUMABLES MARKET, BY TYPE, 2021–2023 (USD MILLION)
- TABLE 341 LATIN AMERICA: NIPT CONSUMABLES MARKET, BY TYPE, 2024–2029 (USD MILLION)
- TABLE 342 LATIN AMERICA: NIPT INSTRUMENTS MARKET, BY TYPE, 2021–2023 (USD MILLION)
- TABLE 343 LATIN AMERICA: NIPT INSTRUMENTS MARKET, BY TYPE, 2024–2029 (USD MILLION)
- TABLE 344 LATIN AMERICA: NIPT MARKET, BY METHOD, 2021–2023 (USD MILLION)
- TABLE 345 LATIN AMERICA: NIPT MARKET, BY METHOD, 2024–2029 (USD MILLION)
- TABLE 346 LATIN AMERICA: NIPT MARKET, BY APPLICATION, 2021–2023 (USD MILLION)
- TABLE 347 LATIN AMERICA: NIPT MARKET, BY APPLICATION, 2024–2029 (USD MILLION)
- TABLE 348 LATIN AMERICA: NIPT MARKET, BY END USER, 2021–2023 (USD MILLION)
- TABLE 349 LATIN AMERICA: NIPT MARKET, BY END USER, 2024–2029 (USD MILLION)
- TABLE 350 BRAZIL: KEY MACROINDICATORS
- TABLE 351 BRAZIL: NIPT MARKET, BY PRODUCT & SERVICE, 2021–2023 (USD MILLION)
- TABLE 352 BRAZIL: NIPT MARKET, BY PRODUCT & SERVICE, 2024–2029 (USD MILLION)
- TABLE 353 BRAZIL: NIPT PRODUCTS MARKET, BY TYPE, 2021–2023 (USD MILLION)
- TABLE 354 BRAZIL: NIPT PRODUCTS MARKET, BY TYPE, 2024–2029 (USD MILLION)
- TABLE 355 BRAZIL: NIPT CONSUMABLES MARKET, BY TYPE, 2021–2023 (USD MILLION)
- TABLE 356 BRAZIL: NIPT CONSUMABLES MARKET, BY TYPE, 2024–2029 (USD MILLION)
- TABLE 357 BRAZIL: NIPT INSTRUMENTS MARKET, BY TYPE, 2021–2023 (USD MILLION)
- TABLE 358 BRAZIL: NIPT INSTRUMENTS MARKET, BY TYPE, 2024–2029 (USD MILLION)
- TABLE 359 BRAZIL: NIPT MARKET, BY METHOD, 2021–2023 (USD MILLION)
- TABLE 360 BRAZIL: NIPT MARKET, BY METHOD, 2024–2029 (USD MILLION)
- TABLE 361 BRAZIL: NIPT MARKET, BY APPLICATION, 2021–2023 (USD MILLION)
- TABLE 362 BRAZIL: NIPT MARKET, BY APPLICATION, 2024–2029 (USD MILLION)
- TABLE 363 BRAZIL: NIPT MARKET, BY END USER, 2021–2023 (USD MILLION)
- TABLE 364 BRAZIL: NIPT MARKET, BY END USER, 2024–2029 (USD MILLION)
- TABLE 365 MEXICO: KEY MACROINDICATORS
- TABLE 366 MEXICO: NIPT MARKET, BY PRODUCT & SERVICE, 2021–2023 (USD MILLION)
- TABLE 367 MEXICO: NIPT MARKET, BY PRODUCT & SERVICE, 2024–2029 (USD MILLION)
- TABLE 368 MEXICO: NIPT PRODUCTS MARKET, BY TYPE, 2021–2023 (USD MILLION)
- TABLE 369 MEXICO: NIPT PRODUCTS MARKET, BY TYPE, 2024–2029 (USD MILLION)
- TABLE 370 MEXICO: NIPT CONSUMABLES MARKET, BY TYPE, 2021–2023 (USD MILLION)
- TABLE 371 MEXICO: NIPT CONSUMABLES MARKET, BY TYPE, 2024–2029 (USD MILLION)
- TABLE 372 MEXICO: NIPT INSTRUMENTS MARKET, BY TYPE, 2021–2023 (USD MILLION)
- TABLE 373 MEXICO: NIPT INSTRUMENTS MARKET, BY TYPE, 2024–2029 (USD MILLION)
- TABLE 374 MEXICO: NIPT MARKET, BY METHOD, 2021–2023 (USD MILLION)
- TABLE 375 MEXICO: NIPT MARKET, BY METHOD, 2024–2029 (USD MILLION)
- TABLE 376 MEXICO: NIPT MARKET, BY APPLICATION, 2021–2023 (USD MILLION)
- TABLE 377 MEXICO: NIPT MARKET, BY APPLICATION, 2024–2029 (USD MILLION)
- TABLE 378 MEXICO: NIPT MARKET, BY END USER, 2021–2023 (USD MILLION)
- TABLE 379 MEXICO: NIPT MARKET, BY END USER, 2024–2029 (USD MILLION)
- TABLE 380 REST OF LATIN AMERICA: NIPT MARKET, BY PRODUCT & SERVICE, 2021–2023 (USD MILLION)
- TABLE 381 REST OF LATIN AMERICA: NIPT MARKET, BY PRODUCT & SERVICE, 2024–2029 (USD MILLION)
- TABLE 382 REST OF LATIN AMERICA: NIPT PRODUCTS MARKET, BY TYPE, 2021–2023 (USD MILLION)
- TABLE 383 REST OF LATIN AMERICA: NIPT PRODUCTS MARKET, BY TYPE, 2024–2029 (USD MILLION)
- TABLE 384 REST OF LATIN AMERICA: NIPT CONSUMABLES MARKET, BY TYPE, 2021–2023 (USD MILLION)
- TABLE 385 REST OF LATIN AMERICA: NIPT CONSUMABLES MARKET, BY TYPE, 2024–2029 (USD MILLION)
- TABLE 386 REST OF LATIN AMERICA: NIPT INSTRUMENTS MARKET, BY TYPE, 2021–2023 (USD MILLION)
- TABLE 387 REST OF LATIN AMERICA: NIPT INSTRUMENTS MARKET, BY TYPE, 2024–2029 (USD MILLION)
- TABLE 388 REST OF LATIN AMERICA: NIPT MARKET, BY METHOD, 2021–2023 (USD MILLION)
- TABLE 389 REST OF LATIN AMERICA: NIPT MARKET, BY METHOD, 2024–2029 (USD MILLION)
- TABLE 390 REST OF LATIN AMERICA: NIPT MARKET, BY APPLICATION, 2021–2023 (USD MILLION)
- TABLE 391 REST OF LATIN AMERICA: NIPT MARKET, BY APPLICATION, 2024–2029 (USD MILLION)
- TABLE 392 REST OF LATIN AMERICA: NIPT MARKET, BY END USER, 2021–2023 (USD MILLION)
- TABLE 393 REST OF LATIN AMERICA: NIPT MARKET, BY END USER, 2024–2029 (USD MILLION)
- TABLE 394 MIDDLE EAST & AFRICA: NIPT MARKET, BY REGION, 2021–2023 (USD MILLION)
- TABLE 395 MIDDLE EAST & AFRICA: NIPT MARKET, BY REGION, 2024–2029 (USD MILLION)
- TABLE 396 MIDDLE EAST & AFRICA: NIPT MARKET, BY PRODUCT & SERVICE, 2021–2023 (USD MILLION)
- TABLE 397 MIDDLE EAST & AFRICA: NIPT MARKET, BY PRODUCT & SERVICE, 2024–2029 (USD MILLION)
- TABLE 398 MIDDLE EAST & AFRICA: NIPT PRODUCTS MARKET, BY TYPE, 2021–2023 (USD MILLION)
- TABLE 399 MIDDLE EAST & AFRICA: NIPT PRODUCTS MARKET, BY TYPE, 2024–2029 (USD MILLION)
- TABLE 400 MIDDLE EAST & AFRICA: NIPT CONSUMABLES MARKET, BY TYPE, 2021–2023 (USD MILLION)
- TABLE 401 MIDDLE EAST & AFRICA: NIPT CONSUMABLES MARKET, BY TYPE, 2024–2029 (USD MILLION)
- TABLE 402 MIDDLE EAST & AFRICA: NIPT INSTRUMENTS MARKET, BY TYPE, 2021–2023 (USD MILLION)
- TABLE 403 MIDDLE EAST & AFRICA: NIPT INSTRUMENTS MARKET, BY TYPE, 2024–2029 (USD MILLION)
- TABLE 404 MIDDLE EAST & AFRICA: NIPT MARKET, BY METHOD, 2021–2023 (USD MILLION)
- TABLE 405 MIDDLE EAST & AFRICA: NIPT MARKET, BY METHOD, 2024–2029 (USD MILLION)
- TABLE 406 MIDDLE EAST & AFRICA: NIPT MARKET, BY APPLICATION, 2021–2023 (USD MILLION)
- TABLE 407 MIDDLE EAST & AFRICA: NIPT MARKET, BY APPLICATION, 2024–2029 (USD MILLION)
- TABLE 408 MIDDLE EAST & AFRICA: NIPT MARKET, BY END USER, 2021–2023 (USD MILLION)
- TABLE 409 MIDDLE EAST & AFRICA: NIPT MARKET, BY END USER, 2024–2029 (USD MILLION)
- TABLE 410 GCC COUNTRIES: NIPT MARKET, BY PRODUCT & SERVICE, 2021–2023 (USD MILLION)
- TABLE 411 GCC COUNTRIES: NIPT MARKET, BY PRODUCT & SERVICE, 2024–2029 (USD MILLION)
- TABLE 412 GCC COUNTRIES: NIPT PRODUCTS MARKET, BY TYPE, 2021–2023 (USD MILLION)
- TABLE 413 GCC COUNTRIES: NIPT PRODUCTS MARKET, BY TYPE, 2024–2029 (USD MILLION)
- TABLE 414 GCC COUNTRIES: NIPT CONSUMABLES MARKET, BY TYPE, 2021–2023 (USD MILLION)
- TABLE 415 GCC COUNTRIES: NIPT CONSUMABLES MARKET, BY TYPE, 2024–2029 (USD MILLION)
- TABLE 416 GCC COUNTRIES: NIPT INSTRUMENTS MARKET, BY TYPE, 2021–2023 (USD MILLION)
- TABLE 417 GCC COUNTRIES: NIPT INSTRUMENTS MARKET, BY TYPE, 2024–2029 (USD MILLION)
- TABLE 418 GCC COUNTRIES: NIPT MARKET, BY METHOD, 2021–2023 (USD MILLION)
- TABLE 419 GCC COUNTRIES: NIPT MARKET, BY METHOD, 2024–2029 (USD MILLION)
- TABLE 420 GCC COUNTRIES: NIPT MARKET, BY APPLICATION, 2021–2023 (USD MILLION)
- TABLE 421 GCC COUNTRIES: NIPT MARKET, BY APPLICATION, 2024–2029 (USD MILLION)
- TABLE 422 GCC COUNTRIES: NIPT MARKET, BY END USER, 2021–2023 (USD MILLION)
- TABLE 423 GCC COUNTRIES: NIPT MARKET, BY END USER, 2024–2029 (USD MILLION)
- TABLE 424 REST OF MIDDLE EAST & AFRICA: NIPT MARKET, BY PRODUCT & SERVICE, 2021–2023 (USD MILLION)
- TABLE 425 REST OF MIDDLE EAST & AFRICA: NIPT MARKET, BY PRODUCT & SERVICE, 2024–2029 (USD MILLION)
- TABLE 426 REST OF MIDDLE EAST & AFRICA: NIPT PRODUCTS MARKET, BY TYPE, 2021–2023 (USD MILLION)
- TABLE 427 REST OF MIDDLE EAST & AFRICA: NIPT PRODUCTS MARKET, BY TYPE, 2024–2029 (USD MILLION)
- TABLE 428 REST OF MIDDLE EAST & AFRICA: NIPT CONSUMABLES MARKET, BY TYPE, 2021–2023 (USD MILLION)
- TABLE 429 REST OF MIDDLE EAST & AFRICA: NIPT CONSUMABLES MARKET, BY TYPE, 2024–2029 (USD MILLION)
- TABLE 430 REST OF MIDDLE EAST & AFRICA: NIPT INSTRUMENTS MARKET, BY TYPE, 2021–2023 (USD MILLION)
- TABLE 431 REST OF MIDDLE EAST & AFRICA: NIPT INSTRUMENTS MARKET, BY TYPE, 2024–2029 (USD MILLION)
- TABLE 432 REST OF MIDDLE EAST & AFRICA: NIPT MARKET, BY METHOD, 2021–2023 (USD MILLION)
- TABLE 433 REST OF MIDDLE EAST & AFRICA: NIPT MARKET, BY METHOD, 2024–2029 (USD MILLION)
- TABLE 434 REST OF MIDDLE EAST & AFRICA: NIPT MARKET, BY APPLICATION, 2021–2023 (USD MILLION)
- TABLE 435 REST OF MIDDLE EAST & AFRICA: NIPT MARKET, BY APPLICATION, 2024–2029 (USD MILLION)
- TABLE 436 REST OF MIDDLE EAST & AFRICA: NIPT MARKET, BY END USER, 2021–2023 (USD MILLION)
- TABLE 437 REST OF MIDDLE EAST & AFRICA: NIPT MARKET, BY END USER, 2024–2029 (USD MILLION)
- TABLE 438 OVERVIEW OF STRATEGIES DEPLOYED BY KEY PLAYERS
- TABLE 439 NIPT MARKET: DEGREE OF COMPETITION
- TABLE 440 NIPT MARKET: PRODUCT & SERVICE FOOTPRINT
- TABLE 441 NIPT MARKET: METHOD FOOTPRINT
- TABLE 442 NIPT MARKET: APPLICATION FOOTPRINT
- TABLE 443 NIPT MARKET: END-USER FOOTPRINT
- TABLE 444 NIPT MARKET: REGION FOOTPRINT
- TABLE 445 NIPT MARKET: DETAILED LIST OF KEY STARTUP/SME PLAYERS
- TABLE 446 NIPT MARKET: COMPETITIVE BENCHMARKING OF KEY EMERGING STARTUPS/SMES
- TABLE 447 NIPT MARKET: PRODUCT & SERVICE LAUNCHES, JANUARY 2021–JUNE 2024
- TABLE 448 NIPT MARKET: DEALS, JANUARY 2021–JUNE 2024
- TABLE 449 NIPT MARKET: EXPANSIONS, JANUARY 2021–JUNE 2024
- TABLE 450 NIPT MARKET: OTHER DEVELOPMENTS, JANUARY 2021–JUNE 2024
- TABLE 451 ILLUMINA: COMPANY OVERVIEW
- TABLE 452 ILLUMINA: PRODUCTS & SERVICES OFFERED
- TABLE 453 ILLUMINA: PRODUCT LAUNCHES & APPROVALS, JANUARY 2021–JUNE 2024
- TABLE 454 ILLUMINA: EXPANSIONS, JANUARY 2021–JUNE 2024
- TABLE 455 ILLUMINA: OTHER DEVELOPMENTS, JANUARY 2021–JUNE 2024
- TABLE 456 NATERA: COMPANY OVERVIEW
- TABLE 457 NATERA: PRODUCTS & SERVICES OFFERED
- TABLE 458 NATERA: PRODUCT & SERVICE LAUNCHES AND APPROVALS, JANUARY 2021–JUNE 2024
- TABLE 459 NATERA: DEALS, JANUARY 2021–JUNE 2024
- TABLE 460 LABORATORY CORPORATION OF AMERICA HOLDINGS: COMPANY OVERVIEW
- TABLE 461 LABORATORY CORPORATION OF AMERICA HOLDINGS: PRODUCTS & SERVICES OFFERED
- TABLE 462 LABORATORY CORPORATION OF AMERICA HOLDINGS: DEALS, JANUARY 2021–JUNE 2024
- TABLE 463 EUROFINS SCIENTIFIC: COMPANY OVERVIEW
- TABLE 464 EUROFINS SCIENTIFIC: PRODUCTS & SERVICES OFFERED
- TABLE 465 EUROFINS SCIENTIFIC: SERVICE LAUNCHES, JANUARY 2021–JUNE 2024
- TABLE 466 EUROFINS SCIENTIFIC: DEALS, JANUARY 2021–JUNE 2024
- TABLE 467 F. HOFFMANN-LA ROCHE: COMPANY OVERVIEW
- TABLE 468 F. HOFFMANN-LA ROCHE: PRODUCTS & SERVICES OFFERED
- TABLE 469 F. HOFFMANN-LA ROCHE: PRODUCT LAUNCHES, JANUARY 2021–JUNE 2024
- TABLE 470 F. HOFFMANN-LA ROCHE: DEALS, JANUARY 2021–JUNE 2024
- TABLE 471 REVVITY: COMPANY OVERVIEW
- TABLE 472 REVVITY: PRODUCTS & SERVICES OFFERED
- TABLE 473 REVVITY: PRODUCT LAUNCHES, JANUARY 2021–JUNE 2024
- TABLE 474 REVVITY: DEALS, JANUARY 2021–JUNE 2024
- TABLE 475 THERMO FISHER SCIENTIFIC: COMPANY OVERVIEW
- TABLE 476 THERMO FISHER SCIENTIFIC: PRODUCTS & SERVICES OFFERED
- TABLE 477 THERMO FISHER SCIENTIFIC: DEALS, JANUARY 2021–JUNE 2024
- TABLE 478 AGILENT TECHNOLOGIES: COMPANY OVERVIEW
- TABLE 479 AGILENT TECHNOLOGIES: PRODUCTS & SERVICES OFFERED
- TABLE 480 AGILENT TECHNOLOGIES: DEALS, JANUARY 2021–JUNE 2024
- TABLE 481 GE HEALTHCARE: COMPANY OVERVIEW
- TABLE 482 GE HEALTHCARE: PRODUCTS & SERVICES OFFERED
- TABLE 483 GE HEALTHCARE: PRODUCT & SERVICE LAUNCHES AND APPROVALS, JANUARY 2021–JUNE 2024
- TABLE 484 GE HEALTHCARE: EXPANSIONS, JANUARY 2021–JUNE 2024
- TABLE 485 QUEST DIAGNOSTICS: COMPANY OVERVIEW
- TABLE 486 QUEST DIAGNOSTICS: PRODUCTS & SERVICES OFFERED
- TABLE 487 QUEST DIAGNOSTICS: PRODUCT LAUNCHES, JANUARY 2021–JUNE 2024
- TABLE 488 QUEST DIAGNOSTICS: DEALS, JANUARY 2021–JUNE 2024
- TABLE 489 SONIC HEALTHCARE: COMPANY OVERVIEW
- TABLE 490 SONIC HEALTHCARE: PRODUCTS & SERVICES OFFERED
- TABLE 491 SONIC HEALTHCARE: DEALS, JANUARY 2021–JUNE 2024
- TABLE 492 SONIC HEALTHCARE: EXPANSIONS, JANUARY 2021–JUNE 2024
- TABLE 493 CENTOGENE: COMPANY OVERVIEW
- TABLE 494 CENTOGENE: PRODUCTS & SERVICES OFFERED
- TABLE 495 CENTOGENE: PRODUCT LAUNCHES, JANUARY 2021–JUNE 2024
- TABLE 496 CENTOGENE: DEALS, JANUARY 2021–JUNE 2024
- TABLE 497 CENTOGENE: OTHER DEVELOPMENTS, JANUARY 2021–JUNE 2024
- TABLE 498 QIAGEN: COMPANY OVERVIEW
- TABLE 499 QIAGEN: PRODUCTS & SERVICES OFFERED
- TABLE 500 QIAGEN: PRODUCT & SERVICE LAUNCHES AND APPROVALS, JANUARY 2021–JUNE 2024
- TABLE 501 QIAGEN: DEALS, JANUARY 2021–JUNE 2024
- TABLE 502 QIAGEN: EXPANSIONS, JANUARY 2021–JUNE 2024
- TABLE 503 PATHWEST LABORATORY MEDICINE: COMPANY OVERVIEW
- TABLE 504 PATHWEST LABORATORY MEDICINE: PRODUCTS & SERVICES OFFERED
- TABLE 505 MYRIAD GENETICS: COMPANY OVERVIEW
- TABLE 506 MYRIAD GENETICS: PRODUCTS & SERVICES OFFERED
- FIGURE 1 NIPT MARKET SEGMENTATION
- FIGURE 2 NIPT MARKET: RESEARCH DESIGN
- FIGURE 3 PRIMARY SOURCES
- FIGURE 4 BREAKDOWN OF PRIMARY INTERVIEWS (SUPPLY SIDE): BY COMPANY TYPE, DESIGNATION, AND REGION
- FIGURE 5 BREAKDOWN OF PRIMARY INTERVIEWS (DEMAND SIDE): BY END USER, DESIGNATION, AND REGION
- FIGURE 6 MARKET SIZE APPROACH: REVENUE SHARE ANALYSIS
- FIGURE 7 TOP-DOWN APPROACH
- FIGURE 8 BOTTOM-UP APPROACH
- FIGURE 9 CAGR PROJECTIONS FROM ANALYSIS OF DRIVERS, RESTRAINTS, OPPORTUNITIES, AND CHALLENGES
- FIGURE 10 CAGR PROJECTIONS: SUPPLY-SIDE ANALYSIS
- FIGURE 11 DATA TRIANGULATION METHODOLOGY
- FIGURE 12 SERVICES SEGMENT TO REGISTER HIGHEST GROWTH DURING FORECAST PERIOD
- FIGURE 13 CONSUMABLES TO HOLD LARGEST SHARE OF PRODUCTS MARKET
- FIGURE 14 DISPOSABLES SEGMENT TO REGISTER HIGHEST GROWTH RATE DURING FORECAST PERIOD
- FIGURE 15 NGS SYSTEMS TO REGISTER HIGHEST GROWTH IN INSTRUMENTS MARKET
- FIGURE 16 ULTRASOUND DETECTION SEGMENT TO HOLD LARGEST MARKET SHARE
- FIGURE 17 TRISOMY TO REGISTER HIGHEST CAGR DURING FORECAST PERIOD
- FIGURE 18 DIAGNOSTIC LABORATORIES TO DOMINATE END-USER MARKET
- FIGURE 19 NORTH AMERICA AND EUROPE ACCOUNTED FOR LARGEST MARKET SHARES IN 2023
- FIGURE 20 HIGH RISK OF CHROMOSOMAL ABNORMALITIES WITH INCREASING MATERNAL AGE TO DRIVE ADOPTION
- FIGURE 21 TRISOMY HELD LARGEST SHARE OF EUROPEAN MARKET IN 2023
- FIGURE 22 ASIA PACIFIC TO GROW AT HIGHEST CAGR DURING FORECAST PERIOD
- FIGURE 23 EMERGING ECONOMIES TO REGISTER HIGHER GROWTH DURING THE FORECAST PERIOD
- FIGURE 24 NIPT MARKET: DRIVERS, RESTRAINTS, OPPORTUNITIES, AND CHALLENGES
- FIGURE 25 INTEGRATION WITH NGS—A LEADING TREND IN NIPT
- FIGURE 26 VALUE CHAIN ANALYSIS OF NIPT MARKET: R&D AND MANUFACTURING PHASE ADD MAXIMUM VALUE
- FIGURE 27 NIPT MARKET: ECOSYSTEM
- FIGURE 28 NIPT MARKET: SUPPLY CHAIN ANALYSIS
- FIGURE 29 NIPT MARKET: PORTER’S FIVE FORCES ANALYSIS
- FIGURE 30 INFLUENCE OF STAKEHOLDERS ON BUYING PROCESS OF NIPT PRODUCTS
- FIGURE 31 KEY BUYING CRITERIA FOR NIPT PRODUCTS
- FIGURE 32 GLOBAL NUMBER OF PATENT PUBLICATIONS (JANUARY 2014-JUNE 2024)
- FIGURE 33 TOP APPLICANTS & OWNERS (COMPANIES/INSTITUTIONS) FOR NIPT PATENTS (JANUARY 2014- JUNE 2024)
- FIGURE 34 TOP APPLICANT COUNTRIES/REGIONS FOR NIPT (JANUARY 2014- JUNE 2024)
- FIGURE 35 OVERVIEW OF ADJACENT MARKETS TO NIPT
- FIGURE 36 NIPT MARKET: INVESTMENT & FUNDING SCENARIO (2019–2023)
- FIGURE 37 REVENUE SHIFTS IN NIPT MARKET
- FIGURE 38 NIPT MARKET: GEOGRAPHIC SNAPSHOT
- FIGURE 39 NORTH AMERICA: NIPT MARKET SNAPSHOT
- FIGURE 40 ASIA PACIFIC: NON-INVASIVE PRENATAL TESTING MARKET SNAPSHOT
- FIGURE 41 REVENUE ANALYSIS OF TOP PLAYERS IN NIPT MARKET (2021–2023)
- FIGURE 42 MARKET SHARE ANALYSIS OF KEY PLAYERS IN NIPT MARKET (2023)
- FIGURE 43 R&D EXPENDITURE OF KEY PLAYERS IN NIPT, 2021–2023
- FIGURE 44 NIPT MARKET: COMPANY EVALUATION MATRIX (KEY PLAYERS), 2023
- FIGURE 45 NIPT MARKET: COMPANY FOOTPRINT
- FIGURE 46 NIPT MARKET: COMPANY EVALUATION MATRIX (STARTUPS/SMES), 2023
- FIGURE 47 EV/EBITDA OF KEY PLAYERS
- FIGURE 48 YEAR-TO-DATE (YTD) PRICE TOTAL RETURN AND 5-YEAR STOCK BETA OF KEY VENDORS
- FIGURE 49 ILLUMINA: COMPANY SNAPSHOT (2023)
- FIGURE 50 NATERA: COMPANY SNAPSHOT (2023)
- FIGURE 51 LABORATORY CORPORATION OF AMERICA HOLDINGS: COMPANY SNAPSHOT (2023)
- FIGURE 52 EUROFINS SCIENTIFIC: COMPANY SNAPSHOT (2023)
- FIGURE 53 F. HOFFMANN-LA ROCHE: COMPANY SNAPSHOT (2023)
- FIGURE 54 REVVITY: COMPANY SNAPSHOT (2023)
- FIGURE 55 THERMO FISHER SCIENTIFIC: COMPANY SNAPSHOT (2023)
- FIGURE 56 AGILENT TECHNOLOGIES: COMPANY SNAPSHOT (2023)
- FIGURE 57 GE HEALTHCARE: COMPANY SNAPSHOT (2023)
- FIGURE 58 QUEST DIAGNOSTICS: COMPANY SNAPSHOT (2023)
- FIGURE 59 SONIC HEALTHCARE: COMPANY SNAPSHOT (2023)
- FIGURE 60 CENTOGENE: COMPANY SNAPSHOT (2023)
- FIGURE 61 QIAGEN: COMPANY SNAPSHOT (2023)
- FIGURE 62 PATHWEST LABORATORY MEDICINE: COMPANY SNAPSHOT (2023)
- FIGURE 63 MYRIAD GENETICS: COMPANY SNAPSHOT (2023)
This study involved four major activities in estimating the current non-invasive prenatal testing (NIPT) market size. Extensive research was conducted to collect information on the market as well as its peer and parent markets. The next step was to validate these findings, assumptions, and sizing with industry experts across the value chain through primary research. Both top-down and bottom-up approaches were employed to estimate the value market. After that, market breakdown and data triangulation procedures were used to estimate the market size of segments and subsegments.
Secondary Research
The secondary research process involves the widespread use of secondary sources, directories, databases (such as Bloomberg Business, Factiva, and D&B Hoovers), white papers, annual reports, companies house documents, investor presentations, and SEC filings of companies. Secondary research was used to identify and collect information useful for the extensive, technical, market-oriented, and commercial study of the non-invasive prenatal testing (NIPT) market. It was also used to obtain important information about the key players and market classification & segmentation according to industry trends to the bottom-most level, and key developments related to market and technology perspectives. A database of the key industry leaders was also prepared using secondary research.
Primary Research
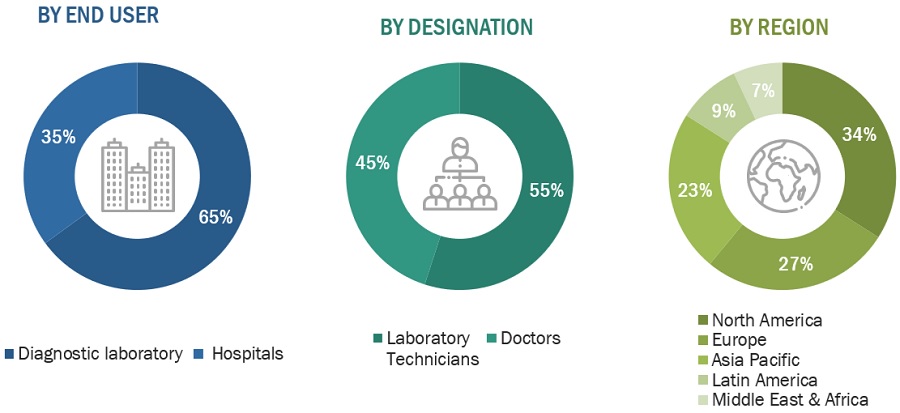
In the primary research process, various sources from both the supply and demand sides were interviewed to obtain qualitative and quantitative information for this report. Primary sources from the supply side include CEOs, consultants, subject-matter experts, directors, general managers, developers, and other key opinion leaders of the various companies that offer non-invasive prenatal testing (NIPT) product and service. Primary sources from the demand side include industry experts such as doctors, hospital directors and managers, and other medical professionals.
Primary research was conducted to identify segmentation types; industry trends; technology trends; key players; and key market dynamics such as drivers, restraints, opportunities, challenges, and key player strategies.
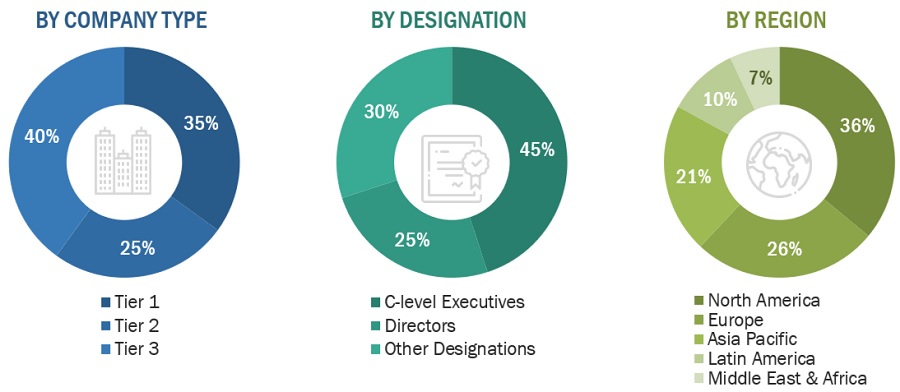
Note 1: Others include sales, marketing, and product managers.
Note 2: Their total revenues define the tiers of companies as of 2023, tier 1 = >USD 500 million, tier 2 = USD 200 million to USD 500 million, and tier 3 = <USD 200 million.
To know about the assumptions considered for the study, download the pdf brochure
Market Size Estimation
The total size of the non-invasive prenatal testing (NIPT) market was arrived at after data triangulation from four different approaches, as mentioned below.
Bottom-up Approach: Revenues of individual companies were gathered from public sources and databases. Shares of the medical device cleaning businesses of leading players were gathered from secondary sources to the extent available. In certain cases, the share of the business unit was ascertained after a detailed analysis of various parameters, including product portfolio, market positioning, selling price, and geographic reach and strength. Individual shares or revenue estimates were validated through expert interviews.
Country level Analysis: The size of the non-invasive prenatal testing (NIPT) market was obtained from the annual presentations of leading players and secondary data available in the public domain. The share of non-invasive prenatal testing (NIPT) products in the overall non-invasive prenatal testing (NIPT) market was obtained from secondary data and validated by primary participants to arrive at the total non-invasive prenatal testing (NIPT) market. Primary participants further validated the numbers.
Primary Interviews: As a part of the primary research process, individual respondent insights on the market size and growth were taken during the interview (regional and global, as applicable). All the responses were collated, and a weighted average was taken to derive a probabilistic estimate of the market size and growth rate.
Geographic market assessment (by region & country): The geographic assessment was done using the following approaches:
Approach 1: Geographic revenue contributions/splits of leading players in the market (wherever available) and respective growth trends
Approach 2: Geographic adoption trends for individual product segments by end users and growth prospects for each of the segments (assumptions and indicative estimates validated from primary interviews)
At each point, the assumptions and approaches were validated through industry experts contacted during primary research. Considering the limitations of data available from secondary research, revenue estimates for individual companies (for the overall non-invasive prenatal testing (NIPT) market and geographic market assessment) were ascertained based on a detailed analysis of their respective product offerings, geographic reach/strength (direct or through distributors or suppliers), and the shares of the leading players in a particular region or country.
After complete market engineering with calculations for market statistics, market size estimations, market forecasting, market breakdown, and data triangulation, extensive primary research was conducted to gather information and verify and validate the critical numbers arrived at. In the complete market engineering process, both top-down and bottom-up approaches were extensively used, along with several data triangulation methods to perform market estimation and market forecasting for the overall market segments and subsegments listed in this report. Extensive qualitative and further quantitative analysis was also done from all the numbers arrived at in the complete market engineering process to list key information throughout the report.
Global Non-invasive prenatal testing (NIPT) market Size: Top-Down Approach
To know about the assumptions considered for the study, Request for Free Sample Report
Global Non-invasive prenatal testing (NIPT) market Size: Bottom-Up Approach
Data Triangulation
After arriving at the market size, the total market was divided into several segments and subsegments. To complete the overall market engineering process and arrive at the exact statistics for all segments and subsegments, data triangulation and market breakdown procedures were employed wherever applicable.
Approach to derive the market size and estimate market growth
The market rankings for leading players were ascertained after a detailed assessment of their revenues from the non-invasive prenatal testing (NIPT) business using secondary data available through paid and unpaid sources. Owing to data limitations, in certain cases, the revenue share was arrived at after a detailed assessment of the product portfolios of major companies and their respective sales performance. At each point, this data was validated through primary interviews with industry experts.
Market Definition
Non-invasive prenatal testing (NIPT) is a method used to screen chromosomal abnormalities in a developing fetus by analyzing small fragments of fetal Cell-Free DNA circulating in a pregnant woman's blood. Non-invasive prenatal tests enable the detection of chromosomal abnormalities, such as trisomy 21 (Down Syndrome), trisomy 18 (Edwards' Syndrome), trisomy 13 (Patau Syndrome), microdeletion syndrome, and other genetic conditions. This market encompasses products such as assay kits and reagents, next generation sequencing systems, and diagnostic services offered by laboratories.
Key Stakeholders
- Non-invasive prenatal testing product manufacturing companies
- Hospitals and private clinics
- Diagnostic laboratories
- Medical research institutes
- Market research and consulting firms
- Suppliers and distributors of NIPT instruments
- Venture capitalists and investors
- Regulatory agencies and government bodies
Objectives of the Study
- To define, describe, and forecast the global non-invasive prenatal testing (NIPT) market on the basis of product and service, method, application, end user, and region
- To provide detailed information about the key factors influencing the market growth, such as drivers, restraints, opportunities, challenges, and industry trends
- To strategically analyze the regulatory scenario, pricing trends, value chain, supply chain, ecosystem analysis, key stakeholders and buying criteria, technology scenario, patent scenario, and key conferences and events in the market
- To analyze the micro markets with respect to individual growth trends, prospects, and contributions to the overall udder health market
- To analyze market opportunities for stakeholders and provide details of the competitive landscape for key players.
- To strategically profile the key players in this market and comprehensively analyze their market shares and core competencies.
- To strategically analyze the udder health market in five regions, namely, North America, Europe, Asia Pacific, Latin America, and the Middle East & Africa.
- To track and analyze competitive developments such as acquisitions, partnerships, and expansions in the udder health market.
Available Customizations
With the given market data, MarketsandMarkets offers customizations as per the company’s specific needs. The following customization options are available for the report:
Company Information
- Detailed analysis and profiling of additional market players
Geographic Analysis
- Further breakdown of the Rest of Asia Pacific non-invasive prenatal testing (NIPT) market into China, Japan, India, South Korea, and other countries.
Growth opportunities and latent adjacency in Non Invasive Prenatal Testing Market