Cloud Mobile Backend as a Service (BaaS) Market

Cloud Mobile Backend as a Service (BaaS) Market by Service Type (Cloud Storage & Backup, Database Management), Platform (Android, iOS), Application Type, Deployment Model, Organization Size, Vertical and Region - Global Forecast to 2028

Report Code: TC 1277 Jan, 2024, by marketsandmarkets.com

[328 Pages Report] The cloud mobile BaaS market size to grow from USD 4.1 billion in 2023 to USD 9.2 billion by 2028 at a compound annual growth rate (CAGR) of 17.5% during the forecast period.

In the ever-evolving landscape of cloud mobile BaaS, several notable trends are shaping the market. Firstly, there is a growing emphasis on serverless architecture within mobile BaaS offerings. Serverless computing allows developers to focus solely on code without managing the underlying infrastructure, enhancing scalability and reducing operational complexities. This trend enables more efficient resource utilization, cost-effectiveness, and rapid development cycles. As a result, cloud mobile BaaS providers are increasingly integrating serverless computing capabilities into their platforms, empowering developers to build and deploy mobile applications more seamlessly.

Another significant trend is the increased adoption of edge computing in the mobile BaaS ecosystem. Edge computing involves processing data closer to the source of generation, reducing latency, and enhancing real-time capabilities. In the context of mobile applications, leveraging edge computing within mobile BaaS enables faster response times, critical for delivering enhanced user experiences. This trend is particularly relevant for applications requiring low-latency interactions, such as augmented reality (AR) and virtual reality (VR) applications. As the demand for high-performance mobile applications continues to rise, integrating edge computing capabilities into mobile BaaS solutions is becoming a strategic priority for providers looking to stay competitive in the dynamic cloud services market. Overall, these trends underscore the industry's focus on enhancing developer productivity, optimizing infrastructure management, and leveraging cutting-edge technologies to meet the evolving demands of mobile application development.

Cloud Mobile Backend as a Service (BaaS) Market

To know about the assumptions considered for the study, Request for Free Sample Report

Cloud Mobile Backend as a Service (BaaS) Market

To know about the assumptions considered for the study, download the pdf brochure

Cloud mobile Backend as a Service (BaaS) Market Dynamics

Driver: Growing mobile app-driven economies demand BaaS

The growing prominence of mobile applications is steering economies towards an increased reliance on BaaS within the cloud mobile domain. This surge can be attributed to several key drivers. Firstly, the escalating demand for mobile app development across diverse sectors, including eCommerce, healthcare, and finance, propels the need for robust backend solutions. The BaaS platform, offered by major players such as AWS, Google, and Microsoft, provides scalable infrastructure and services essential for efficient app development. Additionally, the shift towards cloud-based solutions is driven by the flexibility and cost-effectiveness they offer, enabling businesses to streamline operations and minimize infrastructure costs.

Security concerns also fuel the adoption of BaaS, as these platforms often come equipped with built-in security features, ensuring data protection and compliance with industry regulations. The seamless integration of backend services, encompassing data storage, authentication, and push notifications, facilitates rapid development cycles, enabling businesses to stay agile in the dynamic digital landscape. Moreover, the proliferation of IoT devices further underscores the necessity for robust backend support, and BaaS emerges as a crucial facilitator in managing the complexities associated with IoT data processing and storage. In essence, the symbiotic relationship between the burgeoning mobile app ecosystem and the sophisticated backend services offered by BaaS platforms is propelling the growth of mobile app-driven economies, fostering innovation, and reshaping the digital landscape.

Restraint: Dependency on service providers

A notable restraint in the cloud mobile BaaS market is the inherent dependency on service providers. Businesses relying on mobile BaaS solutions entrust critical backend services to external providers, and any disruptions or shortcomings on the part of these providers can have profound implications. One of the primary concerns is the vulnerability to service outages or interruptions, which can impact the availability and performance of mobile applications. Downtime or slowdowns in backend services may result in a compromised user experience, customer dissatisfaction, and even financial losses for businesses.

Furthermore, the dependence on service providers raises concerns about data ownership, control, and sovereignty. Businesses entrust sensitive user data to these providers, and any breaches or mishandling of data can lead to severe repercussions, including legal and regulatory consequences. This becomes especially pertinent in regions with strict data privacy laws and compliance requirements.

Another restraint associated with dependency is the potential impact of changes in service providers' policies or business models. Shifts in pricing structures, service offerings, or discontinuation of specific features may require businesses to adapt swiftly, potentially leading to additional costs, development efforts, and disruptions. Moreover, the risk of vendor lock-in is inherent in this dependence. Shifting from one service provider to another can be complex and resource-intensive, limiting the flexibility of businesses and potentially hindering their ability to respond to changing market dynamics or adopt more cost-effective solutions.

To mitigate these restraints, businesses need to carefully assess the reliability, security measures, and long-term stability of mobile BaaS providers. Implementing contingency plans, negotiating robust service-level agreements (SLAs), and exploring hybrid or multi-cloud strategies are among the approaches to address the challenges associated with dependency on service providers in the cloud mobile BaaS market. Overall, achieving a balance between the benefits of outsourcing backend services and managing the risks of dependency is crucial for organizations navigating the dynamic landscape of mobile application development.

Opportunity: Mobile apps and mobile games gaining popularity among the end-users

An opportune trend driving the growth of the cloud mobile BaaS market is the surging popularity of mobile applications and games among end-users. The proliferation of smartphones and the expansion of high-speed mobile networks have catalyzed a paradigm shift in consumer behavior, with users increasingly relying on mobile apps for various purposes. This presents a substantial opportunity for the cloud mobile BaaS market as businesses and developers strive to capitalize on this trend by creating innovative and feature-rich mobile applications.

As mobile apps become an integral part of daily life, businesses across diverse sectors are recognizing the need to provide seamless, engaging, and responsive experiences to their users. Cloud mobile BaaS emerges as a crucial facilitator in this landscape by offering scalable and efficient backend services. The demand for robust data storage, secure authentication processes, real-time updates, and other backend functionalities is on the rise, driven by the evolving expectations of mobile app users. The mobile gaming industry, in particular, represents a significant opportunity for the cloud mobile BaaS market. The increasing popularity of mobile games, coupled with the complexity and data-intensive nature of modern gaming applications, necessitates powerful backend support. Cloud mobile BaaS platforms enable game developers to focus on creating captivating gameplay experiences while seamlessly managing backend functions such as user authentication, in-game purchases, and multiplayer interactions.

Moreover, as businesses leverage mobile apps for customer engagement, eCommerce, and service delivery, the demand for scalable and reliable backend infrastructure continues to grow. Cloud mobile BaaS providers offer solutions that not only meet the technical requirements of mobile app development but also contribute to faster time-to-market, enabling businesses to stay agile and responsive to market dynamics. In essence, the rising popularity of mobile applications, encompassing both utility and entertainment-driven apps, presents a lucrative opportunity for the cloud mobile BaaS market. The ability to cater to the evolving needs of end-users and provide a robust foundation for mobile app development positions cloud mobile BaaS as a key enabler in the dynamic and expanding mobile ecosystem.

Challenge: Security and privacy concerns

A prominent challenge confronting the cloud mobile BaaS market is the persistent issue of security and privacy concerns. As businesses increasingly rely on cloud-based solutions for their mobile app development needs, the sensitive nature of the data being processed and stored on the cloud becomes a focal point for scrutiny and potential vulnerabilities. Security challenges in the cloud mobile BaaS market encompass various facets, including data breaches, unauthorized access, and potential exposure of sensitive user information. The centralization of data on cloud servers introduces a single point of attack, making it imperative for mobile BaaS providers to implement robust security measures to safeguard against unauthorized intrusions.

Privacy concerns are intertwined with security challenges, as businesses and users such as are wary of potential mishandling or unauthorized access to personal information. Compliance with data protection regulations such as GDPR is a critical consideration, and the responsibility falls on cloud mobile BaaS providers to implement stringent privacy protocols, encryption mechanisms, and access controls to ensure data confidentiality and integrity.

Additionally, the multi-tenancy nature of cloud environments, where multiple users or organizations share the same infrastructure, raises concerns about data isolation. Strict measures must be in place to prevent data leakage or inadvertent exposure of one user's data to another, reinforcing the importance of robust security protocols within cloud mobile BaaS offerings.

As mobile applications handle diverse and often sensitive user data, the challenge extends to secure authentication mechanisms, secure transmission of data, and protection against various cyber threats such as SQL injection and cross-site scripting attacks. The dynamic and evolving nature of cybersecurity threats requires continuous vigilance and proactive measures from cloud mobile BaaS providers to stay ahead of potential risks. In addressing these challenges, the cloud mobile BaaS market must prioritize comprehensive security frameworks, ongoing threat assessments, and transparent communication with users regarding data protection practices.

Cloud Mobile Backend as a Service (Baas) Market Ecosystem

The ecosystem in the cloud mobile BaaS market comprises a dynamic network of interconnected components, including providers, developers, and end-users. Mobile BaaS providers offer a range of backend services, tools, and infrastructure to facilitate mobile app development. Developers leverage these services to streamline app creation, focusing on front-end innovation. End-users interact with the final applications, benefiting from enhanced features, seamless connectivity, and optimal performance. The ecosystem thrives on collaboration, innovation, and responsiveness, ensuring a symbiotic relationship between providers, developers, and end-users in delivering efficient and user-friendly mobile applications.

The following figure shows the ecosystem of the cloud mobile BaaS market:

Cloud Mobile Backend as a Service (BaaS) Market

Based on verticals, BFSI  vertical is expteceted to dominate the market during the forecast period

Based on the verticals, the cloud mobile BaaS market is segmented into BFSI, IT & ITeS, telecommunications, healthcare & life sciences, manufacturing, retail & eCommerce, media & entertainment, and other verticals. Among the verticals, the BFSI vertical is expected to hold the largest market share during the forecast period. In the BFSI vertical, cloud mobile BaaS plays a pivotal role in transforming digital experiences and operational efficiency. The Mobile BaaS provides a robust foundation for mobile app development in the BFSI sector, offering essential backend services such as secure data storage, real-time analytics, and user authentication. This enables financial institutions to rapidly deploy feature-rich and scalable mobile applications, enhancing customer engagement and accessibility. MBaaS facilitates seamless integration with legacy systems, ensuring a smooth transition to modern mobile solutions. Moreover, it addresses stringent security and compliance requirements by providing advanced authentication mechanisms and encryption protocols, crucial for safeguarding sensitive financial data. By leveraging mobile BaaS, BFSI entities can streamline mobile app development, accelerate time-to-market, and deliver innovative solutions that cater to evolving customer expectations while adhering to industry regulations. Overall, cloud mobile BaaS emerges as a strategic enabler for digital transformation within the BFSI vertical, fostering agility, security, and user-centricity in the competitive landscape of financial services.

Based on the organization size, the SMEs segment is expected to have the highest CAGR growth rate during the forecast period

Based on the organization size, the cloud mobile BaaS market is segmented into large enterprises and SMEs. As per the organization size, the SMEs segment is expected to hold the highest CAGR during the forecast period. In SMEs, cloud mobile BaaS plays a pivotal role in providing a cost-effective and scalable solution for mobile app development. By outsourcing backend infrastructure and services, SMEs can focus on building innovative mobile applications without the burden of managing complex backend systems. Mobile BaaS offers essential features such as data storage, user authentication, and push notifications, streamlining the development process and reducing time-to-market. This allows SMEs with limited resources to compete in the mobile app landscape, as they can leverage the infrastructure and expertise of mobile BaaS providers. Additionally, the pay-as-you-go model of cloud services aligns with the budget constraints of SMEs, ensuring cost efficiency. Cloud mobile BaaS empowers SMEs to create robust, feature-rich mobile applications that enhance customer engagement, streamline operations, and drive business growth, thereby serving as a catalyst for digital transformation within the SME sector.

The US market is projected to contribute the largest share of the cloud mobile BaaS market in North America.

North America is expected to lead the cloud mobile BaaS market in 2023. The US is estimated to account for the largest market share in North America in 2023 in the cloud mobile BaaS market, and the trend is expected to continue until 2028. Cloud mobile BaaS plays a transformative role in the US, serving as a linchpin for the mobile app ecosystem. These platforms empower businesses, including giant corporations, by providing a comprehensive set of backend services that enhance the development, scalability, and functionality of mobile applications. Notably, large enterprises in the US leverage mobile BaaS solutions to streamline their app development processes. According to the secondary data, companies such as Amazon, with its AWS Amplify service, and Microsoft, through Azure Mobile Apps, utilize these platforms to facilitate seamless backend operations for their extensive mobile application portfolios. These mobile BaaS solutions allow these tech giants to efficiently manage user authentication, real-time data synchronization, and other critical functionalities, enabling a more agile and responsive approach to mobile app development.

Moreover, in the US region, where data security and compliance are paramount, mobile Backend as a Service platforms contribute significantly to ensuring the robustness of mobile applications. Giant corporations such as Google, Firebase, and Facebook, through its Parse platform, have employed mobile BaaS to fortify the security of user data, implement scalable solutions, and comply with industry regulations. This strategic adoption of mobile BaaS enables these companies to focus on delivering innovative features to their massive user bases without compromising on the reliability and security of their mobile applications. In essence, cloud MBaaS platforms serve as indispensable tools for major players in the US technology landscape, driving efficiency, innovation, and the rapid evolution of mobile experiences for users across the nation

Cloud Mobile Backend as a Service (BaaS) Market Size, and Share

Key Market Players

The cloud mobile BaaS market is dominated by a few globally established players such AWS (US), Google (US), Microsoft (US), Oracle (US), MongoDB (US), IBM (US), Rackspace Technology (US), Progress (US), Temenos (Switzerland), and Cloudflare (US), among others, are the key vendors that secured cloud mobile BaaS contracts in last few years. Local participants only have local experience; while these vendors can add global processes and execution expertise. Customers are more likely to try new things in the cloud mobile BaaS market because of their higher discretionary budgets, ease of access to information, and quick adoption of technical items.

Report of the Scope

Report Metrics

Details

Market size available for years

2019–2028

Base year considered

2022

Forecast period

2023–2028

Forecast units

Value (USD Million/Billion)

Segments Covered

Service Type, Application Type, Platform, Deployment Model, Organization Size, and Vertical

Geographies Covered

North America, Europe, Asia Pacific, Middle East & Africa, and Latin America

Companies Covered

Some of the significant cloud mobile BaaS market vendors are AWS (US), Google (US), Microsoft (US), Oracle (US), MongoDB (US), IBM (US), Rackspace Technology (US), Progress (US), Temenos (Switzerland), Cloudflare (US), Couchbase (US), Twenty57 (Mauritius), Oursky (Hong Kong), Contentful (Germany), Pragma (Colombia), Heroku (US), brainCloud (Canada), and Addon Solutions (India).

This research report categorizes the Cloud Mobile Backend as a Service (BaaS) market based on service type, application type, platform, deployment model, organization size, vertical, and region.

Based on the Service Type:
  • Cloud Storage & Backup
  • User Authentication & Authorization
  • Database Management
  • Push Notification
  • Other Service Types
Based on the Platform:
  • iOS
  • Android
  • Other Platforms
Based on the Application Type:
  • Mobile Apps
  • Web Apps
Based on the Deployment Model:
  • Public Cloud
  • Private Cloud
  • Hybrid Cloud
Based on the Organization Size:
  • SMEs
  • Large Enterprises
Based on the Vertical:
  • BFSI
  • IT & ITeS
  • Telecommunications
  • Retail & eCommerce
  • Manufacturing
  • Healthcare & Life Sciences
  • Media & Entertainment
  • Other Verticals
Based on the Region:
  • North America
    • US
    • Canada
  • Europe
    • UK
    • Germany
    • France
    • Italy
    • Rest of Europe
  • Asia Pacific
    • China
    • Japan
    • India
    • Rest of Asia Pacific
  • Middle East & Africa
    • Gulf Cooperation Councils (GCC)
      • Kingdom of Saudi Arabia
      • United Arab Emirates
      • Rest of GCC Countries
    • South Africa
    • Rest of the Middle East & Africa
  • Latin America
    • Brazil
    • Mexico
    • Rest of Latin America

Recent Developments:

  • In October 022, Google launched the latest Firebase SDK for C++ (v11.7.0. This release includes changes to Analytics and Google Mobile Ads, a bug fix in Authentication, and other changes.
  • In November 2023, AWS announced a new capability that makes it easy to build scalable, secure GraphQL interfaces over existing relational databases with AWS Cloud Development Kit (CDK). The AWS Amplify GraphQL API CDK is constructed with the user’s database credentials stored securely in the AWS Systems Manager Parameter Store as a SecureString and starts authoring the user’s GraphQL API to execute SQL statements. This new capability works with any MySQL and PostgreSQL databases on Amazon Relational Database Service (Amazon RDS) or externally hosted MySQL and PostgreSQL databases.
  • In September 2023, Oracle announced new application development capabilities to enable developers to rapidly build and deploy applications on Oracle Cloud Infrastructure (OCI). Designed for cloud-native and Java developers, the new capabilities will help developers build highly responsive and efficient cloud-native applications while reducing costs. In addition, Oracle is building generative AI capabilities for application development to take advantage of cutting-edge large language models with the level of security and privacy that enterprises demand.

Frequently Asked Questions (FAQ):

To speak to our analyst for a discussion on the above findings, click Speak to Analyst

TABLE OF CONTENTS
 
1 INTRODUCTION (Page No. - 40)
    1.1 STUDY OBJECTIVES 
    1.2 MARKET DEFINITION 
           1.2.1 INCLUSIONS AND EXCLUSIONS
    1.3 MARKET SCOPE 
           1.3.1 MARKET SEGMENTATION
           1.3.2 REGIONS COVERED
    1.4 YEARS CONSIDERED 
    1.5 CURRENCY CONSIDERED 
           TABLE 1 USD EXCHANGE RATES, 2018–2022
    1.6 STAKEHOLDERS 
    1.7 SUMMARY OF CHANGES 
           1.7.1 RECESSION IMPACT
 
2 RESEARCH METHODOLOGY (Page No. - 46)
    2.1 RESEARCH DATA 
           FIGURE 1 CLOUD MOBILE BACKEND AS A SERVICE MARKET: RESEARCH DESIGN
           2.1.1 SECONDARY DATA
           2.1.2 PRIMARY DATA
                    2.1.2.1 Breakup of primary profiles
                    2.1.2.2 Key insights from industry experts
    2.2 MARKET SIZE ESTIMATION 
           FIGURE 2 MARKET: TOP-DOWN AND BOTTOM-UP APPROACHES
           2.2.1 TOP-DOWN APPROACH
                    FIGURE 3 APPROACH 1 (TOP-DOWN): REVENUE GENERATION FROM CLOUD MOBILE BACKEND AS A SERVICE VENDORS
           2.2.2 BOTTOM-UP APPROACH
                    FIGURE 4 APPROACH 2 (BOTTOM-UP)
                    FIGURE 5 BOTTOM-UP APPROACH (SUPPLY SIDE): COLLECTIVE REVENUE OF VENDORS
                    FIGURE 6 CAGR PROJECTIONS FROM SUPPLY SIDE
                    FIGURE 7 CLOUD MOBILE BACKEND AS A SERVICE MARKET: RESEARCH FLOW
    2.3 MARKET FORECAST 
           TABLE 2 FACTOR ANALYSIS
    2.4 DATA TRIANGULATION 
           FIGURE 8 MARKET: DATA TRIANGULATION
    2.5 IMPACT OF RECESSION ON GLOBAL MARKET 
    2.6 RESEARCH ASSUMPTIONS 
           TABLE 3 ASSUMPTIONS
    2.7 LIMITATIONS AND RISK ASSESSMENT 
           FIGURE 9 LIMITATIONS
 
3 EXECUTIVE SUMMARY (Page No. - 61)
    FIGURE 10 CLOUD MOBILE BACKEND AS A SERVICE MARKET SNAPSHOT, 2020–2028 
    FIGURE 11 MARKET: TOP SEGMENTS WITH HIGHEST CAGR DURING FORECAST PERIOD 
    FIGURE 12 NORTH AMERICA TO ACCOUNT FOR LARGEST MARKET SHARE DURING FORECAST PERIOD 
 
4 PREMIUM INSIGHTS (Page No. - 65)
    4.1 ATTRACTIVE GROWTH OPPORTUNITIES FOR KEY PLAYERS IN MARKET 
           FIGURE 13 GROWING AWARENESS ABOUT DATA SECURITY AND PRIVACY CONCERNS IN MOBILE AND WEB APPLICATIONS TO DRIVE MARKET
    4.2 CLOUD MOBILE BACKEND AS A SERVICE MARKET,  BY SERVICE TYPE 
           FIGURE 14 USER AUTHENTICATION & AUTHORIZATION SEGMENT TO ACCOUNT FOR LARGEST MARKET SHARE DURING FORECAST PERIOD
    4.3 MARKET,  BY APPLICATION TYPE 
           FIGURE 15 MOBILE APPS SEGMENT TO ACCOUNT FOR LARGER MARKET SHARE DURING FORECAST PERIOD
    4.4 MARKET, BY PLATFORM 
           FIGURE 16 ANDROID SEGMENT TO ACCOUNT FOR LARGEST MARKET SHARE DURING FORECAST PERIOD
    4.5 MARKET,  BY DEPLOYMENT MODEL 
           FIGURE 17 PUBLIC CLOUD SEGMENT TO ACCOUNT FOR LARGER MARKET SHARE DURING FORECAST PERIOD
    4.6 MARKET,  BY ORGANIZATION SIZE 
           FIGURE 18 LARGE ENTERPRISES SEGMENT TO ACCOUNT FOR LARGER MARKET SHARE DURING FORECAST PERIOD
    4.7 MARKET, BY VERTICAL 
           FIGURE 19 BFSI SEGMENT TO ACCOUNT FOR LARGEST MARKET SHARE DURING FORECAST PERIOD
    4.8 MARKET, BY REGION 
           FIGURE 20 ASIA PACIFIC TO EMERGE AS BEST MARKET FOR INVESTMENTS IN NEXT FIVE YEARS
 
5 MARKET OVERVIEW AND INDUSTRY TRENDS (Page No. - 70)
    5.1 INTRODUCTION 
    5.2 MARKET DYNAMICS 
           FIGURE 21 DRIVERS, RESTRAINTS, OPPORTUNITIES, AND CHALLENGES: CLOUD MOBILE BACKEND AS A SERVICE MARKET
           5.2.1 DRIVERS
                    5.2.1.1 Proliferation of mobile apps
                    5.2.1.2 Rising smartphone usage increasing demand for advanced mobile applications
                               FIGURE 22 GROWTH OF SMARTPHONE USERS
                    5.2.1.3 Focus on frontend development accelerating overall app development and deployment process
                    5.2.1.4 Adoption of serverless architecture
           5.2.2 RESTRAINTS
                    5.2.2.1 Higher CAPEX to adopt BaaS
                    5.2.2.2 Dependency on service providers
           5.2.3 OPPORTUNITIES
                    5.2.3.1 Mobile apps and mobile games gaining popularity
                    5.2.3.2 High growth of cloud services
                    5.2.3.3 Growing trends of big data and analytics
           5.2.4 CHALLENGES
                    5.2.4.1 Security and privacy concerns
                    5.2.4.2 Vendor lock-in hindering transition to alternative platforms or services
    5.3 CASE STUDY ANALYSIS 
           5.3.1 PROGRESS HEALTH CLOUD HELPED CANOPY ACHIEVE 70% COST SAVINGS AND DIGITAL EXPERIENCES FOR PATIENTS
           5.3.2 AIRBUS STREAMLINED DEVELOPMENT PROCESS AND CUT TIME TO MARKET BY DEPLOYING MULESOFT’S ANYPOINT STUDIO AND ANYPOINT EXCHANGE
           5.3.3 FLOWE LAUNCHED MOST ETHICAL AND INNOVATIVE MOBILE BANKING APP WITH TEMENOS
           5.3.4 EQUINOR GAS SUPPLIER BALANCED ACROSS GAS NETWORK AND APPLIED ITS B2B INTEGRATION NETWORK WITH AXWAY
           5.3.5 SIRIO RETAIL OPERATIONS LTD. REDUCED MANUAL PROCESSES AND IMPROVED DATA ACCURACY BY DEPLOYING MICROSOFT DYNAMICS 365
    5.4 ECOSYSTEM 
           FIGURE 23 CLOUD MOBILE BACKEND AS A SERVICE MARKET ECOSYSTEM
    5.5 VALUE CHAIN ANALYSIS 
           FIGURE 24 MARKET: VALUE CHAIN ANALYSIS
    5.6 PRICING ANALYSIS 
           5.6.1 AVERAGE SELLING PRICE TREND OF KEY PLAYERS, BY SOLUTION
                    TABLE 4 INDICATIVE PRICING ANALYSIS OF MARKET,  BY SOLUTION
           5.6.2 AVERAGE SELLING PRICE TREND OF KEY PLAYERS,  BY ORGANIZATION SIZE
                    TABLE 5 INDICATIVE PRICING ANALYSIS OF MARKET,  BY ORGANIZATION SIZE
    5.7 PATENT ANALYSIS 
           FIGURE 25 NUMBER OF PATENTS PUBLISHED, 2013–2023
           FIGURE 26 TOP 10 PATENT APPLICANTS (GLOBAL) IN 2023
           TABLE 6 MARKET: TOP 10 PATENT OWNERS
           TABLE 7 CLOUD MOBILE BACKEND AS A SERVICE MARKET: LIST OF PATENTS
    5.8 TECHNOLOGY ANALYSIS 
           5.8.1 KEY TECHNOLOGIES
                    5.8.1.1 Containerization and Microservices
                    5.8.1.2 Serverless Computing
                    5.8.1.3 Artificial Intelligence (AI) and Machine Learning (ML)
           5.8.2 COMPLEMENTARY TECHNOLOGIES
                    5.8.2.1 Database Technologies
                    5.8.2.2 Cloud Computing
                    5.8.2.3 API Gateways
           5.8.3 ADJACENT TECHNOLOGIES
                    5.8.3.1 5G Technology
                    5.8.3.2 Edge Computing
                    5.8.3.3 Blockchain
                    5.8.3.4 IoT
    5.9 REGULATORY LANDSCAPE 
           5.9.1 REGULATORY BODIES, GOVERNMENT AGENCIES, AND OTHER ORGANIZATIONS
                    TABLE 8 NORTH AMERICA: REGULATORY BODIES, GOVERNMENT AGENCIES, AND OTHER ORGANIZATIONS
                    TABLE 9 EUROPE: REGULATORY BODIES, GOVERNMENT AGENCIES, AND OTHER ORGANIZATIONS
                    TABLE 10 ASIA PACIFIC: REGULATORY BODIES, GOVERNMENT AGENCIES, AND OTHER ORGANIZATIONS
                    TABLE 11 REST OF THE WORLD: REGULATORY BODIES, GOVERNMENT AGENCIES, AND OTHER ORGANIZATIONS
           5.9.2 REGULATIONS, BY REGION
                    5.9.2.1 North America
                    5.9.2.2 Europe
                    5.9.2.3 Asia Pacific
                    5.9.2.4 Middle East & South Africa
                    5.9.2.5 Latin America
           5.9.3 REGULATORY IMPLICATIONS AND INDUSTRY STANDARDS
                    5.9.3.1 General Data Protection Regulation (GDPR)
                    5.9.3.2 Securities and Exchange Commission (SEC) Rule 17a-4
                    5.9.3.3 ISO/IEC 27001
                    5.9.3.4 System and Organization Controls (SOCs) 2 Type II Compliance
                    5.9.3.5 Financial Industry Regulatory Authority (FINRA)
                    5.9.3.6 Freedom of Information Act (FOIA)
                    5.9.3.7 Health Insurance Portability and Accountability Act (HIPPA)
    5.10 PORTER’S FIVE FORCES ANALYSIS 
           FIGURE 27 PORTER’S FIVE FORCES’ IMPACT ON CLOUD MOBILE BACKEND AS A SERVICE MARKET
           TABLE 12 MARKET: PORTER’S FIVE FORCES ANALYSIS
           5.10.1 THREAT OF NEW ENTRANTS
           5.10.2 THREAT OF SUBSTITUTES
           5.10.3 BARGAINING POWER OF SUPPLIERS
           5.10.4 BARGAINING POWER OF BUYERS
           5.10.5 INTENSITY OF COMPETITIVE RIVALRY
    5.11 KEY CONFERENCES & EVENTS 
                    TABLE 13 MARKET: KEY CONFERENCES AND EVENTS IN 2024–2025
    5.12 TRENDS/DISRUPTIONS IMPACTING CUSTOMERS’ BUSINESSES 
                    FIGURE 28 CLOUD MOBILE BACKEND AS A SERVICE MARKET: TRENDS/DISRUPTIONS IMPACTING CUSTOMERS’ BUSINESSES
    5.13 KEY STAKEHOLDERS & BUYING CRITERIA 
           5.13.1 KEY STAKEHOLDERS IN BUYING PROCESS
                    FIGURE 29 INFLUENCE OF STAKEHOLDERS ON BUYING PROCESS FOR TOP THREE VERTICALS
                    TABLE 14 INFLUENCE OF STAKEHOLDERS ON BUYING PROCESS FOR TOP THREE VERTICALS
           5.13.2 BUYING CRITERIA
                    FIGURE 30 KEY BUYING CRITERIA FOR TOP THREE VERTICALS
                    TABLE 15 KEY BUYING CRITERIA FOR TOP THREE VERTICALS
    5.14 BUSINESS MODEL ANALYSIS 
           5.14.1 PRICING MODEL
                    5.14.1.1 Subscription-based Model
                    5.14.1.2 Pay-as-You-Go Model
                    5.14.1.3 Freemium Model
           5.14.2 PARTNERSHIP & INTEGRATIONS
                    5.14.2.1 Strategic Partnerships
                    5.14.2.2 Third-party Integrations
                    5.14.2.3 Developer Ecosystem Support
                    5.14.2.4 Custom Integration Services
                    5.14.2.5 Open API Standards
           5.14.3 SUPPORT & TRAINING MODEL
           5.14.4 DATA SECURITY & COMPLIANCE MODEL
 
6 CLOUD MOBILE BACKEND AS A SERVICE MARKET,  BY SERVICE TYPE (Page No. - 106)
    6.1 INTRODUCTION 
           6.1.1 SERVICE TYPES: MARKET DRIVERS
                    FIGURE 31 USER AUTHENTICATION & AUTHORIZATION SEGMENT TO GROW AT HIGHEST CAGR DURING FORECAST PERIOD
                    TABLE 16 MARKET, BY SERVICE TYPE,  2019–2022 (USD MILLION)
                    TABLE 17 MARKET, BY SERVICE TYPE,  2023–2028 (USD MILLION)
    6.2 CLOUD STORAGE & BACKUP 
           6.2.1 CLOUD STORAGE & BACKUP TO OFFER SECURE AND SCALABLE OPERATIONS, COST-EFFECTIVENESS, AND REDUCTION OF DATA LOSS RISK
                    TABLE 18 CLOUD STORAGE & BACKUP: MARKET,  BY REGION, 2019–2022 (USD MILLION)
                    TABLE 19 CLOUD STORAGE & BACKUP: MARKET,  BY REGION, 2023–2028 (USD MILLION)
    6.3 USER AUTHENTICATION & AUTHORIZATION 
           6.3.1 USER AUTHENTICATION & AUTHORIZATION SERVICES TO STREAMLINE USER ONBOARDING PROCESS AND ENHANCE OVERALL APPLICATION SECURITY
                    TABLE 20 USER AUTHENTICATION & AUTHORIZATION: MARKET, BY REGION, 2019–2022 (USD MILLION)
                    TABLE 21 USER AUTHENTICATION & AUTHORIZATION: MARKET, BY REGION, 2023–2028 (USD MILLION)
    6.4 DATABASE MANAGEMENT 
           6.4.1 DATABASE MANAGEMENT TO SIMPLIFY DATABASE ADMINISTRATION, SCALE AUTOMATICALLY TO HANDLE WORKLOADS, AND INTEGRATE WITH PROGRAMMING LANGUAGES AND FRAMEWORKS
                    TABLE 22 DATABASE MANAGEMENT: Cloud Mobile Backend as a Service (BaaS) Market, BY REGION, 2019–2022 (USD MILLION)
                    TABLE 23 DATABASE MANAGEMENT: MARKET, BY REGION, 2023–2028 (USD MILLION)
    6.5 PUSH NOTIFICATIONS 
           6.5.1 PUSH NOTIFICATION SERVICES TO SEND TIMELY AND RELEVANT UPDATES, INCREASE USER ENGAGEMENT, AND DRIVE USER RETENTION
                    TABLE 24 PUSH NOTIFICATIONS: MARKET, BY REGION, 2019–2022 (USD MILLION)
                    TABLE 25 PUSH NOTIFICATIONS: MARKET, BY REGION, 2023–2028 (USD MILLION)
    6.6 OTHER SERVICE TYPES 
           TABLE 26 OTHER SERVICE TYPES: MARKET, BY REGION, 2019–2022 (USD MILLION)
           TABLE 27 OTHER SERVICE TYPES: MARKET, BY REGION, 2023–2028 (USD MILLION)
 
7 CLOUD MOBILE BACKEND AS A SERVICE MARKET, BY PLATFORM (Page No. - 114)
    7.1 INTRODUCTION 
           7.1.1 PLATFORMS: MARKET DRIVERS
                    FIGURE 32 IOS SEGMENT TO GROW AT HIGHEST CAGR DURING FORECAST PERIOD
                    TABLE 28 MARKET, BY PLATFORM,  2019–2022 (USD MILLION)
                    TABLE 29 MARKET, BY PLATFORM,  2023–2028 (USD MILLION)
    7.2 ANDROID 
           7.2.1 FLEXIBILITY TO CHOOSE CLOUD SERVICE PROVIDERS, VAST GLOBAL USER BASE, AND SEAMLESS INTEGRATION WITH DEVICES TO DRIVE MARKET
                    TABLE 30 ANDROID: Cloud Mobile Backend as a Service (BaaS) Market, BY REGION,  2019–2022 (USD MILLION)
                    TABLE 31 ANDROID: MARKET, BY REGION,  2023–2028 (USD MILLION)
    7.3 IOS 
           7.3.1 NEED FOR SEAMLESS DATA SYNCHRONIZATION ACROSS MULTIPLE APPLE DEVICES THROUGH ICLOUD AND LEVERAGING SECURITY FEATURES TO PROPEL MARKET
                    TABLE 32 IOS: MARKET, BY REGION,  2019–2022 (USD MILLION)
                    TABLE 33 IOS: MARKET, BY REGION,  2023–2028 (USD MILLION)
    7.4 OTHER PLATFORMS 
           TABLE 34 OTHER PLATFORMS: MARKET, BY REGION, 2019–2022 (USD MILLION)
           TABLE 35 OTHER PLATFORMS: MARKET, BY REGION, 2023–2028 (USD MILLION)
 
8 CLOUD MOBILE BACKEND AS A SERVICE MARKET,  BY ORGANIZATION SIZE (Page No. - 120)
    8.1 INTRODUCTION 
           8.1.1 ORGANIZATION SIZES: MARKET DRIVERS
                    FIGURE 33 LARGE ENTERPRISES SEGMENT TO ACCOUNT FOR LARGER MARKET DURING FORECAST PERIOD
                    TABLE 36 MARKET, BY ORGANIZATION SIZE,  2019–2022 (USD MILLION)
                    TABLE 37 MARKET, BY ORGANIZATION SIZE,  2023–2028 (USD MILLION)
    8.2 SMALL AND MEDIUM-SIZED ENTERPRISES 
           8.2.1 SMES TO TAILOR CLOUD SOLUTIONS FOR SEAMLESS DIGITAL TRANSFORMATION
                    TABLE 38 SMALL AND MEDIUM-SIZED ENTERPRISES: MARKET, BY REGION, 2019–2022 (USD MILLION)
                    TABLE 39 SMALL AND MEDIUM-SIZED ENTERPRISES: MARKET, BY REGION, 2023–2028 (USD MILLION)
    8.3 LARGE ENTERPRISES 
           8.3.1 LARGE ENTERPRISES TO LEVERAGE CLOUD FOR SCALABLE AND SECURE DIGITAL INNOVATION
                    TABLE 40 LARGE ENTERPRISES: MARKET, BY REGION, 2019–2022 (USD MILLION)
                    TABLE 41 LARGE ENTERPRISES: MARKET, BY REGION, 2023–2028 (USD MILLION)
 
9 CLOUD MOBILE BACKEND AS A SERVICE MARKET,  BY DEPLOYMENT MODEL (Page No. - 124)
    9.1 INTRODUCTION 
           9.1.1 DEPLOYMENT MODELS: MARKET DRIVERS
                    FIGURE 34 PUBLIC CLOUD SEGMENT TO ACCOUNT FOR LARGER MARKET DURING FORECAST PERIOD
                    TABLE 42 CLOUD MOBILE BACKEND AS A SERVICE (BAAS) MARKET, BY DEPLOYMENT MODEL,  2019–2022 (USD MILLION)
                    TABLE 43 MARKET, BY DEPLOYMENT MODEL,  2023–2028 (USD MILLION)
    9.2 PUBLIC CLOUD 
           9.2.1 PUBLIC CLOUD TO OFFER SCALABILITY, FLEXIBILITY, AND COST-EFFECTIVENESS
                    TABLE 44 PUBLIC CLOUD: MARKET, BY REGION,  2019–2022 (USD MILLION)
                    TABLE 45 PUBLIC CLOUD: MARKET, BY REGION,  2023–2028 (USD MILLION)
    9.3 PRIVATE CLOUD 
           9.3.1 PRIVATE CLOUD TO PROVIDE CONTROL OVER SERVERS, INFRASTRUCTURE, AND SYSTEMS AND TAILORED SECURITY AND COMPLIANCE
                    TABLE 46 PRIVATE CLOUD: MARKET, BY REGION,  2019–2022 (USD MILLION)
                    TABLE 47 PRIVATE CLOUD: MARKET, BY REGION,  2023–2028 (USD MILLION)
    9.4 HYBRID CLOUD 
           9.4.1 HYBRID CLOUD TO OFFER FLEXIBILITY TO LEVERAGE BENEFITS OF BOTH PUBLIC AND PRIVATE CLOUDS BASED ON SPECIFIC REQUIREMENTS
                    TABLE 48 HYBRID CLOUD: CLOUD MOBILE BACKEND AS A SERVICE (BAAS) MARKET, BY REGION,  2019–2022 (USD MILLION)
                    TABLE 49 HYBRID CLOUD: MARKET, BY REGION,  2023–2028 (USD MILLION)
 
10 CLOUD MOBILE BACKEND AS A SERVICE MARKET,  BY APPLICATION TYPE (Page No. - 129)
     10.1 INTRODUCTION 
             10.1.1 APPLICATION TYPES: MARKET DRIVERS
                       FIGURE 35 MOBILE APPS SEGMENT TO ACCOUNT FOR LARGER MARKET DURING FORECAST PERIOD
                       TABLE 50 MARKET, BY APPLICATION TYPE,  2019–2022 (USD MILLION)
                       TABLE 51 MARKET, BY APPLICATION TYPE,  2023–2028 (USD MILLION)
     10.2 MOBILE APPS 
             10.2.1 RISING DEMAND FOR FEATURE-RICH, RESPONSIVE MOBILE APPLICATIONS AND NEED FOR SCALABILITY AND FLEXIBILITY TO DRIVE MARKET
                       TABLE 52 MOBILE APPS: MARKET, BY REGION,  2019–2022 (USD MILLION)
                       TABLE 53 MOBILE APPS: MARKET, BY REGION,  2023–2028 (USD MILLION)
     10.3 WEB APPS 
             10.3.1 DEMAND FOR PLATFORMS TO PROVIDE SCALABLE AND SECURE BACKEND SERVICES TO WEB DEVELOPERS
                       TABLE 54 WEB APPS: MARKET, BY REGION,  2019–2022 (USD MILLION)
                       TABLE 55 WEB APPS: MARKET, BY REGION,  2023–2028 (USD MILLION)
 
11 CLOUD MOBILE BACKEND AS A SERVICE MARKET, BY VERTICAL (Page No. - 134)
     11.1 INTRODUCTION 
                       FIGURE 36 BFSI VERTICAL TO ACCOUNT FOR LARGEST MARKET DURING FORECAST PERIOD
             11.1.1 VERTICALS: MARKET DRIVERS
                       TABLE 56 MARKET, BY VERTICAL,  2019–2022 (USD MILLION)
                       TABLE 57 MARKET, BY VERTICAL,  2023–2028 (USD MILLION)
     11.2 BANKING, FINANCIAL SERVICES, AND INSURANCE (BFSI) 
                       TABLE 58 BFSI: MARKET, BY REGION,  2019–2022 (USD MILLION)
                       TABLE 59 BFSI: MARKET, BY REGION,  2023–2028 (USD MILLION)
             11.2.1 BFSI: APPLICATION AREAS
                       11.2.1.1 Security & Compliance
                       11.2.1.2 Application Development
                       11.2.1.3 Load Management
                       11.2.1.4 Other BFSI Application Areas
     11.3 TELECOMMUNICATIONS 
               TABLE 60 TELECOMMUNICATIONS: CLOUD MOBILE BACKEND AS A SERVICE MARKET, BY REGION, 2019–2022 (USD MILLION)
               TABLE 61 TELECOMMUNICATIONS: MARKET, BY REGION,  2023–2028 (USD MILLION)
             11.3.1 TELECOMMUNICATIONS: APPLICATION AREAS
                       11.3.1.1 Mobile Network Management
                       11.3.1.2 Communication Apps
                       11.3.1.3 Mobile Data Analytics
                       11.3.1.4 Other Telecommunication Application Areas
     11.4 IT & ITES 
               TABLE 62 IT & ITES: MARKET, BY REGION,  2019–2022 (USD MILLION)
               TABLE 63 IT & ITES: MARKET, BY REGION,  2023–2028 (USD MILLION)
             11.4.1 IT & ITES: APPLICATION AREAS
                       11.4.1.1 Prototyping & Iteration
                       11.4.1.2 Resource Management
                       11.4.1.3 Cross-platform Development
                       11.4.1.4 Other IT & ITeS Application Areas
     11.5 RETAIL & CONSUMER GOODS 
               TABLE 64 RETAIL & CONSUMER GOODS: MARKET,  BY REGION, 2019–2022 (USD MILLION)
               TABLE 65 RETAIL & CONSUMER GOODS: MARKET,  BY REGION, 2023–2028 (USD MILLION)
             11.5.1 RETAIL & CONSUMER GOODS: APPLICATION AREAS
                       11.5.1.1 Mobile Shopping
                       11.5.1.2 Customer Experience
                       11.5.1.3 Inventory Management
                       11.5.1.4 Other Retail & Consumer Goods Application Areas
     11.6 MANUFACTURING 
               TABLE 66 MANUFACTURING: CLOUD MOBILE BACKEND AS A SERVICE MARKET, BY REGION,  2019–2022 (USD MILLION)
               TABLE 67 MANUFACTURING: MARKET, BY REGION,  2023–2028 (USD MILLION)
             11.6.1 MANUFACTURING: APPLICATION AREAS
                       11.6.1.1 Supply Chain Management
                       11.6.1.2 Field Service Applications
                       11.6.1.3 Asset Tracking
                       11.6.1.4 Other Manufacturing Application Areas
     11.7 MEDIA & ENTERTAINMENT 
               TABLE 68 MEDIA & ENTERTAINMENT: MARKET,  BY REGION, 2019–2022 (USD MILLION)
               TABLE 69 MEDIA & ENTERTAINMENT: MARKET,  BY REGION, 2023–2028 (USD MILLION)
             11.7.1 MEDIA & ENTERTAINMENT: APPLICATION AREAS
                       11.7.1.1 User Engagement
                       11.7.1.2 Content Delivery
                       11.7.1.3 Interactive Gaming
                       11.7.1.4 Other Media & Entertainment Application Areas
     11.8 HEALTHCARE & LIFE SCIENCES 
               TABLE 70 HEALTHCARE & LIFE SCIENCES: MARKET,  BY REGION, 2019–2022 (USD MILLION)
               TABLE 71 HEALTHCARE & LIFE SCIENCES: MARKET,  BY REGION, 2023–2028 (USD MILLION)
             11.8.1 HEALTHCARE & LIFE SCIENCES: APPLICATION AREAS
                       11.8.1.1 Patient Data Management
                       11.8.1.2 Telemedicine Solutions
                       11.8.1.3 Clinical Trials
                       11.8.1.4 Other Healthcare & Life Science Application Areas
     11.9 OTHER VERTICALS 
               TABLE 72 OTHER VERTICALS: MARKET, BY REGION,  2019–2022 (USD MILLION)
               TABLE 73 OTHER VERTICALS: MARKET, BY REGION,  2023–2028 (USD MILLION)
 
12 CLOUD MOBILE BACKEND AS A SERVICE MARKET, BY REGION (Page No. - 150)
     12.1 INTRODUCTION 
               FIGURE 37 NORTH AMERICA TO ACCOUNT FOR LARGEST MARKET DURING FORECAST PERIOD
               TABLE 74 MARKET, BY REGION,  2019–2022 (USD MILLION)
               TABLE 75 MARKET, BY REGION,  2023–2028 (USD MILLION)
     12.2 NORTH AMERICA 
             12.2.1 NORTH AMERICA: MARKET DRIVERS
             12.2.2 NORTH AMERICA: RECESSION IMPACT
                       FIGURE 38 NORTH AMERICA: MARKET SNAPSHOT
                       TABLE 76 NORTH AMERICA: MARKET, BY SERVICE TYPE, 2019–2022 (USD MILLION)
                       TABLE 77 NORTH AMERICA: CLOUD MOBILE BACKEND AS A SERVICE MARKET, BY SERVICE TYPE, 2023–2028 (USD MILLION)
                       TABLE 78 NORTH AMERICA: MARKET, BY PLATFORM, 2019–2022 (USD MILLION)
                       TABLE 79 NORTH AMERICA: MARKET, BY PLATFORM, 2023–2028 (USD MILLION)
                       TABLE 80 NORTH AMERICA: MARKET, BY APPLICATION TYPE, 2019–2022 (USD MILLION)
                       TABLE 81 NORTH AMERICA: MARKET, BY APPLICATION TYPE, 2023–2028 (USD MILLION)
                       TABLE 82 NORTH AMERICA: MARKET, BY DEPLOYMENT MODEL, 2019–2022 (USD MILLION)
                       TABLE 83 NORTH AMERICA: MARKET, BY DEPLOYMENT MODEL, 2023–2028 (USD MILLION)
                       TABLE 84 NORTH AMERICA: MARKET, BY ORGANIZATION SIZE, 2019–2022 (USD MILLION)
                       TABLE 85 NORTH AMERICA: MARKET, BY ORGANIZATION SIZE, 2023–2028 (USD MILLION)
                       TABLE 86 NORTH AMERICA: MARKET, BY VERTICAL,  2019–2022 (USD MILLION)
                       TABLE 87 NORTH AMERICA: MARKET, BY VERTICAL,  2023–2028 (USD MILLION)
                       TABLE 88 NORTH AMERICA: MARKET, BY COUNTRY,  2019–2022 (USD MILLION)
                       TABLE 89 NORTH AMERICA: MARKET, BY COUNTRY,  2023–2028 (USD MILLION)
             12.2.3 US
                       12.2.3.1 Need to efficiently manage user authentication and real-time data synchronization and ensure robustness of mobile applications to drive market
                                   TABLE 90 US: CLOUD MOBILE BACKEND AS A SERVICE MARKET, BY PLATFORM,  2019–2022 (USD MILLION)
                                   TABLE 91 US: MARKET, BY PLATFORM,  2023–2028 (USD MILLION)
                                   TABLE 92 US: MARKET, BY ORGANIZATION SIZE,  2019–2022 (USD MILLION)
                                   TABLE 93 US: MARKET, BY ORGANIZATION SIZE,  2023–2028 (USD MILLION)
             12.2.4 CANADA
                       12.2.4.1 Increasing importance of data security, privacy, and regulatory compliance and advent of digital economy powered by IoT to propel market
                                   TABLE 94 CANADA: MARKET, BY PLATFORM,  2019–2022 (USD MILLION)
                                   TABLE 95 CANADA: MARKET, BY PLATFORM,  2023–2028 (USD MILLION)
                                   TABLE 96 CANADA: MARKET, BY ORGANIZATION SIZE, 2019–2022 (USD MILLION)
                                   TABLE 97 CANADA: MARKET, BY ORGANIZATION SIZE, 2023–2028 (USD MILLION)
     12.3 EUROPE 
             12.3.1 EUROPE: MARKET DRIVERS
             12.3.2 EUROPE: RECESSION IMPACT
                       TABLE 98 EUROPE: CLOUD MOBILE BACKEND AS A SERVICE MARKET, BY SERVICE TYPE,  2019–2022 (USD MILLION)
                       TABLE 99 EUROPE: MARKET, BY SERVICE TYPE,  2023–2028 (USD MILLION)
                       TABLE 100 EUROPE: MARKET, BY PLATFORM,  2019–2022 (USD MILLION)
                       TABLE 101 EUROPE: MARKET, BY PLATFORM,  2023–2028 (USD MILLION)
                       TABLE 102 EUROPE: MARKET, BY APPLICATION TYPE, 2019–2022 (USD MILLION)
                       TABLE 103 EUROPE: MARKET, BY APPLICATION TYPE, 2023–2028 (USD MILLION)
                       TABLE 104 EUROPE: MARKET, BY DEPLOYMENT MODEL, 2019–2022 (USD MILLION)
                       TABLE 105 EUROPE: MARKET, BY DEPLOYMENT MODEL, 2023–2028 (USD MILLION)
                       TABLE 106 EUROPE: MARKET, BY ORGANIZATION SIZE, 2019–2022 (USD MILLION)
                       TABLE 107 EUROPE: MARKET, BY ORGANIZATION SIZE, 2023–2028 (USD MILLION)
                       TABLE 108 EUROPE: MARKET, BY VERTICAL,  2019–2022 (USD MILLION)
                       TABLE 109 EUROPE: MARKET, BY VERTICAL,  2023–2028 (USD MILLION)
                       TABLE 110 EUROPE: MARKET, BY COUNTRY,  2019–2022 (USD MILLION)
                       TABLE 111 EUROPE: MARKET, BY COUNTRY,  2023–2028 (USD MILLION)
             12.3.3 UK
                       12.3.3.1 MBaaS to help build feature-rich and scalable mobile applications efficiently by leveraging cloud-based infrastructure
                                   TABLE 112 UK: CLOUD MOBILE BACKEND AS A SERVICE MARKET, BY PLATFORM,  2019–2022 (USD MILLION)
                                   TABLE 113 UK: MARKET, BY PLATFORM,  2023–2028 (USD MILLION)
                                   TABLE 114 UK: MARKET, BY ORGANIZATION SIZE,  2019–2022 (USD MILLION)
                                   TABLE 115 UK: MARKET, BY ORGANIZATION SIZE,  2023–2028 (USD MILLION)
             12.3.4 GERMANY
                       12.3.4.1 Cloud MBaaS platforms to provide essential tools and infrastructure to swiftly build, scale, and secure mobile apps
                                   TABLE 116 GERMANY: MARKET, BY PLATFORM,  2019–2022 (USD MILLION)
                                   TABLE 117 GERMANY: MARKET, BY PLATFORM,  2023–2028 (USD MILLION)
                                   TABLE 118 GERMANY: MARKET, BY ORGANIZATION SIZE, 2019–2022 (USD MILLION)
                                   TABLE 119 GERMANY: MARKET, BY ORGANIZATION SIZE, 2023–2028 (USD MILLION)
             12.3.5 FRANCE
                       12.3.5.1 MBaaS to offer various deployment models to cater to specific needs and preferences of businesses and developers
                                   TABLE 120 FRANCE: MARKET, BY PLATFORM,  2019–2022 (USD MILLION)
                                   TABLE 121 FRANCE: MARKET, BY PLATFORM,  2023–2028 (USD MILLION)
                                   TABLE 122 FRANCE: MARKET, BY ORGANIZATION SIZE, 2019–2022 (USD MILLION)
                                   TABLE 123 FRANCE: MARKET, BY ORGANIZATION SIZE, 2023–2028 (USD MILLION)
             12.3.6 ITALY
                       12.3.6.1 MBaaS to integrate IT services from various providers to help design, implement, and maintain efficient ecosystems
                                   TABLE 124 ITALY: MARKET, BY PLATFORM,  2019–2022 (USD MILLION)
                                   TABLE 125 ITALY: MARKET, BY PLATFORM,  2023–2028 (USD MILLION)
                                   TABLE 126 ITALY: MARKET, BY ORGANIZATION SIZE,  2019–2022 (USD MILLION)
                                   TABLE 127 ITALY: MARKET, BY ORGANIZATION SIZE,  2023–2028 (USD MILLION)
             12.3.7 REST OF EUROPE
                       TABLE 128 REST OF EUROPE: MARKET, BY PLATFORM, 2019–2022 (USD MILLION)
                       TABLE 129 REST OF EUROPE: MARKET, BY PLATFORM, 2023–2028 (USD MILLION)
                       TABLE 130 REST OF EUROPE: MARKET, BY ORGANIZATION SIZE, 2019–2022 (USD MILLION)
                       TABLE 131 REST OF EUROPE: MARKET, BY ORGANIZATION SIZE, 2023–2028 (USD MILLION)
     12.4 ASIA PACIFIC 
             12.4.1 ASIA PACIFIC: MARKET DRIVERS
             12.4.2 ASIA PACIFIC: RECESSION IMPACT
                       FIGURE 39 ASIA PACIFIC: REGIONAL SNAPSHOT
                       TABLE 132 ASIA PACIFIC: CLOUD MOBILE BACKEND AS A SERVICE MARKET, BY SERVICE TYPE, 2019–2022 (USD MILLION)
                       TABLE 133 ASIA PACIFIC: MARKET, BY SERVICE TYPE, 2023–2028 (USD MILLION)
                       TABLE 134 ASIA PACIFIC: MARKET, BY PLATFORM,  2019–2022 (USD MILLION)
                       TABLE 135 ASIA PACIFIC: MARKET, BY PLATFORM,  2023–2028 (USD MILLION)
                       TABLE 136 ASIA PACIFIC: MARKET, BY APPLICATION TYPE, 2019–2022 (USD MILLION)
                       TABLE 137 ASIA PACIFIC: MARKET, BY APPLICATION TYPE, 2023–2028 (USD MILLION)
                       TABLE 138 ASIA PACIFIC: MARKET, BY DEPLOYMENT MODEL, 2019–2022 (USD MILLION)
                       TABLE 139 ASIA PACIFIC: MARKET, BY DEPLOYMENT MODEL, 2023–2028 (USD MILLION)
                       TABLE 140 ASIA PACIFIC: MARKET, BY ORGANIZATION SIZE, 2019–2022 (USD MILLION)
                       TABLE 141 ASIA PACIFIC: MARKET, BY ORGANIZATION SIZE, 2023–2028 (USD MILLION)
                       TABLE 142 ASIA PACIFIC: MARKET, BY VERTICAL,  2019–2022 (USD MILLION)
                       TABLE 143 ASIA PACIFIC: MARKET, BY VERTICAL,  2023–2028 (USD MILLION)
                       TABLE 144 ASIA PACIFIC: MARKET, BY COUNTRY,  2019–2022 (USD MILLION)
                       TABLE 145 ASIA PACIFIC: MARKET, BY COUNTRY,  2023–2028 (USD MILLION)
             12.4.3 CHINA
                       12.4.3.1 Presence of major cloud providers and focus on creating innovative mobile and web applications to drive market
                                   TABLE 146 CHINA: CLOUD MOBILE BACKEND AS A SERVICE MARKET, BY PLATFORM,  2019–2022 (USD MILLION)
                                   TABLE 147 CHINA: MARKET, BY PLATFORM,  2023–2028 (USD MILLION)
                                   TABLE 148 CHINA: MARKET, BY ORGANIZATION SIZE, 2019–2022 (USD MILLION)
                                   TABLE 149 CHINA: MARKET, BY ORGANIZATION SIZE, 2023–2028 (USD MILLION)
             12.4.4 JAPAN
                       12.4.4.1 Establishment of AI Technology Strategy Council, strong organic growth capabilities, and investment from leading companies to propel market
                                   TABLE 150 JAPAN: MARKET, BY PLATFORM,  2019–2022 (USD MILLION)
                                   TABLE 151 JAPAN: MARKET, BY PLATFORM,  2023–2028 (USD MILLION)
                                   TABLE 152 JAPAN: MARKET, BY ORGANIZATION SIZE, 2019–2022 (USD MILLION)
                                   TABLE 153 JAPAN: MARKET, BY ORGANIZATION SIZE, 2023–2028 (USD MILLION)
             12.4.5 INDIA
                       12.4.5.1 Rising adoption of AI, developing IT infrastructure, and government’s AI-friendly initiatives to drive market
                                   TABLE 154 INDIA: MARKET, BY PLATFORM,  2019–2022 (USD MILLION)
                                   TABLE 155 INDIA: MARKET, BY PLATFORM,  2023–2028 (USD MILLION)
                                   TABLE 156 INDIA: MARKET, BY ORGANIZATION SIZE,  2019–2022 (USD MILLION)
                                   TABLE 157 INDIA: MARKET, BY ORGANIZATION SIZE,  2023–2028 (USD MILLION)
             12.4.6 REST OF ASIA PACIFIC
                                   TABLE 158 REST OF ASIA PACIFIC: MARKET, BY PLATFORM, 2019–2022 (USD MILLION)
                                   TABLE 159 REST OF ASIA PACIFIC: MARKET, BY PLATFORM, 2023–2028 (USD MILLION)
                                   TABLE 160 REST OF ASIA PACIFIC: MARKET,  BY ORGANIZATION SIZE, 2019–2022 (USD MILLION)
                                   TABLE 161 REST OF ASIA PACIFIC: MARKET,  BY ORGANIZATION SIZE, 2023–2028 (USD MILLION)
     12.5 MIDDLE EAST & AFRICA 
             12.5.1 MIDDLE EAST & AFRICA: MARKET DRIVERS
             12.5.2 MIDDLE EAST & AFRICA: RECESSION IMPACT
                       TABLE 162 MIDDLE EAST & AFRICA: CLOUD MOBILE BACKEND AS A SERVICE MARKET, BY SERVICE TYPE, 2019–2022 (USD MILLION)
                       TABLE 163 MIDDLE EAST & AFRICA: MARKET, BY SERVICE TYPE, 2023–2028 (USD MILLION)
                       TABLE 164 MIDDLE EAST & AFRICA: MARKET,  BY PLATFORM, 2019–2022 (USD MILLION)
                       TABLE 165 MIDDLE EAST & AFRICA: MARKET,  BY PLATFORM, 2023–2028 (USD MILLION)
                       TABLE 166 MIDDLE EAST & AFRICA: MARKET,  BY APPLICATION TYPE, 2019–2022 (USD MILLION)
                       TABLE 167 MIDDLE EAST & AFRICA: MARKET,  BY APPLICATION TYPE, 2023–2028 (USD MILLION)
                       TABLE 168 MIDDLE EAST & AFRICA: MARKET,  BY DEPLOYMENT MODEL, 2019–2022 (USD MILLION)
                       TABLE 169 MIDDLE EAST & AFRICA: MARKET,  BY DEPLOYMENT MODEL, 2023–2028 (USD MILLION)
                       TABLE 170 MIDDLE EAST & AFRICA: MARKET,  BY ORGANIZATION SIZE, 2019–2022 (USD MILLION)
                       TABLE 171 MIDDLE EAST & AFRICA: MARKET,  BY ORGANIZATION SIZE, 2023–2028 (USD MILLION)
                       TABLE 172 MIDDLE EAST & AFRICA: MARKET, BY VERTICAL, 2019–2022 (USD MILLION)
                       TABLE 173 MIDDLE EAST & AFRICA: MARKET, BY VERTICAL, 2023–2028 (USD MILLION)
                       TABLE 174 MIDDLE EAST & AFRICA: MARKET,  BY COUNTRY/REGION, 2019–2022 (USD MILLION)
                       TABLE 175 MIDDLE EAST & AFRICA: MARKET,  BY COUNTRY/REGION, 2023–2028 (USD MILLION)
             12.5.3 GCC COUNTRIES
                       12.5.3.1 MBaaS to enhance service quality, reduce costs, and ensure compliance with local regulations in GCC countries
                                   TABLE 176 GCC COUNTRIES: CLOUD MOBILE BACKEND AS A SERVICE MARKET, BY COUNTRY,  2019–2022 (USD MILLION)
                                   TABLE 177 GCC COUNTRIES: MARKET, BY COUNTRY,  2023–2028 (USD MILLION)
                                   TABLE 178 GCC COUNTRIES: MARKET, BY PLATFORM, 2019–2022 (USD MILLION)
                                   TABLE 179 GCC COUNTRIES: MARKET, BY PLATFORM, 2023–2028 (USD MILLION)
                                   TABLE 180 GCC COUNTRIES: MARKET, BY ORGANIZATION SIZE, 2019–2022 (USD MILLION)
                                   TABLE 181 GCC COUNTRIES: MARKET, BY ORGANIZATION SIZE, 2023–2028 (USD MILLION)
                       12.5.3.2 KSA
                       12.5.3.3 UAE
                       12.5.3.4 Rest of GCC Countries
             12.5.4 SOUTH AFRICA
                       12.5.4.1 Need for investments in analytical capabilities and integration to drive demand for MBaaS
                                   TABLE 182 SOUTH AFRICA: MARKET, BY PLATFORM,  2019–2022 (USD MILLION)
                                   TABLE 183 SOUTH AFRICA: MARKET, BY PLATFORM,  2023–2028 (USD MILLION)
                                   TABLE 184 SOUTH AFRICA: MARKET, BY ORGANIZATION SIZE, 2019–2022 (USD MILLION)
                                   TABLE 185 SOUTH AFRICA: MARKET, BY ORGANIZATION SIZE, 2023–2028 (USD MILLION)
             12.5.5 REST OF MIDDLE EAST & AFRICA
                                   TABLE 186 REST OF MIDDLE EAST & AFRICA: MARKET,  BY PLATFORM, 2019–2022 (USD MILLION)
                                   TABLE 187 REST OF MIDDLE EAST & AFRICA: MARKET,  BY PLATFORM, 2023–2028 (USD MILLION)
                                   TABLE 188 REST OF MIDDLE EAST & AFRICA: MARKET,  BY ORGANIZATION SIZE, 2019–2022 (USD MILLION)
                                   TABLE 189 REST OF MIDDLE EAST & AFRICA: MARKET,  BY ORGANIZATION SIZE, 2023–2028 (USD MILLION)
     12.6 LATIN AMERICA 
             12.6.1 LATIN AMERICA: MARKET DRIVERS
             12.6.2 LATIN AMERICA: RECESSION IMPACT
                       TABLE 190 LATIN AMERICA: CLOUD MOBILE BACKEND AS A SERVICE MARKET, BY SERVICE TYPE, 2019–2022 (USD MILLION)
                       TABLE 191 LATIN AMERICA: MARKET, BY SERVICE TYPE, 2023–2028 (USD MILLION)
                       TABLE 192 LATIN AMERICA: MARKET, BY PLATFORM,  2019–2022 (USD MILLION)
                       TABLE 193 LATIN AMERICA: MARKET, BY PLATFORM,  2023–2028 (USD MILLION)
                       TABLE 194 LATIN AMERICA: MARKET, BY APPLICATION TYPE, 2019–2022 (USD MILLION)
                       TABLE 195 LATIN AMERICA: MARKET, BY APPLICATION TYPE, 2023–2028 (USD MILLION)
                       TABLE 196 LATIN AMERICA: MARKET, BY DEPLOYMENT MODEL, 2019–2022 (USD MILLION)
                       TABLE 197 LATIN AMERICA: MARKET, BY DEPLOYMENT MODEL, 2023–2028 (USD MILLION)
                       TABLE 198 LATIN AMERICA: MARKET, BY ORGANIZATION SIZE, 2019–2022 (USD MILLION)
                       TABLE 199 LATIN AMERICA: MARKET, BY ORGANIZATION SIZE, 2023–2028 (USD MILLION)
                       TABLE 200 LATIN AMERICA: MARKET, BY VERTICAL, 2019–2022 (USD MILLION)
                       TABLE 201 LATIN AMERICA: MARKET, BY VERTICAL,  2023–2028 (USD MILLION)
                       TABLE 202 LATIN AMERICA: MARKET, BY COUNTRY,  2019–2022 (USD MILLION)
                       TABLE 203 LATIN AMERICA: MARKET, BY COUNTRY,  2023–2028 (USD MILLION)
             12.6.3 BRAZIL
                       12.6.3.1 Organizations to adopt big data analytics solutions to improve processes and productivity
                                   TABLE 204 BRAZIL: CLOUD MOBILE BACKEND AS A SERVICE MARKET, BY PLATFORM,  2019–2022 (USD MILLION)
                                   TABLE 205 BRAZIL: MARKET, BY PLATFORM,  2023–2028 (USD MILLION)
                                   TABLE 206 BRAZIL: MARKET, BY ORGANIZATION SIZE, 2019–2022 (USD MILLION)
                                   TABLE 207 BRAZIL: MARKET, BY ORGANIZATION SIZE, 2023–2028 (USD MILLION)
             12.6.4 MEXICO
                       12.6.4.1 Rising demand for cloud analytics, promising internet and IT services industry, and government investments to drive market
                                   TABLE 208 MEXICO: MARKET, BY PLATFORM,  2019–2022 (USD MILLION)
                                   TABLE 209 MEXICO: MARKET, BY PLATFORM,  2023–2028 (USD MILLION)
                                   TABLE 210 MEXICO: MARKET, BY ORGANIZATION SIZE, 2019–2022 (USD MILLION)
                                   TABLE 211 MEXICO: MARKET, BY ORGANIZATION SIZE, 2023–2028 (USD MILLION)
             12.6.5 REST OF LATIN AMERICA
                       TABLE 212 REST OF LATIN AMERICA: MARKET,  BY PLATFORM, 2019–2022 (USD MILLION)
                       TABLE 213 REST OF LATIN AMERICA: MARKET,  BY PLATFORM, 2023–2028 (USD MILLION)
                       TABLE 214 REST OF LATIN AMERICA: MARKET,  BY ORGANIZATION SIZE, 2019–2022 (USD MILLION)
                       TABLE 215 REST OF LATIN AMERICA: MARKET,  BY ORGANIZATION SIZE, 2023–2028 (USD MILLION)
 
13 COMPETITIVE LANDSCAPE (Page No. - 210)
     13.1 INTRODUCTION 
     13.2 KEY PLAYER STRATEGIES/RIGHT TO WIN 
               TABLE 216 OVERVIEW OF STRATEGIES ADOPTED BY KEY VENDORS
     13.3 MARKET SHARE ANALYSIS 
               TABLE 217 CLOUD MOBILE BACKEND AS A SERVICE MARKET: DEGREE OF COMPETITION (CONSOLIDATED)
               FIGURE 40 MARKET: MARKET SHARE ANALYSIS
     13.4 VENDOR PRODUCTS/BRAND COMPARISON 
               TABLE 218 VENDOR PRODUCTS/BRAND COMPARISON
     13.5 REVENUE ANALYSIS 
               FIGURE 41 HISTORICAL REVENUE ANALYSIS, 2018–2022 (USD MILLION)
     13.6 COMPANY EVALUATION MATRIX FOR KEY PLAYERS 
               FIGURE 42 COMPANY EVALUATION MATRIX FOR KEY PLAYERS: CRITERIA WEIGHTAGE, 2023
             13.6.1 STARS
             13.6.2 EMERGING LEADERS
             13.6.3 PERVASIVE PLAYERS
             13.6.4 PARTICIPANTS
                       FIGURE 43 CLOUD MOBILE BACKEND AS A SERVICE MARKET: COMPANY EVALUATION MATRIX, 2023
             13.6.5 OVERALL COMPANY FOOTPRINT OF KEY PLAYERS
                       TABLE 219 OVERALL COMPANY FOOTPRINT
     13.7 COMPANY EVALUATION MATRIX FOR START-UPS/SMES 
               FIGURE 44 COMPANY EVALUATION MATRIX FOR START-UPS/SMES: CRITERIA WEIGHTAGE, 2023
             13.7.1 RESPONSIVE COMPANIES
             13.7.2 PROGRESSIVE COMPANIES
             13.7.3 DYNAMIC COMPANIES
             13.7.4 STARTING BLOCKS
                       FIGURE 45 MARKET: COMPANY EVALUATION MATRIX FOR START-UPS/SMES, 2023
                       TABLE 220 OVERALL COMPANY FOOTPRINT FOR START-UPS/SMES
             13.7.5 COMPETITIVE BENCHMARKING
                       TABLE 221 MARKET: DETAILED LIST OF KEY START-UPS/SMES
     13.8 COMPANY FINANCIAL METRICS 
                       FIGURE 46 MARKET: COMPANY FINANCIAL METRICS, 2023
     13.9 COMPETITIVE SCENARIO AND TRENDS 
             13.9.1 PRODUCT LAUNCHES
                       TABLE 222 MARKET: PRODUCT LAUNCHES,  MARCH 2021–JANUARY 2024
             13.9.2 DEALS
                       TABLE 223 CLOUD MOBILE BACKEND AS A SERVICE MARKET: DEALS, JANUARY 2021–JANUARY 2024
 
14 COMPANY PROFILES (Page No. - 241)
     14.1 INTRODUCTION 
     14.2 MAJOR PLAYERS 
(Business overview, Products /Solutions/Services offered, Recent developments, MnM view, Right to win, Strategic choices made, and Weaknesses and Competitive threats)*
             14.2.1 AWS
                       TABLE 224 AWS: COMPANY OVERVIEW
                       FIGURE 47 AWS: COMPANY SNAPSHOT
                       TABLE 225 AWS: PRODUCTS/SOLUTIONS/SERVICES OFFERED
                       TABLE 226 AWS: PRODUCT LAUNCHES & ENHANCEMENTS
                       TABLE 227 AWS: DEALS
             14.2.2 MICROSOFT
                       TABLE 228 MICROSOFT: COMPANY OVERVIEW
                       FIGURE 48 MICROSOFT: COMPANY SNAPSHOT
                       TABLE 229 MICROSOFT: PRODUCTS/SOLUTIONS/SERVICES OFFERED
                       TABLE 230 MICROSOFT: PRODUCT LAUNCHES & ENHANCEMENTS
                       TABLE 231 MICROSOFT: DEALS
             14.2.3 GOOGLE
                       TABLE 232 GOOGLE: COMPANY OVERVIEW
                       FIGURE 49 GOOGLE: COMPANY SNAPSHOT
                       TABLE 233 GOOGLE: PRODUCTS/SOLUTIONS/SERVICES OFFERED
                       TABLE 234 GOOGLE: PRODUCT LAUNCHES & ENHANCEMENTS
                       TABLE 235 GOOGLE: DEALS
             14.2.4 ORACLE
                       TABLE 236 ORACLE: COMPANY OVERVIEW
                       FIGURE 50 ORACLE: COMPANY SNAPSHOT
                       TABLE 237 ORACLE: PRODUCTS/SOLUTIONS/SERVICES OFFERED
                       TABLE 238 ORACLE: PRODUCT LAUNCHES & ENHANCEMENTS
                       TABLE 239 ORACLE: DEALS
             14.2.5 MONGODB
                       TABLE 240 MONGODB: COMPANY OVERVIEW
                       FIGURE 51 MONGODB: COMPANY SNAPSHOT
                       TABLE 241 MONGODB: PRODUCTS/SOLUTIONS/SERVICES OFFERED
                       TABLE 242 MONGODB: PRODUCT LAUNCHES & ENHANCEMENTS
                       TABLE 243 MONGODB: DEALS
             14.2.6 IBM
                       TABLE 244 IBM: COMPANY OVERVIEW
                       FIGURE 52 IBM: COMPANY SNAPSHOT
                       TABLE 245 IBM: PRODUCTS/SOLUTIONS/SERVICES OFFERED
                       TABLE 246 IBM: PRODUCT LAUNCHES & ENHANCEMENTS
                       TABLE 247 IBM: DEALS
             14.2.7 RACKSPACE TECHNOLOGY
                       TABLE 248 RACKSPACE TECHNOLOGY: COMPANY OVERVIEW
                       FIGURE 53 RACKSPACE TECHNOLOGY: COMPANY SNAPSHOT
                       TABLE 249 RACKSPACE TECHNOLOGY: PRODUCTS/SOLUTIONS/SERVICES OFFERED
                       TABLE 250 RACKSPACE TECHNOLOGY: PRODUCT LAUNCHES & ENHANCEMENTS
                       TABLE 251 RACKSPACE TECHNOLOGY: DEALS
             14.2.8 PROGRESS SOFTWARE
                       TABLE 252 PROGRESS SOFTWARE: COMPANY OVERVIEW
                       FIGURE 54 PROGRESS SOFTWARE: COMPANY SNAPSHOT
                       TABLE 253 PROGRESS SOFTWARE: PRODUCTS/SOLUTIONS/SERVICES OFFERED
                       TABLE 254 PROGRESS SOFTWARE: PRODUCT LAUNCHES & ENHANCEMENTS
                       TABLE 255 PROGRESS SOFTWARE: DEALS
             14.2.9 TEMENOS
                       TABLE 256 TEMENOS: COMPANY OVERVIEW
                       FIGURE 55 TEMENOS: COMPANY SNAPSHOT
                       TABLE 257 TEMENOS: PRODUCTS/SOLUTIONS/SERVICES OFFERED
                       TABLE 258 TEMENOS: DEALS
             14.2.10 CLOUDFLARE
                       TABLE 259 CLOUDFLARE: COMPANY OVERVIEW
                       FIGURE 56 CLOUDFLARE: COMPANY SNAPSHOT
                       TABLE 260 CLOUDFLARE: PRODUCTS/SOLUTIONS/SERVICES OFFERED
                       TABLE 261 CLOUDFLARE: PRODUCT LAUNCHES & ENHANCEMENTS
                       TABLE 262 CLOUDFLARE: DEALS
     14.3 OTHER PLAYERS 
             14.3.1 COUCHBASE
             14.3.2 TWENTY57
             14.3.3 OURSKY LIMITED
             14.3.4 CONTENTFUL
             14.3.5 PRAGMA
             14.3.6 HEROKU
             14.3.7 BRAINCLOUD
             14.3.8 ADDON SOLUTIONS
     14.4 START-UPS/SMES 
             14.4.1 APPMASTER
             14.4.2 KII CORPORATION
             14.4.3 APPERY.IO
             14.4.4 MULTIQOS
             14.4.5 SUPABASE
             14.4.6 APPWRITE
             14.4.7 PARSE, INC.
             14.4.8 8BASE
             14.4.9 BACK4APP
             14.4.10 BACKENDLESS
             14.4.11 KUZZLE
             14.4.12 PUBNUB
             14.4.13 HASURA
*Details on Business overview, Products /Solutions/Services offered, Recent developments, Product launches, MnM view, Right to win, Strategic choices made, and Weaknesses and Competitive threats might not be captured in case of unlisted companies.
 
15 ADJACENT/RELATED MARKETS (Page No. - 315)
     15.1 INTRODUCTION 
             15.1.1 ADJACENT/RELATED MARKETS
             15.1.2 LIMITATIONS
     15.2 APP ANALYTICS MARKET 
               TABLE 263 APP ANALYTICS MARKET, BY TYPE, 2017–2022 (USD MILLION)
               TABLE 264 APP ANALYTICS MARKET, BY TYPE, 2023–2028 (USD MILLION)
               TABLE 265 MOBILE APPS: APP ANALYTICS MARKET, BY REGION, 2017–2022 (USD MILLION)
               TABLE 266 MOBILE APPS: APP ANALYTICS MARKET, BY REGION, 2023–2028 (USD MILLION)
               TABLE 267 WEB APPS: APP ANALYTICS MARKET, BY REGION, 2017–2022 (USD MILLION)
               TABLE 268 WEB APPS: APP ANALYTICS MARKET, BY REGION, 2023–2028 (USD MILLION)
     15.3 MOBILE APPS & WEB ANALYTICS MARKET 
               TABLE 269 MOBILE APPS & WEB ANALYTICS MARKET, BY DEPLOYMENT MODE,  2016–2021 (USD MILLION)
               TABLE 270 MOBILE APPS & WEB ANALYTICS MARKET, BY DEPLOYMENT MODE,  2022–2027 (USD MILLION)
               TABLE 271 ON-PREMISES: MOBILE APPS & WEB ANALYTICS MARKET, BY REGION,  2016–2021 (USD MILLION)
               TABLE 272 ON-PREMISES: MOBILE APPS & WEB ANALYTICS MARKET, BY REGION,  2022–2027 (USD MILLION)
               TABLE 273 CLOUD: MOBILE APPS & WEB ANALYTICS MARKET, BY REGION,  2016–2021 (USD MILLION)
               TABLE 274 CLOUD: MOBILE APPS & WEB ANALYTICS MARKET, BY REGION,  2022–2027 (USD MILLION)
 
16 APPENDIX (Page No. - 320)
     16.1 DISCUSSION GUIDE 
     16.2 KNOWLEDGESTORE: MARKETSANDMARKETS’  SUBSCRIPTION PORTAL 
     16.3 CUSTOMIZATION OPTIONS 
     16.4 RELATED REPORTS 
     16.5 AUTHOR DETAILS 

To estimate the size of the cloud mobile BaaS market at present, the study comprised four main activities. To gather data on the market, the competing market, and the parent market, we conducted a significant amount of secondary research. The following stage involved conducting primary research to confirm these conclusions, hypotheses, and sizing with industry experts throughout the value chain. A combination of top-down and bottom-up methods was used to assess the overall market size. After that, we estimated the market sizes of the various cloud mobile BaaS market segments using the market breakup and data triangulation techniques.

Secondary Research

A wide range of secondary sources, directories, and databases were employed in this research project, including product demos, vendor data sheets, D&B Hoovers, DiscoverOrg, Factiva, Vendor Surveys, Cloud Computing Association (CCA), Asia Cloud Computing Association, and The Software Alliance. In order to find and gather important data for our technical, commercial, and market-focused analysis of the cloud mobile BaaS market, we turned to these sources.

Primary Research

Several industry experts from the core and associated industries, as well as distributors, service providers, hardware manufacturers, alliances, technology developers, and organisations involved in all value chain segments of the business were the primary sources of information. Key industry participants, subject-matter experts, C-level executives of major market players, and industry consultants were among the primary respondents with whom in-depth interviews were conducted in order to gather and validate crucial qualitative and quantitative data and evaluate the market's potential.

In order to obtain information, we conducted primary interviews to obtain information on market statistics, the most recent trends that are upending the industry, newly implemented use cases, data on revenue generated by goods and services, market segmentation, market size estimations, market forecasts, and data triangulation. Understanding different technological developments, segmentation types, industry trends, and geographical areas was also aided by primary research. In order to gain insight into the buyer's perspective on suppliers, products, service providers, and their current use of services that could impact the enterprise asset management market as a whole, demand-side stakeholders, including Chief Information Officers (CIOs), Chief Technology Officers (CTOs), and Chief Security Officers (CSOs); installation teams of governments/end users using enterprise asset management solutions & services; and digital initiatives project teams, were put through interviews.

Cloud Mobile Backend as a Service (BaaS) Market Size, and Share

To know about the assumptions considered for the study, download the pdf brochure

Market Size Estimation

The cloud mobile BaaS market and other related submarkets were estimated and forecasted using both top-down and bottom-up methodologies. Using the revenues and product offerings of the major market players, the bottom-up methodology was used to determine the size of the market overall. This research ascertained and validated the precise value of the total parent market size through the use of data triangulation techniques and primary interview validation. Next, using percentage splits of the market segments, the overall market size was utilised in the top-down approach to estimate the size of other individual markets.

Top Down and Bottom Up Approach of cloud mobile BaaS market.

Cloud Mobile Backend as a Service (BaaS) Market Size, and Share

To know about the assumptions considered for the study, Request for Free Sample Report

The research methodology used to estimate the market size included the following:

  • Primary and secondary research were utilised to determine the revenue contributions of the major market participants in each country after secondary research helped identify them.
  • Throughout the process, critical insights were obtained by conducting in-depth interviews with industry professionals, including directors, CEOs, VPs, and marketing executives, as well as by reading the annual and financial reports of the top firms in the market.
  • Primary sources were used to verify all percentage splits and breakups, which were calculated using secondary sources.

Data Triangulation

The market was divided into a number of segments and subsegments using the previously described market size estimation procedures once the overall market size was determined. When required, market breakdown and data triangulation procedures were employed to complete the market engineering process and determine the exact figures for every market segment and subsegment. The data was triangulated by examining a number of variables and patterns from the supply and demand sides of government entities.

Market Definition

MarketsandMarkets defines Cloud Mobile Backend as a Service (BaaS) as "a cloud computing model that simplifies mobile app development by outsourcing backend infrastructure and services to the cloud. It offers pre-built functionalities such as data storage, user authentication, and APIs, enabling developers to focus on front-end design. This approach streamlines development, accelerates time-to-market, and ensures scalability as cloud providers handle backend complexities."
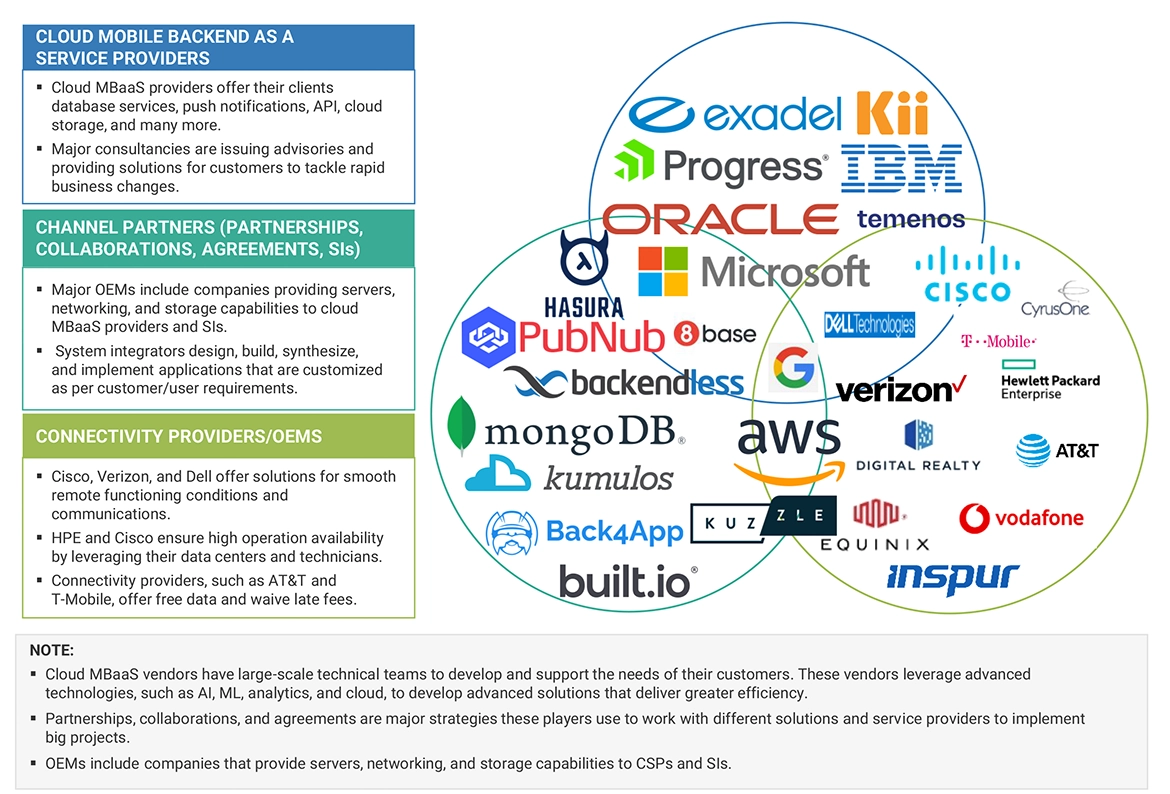
Key Stakeholders

  • Cloud Services Providers (CSPs)
  • Original Equipment Manufacturers (OEMs)
  • Colocation Providers
  • Technology Services Providers
  • Government Organizations
  • Consultants/Consultancies/Advisory Firms
  • Support and Maintenance Services Providers
  • Information Technology (IT) Infrastructure Providers
  • System Integrators (Sis)
  • Regional Associations
  • Independent Software Vendors
  • Value-Added Resellers and Distributors

Report Objectives

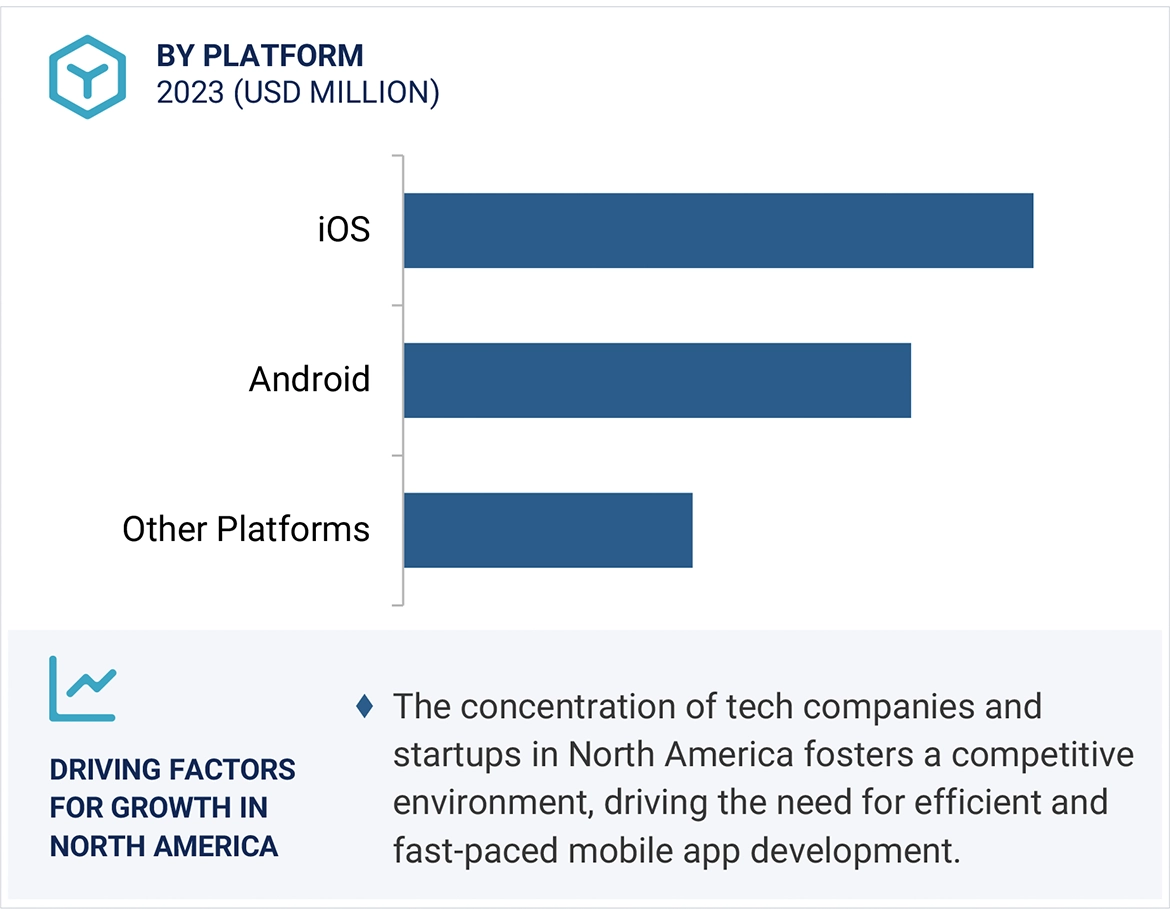
  • To define, describe, and forecast the cloud mobile BaaS market based on service type, application type, platform, deployment model, organization size, vertical, and region
  • To project the market sizes of the following five major regions: Latin America, Middle East & Africa, Asia Pacific, Europe, and North America
  • To strategically examine each market segment's growth trends, opportunities, and contributions to the overall market
  • To give comprehensive details about the main elements (drivers, constraints, opportunities, and challenges) affecting the market's growth
  • To assess market potential for stakeholders and give important actors specifics about the competitive environment
  • To examine market trends, patents, developments, and pricing information pertaining to cloud mobile BaaS.
  • In-depth examination of the fundamental skills of significant participants
  • To monitor and assess the effects of the recession as well as market competition changes like M&As, new product launches, and alliances and collaborations

Available Customizations

MarketsandMarkets provides customizations based on the company's unique requirements using the provided market data. The following customization options are available for the report:

Product Analysis

  • The product matrix provides a detailed comparison of the product portfolio of each company.

Geographic Analysis

  • Further breakup of the cloud mobile BaaS market

Company Information

  • Detailed analysis and profiling of five additional market players
Custom Market Research Services

We will customize the research for you, in case the report listed above does not meet with your exact requirements. Our custom research will comprehensively cover the business information you require to help you arrive at strategic and profitable business decisions.

Request Customization
Report Code
TC 1277
Published ON
Jan, 2024
Choose License Type
BUY NOW
  • SHARE
X
Request Customization
Speak to Analyst
Speak to Analyst
OR FACE-TO-FACE MEETING
PERSONALIZE THIS RESEARCH
  • Triangulate with your Own Data
  • Get Data as per your Format and Definition
  • Gain a Deeper Dive on a Specific Application, Geography, Customer or Competitor
  • Any level of Personalization
REQUEST A FREE CUSTOMIZATION
LET US HELP YOU!
  • What are the Known and Unknown Adjacencies Impacting the Cloud Mobile Backend as a Service (BaaS) Market
  • What will your New Revenue Sources be?
  • Who will be your Top Customer; what will make them switch?
  • Defend your Market Share or Win Competitors
  • Get a Scorecard for Target Partners
CUSTOMIZED WORKSHOP REQUEST
+1-888-600-6441
  • Call Us
  • +1-888-600-6441 (Corporate office hours)
  • +1-888-600-6441 (US/Can toll free)
  • +44-800-368-9399 (UK office hours)
CONNECT WITH US
ABOUT TRUST ONLINE
©2024 MarketsandMarkets Research Private Ltd. All rights reserved
DMCA.com Protection Status Website Feedback