Microscope Camera Market: Growth, Size, Share, and Trends

Report Code MD 9134
Published in Sep, 2024, By MarketsandMarkets™
Download PDF

Choose License Type

Buy Report Now Inquire Before Buying

Microscope Camera Market by Type (Color, Monochrome), Sensor (CMOS, CCD), Resolution (SD, HD, UHD), Application (Live Cell Imaging, Pathology, Pharmaceutical & Biopharmaceutical Research), End User (Hospitals, Diagnostic Labs) - Global Forecast to 2029

Overview

The global microscope camera market growth forecasted to transform from USD 191 million in 2024 to USD 278 million by 2029, driven by a CAGR of 7.8%. Growth in this market is mainly driven by factors such as the growing prevalence of chronic diseases and advancing technological aspects in microscope cameras. Growth opportunities in the Asia Pacific region are also expected to leverage a positive environment for players playing in the microscope camera market. However, the high costs of microscope cameras are expected to restrain market growth to a certain extent.

Attractive Opportunities in the Microscope Camera Market

Asia Pacific

The Asia Pacific market is expected to witness the highest growth during the forecast period due to the high prevalence of chronic diseases and the growing patient population. The growing demand for technologically advanced cameras for research and diagnosis is also expected to drive market growth.

The increasing incidence of chronic diseases and technological advancements are major factors driving the growth of the microscope camera market.

Emerging markets are expected to offer lucrative growth opportunities for players in the microscope camera market.

Various companies operating in this market have made significant investments in R&D to develop novel microscope cameras that better meet their customers’ needs.

Product launches and acquisitions were the most widely adopted growth strategies by market players.

Global Microscope Camera Market Dynamics

Driver: Increasing incidence of cancer and chronic diseases

The rising prevalence of chronic diseases has increased the demand for advanced diagnostic and research techniques. Microscope cameras play a crucial role in managing chronic diseases, as they significantly enhance early diagnosis, research, monitoring, and personalized treatment. Their advanced imaging capabilities provide in-depth insights into the cellular and molecular components of chronic illnesses, leading to more accurate diagnoses, improved understanding, and enhanced effectiveness of therapeutic interventions. In the US, 1.7 million people are diagnosed with cancer annually, 38 million people are diabetic, and 7 million people are affected by Alzheimer's disease (Source: CDC).

Restraint: High installation and maintenance cost of microscope cameras

Microscope cameras with CCD sensors are increasingly being cannibalized by high-end CMOS sensor-built microscope cameras due to their advanced features, higher resolution, and magnification power. Images captured using low-megapixel cameras have several drawbacks. The image quality of such pictures gets reduced when zooming in, cropping, or taking prints. Hence, there is a growing demand for high-megapixel cameras owing to their advantages. Color microscope cameras used in Indian clinics cost around USD 1,300, whereas in hospitals, prices vary from USD 500 to USD 2,000. Camera prices vary depending on megapixel sizes, sensor types, and others. Manufacturers usually expand the image size in terms of pixels, or sometimes they also try to contract or increase the picture element pitch. However, larger chip sizes increase the cost of manufacturing. The only way to produce a high-resolution image at a lower cost is to shrink the pixel pitch, which is a complex process. Thus, if the manufacturing costs increase, the price of the microscope camera also increases. Therefore, the cost of the microscope camera could hinder overall market growth. In addition, recurrent maintenance expenses drive up the overall cost of ownership and restrain market growth.


Opportunity: Growth prospects in developing APAC and MEA countries

In recent years, government funding for research and development in advanced microscopy and microscope cameras has significantly increased in Asia Pacific (APAC) and Middle Eastern & African (MEA) countries. In February 2017, the Indian government allocated approximately USD 45,000 to design and develop multimodal optical microscopes using Fourier optical image processing. Along with government funding, original equipment manufacturers (OEMs) in emerging markets offer opportunities for leading companies to outsource their microscope camera production as a cost-saving strategy. Major market players often delegate the production of their microscope cameras to local manufacturers in countries like India and China. These local manufacturers provide equipment, facilities, and labor at a reduced cost, leading to higher returns on investment for manufacturers and decreased production expenses for these instruments. As cost-effective manufacturing hubs, many prominent medical device companies, such as Carl Zeiss AG (Germany), Danaher (US), Nikon Corporation (Japan), and Sony Corporation (Japan), have established their microscope camera businesses in the Asia Pacific region.

Challenge: Dearth of trained personnel

Physicists and laboratory technicians use standard compound microscopes and understand how to adjust and operate the cameras in them. However, the need for skilled personnel has increased as advanced microscopes have been developed. For instance, atomic force scanning tunneling microscopes, often used in nanotechnology, require physicists or technicians to have a comprehensive interdisciplinary knowledge of surface physics and surface analysis to study the differentiating properties and characters of the natural biological and similar chemical amalgamation at the micro or micron level.

Global Microscope Camera Market Ecosystem Analysis

Microscope Camera Ecosystem/Market Map The microscope camera market ecosystem comprises product types, sensor & resolution types, applications, and end users, such as pharmaceutical & biopharmaceutical companies, hospitals & diagnostic laboratories, and academic & research institutes. Manufacturers develop and distribute microscope camera products while navigating regulations set by bodies such as the FDA and EMA, ensuring quality and compliance throughout the supply chain. This intricate network facilitates the production and R&D of molecular diagnostics and enables advancements in their manufacturing.


Color cameras segment held a higher market share.

The market is segmented by type into color and monochrome cameras. Color microscope cameras produce better color images with ease and high resolution than monochrome cameras. In contrast, monochrome cameras require extra technology and the acquisition of several images to generate a color image. For research and diagnosis purposes, colored images from color cameras are better for cell-level analysis of diseases. In 2023, the color cameras segment accounted for a larger market share.

The CMOS segment controlled the market, on the basis of sensor type, during the forecast period.

CMOS and CCD are two types of sensors used in microscope cameras. CMOS holds a greater market share due to its low power consumption, ease of integration, faster frame rate, and relatively low manufacturing costs. CMOS sensors offer better precision, low noise, and superior image quality without smearing the subject, resulting in higher adoption rates than CCD sensors, which are gradually disappearing from the market. Due to this, CMOS is utilized in more applications, such as pathology, biomedical and clinical research, cell and microbiology, medical diagnostics, neurophysiology, and pharmaceutical discovery.

North America Region Holds the Largest Share of the Microscope Camera Market.

By region, the microscope camera market includes North America, Europe, the Asia Pacific, Latin America, the Middle East & Africa, and GCC countries. In 2023, North America held the largest market share globally for microscope cameras. Growth in the North American microscope camera market can be attributed to the increasing population and growing research activities, the presence of a wide range of sophisticated microscope cameras from industry leaders, a strong and growing emphasis on molecular biology and nanotechnology, the presence of numerous important research institutes and universities in the area, and the presence of major microscope and accessories manufacturers.


Recent Developments of Microscope Camera Market Industry

  • In February 2023, Agilent launched a thermal cycler integrated along with a self-operating function for NGS, end-point PCR, and cell-related applications with thermal cycling. In January 2023, QIAGEN launched the QIAseq Targeted DNA Pro Panels and the QIAseq UPXome RNA Library Kits.
  • In May 2023, Illumina launched Connected Insights, a new cloud-based software that enables tertiary analysis for clinical next-generation sequencing data. This software can assist with genomic profiling (CGP) for advanced tumors, down to whole-genome sequencing in unique and rare diseases, as well as other extraordinary applications.

Key Market Players

Want to explore hidden markets that can drive new revenue in Microscope Camera Market?

Scope of the Report

Report Attribute Details
Market size available for years 2022–2029
Base year considered 2023
Forecast period 2024–2029
Forecast units Value (USD Billion)
Segments covered Type, sensor type, resolution, application, end user, and region
Geographies covered North America, Europe, Asia Pacific, Latin America, the Middle East & Africa, and GCC Countries


Personalize This Research

  • Triangulate with your Own Data
  • Get Data as per your Format and Definition
  • Gain a Deeper Dive on a Specific Application, Geography, Customer or Competitor
  • Any level of Personalization
Request A Free Customisation

Let Us Help You

  • What are the Known and Unknown Adjacencies Impacting the Microscope Camera Market
  • What will your New Revenue Sources be?
  • Who will be your Top Customer; what will make them switch?
  • Defend your Market Share or Win Competitors
  • Get a Scorecard for Target Partners
Customized Workshop Request

Table of Contents

Exclusive indicates content/data unique to MarketsandMarkets and not available with any competitors.

TITLE
PAGE NO
INTRODUCTION
24
RESEARCH METHODOLOGY
28
EXECUTIVE SUMMARY
41
PREMIUM INSIGHTS
45
MARKET OVERVIEW
49
  • 5.1 INTRODUCTION
  • 5.2 MARKET DYNAMICS
    DRIVERS
    - Increasing incidence of cancer and chronic diseases
    - Technological advancements in microscope cameras
    RESTRAINTS
    - High installation and maintenance cost of microscope cameras
    OPPORTUNITIES
    - Growth prospects in developing APAC and MEA countries
    CHALLENGES
    - Dearth of trained personnel
    - Availability of refurbished products
  • 5.3 ECOSYSTEM ANALYSIS
    ROLE IN ECOSYSTEM
  • 5.4 PRICING ANALYSIS
    PRICING ANALYSIS FOR MICROSCOPE CAMERA PRODUCTS, 2021–2023
  • 5.5 PATENT ANALYSIS
  • 5.6 VALUE CHAIN ANALYSIS
  • 5.7 SUPPLY CHAIN ANALYSIS
    PROMINENT COMPANIES
    SMALL & MEDIUM-SIZED ENTERPRISES
    END USERS
  • 5.8 PORTER’S FIVE FORCES ANALYSIS
    THREAT OF NEW ENTRANTS
    THREAT OF SUBSTITUTES
    BARGAINING POWER OF SUPPLIERS
    BARGAINING POWER OF BUYERS
    INTENSITY OF COMPETITIVE RIVALRY
  • 5.9 KEY STAKEHOLDERS & BUYING CRITERIA
    KEY STAKEHOLDERS IN BUYING PROCESS
    KEY BUYING CRITERIA
  • 5.10 REGULATORY ANALYSIS
    REGULATORY LANDSCAPE
    - North America
    - Europe
    - Asia Pacific
    - Latin America
    - Middle East
  • 5.11 TRADE ANALYSIS
    IMPORT DATA FOR MICROSCOPE CAMERAS
    EXPORT DATA FOR MICROSCOPE CAMERAS
  • 5.12 TECHNOLOGY ANALYSIS
    KEY TECHNOLOGIES
    - Teledyne EMCCD technology
    COMPLEMENTARY TECHNOLOGIES
    - Olympus’ color profiling technology
  • 5.13 KEY CONFERENCES & EVENTS, 2024–2025
  • 5.14 TRENDS/DISRUPTIONS IMPACTING CUSTOMERS’ BUSINESSES
  • 5.15 CASE STUDY ANALYSIS
    USE OF MICROSCOPE CAMERAS IN MARINE RESEARCH HELP IN ANALYZING MARINE MICROFOSSILS
  • 5.16 IMPACT OF GENERATIVE AI ON MICROSCOPE CAMERA MARKET
MICROSCOPE CAMERA MARKET, BY TYPE
79
  • 6.1 INTRODUCTION
  • 6.2 MONOCHROME CAMERAS
    HIGH SENSITIVITY OF MONOCHROME CAMERAS TO BOOST ADOPTION
  • 6.3 COLOR CAMERAS
    GROWING PREFERENCE FOR COLORED IMAGES IN MEDICAL APPLICATIONS TO FAVOR MARKET GROWTH
MICROSCOPE CAMERA MARKET, BY SENSOR TYPE
87
  • 7.1 INTRODUCTION
  • 7.2 CMOS SENSORS
    CMOS SENSORS TO DOMINATE MICROSCOPE CAMERA MARKET DURING FORECAST PERIOD
  • 7.3 CCD SENSORS
    DISCONTINUATION OF CCD SENSORS BY PLAYERS IN MARKET TO HAMPER MARKET GROWTH
MICROSCOPE CAMERA MARKET, BY RESOLUTION
97
  • 8.1 INTRODUCTION
  • 8.2 HIGH-DEFINITION (HD) CAMERAS
    TECHNOLOGICAL ADVANCEMENTS IN HIGH-DEFINITION CAMERAS TO SUPPORT MARKET GROWTH
  • 8.3 STANDARD-DEFINITION (SD) CAMERAS
    AVAILABILITY OF BETTER-RESOLUTION CAMERAS TO CHALLENGE MARKET GROWTH IN COMING YEARS
MICROSCOPE CAMERA MARKET, BY APPLICATION
104
  • 9.1 INTRODUCTION
  • 9.2 PHARMACEUTICAL & BIOPHARMACEUTICAL RESEARCH
    GREATER ADOPTION OF MICROSCOPES AND NEED FOR MICROSCOPE CAMERAS IN MICROSCALE ANALYSIS TO DRIVE SEGMENT
  • 9.3 LIVE CELL IMAGING
    CONTINUOUS ADVANCEMENTS IN MICROSCOPE CAMERAS TO PLAY PIVOTAL ROLE IN GROWTH OF LIVE CELL IMAGING MARKET
  • 9.4 PATHOLOGY
    NEED FOR TIME-EFFICIENT AND QUICK IDENTIFICATION OF INFECTION-CAUSING AGENTS TO BOOST DEMAND
  • 9.5 OTHER APPLICATIONS
MICROSCOPE CAMERA MARKET, BY END USER
115
  • 10.1 INTRODUCTION
  • 10.2 PHARMACEUTICAL & BIOPHARMACEUTICAL COMPANIES
    GROWING DEMAND FOR ADVANCED TECHNIQUES FOR DRUG DEVELOPMENT TO AUGMENT MARKET GROWTH
  • 10.3 HOSPITALS & DIAGNOSTIC LABORATORIES
    RISING DEMAND FOR TECHNOLOGICALLY ADVANCED MICROSCOPE CAMERA PRODUCTS TO AID MARKET GROWTH
  • 10.4 ACADEMIC & RESEARCH INSTITUTES
    SUPPORTIVE GOVERNMENT AND COMMERCIAL SECTORS TO DRIVE MARKET GROWTH
  • 10.5 OTHER END USERS
MICROSCOPE CAMERA MARKET, BY REGION
126
  • 11.1 INTRODUCTION
  • 11.2 NORTH AMERICA
    US
    - Rise in chronic disease prevalence to drive market
    CANADA
    - Surge in cancer cases to boost market
  • 11.3 EUROPE
    GERMANY
    - Favorable funding in microscope cameras, illumination, and laser technology fields to propel market
    UK
    - Rising geriatric population to stimulate growth
    FRANCE
    - Robust research financing to foster growth
    ITALY
    - Advanced healthcare system to support growth
    SPAIN
    - Increased R&D funding to boost market
    REST OF EUROPE
  • 11.4 ASIA PACIFIC
    JAPAN
    - Presence of major market players to propel market
    CHINA
    - Surge in microbiology and molecular science research to aid growth
    INDIA
    - Growing focus on biotechnology industry to augment growth
    REST OF ASIA PACIFIC
  • 11.5 LATIN AMERICA
    BRAZIL
    - Booming nanotechnology field to boost market
    MEXICO
    - Growing prevalence of chronic diseases to favor market growth
    REST OF LATIN AMERICA
  • 11.6 MIDDLE EAST & AFRICA
    GOVERNMENT INITIATIVES TO IMPROVE HEALTHCARE INFRASTRUCTURE TO FAVOR MARKET GROWTH
  • 11.7 GCC COUNTRIES
    RISING GOVERNMENT EXPENDITURE TO DRIVE MARKET
COMPETITIVE LANDSCAPE
172
  • 12.1 OVERVIEW
  • 12.2 KEY PLAYER STRATEGY/RIGHT TO WIN
    OVERVIEW OF STRATEGIES ADOPTED BY KEY PLAYERS IN MICROSCOPE CAMERA MARKET
  • 12.3 REVENUE ANALYSIS
  • 12.4 MARKET SHARE ANALYSIS
  • 12.5 COMPANY EVALUATION MATRIX: KEY PLAYERS, 2023
    STARS
    EMERGING LEADERS
    PERVASIVE PLAYERS
    PARTICIPANTS
    COMPANY FOOTPRINT: KEY PLAYERS, 2023
    - Company footprint
    - Type footprint
    - Sensor type footprint
    - Application footprint
    - Region footprint
  • 12.6 COMPETITIVE EVALUATION MATRIX: STARTUPS/SMES, 2023
    PROGRESSIVE COMPANIES
    RESPONSIVE COMPANIES
    DYNAMIC COMPANIES
    STARTING BLOCKS
    COMPETITIVE BENCHMARKING: STARTUPS/SMES, 2023
  • 12.7 COMPANY VALUATION & FINANCIAL METRICS
  • 12.8 BRAND/PRODUCT COMPARISON
  • 12.9 COMPETITIVE SCENARIO
    PRODUCT LAUNCHES
    DEALS
COMPANY PROFILES
186
  • 13.1 KEY PLAYERS
    LEICA MICROSYSTEMS (DANAHER CORPORATION)
    - Business overview
    - Products/Services/Solutions offered
    - Recent developments
    - MnM View
    NIKON CORPORATION
    - Business overview
    - Products/Services/Solutions offered
    - Recent developments
    - MnM View
    CARL ZEISS AG
    - Business overview
    - Products/Services/Solutions offered
    - Recent developments
    - MnM view
    EVIDENT
    - Business overview
    - Products/Services/Solutions offered
    - Recent developments
    - MnM view
    TELEDYNE TECHNOLOGIES
    - Business overview
    - Products/Services/Solutions offered
    - MnM view
    JENOPTIK AG
    - Business overview
    - Products/Services/Solutions offered
    - Recent developments
    HAMAMATSU PHOTONICS KK
    - Business overview
    - Products/Services/Solutions offered
    BASLER AG
    - Business overview
    - Products/Services/Solutions offered
    EXCELITAS TECHNOLOGIES CORP.
    - Business overview
    - Products/Services/Solutions offered
    THORLABS, INC.
    - Business overview
    - Products/Services/Solutions offered
  • 13.2 OTHER PLAYERS
    KEYENCE CORPORATION
    ANDOR TECHNOLOGY (OXFORD INSTRUMENTS)
    SPOT IMAGING
    EUROMEX MICROSCOPEN BV
    MOTIC
    DINO-LITE DIGITAL MICROSCOPE (ANMO ELECTRONICS CORPORATION)
    MEIJI TECHNO CO.
    LABOMED, INC.
    DELTAPIX
    ADIMEC ADVANCED IMAGE SYSTEMS BV
    XIMEA GMBH
    DAGE-MTI
    GT VISION LTD.
    TUCSEN PHOTONICS CO.
    RAPTOR PHOTONICS
APPENDIX
228
  • 14.1 DISCUSSION GUIDE
  • 14.2 KNOWLEDGESTORE: MARKETSANDMARKETS’ SUBSCRIPTION PORTAL
  • 14.3 CUSTOMIZATION OPTIONS
  • 14.4 RELATED REPORTS
  • 14.5 AUTHOR DETAILS
LIST OF TABLES
 
  • TABLE 1 MICROSCOPE CAMERA MARKET: INCLUSIONS & EXCLUSIONS
  • TABLE 2 MICROSCOPE CAMERA MARKET: KEY DATA FROM PRIMARY SOURCES
  • TABLE 3 MICROSCOPE CAMERA MARKET: RISK ASSESSMENT ANALYSIS
  • TABLE 4 MICROSCOPE CAMERA MARKET: ROLE IN ECOSYSTEM
  • TABLE 5 AVERAGE SELLING PRICE TREND FOR MICROSCOPE CAMERA PRODUCTS, 2021–2023
  • TABLE 6 INDICATIVE LIST OF PATENTS IN MICROSCOPE CAMERA MARKET
  • TABLE 7 MICROSCOPE CAMERA MARKET: PORTER’S FIVE FORCES ANALYSIS
  • TABLE 8 INFLUENCE OF KEY STAKEHOLDERS ON BUYING PROCESS
  • TABLE 9 KEY BUYING CRITERIA FOR MICROSCOPE CAMERAS
  • TABLE 10 INDICATIVE LIST OF REGULATORY AUTHORITIES IN MICROSCOPE CAMERA MARKET
  • TABLE 11 US FDA: MEDICAL DEVICE CLASSIFICATION
  • TABLE 12 US: MEDICAL DEVICE REGULATORY APPROVAL PROCESS
  • TABLE 13 CANADA: MEDICAL DEVICE REGULATORY APPROVAL PROCESS
  • TABLE 14 JAPAN: MEDICAL DEVICE CLASSIFICATION UNDER PHARMACEUTICAL AND MEDICAL DEVICE AGENCY (PMDA)
  • TABLE 15 CHINA: CLASSIFICATION OF MEDICAL DEVICES
  • TABLE 16 IMPORT DATA FOR MICROSCOPE CAMERAS (HS CODE 901190), BY COUNTRY, 2019–2023 (USD)
  • TABLE 17 EXPORT DATA FOR MICROSCOPE CAMERAS (HS CODE 901190), BY COUNTRY, 2019–2023 (USD)
  • TABLE 18 MICROSCOPE CAMERA MARKET: DETAILED LIST OF KEY CONFERENCES & EVENTS, JANUARY 2024–DECEMBER 2025
  • TABLE 19 MONOCHROME CAMERAS VS. COLOR CAMERAS
  • TABLE 20 MICROSCOPE CAMERA MARKET, BY TYPE, 2022–2029 (USD MILLION)
  • TABLE 21 MAJOR MONOCHROME MICROSCOPE CAMERAS AVAILABLE IN MARKET
  • TABLE 22 MONOCHROME CAMERA MARKET, BY REGION, 2022–2029 (USD MILLION)
  • TABLE 23 NORTH AMERICA: MONOCHROME CAMERA MARKET, BY COUNTRY, 2022–2029 (USD MILLION)
  • TABLE 24 EUROPE: MONOCHROME CAMERA MARKET, BY COUNTRY, 2022–2029 (USD MILLION)
  • TABLE 25 ASIA PACIFIC: MONOCHROME CAMERA MARKET, BY COUNTRY, 2022–2029 (USD MILLION)
  • TABLE 26 LATIN AMERICA: MONOCHROME CAMERA MARKET, BY COUNTRY, 2022–2029 (USD MILLION)
  • TABLE 27 MAJOR COLOR CAMERAS AVAILABLE IN MARKET
  • TABLE 28 COLOR CAMERA MARKET, BY REGION, 2022–2029 (USD MILLION)
  • TABLE 29 NORTH AMERICA: COLOR CAMERA MARKET, BY COUNTRY, 2022–2029 (USD MILLION)
  • TABLE 30 EUROPE: COLOR CAMERA MARKET, BY COUNTRY, 2022–2029 (USD MILLION)
  • TABLE 31 ASIA PACIFIC: COLOR CAMERA MARKET, BY COUNTRY, 2022–2029 (USD MILLION)
  • TABLE 32 LATIN AMERICA: COLOR CAMERA MARKET, BY COUNTRY, 2022–2029 (USD MILLION)
  • TABLE 33 CMOS SENSORS VS. CCD SENSORS IN MEDICAL CAMERAS
  • TABLE 34 MICROSCOPE CAMERA MARKET, BY SENSOR TYPE, 2022–2029 (USD MILLION)
  • TABLE 35 MAJOR CMOS SENSOR-BASED MICROSCOPE CAMERAS AVAILABLE IN MARKET
  • TABLE 36 MICROSCOPE CAMERA MARKET FOR CMOS SENSORS, BY REGION, 2022–2029 (USD MILLION)
  • TABLE 37 NORTH AMERICA: MICROSCOPE CAMERA MARKET FOR CMOS SENSORS, BY COUNTRY, 2022–2029 (USD MILLION)
  • TABLE 38 EUROPE: MICROSCOPE CAMERA MARKET FOR CMOS SENSORS, BY COUNTRY, 2022–2029 (USD MILLION)
  • TABLE 39 ASIA PACIFIC: MICROSCOPE CAMERA MARKET FOR CMOS SENSORS, BY COUNTRY, 2022–2029 (USD MILLION)
  • TABLE 40 LATIN AMERICA: MICROSCOPE CAMERA MARKET FOR CMOS SENSORS, BY COUNTRY, 2022–2029 (USD MILLION)
  • TABLE 41 MAJOR CCD SENSOR-BASED MICROSCOPE CAMERAS AVAILABLE IN MARKET
  • TABLE 42 MICROSCOPE CAMERA MARKET FOR CCD SENSORS, BY REGION, 2022–2029 (USD MILLION)
  • TABLE 43 NORTH AMERICA: MICROSCOPE CAMERA MARKET FOR CCD SENSORS, BY COUNTRY, 2022–2029 (USD MILLION)
  • TABLE 44 EUROPE: MICROSCOPE CAMERA MARKET FOR CCD SENSORS, BY COUNTRY, 2022–2029 (USD MILLION)
  • TABLE 45 ASIA PACIFIC: MICROSCOPE CAMERA MARKET FOR CCD SENSORS, BY COUNTRY, 2022–2029 (USD MILLION)
  • TABLE 46 LATIN AMERICA: MICROSCOPE CAMERA MARKET FOR CCD SENSORS, BY COUNTRY, 2022–2029 (USD MILLION)
  • TABLE 47 MICROSCOPE CAMERA MARKET, BY RESOLUTION, 2022–2029 (USD MILLION)
  • TABLE 48 HIGH-DEFINITION (HD) MICROSCOPE CAMERA MARKET, BY REGION, 2022–2029 (USD MILLION)
  • TABLE 49 NORTH AMERICA: HIGH-DEFINITION (HD) MICROSCOPE CAMERA MARKET, BY COUNTRY, 2022–2029 (USD MILLION)
  • TABLE 50 EUROPE: HIGH-DEFINITION (HD) MICROSCOPE CAMERA MARKET, BY COUNTRY, 2022–2029 (USD MILLION)
  • TABLE 51 ASIA PACIFIC: HIGH-DEFINITION (HD) MICROSCOPE CAMERA MARKET, BY COUNTRY, 2022–2029 (USD MILLION)
  • TABLE 52 LATIN AMERICA: HIGH-DEFINITION (HD) MICROSCOPE CAMERA MARKET, BY COUNTRY, 2022–2029 (USD MILLION)
  • TABLE 53 STANDARD-DEFINITION (SD) MICROSCOPE CAMERA MARKET, BY REGION, 2022–2029 (USD MILLION)
  • TABLE 54 NORTH AMERICA: STANDARD-DEFINITION (SD) MICROSCOPE CAMERA MARKET, BY COUNTRY, 2022–2029 (USD MILLION)
  • TABLE 55 EUROPE: STANDARD-DEFINITION (SD) MICROSCOPE CAMERA MARKET, BY COUNTRY, 2022–2029 (USD MILLION)
  • TABLE 56 ASIA PACIFIC: STANDARD-DEFINITION (SD) MICROSCOPE CAMERA MARKET, BY COUNTRY, 2022–2029 (USD MILLION)
  • TABLE 57 LATIN AMERICA: STANDARD-DEFINITION (SD) MICROSCOPE CAMERA MARKET, BY COUNTRY, 2022–2029 (USD MILLION)
  • TABLE 58 MICROSCOPE CAMERA MARKET, BY APPLICATION, 2022–2029 (USD MILLION)
  • TABLE 59 MICROSCOPE CAMERA MARKET FOR PHARMACEUTICAL & BIOPHARMACEUTICAL RESEARCH APPLICATIONS, BY REGION, 2022–2029 (USD MILLION)
  • TABLE 60 NORTH AMERICA: MICROSCOPE CAMERA MARKET FOR PHARMACEUTICAL & BIOPHARMACEUTICAL RESEARCH APPLICATIONS, BY COUNTRY, 2022–2029 (USD MILLION)
  • TABLE 61 EUROPE: MICROSCOPE CAMERA MARKET FOR PHARMACEUTICAL & BIOPHARMACEUTICAL RESEARCH APPLICATIONS, BY COUNTRY, 2022–2029 (USD MILLION)
  • TABLE 62 ASIA PACIFIC: MICROSCOPE CAMERA MARKET FOR PHARMACEUTICAL & BIOPHARMACEUTICAL RESEARCH APPLICATIONS, BY COUNTRY, 2022–2029 (USD MILLION)
  • TABLE 63 LATIN AMERICA: MICROSCOPE CAMERA MARKET FOR PHARMACEUTICAL & BIOPHARMACEUTICAL RESEARCH APPLICATIONS, BY COUNTRY, 2022–2029 (USD MILLION)
  • TABLE 64 MICROSCOPE CAMERA MARKET FOR LIVE CELL IMAGING APPLICATIONS, BY REGION, 2022–2029 (USD MILLION)
  • TABLE 65 NORTH AMERICA: MICROSCOPE CAMERA MARKET FOR LIVE CELL IMAGING APPLICATIONS, BY COUNTRY, 2022–2029 (USD MILLION)
  • TABLE 66 EUROPE: MICROSCOPE CAMERA MARKET FOR LIVE CELL IMAGING APPLICATIONS, BY COUNTRY, 2022–2029 (USD MILLION)
  • TABLE 67 ASIA PACIFIC: MICROSCOPE CAMERA MARKET FOR LIVE CELL IMAGING APPLICATIONS, BY COUNTRY, 2022–2029 (USD MILLION)
  • TABLE 68 LATIN AMERICA: MICROSCOPE CAMERA MARKET FOR LIVE CELL IMAGING APPLICATIONS, BY COUNTRY, 2022–2029 (USD MILLION)
  • TABLE 69 MICROSCOPE CAMERA MARKET FOR PATHOLOGY APPLICATIONS, BY REGION, 2022–2029 (USD MILLION)
  • TABLE 70 NORTH AMERICA: MICROSCOPE CAMERA MARKET FOR PATHOLOGY APPLICATIONS, BY COUNTRY, 2022–2029 (USD MILLION)
  • TABLE 71 EUROPE: MICROSCOPE CAMERA MARKET FOR PATHOLOGY APPLICATIONS, BY COUNTRY, 2022–2029 (USD MILLION)
  • TABLE 72 ASIA PACIFIC: MICROSCOPE CAMERA MARKET FOR PATHOLOGY APPLICATIONS, BY COUNTRY, 2022–2029 (USD MILLION)
  • TABLE 73 LATIN AMERICA: MICROSCOPE CAMERA MARKET FOR PATHOLOGY APPLICATIONS, BY COUNTRY, 2022–2029 (USD MILLION)
  • TABLE 74 MICROSCOPE CAMERA MARKET FOR OTHER APPLICATIONS, BY REGION, 2022–2029 (USD MILLION)
  • TABLE 75 NORTH AMERICA: MICROSCOPE CAMERA MARKET FOR OTHER APPLICATIONS, BY COUNTRY, 2022–2029 (USD MILLION)
  • TABLE 76 EUROPE: MICROSCOPE CAMERA MARKET FOR OTHER APPLICATIONS, BY COUNTRY, 2022–2029 (USD MILLION)
  • TABLE 77 ASIA PACIFIC: MICROSCOPE CAMERA MARKET FOR OTHER APPLICATIONS, BY COUNTRY, 2022–2029 (USD MILLION)
  • TABLE 78 LATIN AMERICA: MICROSCOPE CAMERA MARKET FOR OTHER APPLICATIONS, BY COUNTRY, 2022–2029 (USD MILLION)
  • TABLE 79 MICROSCOPE CAMERA MARKET, BY END USER, 2022–2029 (USD MILLION)
  • TABLE 80 MICROSCOPE CAMERA MARKET FOR PHARMACEUTICAL & BIOPHARMACEUTICAL COMPANIES, BY REGION, 2022–2029 (USD MILLION)
  • TABLE 81 NORTH AMERICA: MICROSCOPE CAMERA MARKET FOR PHARMACEUTICAL & BIOPHARMACEUTICAL COMPANIES, BY COUNTRY, 2022–2029 (USD MILLION)
  • TABLE 82 EUROPE: MICROSCOPE CAMERA MARKET FOR PHARMACEUTICAL & BIOPHARMACEUTICAL COMPANIES, BY COUNTRY, 2022–2029 (USD MILLION)
  • TABLE 83 ASIA PACIFIC: MICROSCOPE CAMERA MARKET FOR PHARMACEUTICAL & BIOPHARMACEUTICAL COMPANIES, BY COUNTRY, 2022–2029 (USD MILLION)
  • TABLE 84 LATIN AMERICA: MICROSCOPE CAMERA MARKET FOR PHARMACEUTICAL & BIOPHARMACEUTICAL COMPANIES, BY COUNTRY, 2022–2029 (USD MILLION)
  • TABLE 85 MICROSCOPE CAMERA MARKET FOR HOSPITALS & DIAGNOSTIC LABORATORIES, BY REGION, 2022–2029 (USD MILLION)
  • TABLE 86 NORTH AMERICA: MICROSCOPE CAMERA MARKET FOR HOSPITALS & DIAGNOSTIC LABORATORIES, BY COUNTRY, 2022–2029 (USD MILLION)
  • TABLE 87 EUROPE: MICROSCOPE CAMERA MARKET FOR HOSPITALS & DIAGNOSTIC LABORATORIES, BY COUNTRY, 2022–2029 (USD MILLION)
  • TABLE 88 ASIA PACIFIC: MICROSCOPE CAMERA MARKET FOR HOSPITALS & DIAGNOSTIC LABORATORIES, BY COUNTRY, 2022–2029 (USD MILLION)
  • TABLE 89 LATIN AMERICA: MICROSCOPE CAMERA MARKET FOR HOSPITALS & DIAGNOSTIC LABORATORIES, BY COUNTRY, 2022–2029 (USD MILLION)
  • TABLE 90 MICROSCOPE CAMERA MARKET FOR ACADEMIC & RESEARCH INSTITUTES, BY REGION, 2022–2029 (USD MILLION)
  • TABLE 91 NORTH AMERICA: MICROSCOPE CAMERA MARKET FOR ACADEMIC & RESEARCH INSTITUTES, BY COUNTRY, 2022–2029 (USD MILLION)
  • TABLE 92 EUROPE: MICROSCOPE CAMERA MARKET FOR ACADEMIC & RESEARCH INSTITUTES, BY COUNTRY, 2022–2029 (USD MILLION)
  • TABLE 93 ASIA PACIFIC: MICROSCOPE CAMERA MARKET FOR ACADEMIC & RESEARCH INSTITUTES, BY COUNTRY, 2022–2029 (USD MILLION)
  • TABLE 94 LATIN AMERICA: MICROSCOPE CAMERA MARKET FOR ACADEMIC & RESEARCH INSTITUTES, BY COUNTRY, 2022–2029 (USD MILLION)
  • TABLE 95 MICROSCOPE CAMERA MARKET FOR OTHER END USERS, BY REGION, 2022–2029 (USD MILLION)
  • TABLE 96 NORTH AMERICA: MICROSCOPE CAMERA MARKET FOR OTHER END USERS, BY COUNTRY, 2022–2029 (USD MILLION)
  • TABLE 97 EUROPE: MICROSCOPE CAMERA MARKET FOR OTHER END USERS, BY COUNTRY, 2022–2029 (USD MILLION)
  • TABLE 98 ASIA PACIFIC: MICROSCOPE CAMERA MARKET FOR OTHER END USERS, BY COUNTRY, 2022–2029 (USD MILLION)
  • TABLE 99 LATIN AMERICA: MICROSCOPE CAMERA MARKET FOR OTHER END USERS, BY COUNTRY, 2022–2029 (USD MILLION)
  • TABLE 100 MICROSCOPE CAMERA MARKET, BY REGION, 2022–2029 (USD MILLION)
  • TABLE 101 NORTH AMERICA: MICROSCOPE CAMERA MARKET, BY COUNTRY, 2022–2029 (USD MILLION)
  • TABLE 102 NORTH AMERICA: MICROSCOPE CAMERA MARKET, BY TYPE, 2022–2029 (USD MILLION)
  • TABLE 103 NORTH AMERICA: MICROSCOPE CAMERA MARKET, BY SENSOR TYPE, 2022–2029 (USD MILLION)
  • TABLE 104 NORTH AMERICA: MICROSCOPE CAMERA MARKET, BY RESOLUTION, 2022–2029 (USD MILLION)
  • TABLE 105 NORTH AMERICA: MICROSCOPE CAMERA MARKET, BY APPLICATION, 2022–2029 (USD MILLION)
  • TABLE 106 NORTH AMERICA: MICROSCOPE CAMERA MARKET, BY END USER, 2022–2029 (USD MILLION)
  • TABLE 107 US: MICROSCOPE CAMERA MARKET, BY TYPE, 2022–2029 (USD MILLION)
  • TABLE 108 US: MICROSCOPE CAMERA MARKET, BY SENSOR TYPE, 2022–2029 (USD MILLION)
  • TABLE 109 US: MICROSCOPE CAMERA MARKET, BY RESOLUTION, 2022–2029 (USD MILLION)
  • TABLE 110 US: MICROSCOPE CAMERA MARKET, BY APPLICATION, 2022–2029 (USD MILLION)
  • TABLE 111 US: MICROSCOPE CAMERA MARKET, BY END USER, 2022–2029 (USD MILLION)
  • TABLE 112 CANADA: MICROSCOPE CAMERA MARKET, BY TYPE, 2022–2029 (USD MILLION)
  • TABLE 113 CANADA: MICROSCOPE CAMERA MARKET, BY SENSOR TYPE, 2022–2029 (USD MILLION)
  • TABLE 114 CANADA: MICROSCOPE CAMERA MARKET, BY RESOLUTION, 2022–2029 (USD MILLION)
  • TABLE 115 CANADA: MICROSCOPE CAMERA MARKET, BY APPLICATION, 2022–2029 (USD MILLION)
  • TABLE 116 CANADA: MICROSCOPE CAMERA MARKET, BY END USER, 2022–2029 (USD MILLION)
  • TABLE 117 EUROPE: MICROSCOPE CAMERA MARKET, BY COUNTRY, 2022–2029 (USD MILLION)
  • TABLE 118 EUROPE: MICROSCOPE CAMERA MARKET, BY TYPE, 2022–2029 (USD MILLION)
  • TABLE 119 EUROPE: MICROSCOPE CAMERA MARKET, BY SENSOR TYPE, 2022–2029 (USD MILLION)
  • TABLE 120 EUROPE: MICROSCOPE CAMERA MARKET, BY RESOLUTION, 2022–2029 (USD MILLION)
  • TABLE 121 EUROPE: MICROSCOPE CAMERA MARKET, BY APPLICATION, 2022–2029 (USD MILLION)
  • TABLE 122 EUROPE: MICROSCOPE CAMERA MARKET, BY END USER, 2022–2029 (USD MILLION)
  • TABLE 123 GERMANY: MICROSCOPE CAMERA MARKET, BY TYPE, 2022–2029 (USD MILLION)
  • TABLE 124 GERMANY: MICROSCOPE CAMERA MARKET, BY SENSOR TYPE, 2022–2029 (USD MILLION)
  • TABLE 125 GERMANY: MICROSCOPE CAMERA MARKET, BY RESOLUTION, 2022–2029 (USD MILLION)
  • TABLE 126 GERMANY: MICROSCOPE CAMERA MARKET, BY APPLICATION, 2022–2029 (USD MILLION)
  • TABLE 127 GERMANY: MICROSCOPE CAMERA MARKET, BY END USER, 2022–2029 (USD MILLION)
  • TABLE 128 UK: MICROSCOPE CAMERA MARKET, BY TYPE, 2022–2029 (USD MILLION)
  • TABLE 129 UK: MICROSCOPE CAMERA MARKET, BY SENSOR TYPE, 2022–2029 (USD MILLION)
  • TABLE 130 UK: MICROSCOPE CAMERA MARKET, BY RESOLUTION, 2022–2029 (USD MILLION)
  • TABLE 131 UK: MICROSCOPE CAMERA MARKET, BY APPLICATION, 2022–2029 (USD MILLION)
  • TABLE 132 UK: MICROSCOPE CAMERA MARKET, BY END USER, 2022–2029 (USD MILLION)
  • TABLE 133 FRANCE: MICROSCOPE CAMERA MARKET, BY TYPE, 2022–2029 (USD MILLION)
  • TABLE 134 FRANCE: MICROSCOPE CAMERA MARKET, BY SENSOR TYPE, 2022–2029 (USD MILLION)
  • TABLE 135 FRANCE: MICROSCOPE CAMERA MARKET, BY RESOLUTION 2022–2029 (USD MILLION)
  • TABLE 136 FRANCE: MICROSCOPE CAMERA MARKET, BY APPLICATION, 2022–2029 (USD MILLION)
  • TABLE 137 FRANCE: MICROSCOPE CAMERA MARKET, BY END USER, 2022–2029 (USD MILLION)
  • TABLE 138 ITALY: MICROSCOPE CAMERA MARKET, BY TYPE, 2022–2029 (USD MILLION)
  • TABLE 139 ITALY: MICROSCOPE CAMERA MARKET, BY SENSOR TYPE, 2022–2029 (USD MILLION)
  • TABLE 140 ITALY: MICROSCOPE CAMERA MARKET, BY RESOLUTION, 2022–2029 (USD MILLION)
  • TABLE 141 ITALY: MICROSCOPE CAMERA MARKET, BY APPLICATION, 2022–2029 (USD MILLION)
  • TABLE 142 ITALY: MICROSCOPE CAMERA MARKET, BY END USER, 2022–2029 (USD MILLION)
  • TABLE 143 SPAIN: MICROSCOPE CAMERA MARKET, BY TYPE, 2022–2029 (USD MILLION)
  • TABLE 144 SPAIN: MICROSCOPE CAMERA MARKET, BY SENSOR TYPE, 2022–2029 (USD MILLION)
  • TABLE 145 SPAIN: MICROSCOPE CAMERA MARKET, BY RESOLUTION, 2022–2029 (USD MILLION)
  • TABLE 146 SPAIN: MICROSCOPE CAMERA MARKET, BY APPLICATION, 2022–2029 (USD MILLION)
  • TABLE 147 SPAIN: MICROSCOPE CAMERA MARKET, BY END USER, 2022–2029 (USD MILLION)
  • TABLE 148 REST OF EUROPE: MICROSCOPE CAMERA MARKET, BY TYPE, 2022–2029 (USD MILLION)
  • TABLE 149 REST OF EUROPE: MICROSCOPE CAMERA MARKET, BY SENSOR TYPE, 2022–2029 (USD MILLION)
  • TABLE 150 REST OF EUROPE: MICROSCOPE CAMERA MARKET, BY RESOLUTION, 2022–2029 (USD MILLION)
  • TABLE 151 REST OF EUROPE: MICROSCOPE CAMERA MARKET, BY APPLICATION, 2022–2029 (USD MILLION)
  • TABLE 152 REST OF EUROPE: MICROSCOPE CAMERA MARKET, BY END USER, 2022–2029 (USD MILLION)
  • TABLE 153 ASIA PACIFIC: MICROSCOPE CAMERA MARKET, BY COUNTRY, 2022–2029 (USD MILLION)
  • TABLE 154 ASIA PACIFIC: MICROSCOPE CAMERA MARKET, BY TYPE, 2022–2029 (USD MILLION)
  • TABLE 155 ASIA PACIFIC: MICROSCOPE CAMERA MARKET, BY SENSOR TYPE, 2022–2029 (USD MILLION)
  • TABLE 156 ASIA PACIFIC: MICROSCOPE CAMERA MARKET, BY RESOLUTION, 2022–2029 (USD MILLION)
  • TABLE 157 ASIA PACIFIC: MICROSCOPE CAMERA MARKET, BY APPLICATION, 2022–2029 (USD MILLION)
  • TABLE 158 ASIA PACIFIC: MICROSCOPE CAMERA MARKET, BY END USER, 2022–2029 (USD MILLION)
  • TABLE 159 JAPAN: MICROSCOPE CAMERA MARKET, BY TYPE, 2022–2029 (USD MILLION)
  • TABLE 160 JAPAN: MICROSCOPE CAMERA MARKET, BY SENSOR TYPE, 2022–2029 (USD MILLION)
  • TABLE 161 JAPAN: MICROSCOPE CAMERA MARKET, BY RESOLUTION, 2022–2029 (USD MILLION)
  • TABLE 162 JAPAN: MICROSCOPE CAMERA MARKET, BY APPLICATION, 2022–2029 (USD MILLION)
  • TABLE 163 JAPAN: MICROSCOPE CAMERA MARKET, BY END USER, 2022–2029 (USD MILLION)
  • TABLE 164 CHINA: MICROSCOPE CAMERA MARKET, BY TYPE, 2022–2029 (USD MILLION)
  • TABLE 165 CHINA: MICROSCOPE CAMERA MARKET, BY SENSOR TYPE, 2022–2029 (USD MILLION)
  • TABLE 166 CHINA: MICROSCOPE CAMERA MARKET, BY RESOLUTION, 2022–2029 (USD MILLION)
  • TABLE 167 CHINA: MICROSCOPE CAMERA MARKET, BY APPLICATION, 2022–2029 (USD MILLION)
  • TABLE 168 CHINA: MICROSCOPE CAMERA MARKET, BY END USER, 2022–2029 (USD MILLION)
  • TABLE 169 INDIA: MICROSCOPE CAMERA MARKET, BY TYPE, 2022–2029 (USD MILLION)
  • TABLE 170 INDIA: MICROSCOPE CAMERA MARKET, BY SENSOR TYPE, 2022–2029 (USD MILLION)
  • TABLE 171 INDIA: MICROSCOPE CAMERA MARKET, BY RESOLUTION, 2022–2029 (USD MILLION)
  • TABLE 172 INDIA: MICROSCOPE CAMERA MARKET, BY APPLICATION, 2022–2029 (USD MILLION)
  • TABLE 173 INDIA: MICROSCOPE CAMERA MARKET, BY END USER, 2022–2029 (USD MILLION)
  • TABLE 174 REST OF ASIA PACIFIC: MICROSCOPE CAMERA MARKET, BY TYPE, 2022–2029 (USD MILLION)
  • TABLE 175 REST OF ASIA PACIFIC: MICROSCOPE CAMERA MARKET, BY SENSOR TYPE, 2022–2029 (USD MILLION)
  • TABLE 176 REST OF ASIA PACIFIC: MICROSCOPE CAMERA MARKET, BY RESOLUTION, 2022–2029 (USD MILLION)
  • TABLE 177 REST OF ASIA PACIFIC: MICROSCOPE CAMERA MARKET, BY APPLICATION, 2022–2029 (USD MILLION)
  • TABLE 178 REST OF ASIA PACIFIC: MICROSCOPE CAMERA MARKET, BY END USER, 2022–2029 (USD MILLION)
  • TABLE 179 LATIN AMERICA: MICROSCOPE CAMERA MARKET, BY COUNTRY, 2022–2029 (USD MILLION)
  • TABLE 180 LATIN AMERICA: MICROSCOPE CAMERA MARKET, BY TYPE, 2022–2029 (USD MILLION)
  • TABLE 181 LATIN AMERICA: MICROSCOPE CAMERA MARKET, BY SENSOR TYPE, 2022–2029 (USD MILLION)
  • TABLE 182 LATIN AMERICA: MICROSCOPE CAMERA MARKET, BY RESOLUTION, 2022–2029 (USD MILLION)
  • TABLE 183 LATIN AMERICA: MICROSCOPE CAMERA MARKET, BY APPLICATION, 2022–2029 (USD MILLION)
  • TABLE 184 LATIN AMERICA: MICROSCOPE CAMERA MARKET, BY END USER, 2022–2029 (USD MILLION)
  • TABLE 185 BRAZIL: MICROSCOPE CAMERA MARKET, BY TYPE, 2022–2029 (USD MILLION)
  • TABLE 186 BRAZIL: MICROSCOPE CAMERA MARKET, BY SENSOR TYPE, 2022–2029 (USD MILLION)
  • TABLE 187 BRAZIL: MICROSCOPE CAMERA MARKET, BY RESOLUTION, 2022–2029 (USD MILLION)
  • TABLE 188 BRAZIL: MICROSCOPE CAMERA MARKET, BY APPLICATION, 2022–2029 (USD MILLION)
  • TABLE 189 BRAZIL: MICROSCOPE CAMERA MARKET, BY END USER, 2022–2029 (USD MILLION)
  • TABLE 190 MEXICO: MICROSCOPE CAMERA MARKET, BY TYPE, 2022–2029 (USD MILLION)
  • TABLE 191 MEXICO: MICROSCOPE CAMERA MARKET, BY SENSOR TYPE, 2022–2029 (USD MILLION)
  • TABLE 192 MEXICO: MICROSCOPE CAMERA MARKET, BY RESOLUTION, 2022–2029 (USD MILLION)
  • TABLE 193 MEXICO: MICROSCOPE CAMERA MARKET, BY APPLICATION, 2022–2029 (USD MILLION)
  • TABLE 194 MEXICO: MICROSCOPE CAMERA MARKET, BY END USER, 2022–2029 (USD MILLION)
  • TABLE 195 REST OF LATIN AMERICA MICROSCOPE CAMERA MARKET, BY TYPE, 2022–2029 (USD MILLION)
  • TABLE 196 REST OF LATIN AMERICA: MICROSCOPE CAMERA MARKET, BY SENSOR TYPE, 2022–2029 (USD MILLION)
  • TABLE 197 REST OF LATIN AMERICA: MICROSCOPE CAMERA MARKET, BY RESOLUTION, 2022–2029 (USD MILLION)
  • TABLE 198 REST OF LATIN AMERICA: MICROSCOPE CAMERA MARKET, BY APPLICATION, 2022–2029 (USD MILLION)
  • TABLE 199 REST OF LATIN AMERICA: MICROSCOPE CAMERA MARKET, BY END USER, 2022–2029 (USD MILLION)
  • TABLE 200 MIDDLE EAST & AFRICA: MICROSCOPE CAMERA MARKET, BY TYPE, 2022–2029 (USD MILLION)
  • TABLE 201 MIDDLE EAST & AFRICA: MICROSCOPE CAMERA MARKET, BY SENSOR TYPE, 2022–2029 (USD MILLION)
  • TABLE 202 MIDDLE EAST & AFRICA: MICROSCOPE CAMERA MARKET, BY RESOLUTION, 2022–2029 (USD MILLION)
  • TABLE 203 MIDDLE EAST & AFRICA: MICROSCOPE CAMERA MARKET, BY APPLICATION, 2022–2029 (USD MILLION)
  • TABLE 204 MIDDLE EAST & AFRICA: MICROSCOPE CAMERA MARKET, BY END USER, 2022–2029 (USD MILLION)
  • TABLE 205 GCC COUNTRIES: MICROSCOPE CAMERA MARKET, BY TYPE, 2022–2029 (USD MILLION)
  • TABLE 206 GCC COUNTRIES: MICROSCOPE CAMERA MARKET, BY SENSOR TYPE, 2022–2029 (USD MILLION)
  • TABLE 207 GCC COUNTRIES: MICROSCOPE CAMERA MARKET, BY RESOLUTION, 2022–2029 (USD MILLION)
  • TABLE 208 GCC COUNTRIES: MICROSCOPE CAMERA MARKET, BY APPLICATION, 2022–2029 (USD MILLION)
  • TABLE 209 GCC COUNTRIES: MICROSCOPE CAMERA MARKET, BY END USER, 2022–2029 (USD MILLION)
  • TABLE 210 OVERVIEW OF STRATEGIES DEPLOYED BY KEY PLAYERS IN MICROSCOPE CAMERA MARKET
  • TABLE 211 MICROSCOPE CAMERA MARKET: DEGREE OF COMPETITION
  • TABLE 212 MICROSCOPE CAMERA MARKET: TYPE FOOTPRINT
  • TABLE 213 MICROSCOPE CAMERA MARKET: SENSOR TYPE FOOTPRINT
  • TABLE 214 MICROSCOPE CAMERA MARKET: APPLICATION FOOTPRINT
  • TABLE 215 MICROSCOPE CAMERA MARKET: REGION FOOTPRINT
  • TABLE 216 MICROSCOPE CAMERA MARKET: DETAILED LIST OF KEY STARTUPS/SMES
  • TABLE 217 MICROSCOPE CAMERA MARKET: COMPETITIVE BENCHMARKING OF KEY STARTUPS/SMES
  • TABLE 218 MICROSCOPE CAMERA MARKET: PRODUCT LAUNCHES, JANUARY 2021–JULY 2024
  • TABLE 219 MICROSCOPE CAMERA MARKET: DEALS, JANUARY 2021–JULY 2024
  • TABLE 220 LEICA MICROSYSTEMS (DANAHER CORPORATION): COMPANY OVERVIEW
  • TABLE 221 LEICA MICROSYSTEMS (DANAHER CORPORATION): PRODUCTS/SERVICES/ SOLUTIONS OFFERED
  • TABLE 222 NIKON CORPORATION: COMPANY OVERVIEW
  • TABLE 223 NIKON CORPORATION: PRODUCTS/SERVICES/SOLUTIONS OFFERED
  • TABLE 224 NIKON CORPORATION: PRODUCT LAUNCHES, JANUARY 2021–JULY 2024
  • TABLE 225 CARL ZEISS AG: COMPANY OVERVIEW
  • TABLE 226 CARL ZEISS AG: PRODUCTS/SERVICES/SOLUTIONS OFFERED
  • TABLE 227 CARL ZEISS AG: DEALS, JANUARY 2021–JULY 2024
  • TABLE 228 EVIDENT: COMPANY OVERVIEW
  • TABLE 229 EVIDENT: PRODUCTS/SERVICES/SOLUTIONS OFFERED
  • TABLE 230 EVIDENT: PRODUCT LAUNCHES, JANUARY 2021–JULY 2024
  • TABLE 231 EVIDENT: DEALS, JANUARY 2021–JULY 2024
  • TABLE 232 TELEDYNE TECHNOLOGIES: COMPANY OVERVIEW
  • TABLE 233 TELEDYNE TECHNOLOGIES: PRODUCTS/SERVICES/SOLUTIONS OFFERED
  • TABLE 234 JENOPTIK AG: COMPANY OVERVIEW
  • TABLE 235 JENOPTIK AG: PRODUCTS/SERVICES/SOLUTIONS OFFERED
  • TABLE 236 JENOPTIK AG: EXPANSIONS, JANUARY 2021–JULY 2024
  • TABLE 237 HAMAMATSU PHOTONICS KK: COMPANY OVERVIEW
  • TABLE 238 HAMAMATSU PHOTONICS KK: PRODUCTS/SERVICES/SOLUTIONS OFFERED
  • TABLE 239 BASLER AG: COMPANY OVERVIEW
  • TABLE 240 BASLER AG: PRODUCTS/SERVICES/SOLUTIONS OFFERED
  • TABLE 241 EXCELITAS TECHNOLOGIES CORP.: COMPANY OVERVIEW
  • TABLE 242 EXCELITAS TECHNOLOGIES CORP.: PRODUCTS/SERVICES/SOLUTIONS OFFERED
  • TABLE 243 THORLABS, INC.: COMPANY OVERVIEW
  • TABLE 244 THORLABS, INC.: PRODUCTS/SERVICES/SOLUTIONS OFFERED
  • TABLE 245 KEYENCE CORPORATION: COMPANY OVERVIEW
  • TABLE 246 ANDOR TECHNOLOGY: COMPANY OVERVIEW
  • TABLE 247 SPOT IMAGING: COMPANY OVERVIEW
  • TABLE 248 EUROMEX MICROSCOPEN BV: COMPANY OVERVIEW
  • TABLE 249 MOTIC: COMPANY OVERVIEW
  • TABLE 250 DINO-LITE DIGITAL MICROSCOPE: COMPANY OVERVIEW
  • TABLE 251 MEIJI TECHNO CO.: COMPANY OVERVIEW
  • TABLE 252 LABOMED, INC.: COMPANY OVERVIEW
  • TABLE 253 DELTAPIX: COMPANY OVERVIEW
  • TABLE 254 ADIMEC ADVANCED IMAGE SYSTEMS BV: COMPANY OVERVIEW
  • TABLE 255 XIMEA GMBH: COMPANY OVERVIEW
  • TABLE 256 DAGE-MTI: COMPANY OVERVIEW
  • TABLE 257 GT VISION LTD.: COMPANY OVERVIEW
  • TABLE 258 TUCSEN PHOTONICS CO.: COMPANY OVERVIEW
  • TABLE 259 RAPTOR PHOTONICS: COMPANY OVERVIEW
LIST OF FIGURES
 
  • FIGURE 1 MICROSCOPE CAMERA MARKET SEGMENTATION
  • FIGURE 2 MICROSCOPE CAMERA MARKET: YEARS CONSIDERED
  • FIGURE 3 MICROSCOPE CAMERA MARKET: RESEARCH DESIGN
  • FIGURE 4 KEY DATA FROM SECONDARY SOURCES
  • FIGURE 5 KEY PRIMARY SOURCES: DEMAND AND SUPPLY SIDES
  • FIGURE 6 MICROSCOPE CAMERA MARKET: KEY INSIGHTS FROM PRIMARY EXPERTS
  • FIGURE 7 BREAKDOWN OF PRIMARIES: SUPPLY- AND DEMAND-SIDE PARTICIPANTS
  • FIGURE 8 BREAKDOWN OF PRIMARIES: BY COMPANY TYPE, DESIGNATION, AND REGION
  • FIGURE 9 COMPANY REVENUE ESTIMATION APPROACH
  • FIGURE 10 CAGR PROJECTIONS: SUPPLY-SIDE ANALYSIS
  • FIGURE 11 MICROSCOPE CAMERA MARKET: TOP-DOWN APPROACH
  • FIGURE 12 MICROSCOPE CAMERA MARKET: DATA TRIANGULATION METHODOLOGY
  • FIGURE 13 MICROSCOPE CAMERA MARKET, BY CAMERA TYPE, 2024 VS. 2029(USD MILLION)
  • FIGURE 14 MICROSCOPE CAMERA MARKET, BY SENSOR TYPE, 2024 VS. 2029(USD MILLION)
  • FIGURE 15 MICROSCOPE CAMERA MARKET, BY RESOLUTION, 2024 VS. 2029(USD MILLION)
  • FIGURE 16 MICROSCOPE CAMERA MARKET, BY APPLICATION, 2024 VS. 2029 (USD MILLION)
  • FIGURE 17 MICROSCOPE CAMERA MARKET, BY END USER, 2024 VS. 2029 (USD MILLION)
  • FIGURE 18 MICROSCOPE CAMERA MARKET: GEOGRAPHICAL SNAPSHOT
  • FIGURE 19 TECHNOLOGICAL ADVANCEMENTS IN MICROSCOPE CAMERAS AND INCREASING CHRONIC DISEASE PREVALENCE TO DRIVE MARKET
  • FIGURE 20 COLOR CAMERA SEGMENT TO DOMINATE MARKET TILL 2029
  • FIGURE 21 CMOS SEGMENT TO HOLD LARGEST MARKET SHARE DURING FORECAST PERIOD
  • FIGURE 22 HD SEGMENT TO ACCOUNT FOR LARGER SHARE
  • FIGURE 23 PHARMACEUTICAL & BIOPHARMACEUTICAL RESEARCH TO RETAIN DOMINANCE IN APPLICATIONS MARKET
  • FIGURE 24 PHARMA & BIOTECH COMPANIES AND HOSPITAL & DIAGNOSTIC LABS TO HOLD LARGEST SHARES
  • FIGURE 25 APAC TO REGISTER HIGHEST GROWTH RATE DURING FORECAST PERIOD
  • FIGURE 26 MICROSCOPE CAMERA MARKET: DRIVERS, RESTRAINTS, OPPORTUNITIES, AND CHALLENGES
  • FIGURE 27 MICROSCOPE CAMERA MARKET: ECOSYSTEM MAP
  • FIGURE 28 PATENT APPLICATIONS FOR MICROSCOPE CAMERA MARKET, JANUARY 2013–DECEMBER 2023
  • FIGURE 29 MICROSCOPE CAMERA MARKET: VALUE CHAIN ANALYSIS
  • FIGURE 30 MICROSCOPE CAMERA MARKET: SUPPLY CHAIN ANALYSIS
  • FIGURE 31 MICROSCOPE CAMERA MARKET: PORTER’S FIVE FORCES ANALYSIS
  • FIGURE 32 INFLUENCE OF KEY STAKEHOLDERS ON BUYING PROCESS
  • FIGURE 33 KEY BUYING CRITERIA FOR MICROSCOPE CAMERA
  • FIGURE 34 PREMARKET NOTIFICATION: 510(K) APPROVALS FOR MEDICAL DEVICES
  • FIGURE 35 CANADA: REGULATORY APPROVAL PROCESS FOR MEDICAL DEVICES
  • FIGURE 36 EUROPE: CE APPROVAL PROCESS FOR MEDICAL DEVICES
  • FIGURE 37 TRENDS/DISRUPTIONS IMPACTING CUSTOMERS’ BUSINESSES
  • FIGURE 38 NORTH AMERICA: MICROSCOPE CAMERA MARKET SNAPSHOT
  • FIGURE 39 ASIA PACIFIC: MICROSCOPE CAMERA MARKET SNAPSHOT
  • FIGURE 40 REVENUE ANALYSIS OF KEY PLAYERS IN MICROSCOPE CAMERA MARKET (2021–2023)
  • FIGURE 41 MARKET SHARE ANALYSIS OF KEY PLAYERS IN MICROSCOPE CAMERA MARKET (2023)
  • FIGURE 42 MICROSCOPE CAMERA MARKET: COMPANY EVALUATION MATRIX (KEY PLAYERS), 2023
  • FIGURE 43 MICROSCOPE CAMERA MARKET: COMPANY FOOTPRINT
  • FIGURE 44 MICROSCOPE CAMERA MARKET: COMPANY EVALUATION MATRIX (STARTUPS/SMES), 2023
  • FIGURE 45 EV/EBITDA OF KEY VENDORS
  • FIGURE 46 YEAR-TO-DATE (YTD) PRICE TOTAL RETURN AND 5-YEAR STOCK BETA OF KEY VENDORS
  • FIGURE 47 MICROSCOPE CAMERA MARKET: BRAND/PRODUCT COMPARATIVE ANALYSIS
  • FIGURE 48 LEICA MICROSYSTEMS (DANAHER CORPORATION): COMPANY SNAPSHOT (2023)
  • FIGURE 49 NIKON CORPORATION: COMPANY SNAPSHOT (2023)
  • FIGURE 50 CARL ZEISS AG: COMPANY SNAPSHOT (2023)
  • FIGURE 51 TELEDYNE TECHNOLOGIES: COMPANY SNAPSHOT (2023)
  • FIGURE 52 JENOPTIK AG: COMPANY SNAPSHOT (2023)
  • FIGURE 53 HAMAMATSU PHOTONICS KK: COMPANY SNAPSHOT (2023)
  • FIGURE 54 BASLER AG: COMPANY SNAPSHOT (2023)

The objective of the study is analyzing the key market dynamics such as drivers, opportunities, challenges, restraints, and key player strategies. To track companies’ developments such as acquisitions, product launches, expansions, agreements and partnerships of the leading players, the competitive landscape of the microscope camera market to analyzes market players on various parameters within the broad categories of business and product strategy. Top-down and bottom-up approaches were used to estimate the market size. To estimate the market size of segments and subsegments the market breakdown and data triangulation were used.

The four steps involved in estimating the market size are

Secondary Research

In the secondary research process, various secondary sources such as annual reports, press releases & investor presentations of companies, white papers, certified publications, articles by recognized authors, gold-standard & silver-standard websites, regulatory bodies, and databases (such as D&B Hoovers, Bloomberg Business, and Factiva) were referred to identify and collect information for this study.

Primary Research

In the primary research process, various sources from both the supply and demand sides were interviewed to obtain qualitative and quantitative information for this report. Primary sources were mainly industry experts from the core and related industries and preferred suppliers, manufacturers, distributors, service providers, technology developers, researchers, and organizations related to all segments of this industry’s value chain. In-depth interviews were conducted with various primary respondents, including key industry participants, subject-matter experts, C-level executives of key market players, and industry consultants, to obtain and verify critical qualitative and quantitative information as well as assess prospects.

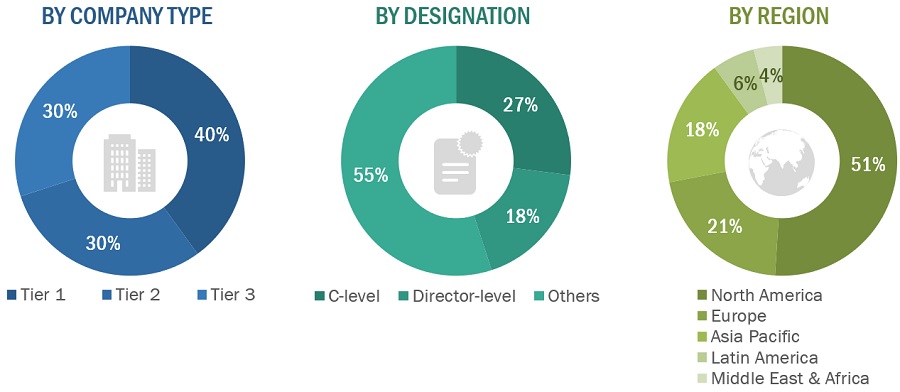
The following is a breakdown of the primary respondents:

Breakdown of Primary Participants:
Microscope Camera Market Size, and Share

Note 1: Others include sales managers, marketing managers, and product managers.

Note 2: Companies are classified into tiers based on their total revenues. As of 2022, Tier 1 = >USD 100 million, Tier 2 = USD 10 million to USD 100 million, and Tier 3 = <USD 10 million.

To know about the assumptions considered for the study, download the pdf brochure

COMPANY NAME

DESIGNATION

 Leica Microsystems (Danaher Corporation) (US)

Marketing Manager

 Nikon Corporation (Japan)

Senior Product Manager

Carl Zeiss AG (Germany)

Marketing Manager

Market Size Estimation

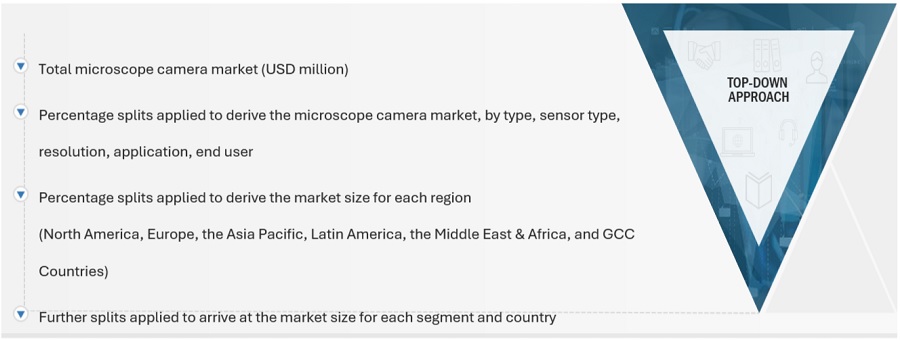
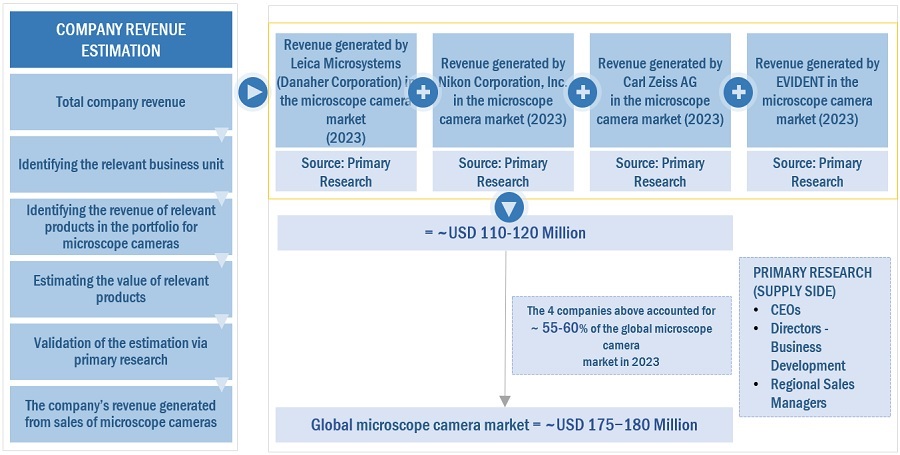
Both top-down and bottom-up approaches were used to estimate and validate the home healthcare market's total size. These methods were also used extensively to estimate the size of various subsegments in the market. The research methodology used to estimate the market size includes the following:

  • The key players in the industry have been identified through extensive secondary research
  • The revenues generated by leading players operating in the microscope camera market have been determined through primary and secondary research.
  • All percentage shares, splits, and breakdowns have been determined using secondary sources and verified through primary sources

Global microscope camera Market Size: Bottom-Up Approach
               

Microscope Camera Market Size, and Share

To know about the assumptions considered for the study, Request for Free Sample Report

Global Microscope Camera Market Size: Top-Down Approach

Microscope Camera Market Size, and Share

Microscope Camera Market Size, and Share

Data Triangulation

After arriving at the overall market size applying the process mentioned above, the total market was split into several segments and subsegments. To complete the overall market engineering process and arrive at the exact statistics for all segments and subsegments, data triangulation and market breakdown procedures were employed, wherever applicable. The data was triangulated by studying various factors and trends from both the demand and supply sides.

Market Definition

Scientific microscopes are used for countless purposes, from tissue analysis to examining forensic evidence and deciphering atomic structures. Although the uses vary, the construction of scientific microscopes includes an essential requirement– a superior micro camera. The microscope camera is used to magnify minute and rapid objects using artificial light.

Key Stakeholders

  • Senior Management
  • End User
  • Finance/Procurement Department
  • R&D Department

Report Objectives

  • To define, describe, segment, and forecast the global microscope camera market by Type, sensor type, resolution, application, end-user, and region.
  • To provide detailed information regarding the major factors influencing the market growth (such as drivers, restraints, opportunities, and challenges)
  • To analyze the micro markets with respect to individual growth trends, prospects, and contributions to the overall microscope camera market
  • To analyze market opportunities for stakeholders and provide details of the competitive landscape for key players
  • To forecast the size of the market segments with respect to five regions, namely, North America, Europe, the Asia Pacific, Latin America, the Middle East & Africa and GCC Countries.
  • To profile the key players and comprehensively analyze their product portfolios, market positions, and core competencies
  • To track and analyze company developments such as product launches & approvals, partnerships, acquisitions, agreements, and other developments
  • To benchmark players within the market using the proprietary Competitive Leadership Mapping framework, which analyzes market players on various parameters within the broad categories of business and product excellence

Available Customizations

MarketsandMarkets offers the following customizations for this market report

Country Information

  • Additional country-level analysis of the microscope camera market

Company profiles

  • Additional five company profiles of players operating in the microscope camera market.

Product Analysis

  • Product matrix, which provides a detailed comparison of the product portfolio of each company in the microscope camera market

Previous Versions of this Report

"Our USP is "providing game-changing business opportunities reports with free customization" - so please feel free to provide us with your specific areas of interest / business challenges in much greater detail !!"

We appreciate your interest in this report. Once you fill out the form, you'll be immediately directed to an exclusive solution tailored to your needs. This high-value offering can help boost your revenue by 30% - a must-see opportunity for anyone looking to maximize growth.


By clicking the "Submit" button, you are agreeing to the Terms of Use and Privacy Policy.

Custom Market Research Services

We Will Customise The Research For You, In Case The Report Listed Above Does Not Meet With Your Requirements

Get 10% Free Customisation

Growth opportunities and latent adjacency in Microscope Camera Market

DMCA.com Protection Status