Microplastic Detection Market

Report Code CH 9191
Published in Oct, 2024, By MarketsandMarkets™
Download PDF

Choose License Type

Buy Report Now Inquire Before Buying

Microplastic Detection Market by Type (Polyethylene, Polytetrafluoroethylene), technology (Micro-Raman Spectroscopy, Ftir Spectroscopy), Medium (Water, Soil), Size ( < 1mm, 1-3mm), End-Use Industry (Water Treatment, FnB) - Global Forecast to 2029

Overview

The Microplastic Detection market size is projected to grow from USD 4.76 billion in 2024 to USD 6.49 billion by 2029, registering a CAGR of 6.4% during the forecast period.

The microplastic detection market constitutes various technologies, tools, and services concerned with detecting and quantifying and analyzing the presence of microplastics-small plastic particles smaller than 5mm-both in aquatic environments, as well as soil and air. This market comprises the analytical techniques, such as spectroscopy (Fourier-transform infrared spectroscopy, Raman spectroscopy), microscopy, and chemical extraction methods that help researchers and regulatory bodies identify whether microplastics are present in samples.

Several interrelated factors are driving the robust growth in the microplastic detection market. The pressures from governmental and environmental organizations on industries and research institutions to adopt advanced detection technologies are ever increasing. There are growing regulations related to monitoring and mitigating plastic pollution, which are compelling sectors like food and beverages, cosmetics, and environmental monitoring to invest in reliable detection methods to ensure compliance and safe public health.

Moreover, awareness among the public about the ecological and health consequences of microplastics is further boosting the demand for effective monitoring solutions.

Attractive Opportunities in the Microplastic Detection Market

Asia Pacific

The market in Asia Pacific is expected to witness high growth during the forecast period due to increasing environmental regulations, rising awareness of microplastic pollution from industries such as textiles, food & beverages. and packaging.

Heightened public awareness of microplastic pollution, and growing research funding for environmental and health impact are key factors driving the market growth.

Innovative technology development such as implementation of Machine learning and AI in the detection methods are factors expected to provide lucrative opportunities for market players.

The Asia Pacific microplastic detection market is expected to be worth USD 2.63 billion by 2029, growing at CAGR of 6.5% during the forecast period.

High detection costs and insufficient standardization are expected to pose a challenge to the growth of this market.

Global Microplastic Detection Market Dynamics

Driver: Rising public concern over plastic pollution and its effects on ecosystem and human health.

Public concern over plastic pollution has increased demand in the market for microplastic detection technology, which is determined largely by rising awareness of its devastating impacts on ecosystems and humans. Plastic waste in oceans, rivers, and terrestrial ecosystems doesn't stop filling environments; therefore, communities become more aware of the possible risks that microplastics pose by entering food chains and affecting biodiversity. Heightened public pressure for cleaner environments has, therefore, placed plastic waste management practices under increased scrutiny, with governments and organizations eager to force tighter regulations on plastic usage and disposal. Such a regulatory environment creates an immense need for the monitoring and detection of microplastics, followed consequently by the need for effective detection technologies.

Restraint: Absence of standardized detection method hinders market expansion

The lack of standardized grades in microplastic detection technology significantly hinders market demand due to inconsistent data quality and comparability among different studies and applications. In the absence of such standards, researchers and regulatory organizations face difficulties in authenticating research findings that can eventually have an impact on microplastic identification as well as the quantification of microplastics. In addition, the lack of standardized methodologies could discourage possible investors and stakeholders as they may not be guaranteed of the reliability of the market technologies available for exploitation. Such uncertainty could bring about reluctance in the adoption of microplastic detection solutions, because businesses and research institutions may fear to invest in those technologies that do not adhere to recognized standards.


Opportunities: Advancement in machine learning and AI to enhance the accuracy and speed of microplastic detection methods

Development in machine learning and artificial intelligence offers major prospects for enhancing the precision and speed of detection methods for microplastics. Such technologies can analyze large datasets using various detection methods, thus allowing for the quick identification and classification of microplastics in complicated samples. Machine learning algorithms can be trained to identify characteristic patterns and features associated with the various types of microplastics, hence ensuring greater efficiency in the accuracy of identification and probably excluding human error that could result from manual analysis. Besides, AI-driven techniques can be implemented to streamline detection processes through automated routine tasks to allow further research skills to focus more deeply on intricate aspects of their studies. This makes it even more efficient in microplastic analysis, hastening the speed at which results can be generated, thus making it possible for thorough surveys and studies to be carried out in a much shorter period.

Challenges: Quantifying microplastics due to diverse size and shapes

Quantifying microplastics certainly poses a great challenge to the detection market primarily because of the wide range of sizes and shapes these particles can take. Microplastics are generally defined as plastic fragments smaller than 5mm, but vary in size from tiny beads to larger irregularly shaped pieces, each presenting unique detection challenges. Another significant problem related to the use of conventional detection methods is that microplastics have a wide range of sizes, most of the conventional methods being optimized for specific particle sizes or shapes. Consequently, microplastics in larger size ranges are more easily separated and analyzed, while smaller particles may go undetected, leading to underreporting and misinterpretation of the level of microplastic pollution. Besides, the forms of microplastics are not conventional and make quantification a bit tough since some are not accommodated by traditional measurement models. This will in turn effect the accuracy in volumes and surface area estimations.

Global Microplastic Detection Market Ecosystem Analysis

Prominent companies in this market include well-established, financially stable manufacturers of Microplastic Detection market. Analyzing the ecosystem reveals how many entities collaborate or compete to address the worldwide issue of microplastic contamination. The value of ecosystem analysis in the microplastic detection market is its ability to uncover essential relationships among key stakeholders. It identifies the variables driving technological innovation, regulatory pressures, and market demand. These companies have been operating in the market for several years and possess a diversified product portfolio and strong global sales and marketing networks.


Based on type, Polytetrafluoroethylene is projected to account for the second largest share of the Microplastic Detection market.

Polytetrafluorethylene (PTFE) accounts for the second-largest share in the microplastic detection market by type segment, owing to its widespread use and unique properties. PTFE is extensively utilized across various industries because it possesses extraordinary chemical resistance and has non-stick properties along with the high thermal stability. Therefore, it holds a great preference in the manufacturing industries of non-stick cookware, industrial lubricants, gaskets, and seals. These materials degrade over time, releasing microplastics into the environment. In addition, due to a very low friction coefficient, Polytetrafluoroethylene is used in coatings and films, which increases the chances of microplastic pollution through wear and tear. Its widespread use, persistence, and possible environmental and health implications make Polytetrafluoroethylene a dominant type in the microplastic detection market.

Based on technology, Ftir Spectroscopy is projected to account for the second largest share of the Microplastic Detection market.

Fourier Transform Infrared (FTIR) spectroscopy is widely used in the microplastic detection market because of its high-precision identification ability and versatility. It serves as the second largest market share holder in the technology segment because of its ability to provide comprehensive molecular information about microplastic particles. FTIR spectroscopy works based on the principle that infrared absorption spectra of particles can be measured so that various polymer types can be identified with their unique vibrational modes. This technique is particularly useful in microplastic analysis for complex environmental samples, such as water, soil, and air, where distinctions among different polymer compositions are crucial. A significant benefit of FTIR is that it is non-destructive, so samples can be kept for further analysis.

Based on medium, Soil is projected to account for the second largest share of the Microplastic Detection market.

The second-largest medium within the Microplastic Detection market is soil, as terrestrial ecosystems are increasingly being recognized as significant reservoirs for microplastic pollution. The detection and quantification of microplastics in soil are crucial to determine the scope of contamination and associated ecological impacts. The presence of this soil, organic matter, minerals, and various sizes of particles adds specific challenges for the analysis of microplastics. Furthermore, atmospheric deposition, runoff, and the irrigation of contaminated water into the soil lead to widespread distribution of microplastics within terrestrial ecosystems. Detection and quantification of microplastic in soil matrix which includes organic matter, minerals, and biological organisms are challenging yet necessary.

Based on size, 1-3mm is projected to account for the second largest share of the Microplastic Detection market.

Microplastics in the size range of 1-3 mm constitute the second-largest share in the size segment of the microplastic detection market because of the widespread prevalence and considerable ecological impact. These particles, as such, are relatively large and hence more observable and easier to collect than smaller microplastics, thereby enhancing their detectability and quantification in the water bodies, soil, and air. Formation of these microplastics may result from the fragmentation of larger plastic objects, such as bottles and bags, as well as other primary sources like pre-production pellets or microbeads used in personal care products. These microplastic can ingested by a wide range of organisms, from small invertebrates to larger marine and terrestrial species with potential for physical harm, obstructed digestion, and exposure to toxic substances adsorbed onto the microplastic surface. The ecological hazards presented by this size category have led to a number of studies and environmental assessments, thus increasing the demand for detection technologies suited to this size range.

Based on end-use industry, Food & beverage is projected to account for the second largest share of the Microplastic Detection market.

The food and beverages industry is the second-largest in the market for microplastic detection, mainly because of increased consumer awareness and regulatory pressure over plastic contamination in foodstuffs. Microplastics have been increasingly found in several food items such as seafood, salt, bottled water, and even beer, which raises serious issues regarding health and environment. This widespread presence is attributed to the continued massive use of plastic packaging and plastic pollution across the world that has greatly invaded food chains. The demand for transparency in food production and a conscious awareness of food safety by consumers call for pressure on the industry to monitor and reduce plastic contamination. As a result of this, regulatory authorities are implementing stringent regulation to govern food safety, resulting in investment in next-generation microplastic detection technologies by companies to ensure they meet the required standards.

North America is expected to be the second largest region during the forecast period.

North America is expected to be the second largest market share in terms of microplastic detection due to some key factors. Some of these factors include a robust regulatory framework, high research and development activities, and a higher degree of environmental awareness among consumer communities and industries. The stringent environmental protection and food safety regulations and standards applied in the United States and Canada have created demand for advanced technologies in microplastic detection. Agencies such as the US Environmental Protection Agency (EPA) and Food and Drug Administration (FDA) are highly increasing interest in microplastics implications to water sources, food products, and consumer goods.

HIGHEST CAGR MARKET IN 2024-2029
CHINA FASTEST GROWING MARKET IN THE REGION

Recent Developments of Microplastic Detection Market

  • In June 2021, Oxford Instruments completed the acquisition of WITec GmbH, a prominent provider of Raman microscopy solutions, for a USD 45 million.
  • In June 2021, Thermo Fisher Scientific Inc. introduced the Attune CytPix Flow Cytometer, an innovative instrument that integrates imaging capabilities with traditional flow cytometry.
  • In January 2022, Agilent Technologies, Inc. significantly expanded its manufacturing center in Shanghai, to address the increasing demand for its advanced liquid chromatography, spectrometer, and mass spectrometry systems in China.
  • In January 2024, Bruker acquired Nanophoton Corporation, a prominent Japanese company specializing in advanced research Raman microscopy systems.
  • In February 2024, Bruker acquired Nanophoton Corporation, a prominent Japanese company specializing in advanced research Raman microscopy systems.
  • In February 2024, Shimadzu launched the LCMS-TQ RX Series, a new line of high-performance liquid chromatograph mass spectrometers (LC-MS) designed to enhance analytical capabilities across various industries, including pharmaceuticals, environmental testing, and food safety.
  • In March 2024, Danaher Corporation introduced the CytoFLEX nano Flow Cytometer, an instrument designed specifically for nanoparticle analysis, capable of detecting particles as small as 40 nm.
  • In April 2024, JEOL Ltd. launched the JMS-T2000GC AccuTOF™ GC-Alpha, gas chromatograph-time-of-flight mass spectrometer (GC-TOFMS) to redefine mass spectrometry with its superior performance and user-friendly operation.

Key Market Players

KEY PLAYERS IN THE MICROPLASTIC DETECTION MARKET INCLUDE

Scope of the Report

Report Metric Details
Years considered for the study 2020-2029
Base Year 2023
Forecast period 2024-2029
Units considered Value (USD Million/Billion)
Segments Type, Technology, Medium, Size, End-Use Industry, and Region
Regions Asia Pacific, North America, Europe, Middle East & Africa, and South America


Key Questions Addressed by the Report

What are the factors influencing the growth of the Microplastic Detection market?
The growth of this market can be attributed to increasing concerns regarding plastic pollution and its effect of human health and environment. The broadening use of Microplastic Detection technologies in water treatment, food & beverages, packaging, and textiles ensures sustained demand, further fueling market growth.
Which are the key factors driving the Microplastic Detection market?
Increasing concern for environmental and human health, technological advancements, economic incentives, and the emphasis on the circular economy.
Who are the major manufacturers?
Major market players Thermo Fisher Scientific Inc. (US), Agilent Technologies, Inc. (US), Bruker (US), PerkinElmer (US), JEOL Ltd. (Japan), Shimadzu Corporation (Japan), Oxford Instruments (UK), Endress+Hauser Group Services AG (Switzerland), Danaher Corporation (US), METTLER TOLEDO (Switzerland), ZEISS Group (Germany), among others.
What will be the growth prospects of the Microplastic Detection market?
Technological advancement such as implementation of Machine learning and AI in Microplastic Detection technologies further bolster the market.
Which end-use industry has the largest market share in the Microplastic Detection market?
Water Treatment, end-use industry covers the largest market share in the market.


Personalize This Research

  • Triangulate with your Own Data
  • Get Data as per your Format and Definition
  • Gain a Deeper Dive on a Specific Application, Geography, Customer or Competitor
  • Any level of Personalization
Request A Free Customisation

Let Us Help You

  • What are the Known and Unknown Adjacencies Impacting the Microplastic Detection Market
  • What will your New Revenue Sources be?
  • Who will be your Top Customer; what will make them switch?
  • Defend your Market Share or Win Competitors
  • Get a Scorecard for Target Partners
Customized Workshop Request

Table Of Contents

Exclusive indicates content/data unique to MarketsandMarkets and not available with any competitors.

TITLE
PAGE NO
INTRODUCTION
24
RESEARCH METHODOLOGY
28
EXECUTIVE SUMMARY
40
PREMIUM INSIGHTS
45
MARKET OVERVIEW
47
  • 5.1 INTRODUCTION
  • 5.2 MARKET DYNAMICS
    DRIVERS
    - Rising public concerns over effects of plastic pollution on ecosystems and health
    - Advancements in spectroscopy, microscopy, and sensor technologies
    RESTRAINTS
    - Absence of standardized detection methods
    OPPORTUNITIES
    - Advancements in machine learning and AI
    - Development of low-cost, portable detection systems for real-time monitoring and field studies
    CHALLENGES
    - Achieving required sensitivity and resolution with single analytical technology
    - Inconsistencies in detection and arbitrary reporting due to diverse microplastics sizes and shapes
  • 5.3 GENERATIVE AI
    INTRODUCTION
    IMPACT ON MICROPLASTIC DETECTION MARKET
INDUSTRY TRENDS
54
  • 6.1 INTRODUCTION
  • 6.2 TRENDS/DISRUPTIONS IMPACTING CUSTOMER BUSINESS
  • 6.3 VALUE CHAIN ANALYSIS
  • 6.4 INVESTMENT AND FUNDING SCENARIO
  • 6.5 PRICING ANALYSIS
    AVERAGE SELLING PRICE TREND, BY REGION
    AVERAGE SELLING PRICE TREND, BY TYPE
    AVERAGE SELLING PRICE TREND OF KEY PLAYERS, BY TYPE
  • 6.6 ECOSYSTEM ANALYSIS
  • 6.7 TECHNOLOGY ANALYSIS
    KEY TECHNOLOGIES
    COMPLEMENTARY TECHNOLOGIES
    ADJACENT TECHNOLOGIES
  • 6.8 PATENT ANALYSIS
    METHODOLOGY
    GRANTED PATENTS
    INSIGHTS
    LEGAL STATUS
    JURISDICTION ANALYSIS
    TOP APPLICANTS
  • 6.9 TRADE ANALYSIS
    IMPORT SCENARIO (HS CODE 902730)
    EXPORT SCENARIO (HS CODE 902730)
  • 6.10 KEY CONFERENCES AND EVENTS, 2024–2025
  • 6.11 STANDARDS AND REGULATORY LANDSCAPE
    REGULATORY BODIES, GOVERNMENT AGENCIES, AND OTHER ORGANIZATIONS
    STANDARDS
  • 6.12 PORTER’S FIVE FORCES ANALYSIS
    THREAT OF NEW ENTRANTS
    THREAT OF SUBSTITUTES
    BARGAINING POWER OF SUPPLIERS
    BARGAINING POWER OF BUYERS
    INTENSITY OF COMPETITIVE RIVALRY
  • 6.13 KEY STAKEHOLDERS AND BUYING CRITERIA
    KEY STAKEHOLDERS IN BUYING PROCESS
    BUYING CRITERIA
  • 6.14 MACROECONOMIC OUTLOOK
    GDP TRENDS AND FORECAST, BY COUNTRY
  • 6.15 CASE STUDY ANALYSIS
    ADVANCEMENTS IN MICROPARTICLE ANALYSIS: LEVERAGING RAMAN MICROSCOPY FOR ENHANCED IDENTIFICATION AND CHARACTERIZATION
    MICROPLASTIC DETECTION AND REMEDIATION THROUGH EFFICIENT INTERFACIAL SOLAR EVAPORATION FOR IMMACULATE WATER PRODUCTION
MICROPLASTIC DETECTION MARKET, BY TYPE
84
  • 7.1 INTRODUCTION
  • 7.2 POLYETHYLENE
    INCREASING DEMAND FOR EFFECTIVE ENVIRONMENTAL POLLUTION CONTROL TO DRIVE MARKET
  • 7.3 POLYSTYRENE
    ADVANCED DETECTION AND MANAGEMENT STRATEGIES FOR POLYSTYRENE MICROPLASTICS TO DRIVE DEMAND
  • 7.4 POLYPROPYLENE
    PRESSING NEED FOR NON-DESTRUCTIVE EXAMINATION OF MICROPLASTICS TO DRIVE DEMAND
  • 7.5 POLYTETRAFLUOROETHYLENE
    ABILITY TO ENSURE RELIABLE AND RESILIENT CONNECTIONS IN CRITICAL SYSTEMS TO FUEL DEMAND
  • 7.6 OTHER TYPES
    POLYETHYLENE TEREPHTHALATE
    POLYURETHANE
MICROPLASTIC DETECTION MARKET, BY MEDIUM
91
  • 8.1 INTRODUCTION
  • 8.2 WATER
    URGENT NEED FOR BETTER DETECTION AND REGULATION OF PLASTIC WASTE IN WATER SYSTEMS TO DRIVE MARKET
  • 8.3 SOIL
    NEED TO CURB MICROPLASTIC CONTAMINATION IN AGRICULTURE TO DRIVE MARKET
  • 8.4 AIR
    PRESSING NEED TO CURB GROWTH OF AIRBORNE MICROPLASTICS TO DRIVE MARKET
MICROPLASTIC DETECTION MARKET, BY SIZE
95
  • 9.1 INTRODUCTION
  • 9.2 <1 MM
  • 9.3 1–3 MM
  • 9.4 3–5 MM
MICROPLASTIC DETECTION MARKET, BY TECHNOLOGY
99
  • 10.1 INTRODUCTION
  • 10.2 FTIR SPECTROSCOPY
    EFFECTIVE TECHNIQUE TO IDENTIFY AND QUANTIFY MICROPLASTICS
  • 10.3 MICRO-RAMAN SPECTROSCOPY
    EFFICIENT IN PRODUCING DISTINCT CHEMICAL FINGERPRINT FOR POLYMERS
  • 10.4 PYROLYSIS-GAS CHROMATOGRAPHY-MASS SPECTROMETRY (PY-GC-MS)
    SOPHISTICATED PROCEDURE FOR DETERMINING PYROLYSIS GAS IN SUSPENDED SOLID PARTICLES
  • 10.5 LIQUID CHROMATOGRAPHY (LC) WITH MASS SPECTROMETRY (MS)
    ADVANCED DETECTION OF MICROPLASTICS THROUGH DEPOLYMERIZATION ANALYSIS
  • 10.6 FLOW CYTOMETRY
    ACCURATE IDENTIFICATION OF MICROPLASTICS THROUGH UNIQUE POLYMER SIGNATURES
  • 10.7 SCANNING ELECTRON MICROSCOPY (SEM)
    PROVIDES HIGH-RESOLUTION IMAGES OF SURFACE STRUCTURES
  • 10.8 OTHER TECHNOLOGIES
    HYPERSPECTRAL IMAGING
    THERMOGRAVIMETRIC ANALYSIS
MICROPLASTIC DETECTION MARKET, BY END–USE INDUSTRY
107
  • 11.1 INTRODUCTION
  • 11.2 WATER TREATMENT
    GROWING ADOPTION TO REVOLUTIONIZE HEAVY-DUTY MANUFACTURING TO DRIVE MARKET
  • 11.3 PACKAGING
    NEED FOR MONITORING USE OF BIODEGRADABLE MATERIAL TO DRIVE MARKET
  • 11.4 COSMETICS & PERSONAL CARE
    INCREASING DEMAND FOR NATURALLY EXFOLIATING SUBSTANCES TO DRIVE MARKET
  • 11.5 FOOD & BEVERAGE
    COMBATING MICROPLASTIC CONTAMINATION FOR SAFER CONSUMPTION TO BOOST DEMAND
  • 11.6 TEXTILES
    NEED FOR REDUCING MICROFIBER EMISSIONS IN FABRIC PRODUCTION TO DRIVE MARKET
  • 11.7 OTHER END–USE INDUSTRIES
    AGRICULTURE
    CONSTRUCTION
MICROPLASTIC DETECTION MARKET, BY REGION
114
  • 12.1 INTRODUCTION
  • 12.2 ASIA PACIFIC
    CHINA
    - Growing concerns over microplastics from textile industry to drive market
    JAPAN
    - Wide adoption of advanced technologies in tackling emerging environmental challenges to drive market
    INDIA
    - Emphasis on implementing technologies to measure and monitor microplastic pollution to boost market
    SOUTH KOREA
    - Significant investments in R&D in developing advanced technologies to drive market
    REST OF ASIA PACIFIC
  • 12.3 NORTH AMERICA
    US
    - Stringent regulations on plastic use to drive market
    CANADA
    - Commitment to water conservation to boost market
    MEXICO
    - Increased plastic use and regulatory pressures to propel market
  • 12.4 EUROPE
    GERMANY
    - Heightened consumer concerns over microplastics in food & beverages to drive market
    ITALY
    - Prominent fashion industry to sustain market
    FRANCE
    - Increasing awareness, regulatory compliance, and environmental protection efforts to drive market
    UK
    - Increasing demand for detection technologies for cosmetics to drive market
    SPAIN
    - Pressing need to curb industrial pollution to drive market
    RUSSIA
    - Stringent regulations on plastic packaging and push for sustainable packaging to drive market
    REST OF EUROPE
  • 12.5 MIDDLE EAST & AFRICA
    GCC COUNTRIES
    - Saudi Arabia
    - UAE
    - Rest of GCC countries
    - South Africa
    - Rest of Middle East & Africa
  • 12.6 SOUTH AMERICA
    ARGENTINA
    - Control of agricultural runoff to drive market
    BRAZIL
    - Demand for exports of food products to boost market
    REST OF SOUTH AMERICA
COMPETITIVE LANDSCAPE
179
  • 13.1 INTRODUCTION
  • 13.2 KEY PLAYER STRATEGIES/RIGHT TO WIN
    OVERVIEW OF STRATEGIES ADOPTED BY KEY MICROPLASTIC DETECTION MANUFACTURERS
  • 13.3 MARKET SHARE ANALYSIS
  • 13.4 REVENUE ANALYSIS, 2020–2024
  • 13.5 COMPANY EVALUATION MATRIX: KEY PLAYERS, 2023
    STARS
    EMERGING LEADERS
    PERVASIVE PLAYERS
    PARTICIPANTS
    COMPANY FOOTPRINT: KEY PLAYERS, 2023
    - Company footprint
    - Type footprint
    - Technology footprint
    - End-use industry footprint
    - Region footprint
  • 13.6 COMPANY EVALUATION MATRIX: STARTUPS/SMES, 2023
    PROGRESSIVE COMPANIES
    RESPONSIVE COMPANIES
    DYNAMIC COMPANIES
    STARTING BLOCKS
    COMPETITIVE BENCHMARKING: STARTUPS/SMES, 2023
    - Detailed list of key startups/SMES
    - Competitive benchmarking of key startups/SMEs
  • 13.7 BRAND/PRODUCT COMPARATIVE ANALYSIS
  • 13.8 COMPANY VALUATION AND FINANCIAL METRICS
  • 13.9 COMPETITIVE SCENARIO AND TRENDS
    PRODUCT LAUNCHES
    EXPANSIONS
    DEALS
COMPANY PROFILES
203
  • 14.1 KEY PLAYERS
    THERMO FISHER SCIENTIFIC INC.
    - Business overview
    - Products/Solutions/Services offered
    - Recent developments
    - MnM view
    AGILENT TECHNOLOGIES, INC.
    - Business overview
    - Products/Solutions/Services offered
    - Recent developments
    - MnM view
    BRUKER
    - Business overview
    - Products/Solutions/Services offered
    - Recent developments
    - MnM view
    SHIMADZU CORPORATION
    - Business overview
    - Products/Solutions/Services offered
    - Recent developments
    - MnM view
    JEOL LTD.
    - Business overview
    - Products/Solutions/Services offered
    - Recent developments
    - MnM view
    METTLER TOLEDO
    - Business overview
    - Products/Solutions/Services offered
    - MnM view
    OXFORD INSTRUMENTS
    - Business overview
    - Products/Solutions/Services offered
    - Recent developments
    - MnM view
    ZEISS GROUP
    - Business overview
    - Products/Solutions/Services offered
    - Recent developments
    - MnM view
    DANAHER CORPORATION
    - Business overview
    - Products/Solutions/Services offered
    - Recent developments
    - MnM view
    PERKINELMER
    - Business overview
    - Products/Solutions/Services offered
    - MnM view
    ENDRESS+HAUSER GROUP SERVICES AG
    - Business overview
    - Products/Solutions/Services offered
    - Recent developments
    - MnM view
  • 14.2 OTHER PLAYERS
    RENISHAW PLC
    MALVERN PANALYTICAL LTD
    JASCO
    TESCAN GROUP, A.S.
    LAMBDA SCIENTIFIC PTY LTD
    OCEAN OPTICS
    EDINBURGH INSTRUMENTS
    LIGHTNOVO APS
    HANGZHOU TIETAI AUTOMATION TECHNOLOGY CO., LTD.
    TECHNOS INSTRUMENTS
    TOKYO INSTRUMENTS, INC.
APPENDIX
257
  • 15.1 DISCUSSION GUIDE
  • 15.2 KNOWLEDGESTORE: MARKETSANDMARKETS’ SUBSCRIPTION PORTAL
  • 15.3 CUSTOMIZATION OPTIONS
  • 15.4 RELATED REPORTS
  • 15.5 AUTHOR DETAILS
LIST OF TABLES
 
  • TABLE 1 AVERAGE SELLING PRICE TREND OF MICROPLASTIC DETECTION, BY REGION, 2020–2023 (USD/TON)
  • TABLE 2 AVERAGE SELLING PRICE TREND OF MICROPLASTIC DETECTION, BY TYPE, 2020–2023 (USD/KILOTON)
  • TABLE 3 AVERAGE SELLING PRICE TREND OF MICROPLASTIC DETECTION OFFERED BY KEY PLAYERS, BY TYPE, 2023 (USD/KILOTON)
  • TABLE 4 ROLES OF COMPANIES IN MICROPLASTIC DETECTION ECOSYSTEM
  • TABLE 5 KEY TECHNOLOGIES
  • TABLE 6 COMPLEMENTARY TECHNOLOGIES
  • TABLE 7 ADJACENT TECHNOLOGIES
  • TABLE 8 TOTAL NUMBER OF PATENTS, 2014–2024
  • TABLE 9 TOP OWNERS OF PATENTS RELATED TO MICROPLASTIC DETECTION, 2014–2024
  • TABLE 10 LIST OF KEY PATENTS RELATED TO MICROPLASTIC DETECTION, 2014–2022
  • TABLE 11 MICROPLASTIC DETECTION MARKET: LIST OF KEY CONFERENCES AND EVENTS, 2024–2025
  • TABLE 12 NORTH AMERICA: REGULATORY BODIES, GOVERNMENT AGENCIES, AND OTHER ORGANIZATIONS
  • TABLE 13 EUROPE: REGULATORY BODIES, GOVERNMENT AGENCIES, AND OTHER ORGANIZATIONS
  • TABLE 14 ASIA PACIFIC: REGULATORY BODIES, GOVERNMENT AGENCIES, AND OTHER ORGANIZATIONS
  • TABLE 15 MIDDLE EAST & AFRICA: REGULATORY BODIES, GOVERNMENT AGENCIES, AND OTHER ORGANIZATIONS
  • TABLE 16 SOUTH AMERICA: REGULATORY BODIES, GOVERNMENT AGENCIES, AND OTHER ORGANIZATIONS
  • TABLE 17 STANDARDS AND REGULATIONS FOR PLAYERS IN MICROPLASTIC DETECTION MARKET
  • TABLE 18 IMPACT OF PORTER’S FIVE FORCES ON MICROPLASTIC DETECTION MARKET
  • TABLE 19 INFLUENCE OF STAKEHOLDERS ON BUYING PROCESS, BY END-USE INDUSTRY (%)
  • TABLE 20 KEY BUYING CRITERIA, BY END-USE INDUSTRY
  • TABLE 21 GDP TRENDS AND FORECAST, BY COUNTRY, 2023–2025 (USD MILLION)
  • TABLE 22 MICROPLASTIC DETECTION MARKET, BY TYPE, 2020–2023 (USD MILLION)
  • TABLE 23 MICROPLASTIC DETECTION MARKET, BY TYPE, 2024–2029 (USD MILLION)
  • TABLE 24 MICROPLASTIC DETECTION MARKET, BY TYPE, 2020–2023 (KILOTON)
  • TABLE 25 MICROPLASTIC DETECTION MARKET, BY TYPE, 2024–2029 (KILOTON)
  • TABLE 26 MICROPLASTIC DETECTION MARKET, BY MEDIUM, 2020–2023 (USD MILLION)
  • TABLE 27 MICROPLASTIC DETECTION MARKET, BY MEDIUM, 2024–2029 (USD MILLION)
  • TABLE 28 MICROPLASTIC DETECTION MARKET, BY SIZE, 2020–2023 (USD MILLION)
  • TABLE 29 MICROPLASTIC DETECTION MARKET, BY SIZE, 2024–2029 (USD MILLION)
  • TABLE 30 MICROPLASTIC DETECTION MARKET, BY TECHNOLOGY, 2020–2023 (USD MILLION)
  • TABLE 31 MICROPLASTIC DETECTION MARKET, BY TECHNOLOGY, 2024–2029 (USD MILLION)
  • TABLE 32 MICROPLASTIC DETECTION MARKET, BY END-USE INDUSTRY, 2020–2023 (USD MILLION)
  • TABLE 33 MICROPLASTIC DETECTION MARKET, BY END-USE INDUSTRY, 2024–2029 (USD MILLION)
  • TABLE 34 MICROPLASTIC DETECTION MARKET, BY REGION, 2020–2023 (USD MILLION)
  • TABLE 35 MICROPLASTIC DETECTION MARKET, BY REGION, 2024–2029 (USD MILLION)
  • TABLE 36 MICROPLASTIC DETECTION MARKET, BY REGION, 2020–2023 (KILOTON)
  • TABLE 37 MICROPLASTIC DETECTION MARKET, BY REGION, 2024–2029 (KILOTON)
  • TABLE 38 MICROPLASTIC DETECTION MARKET, BY TYPE, 2020–2023 (USD MILLION)
  • TABLE 39 MICROPLASTIC DETECTION MARKET, BY TYPE, 2024–2029 (USD MILLION)
  • TABLE 40 MICROPLASTIC DETECTION MARKET, BY TYPE, 2020–2023 (KILOTON)
  • TABLE 41 MICROPLASTIC DETECTION MARKET, BY TYPE, 2024–2029 (KILOTON)
  • TABLE 42 MICROPLASTIC DETECTION MARKET, BY TECHNOLOGY, 2020–2023 (USD MILLION)
  • TABLE 43 MICROPLASTIC DETECTION MARKET, BY TECHNOLOGY, 2024–2029 (USD MILLION)
  • TABLE 44 MICROPLASTIC DETECTION MARKET, BY MEDIUM, 2020–2023 (USD MILLION)
  • TABLE 45 MICROPLASTIC DETECTION MARKET, BY MEDIUM, 2024–2029 (USD MILLION)
  • TABLE 46 MICROPLASTIC DETECTION MARKET, BY SIZE, 2020–2023 (USD MILLION)
  • TABLE 47 MICROPLASTIC DETECTION MARKET, BY SIZE, 2024–2029 (USD MILLION)
  • TABLE 48 MICROPLASTIC DETECTION MARKET, BY END-USE INDUSTRY, 2020–2023 (USD MILLION)
  • TABLE 49 MICROPLASTIC DETECTION MARKET, BY END-USE INDUSTRY, 2024–2029 (USD MILLION)
  • TABLE 50 ASIA PACIFIC: MICROPLASTIC DETECTION MARKET, BY COUNTRY, 2020–2023 (USD MILLION)
  • TABLE 51 ASIA PACIFIC: MICROPLASTIC DETECTION MARKET, BY COUNTRY, 2024–2029 (USD MILLION)
  • TABLE 52 ASIA PACIFIC: MICROPLASTIC DETECTION MARKET, BY COUNTRY, 2020–2023 (KILOTON)
  • TABLE 53 ASIA PACIFIC: MICROPLASTIC DETECTION MARKET, BY COUNTRY, 2024–2029 (KILOTON)
  • TABLE 54 ASIA PACIFIC: MICROPLASTIC DETECTION MARKET, BY TYPE, 2020–2023 (USD MILLION)
  • TABLE 55 ASIA PACIFIC: MICROPLASTIC DETECTION MARKET, BY TYPE, 2024–2029 (USD MILLION)
  • TABLE 56 ASIA PACIFIC: MICROPLASTIC DETECTION MARKET, BY TYPE, 2020–2023 (KILOTON)
  • TABLE 57 ASIA PACIFIC: MICROPLASTIC DETECTION MARKET, BY TYPE, 2024–2029 (KILOTON)
  • TABLE 58 ASIA PACIFIC: MICROPLASTIC DETECTION MARKET, TECHNOLOGY, 2020–2023 (USD MILLION)
  • TABLE 59 ASIA PACIFIC: MICROPLASTIC DETECTION MARKET, BY TECHNOLOGY, 2024–2029 (USD MILLION)
  • TABLE 60 ASIA PACIFIC: MICROPLASTIC DETECTION MARKET, BY MEDIUM, 2020–2023 (USD MILLION)
  • TABLE 61 ASIA PACIFIC: MICROPLASTIC DETECTION MARKET, BY MEDIUM, 2024–2029 (USD MILLION)
  • TABLE 62 ASIA PACIFIC: MICROPLASTIC DETECTION MARKET, BY SIZE, 2020–2023 (USD MILLION)
  • TABLE 63 ASIA PACIFIC: MICROPLASTIC DETECTION MARKET, BY SIZE, 2024–2029 (USD MILLION)
  • TABLE 64 ASIA PACIFIC: MICROPLASTIC DETECTION MARKET, BY END-USE INDUSTRY, 2020–2023 (USD MILLION)
  • TABLE 65 ASIA PACIFIC: MICROPLASTIC DETECTION MARKET, BY END-USE INDUSTRY, 2024–2029 (USD MILLION)
  • TABLE 66 CHINA: MICROPLASTIC DETECTION MARKET, BY END-USE INDUSTRY, 2020–2023 (USD MILLION)
  • TABLE 67 CHINA: MICROPLASTIC DETECTION MARKET, BY END-USE INDUSTRY, 2024–2029 (USD MILLION)
  • TABLE 68 JAPAN: MICROPLASTIC DETECTION MARKET, BY END-USE INDUSTRY, 2020–2023 (USD MILLION)
  • TABLE 69 JAPAN: MICROPLASTIC DETECTION MARKET, BY END-USE INDUSTRY, 2024–2029 (USD MILLION)
  • TABLE 70 INDIA: MICROPLASTIC DETECTION MARKET, BY END-USE INDUSTRY, 2020–2023 (USD MILLION)
  • TABLE 71 INDIA: MICROPLASTIC DETECTION MARKET, BY END-USE INDUSTRY, 2024–2029 (USD MILLION)
  • TABLE 72 SOUTH KOREA: MICROPLASTIC DETECTION MARKET, BY END-USE INDUSTRY, 2020–2023 (USD MILLION)
  • TABLE 73 SOUTH KOREA: MICROPLASTIC DETECTION MARKET, BY END-USE INDUSTRY, 2024–2029 (USD MILLION)
  • TABLE 74 REST OF ASIA PACIFIC: MICROPLASTIC DETECTION MARKET, BY END-USE INDUSTRY, 2020–2023 (USD MILLION)
  • TABLE 75 REST OF ASIA PACIFIC: MICROPLASTIC DETECTION MARKET, BY END-USE INDUSTRY, 2024–2029 (USD MILLION)
  • TABLE 76 NORTH AMERICA: MICROPLASTIC DETECTION MARKET, BY COUNTRY, 2020–2023 (USD MILLION)
  • TABLE 77 NORTH AMERICA: MICROPLASTIC DETECTION MARKET, BY COUNTRY, 2024–2029 (USD MILLION)
  • TABLE 78 NORTH AMERICA: MICROPLASTIC DETECTION MARKET, BY COUNTRY, 2020–2023 (KILOTON)
  • TABLE 79 NORTH AMERICA: MICROPLASTIC DETECTION MARKET, BY COUNTRY, 2024–2029 (KILOTON)
  • TABLE 80 NORTH AMERICA: MICROPLASTIC DETECTION MARKET, BY TYPE, 2020–2023 (USD MILLION)
  • TABLE 81 NORTH AMERICA: MICROPLASTIC DETECTION MARKET, BY TYPE, 2024–2029 (USD MILLION)
  • TABLE 82 NORTH AMERICA: MICROPLASTIC DETECTION MARKET, BY TYPE, 2020–2023 (KILOTON)
  • TABLE 83 NORTH AMERICA: MICROPLASTIC DETECTION MARKET, BY TYPE, 2024–2029 (KILOTON)
  • TABLE 84 NORTH AMERICA: MICROPLASTIC DETECTION MARKET, BY TECHNOLOGY, 2020–2023 (USD MILLION)
  • TABLE 85 NORTH AMERICA: MICROPLASTIC DETECTION MARKET, BY TECHNOLOGY, 2024–2029 (USD MILLION)
  • TABLE 86 NORTH AMERICA: MICROPLASTIC DETECTION MARKET, BY MEDIUM, 2020–2023 (USD MILLION)
  • TABLE 87 NORTH AMERICA: MICROPLASTIC DETECTION MARKET, BY MEDIUM, 2024–2029 (USD MILLION)
  • TABLE 88 NORTH AMERICA: MICROPLASTIC DETECTION MARKET, BY SIZE, 2020–2023 (USD MILLION)
  • TABLE 89 NORTH AMERICA: MICROPLASTIC DETECTION MARKET, BY SIZE, 2024–2029 (USD MILLION)
  • TABLE 90 NORTH AMERICA: MICROPLASTIC DETECTION MARKET, BY END-USE INDUSTRY, 2020–2023 (USD MILLION)
  • TABLE 91 NORTH AMERICA: MICROPLASTIC DETECTION MARKET, BY END-USE INDUSTRY, 2024–2029 (USD MILLION)
  • TABLE 92 US: MICROPLASTIC DETECTION MARKET, BY END-USE INDUSTRY, 2020–2023 (USD MILLION)
  • TABLE 93 US: MICROPLASTIC DETECTION MARKET, BY END-USE INDUSTRY, 2024–2029 (USD MILLION)
  • TABLE 94 CANADA: MICROPLASTIC DETECTION MARKET, BY END-USE INDUSTRY, 2020–2023 (USD MILLION)
  • TABLE 95 CANADA: MICROPLASTIC DETECTION MARKET, BY END-USE INDUSTRY, 2024–2029 (USD MILLION)
  • TABLE 96 MEXICO: MICROPLASTIC DETECTION MARKET, BY END-USE INDUSTRY, 2020–2023 (USD MILLION)
  • TABLE 97 MEXICO: MICROPLASTIC DETECTION MARKET, BY END-USE INDUSTRY, 2024–2029 (USD MILLION)
  • TABLE 98 EUROPE: MICROPLASTIC DETECTION MARKET, BY COUNTRY, 2020–2023 (USD MILLION)
  • TABLE 99 EUROPE: MICROPLASTIC DETECTION MARKET, BY COUNTRY, 2024–2029 (USD MILLION)
  • TABLE 100 EUROPE: MICROPLASTIC DETECTION MARKET, BY COUNTRY, 2020–2023 (KILOTON)
  • TABLE 101 EUROPE: MICROPLASTIC DETECTION MARKET, BY COUNTRY, 2024–2029 (KILOTON)
  • TABLE 102 EUROPE: MICROPLASTIC DETECTION MARKET, BY TYPE, 2020–2023 (USD MILLION)
  • TABLE 103 EUROPE: MICROPLASTIC DETECTION MARKET, BY TYPE, 2024–2029 (USD MILLION)
  • TABLE 104 EUROPE: MICROPLASTIC DETECTION MARKET, BY TYPE, 2020–2023 (KILOTON)
  • TABLE 105 EUROPE: MICROPLASTIC DETECTION MARKET, BY TYPE, 2024–2029 (KILOTON)
  • TABLE 106 EUROPE: MICROPLASTIC DETECTION MARKET, BY TECHNOLOGY, 2020–2023 (USD MILLION)
  • TABLE 107 EUROPE: MICROPLASTIC DETECTION MARKET, BY TECHNOLOGY, 2024–2029 (USD MILLION)
  • TABLE 108 EUROPE: MICROPLASTIC DETECTION MARKET, BY MEDIUM, 2020–2023 (USD MILLION)
  • TABLE 109 EUROPE: MICROPLASTIC DETECTION MARKET, BY MEDIUM, 2024–2029 (USD MILLION)
  • TABLE 110 EUROPE: MICROPLASTIC DETECTION MARKET, BY SIZE, 2020–2023 (USD MILLION)
  • TABLE 111 EUROPE: MICROPLASTIC DETECTION MARKET, BY SIZE, 2024–2029 (USD MILLION)
  • TABLE 112 EUROPE: MICROPLASTIC DETECTION MARKET, BY END-USE INDUSTRY, 2020–2023 (USD MILLION)
  • TABLE 113 EUROPE: MICROPLASTIC DETECTION MARKET, BY END-USE INDUSTRY, 2024–2029 (USD MILLION)
  • TABLE 114 GERMANY: MICROPLASTIC DETECTION MARKET, BY END-USE INDUSTRY, 2020–2023 (USD MILLION)
  • TABLE 115 GERMANY: MICROPLASTIC DETECTION MARKET, BY END-USE INDUSTRY, 2024–2029 (USD MILLION)
  • TABLE 116 ITALY: MICROPLASTIC DETECTION MARKET, BY END-USE INDUSTRY, 2020–2023 (USD MILLION)
  • TABLE 117 ITALY: MICROPLASTIC DETECTION MARKET, BY END-USE INDUSTRY, 2024–2029 (USD MILLION)
  • TABLE 118 FRANCE: MICROPLASTIC DETECTION MARKET, BY END-USE INDUSTRY, 2020–2023 (USD MILLION)
  • TABLE 119 FRANCE: MICROPLASTIC DETECTION MARKET, BY END-USE INDUSTRY, 2024–2029 (USD MILLION)
  • TABLE 120 UK: MICROPLASTIC DETECTION MARKET, BY END-USE INDUSTRY, 2020–2023 (USD MILLION)
  • TABLE 121 UK: MICROPLASTIC DETECTION MARKET, BY END-USE INDUSTRY, 2024–2029 (USD MILLION)
  • TABLE 122 SPAIN: MICROPLASTIC DETECTION MARKET, BY END-USE INDUSTRY, 2020–2023 (USD MILLION)
  • TABLE 123 SPAIN: MICROPLASTIC DETECTION MARKET, BY END-USE INDUSTRY, 2024–2029 (USD MILLION)
  • TABLE 124 RUSSIA: MICROPLASTIC DETECTION MARKET, BY END-USE INDUSTRY, 2020–2023 (USD MILLION)
  • TABLE 125 RUSSIA: MICROPLASTIC DETECTION MARKET, BY END-USE INDUSTRY, 2024–2029 (USD MILLION)
  • TABLE 126 REST OF EUROPE: MICROPLASTIC DETECTION MARKET, BY END-USE INDUSTRY, 2020–2023 (USD MILLION)
  • TABLE 127 REST OF EUROPE: MICROPLASTIC DETECTION MARKET, BY END-USE INDUSTRY, 2024–2029 (USD MILLION)
  • TABLE 128 MIDDLE EAST & AFRICA: MICROPLASTIC DETECTION MARKET, BY COUNTRY, 2020–2023 (USD MILLION)
  • TABLE 129 MIDDLE EAST & AFRICA: MICROPLASTIC DETECTION MARKET, BY COUNTRY, 2024–2029 (USD MILLION)
  • TABLE 130 MIDDLE EAST & AFRICA: MICROPLASTIC DETECTION MARKET, BY COUNTRY, 2020–2023 (KILOTON)
  • TABLE 131 MIDDLE EAST & AFRICA: MICROPLASTIC DETECTION MARKET, BY COUNTRY, 2024–2029 (KILOTON)
  • TABLE 132 MIDDLE EAST & AFRICA: MICROPLASTIC DETECTION MARKET, BY TYPE, 2020–2023 (USD MILLION)
  • TABLE 133 MIDDLE EAST & AFRICA: MICROPLASTIC DETECTION MARKET, BY TYPE, 2024–2029 (USD MILLION)
  • TABLE 134 MIDDLE EAST & AFRICA: MICROPLASTIC DETECTION MARKET, BY TYPE, 2020–2023 (KILOTON)
  • TABLE 135 MIDDLE EAST & AFRICA: MICROPLASTIC DETECTION MARKET, BY TYPE, 2024–2029 (KILOTON)
  • TABLE 136 MIDDLE EAST & AFRICA: MICROPLASTIC DETECTION MARKET, BY TECHNOLOGY, 2020–2023 (USD MILLION)
  • TABLE 137 MIDDLE EAST & AFRICA: MICROPLASTIC DETECTION MARKET, BY TECHNOLOGY, 2024–2029 (USD MILLION)
  • TABLE 138 MIDDLE EAST & AFRICA: MICROPLASTIC DETECTION MARKET, BY MEDIUM, 2020–2023 (USD MILLION)
  • TABLE 139 MIDDLE EAST & AFRICA: MICROPLASTIC DETECTION MARKET, BY MEDIUM, 2024–2029 (USD MILLION)
  • TABLE 140 MIDDLE EAST & AFRICA: MICROPLASTIC DETECTION MARKET, BY SIZE, 2020–2023 (USD MILLION)
  • TABLE 141 MIDDLE EAST & AFRICA: MICROPLASTIC DETECTION MARKET, BY SIZE, 2024–2029 (USD MILLION)
  • TABLE 142 MIDDLE EAST & AFRICA: MICROPLASTIC DETECTION MARKET, BY END-USE INDUSTRY 2020–2023 (USD MILLION)
  • TABLE 143 MIDDLE EAST & AFRICA: MICROPLASTIC DETECTION MARKET, BY END-USE INDUSTRY, 2024–2029 (USD MILLION)
  • TABLE 144 SAUDI ARABIA: MICROPLASTIC DETECTION MARKET, BY END-USE INDUSTRY, 2020–2023 (USD MILLION)
  • TABLE 145 SAUDI ARABIA: MICROPLASTIC DETECTION MARKET, BY END-USE INDUSTRY, 2024–2029 (USD MILLION)
  • TABLE 146 UAE: MICROPLASTIC DETECTION MARKET, BY END-USE INDUSTRY, 2020–2023 (USD MILLION)
  • TABLE 147 UAE: MICROPLASTIC DETECTION MARKET, BY END-USE INDUSTRY, 2024–2029 (USD MILLION)
  • TABLE 148 REST OF GCC COUNTRIES: MICROPLASTIC DETECTION MARKET, BY END-USE INDUSTRY, 2020–2023 (USD MILLION)
  • TABLE 149 REST OF GCC COUNTRIES: MICROPLASTIC DETECTION MARKET, BY END-USE INDUSTRY, 2024–2029 (USD MILLION)
  • TABLE 150 SOUTH AFRICA: MICROPLASTIC DETECTION MARKET, BY END-USE INDUSTRY, 2020–2023 (USD MILLION)
  • TABLE 151 SOUTH AFRICA: MICROPLASTIC DETECTION MARKET, BY END-USE INDUSTRY, 2024–2029 (USD MILLION)
  • TABLE 152 REST OF MIDDLE EAST & AFRICA: MICROPLASTIC DETECTION MARKET, BY END-USE INDUSTRY, 2020–2023 (USD MILLION)
  • TABLE 153 REST OF MIDDLE EAST & AFRICA: MICROPLASTIC DETECTION MARKET, BY END-USE INDUSTRY, 2024–2029 (USD MILLION)
  • TABLE 154 SOUTH AMERICA: MICROPLASTIC DETECTION MARKET, BY COUNTRY, 2020–2023 (USD MILLION)
  • TABLE 155 SOUTH AMERICA: MICROPLASTIC DETECTION MARKET, BY COUNTRY, 2024–2029 (USD MILLION)
  • TABLE 156 SOUTH AMERICA: MICROPLASTIC DETECTION MARKET, BY COUNTRY, 2020–2023 (KILOTON)
  • TABLE 157 SOUTH AMERICA: MICROPLASTIC DETECTION MARKET, BY COUNTRY, 2024–2029 (KILOTON)
  • TABLE 158 SOUTH AMERICA: MICROPLASTIC DETECTION MARKET, BY TYPE, 2020–2023 (USD MILLION)
  • TABLE 159 SOUTH AMERICA: MICROPLASTIC DETECTION MARKET, BY TYPE, 2024–2029 (USD MILLION)
  • TABLE 160 SOUTH AMERICA: MICROPLASTIC DETECTION MARKET, BY TYPE, 2020–2023 (KILOTON)
  • TABLE 161 SOUTH AMERICA: MICROPLASTIC DETECTION MARKET, BY TYPE, 2024–2029 (KILOTON)
  • TABLE 162 SOUTH AMERICA: MICROPLASTIC DETECTION MARKET, BY TECHNOLOGY, 2020–2023 (USD MILLION)
  • TABLE 163 SOUTH AMERICA: MICROPLASTIC DETECTION MARKET, BY TECHNOLOGY, 2024–2029 (USD MILLION)
  • TABLE 164 SOUTH AMERICA: MICROPLASTIC DETECTION MARKET, BY MEDIUM, 2020–2023 (USD MILLION)
  • TABLE 165 SOUTH AMERICA: MICROPLASTIC DETECTION MARKET, BY MEDIUM, 2024–2029 (USD MILLION)
  • TABLE 166 SOUTH AMERICA: MICROPLASTIC DETECTION MARKET, BY SIZE, 2020–2023 (USD MILLION)
  • TABLE 167 SOUTH AMERICA: MICROPLASTIC DETECTION MARKET, BY SIZE, 2024–2029 (USD MILLION)
  • TABLE 168 SOUTH AMERICA: MICROPLASTIC DETECTION MARKET, BY END-USE INDUSTRY, 2020–2023 (USD MILLION)
  • TABLE 169 SOUTH AMERICA: MICROPLASTIC DETECTION MARKET, BY END-USE INDUSTRY, 2024–2029 (USD MILLION)
  • TABLE 170 ARGENTINA: MICROPLASTIC DETECTION MARKET, BY END-USE INDUSTRY, 2020–2023 (USD MILLION)
  • TABLE 171 ARGENTINA: MICROPLASTIC DETECTION MARKET, BY END-USE INDUSTRY, 2024–2029 (USD MILLION)
  • TABLE 172 BRAZIL: MICROPLASTIC DETECTION MARKET, BY END-USE INDUSTRY, 2020–2023 (USD MILLION)
  • TABLE 173 BRAZIL: MICROPLASTIC DETECTION MARKET, BY END-USE INDUSTRY, 2024–2029 (USD MILLION)
  • TABLE 174 REST OF SOUTH AMERICA: MICROPLASTIC DETECTION MARKET, BY END-USE INDUSTRY, 2020–2023 (USD MILLION)
  • TABLE 175 REST OF SOUTH AMERICA: MICROPLASTIC DETECTION MARKET, BY END-USE INDUSTRY, 2024–2029 (USD MILLION)
  • TABLE 176 MICROPLASTIC DETECTION MARKET: DEGREE OF COMPETITION
  • TABLE 177 MICROPLASTIC DETECTION MARKET: TYPE FOOTPRINT
  • TABLE 178 MICROPLASTIC DETECTION MARKET: TECHNOLOGY FOOTPRINT
  • TABLE 179 MICROPLASTIC DETECTION MARKET: END-USE INDUSTRY FOOTPRINT
  • TABLE 180 MICROPLASTIC DETECTION MARKET: REGION FOOTPRINT
  • TABLE 181 MICROPLASTIC DETECTION MARKET: DETAILED LIST OF KEY STARTUPS/SMES
  • TABLE 182 MICROPLASTIC DETECTION MARKET: COMPETITIVE BENCHMARKING OF KEY STARTUPS/SMES
  • TABLE 183 MICROPLASTIC DETECTION MARKET: PRODUCT LAUNCHES, JANUARY 2020–JULY 2024
  • TABLE 184 MICROPLASTIC DETECTION MARKET: EXPANSIONS, JANUARY 2020–JULY 2024
  • TABLE 185 MICROPLASTIC DETECTION MARKET: DEALS, JANUARY 2020–JULY 2024
  • TABLE 186 THERMO FISHER SCIENTIFIC INC.: COMPANY OVERVIEW
  • TABLE 187 THERMO FISHER SCIENTIFIC INC.: PRODUCTS/SOLUTIONS/SERVICES OFFERED
  • TABLE 188 THERMO FISHER SCIENTIFIC INC.: PRODUCT LAUNCHES, JANUARY 2021–AUGUST 2024
  • TABLE 189 THERMO FISHER SCIENTIFIC INC.: OTHERS, JANUARY 2021–AUGUST 2024
  • TABLE 190 AGILENT TECHNOLOGIES, INC.: COMPANY OVERVIEW
  • TABLE 191 AGILENT TECHNOLOGIES, INC.: PRODUCTS/SOLUTIONS/SERVICES OFFERED
  • TABLE 192 AGILENT TECHNOLOGIES, INC.: EXPANSIONS, JANUARY 2021–AUGUST 2024
  • TABLE 193 AGILENT TECHNOLOGIES, INC.: OTHERS, JANUARY 2021–AUGUST 2024
  • TABLE 194 BRUKER: COMPANY OVERVIEW
  • TABLE 195 BRUKER: PRODUCTS/SOLUTIONS/SERVICES OFFERED
  • TABLE 196 BRUKER: DEALS, JANUARY 2021–AUGUST 2024
  • TABLE 197 BRUKER: OTHERS, JANUARY 2021–AUGUST 2024
  • TABLE 198 SHIMADZU CORPORATION: COMPANY OVERVIEW
  • TABLE 199 SHIMADZU CORPORATION: PRODUCTS/SOLUTIONS/SERVICES OFFERED
  • TABLE 200 SHIMADZU CORPORATION: PRODUCT LAUNCHES, JANUARY 2021–AUGUST 2024
  • TABLE 201 SHIMADZU CORPORATION: DEALS, JANUARY 2021–AUGUST 2024
  • TABLE 202 SHIMADZU CORPORATION: OTHERS, JANUARY 2021–AUGUST 2024
  • TABLE 203 JEOL LTD.: COMPANY OVERVIEW
  • TABLE 204 JEOL LTD.: PRODUCTS/SOLUTIONS/SERVICES OFFERED
  • TABLE 205 JEOL LTD.: PRODUCT LAUNCHES, JANUARY 2021–AUGUST 2024
  • TABLE 206 METTLER TOLEDO: COMPANY OVERVIEW
  • TABLE 207 METTLER TOLEDO: PRODUCTS/SOLUTIONS/SERVICES OFFERED
  • TABLE 208 OXFORD INSTRUMENTS: COMPANY OVERVIEW
  • TABLE 209 OXFORD INSTRUMENTS: PRODUCTS/SOLUTIONS/SERVICES OFFERED
  • TABLE 210 OXFORD INSTRUMENTS: DEALS, JANUARY 2020–AUGUST 2024
  • TABLE 211 OXFORD INSTRUMENTS: OTHERS, JANUARY 2021–AUGUST 2024
  • TABLE 212 ZEISS GROUP: COMPANY OVERVIEW
  • TABLE 213 ZEISS GROUP: PRODUCTS/SOLUTIONS/SERVICES OFFERED
  • TABLE 214 ZEISS GROUP: OTHERS, JANUARY 2021–AUGUST 2024
  • TABLE 215 DANAHER CORPORATION: COMPANY OVERVIEW
  • TABLE 216 DANAHER CORPORATION: PRODUCTS/SOLUTIONS/SERVICES OFFERED
  • TABLE 217 DANAHER CORPORATION: PRODUCT LAUNCHES, JANUARY 2021–AUGUST 2024
  • TABLE 218 PERKINELMER: COMPANY OVERVIEW
  • TABLE 219 PERKINELMER: PRODUCTS/SOLUTIONS/SERVICES OFFERED
  • TABLE 220 ENDRESS+HAUSER GROUP SERVICES AG: COMPANY OVERVIEW
  • TABLE 221 ENDRESS+HAUSER GROUP SERVICES AG: PRODUCTS/SOLUTIONS/SERVICES OFFERED
  • TABLE 222 ENDRESS+HAUSER GROUP SERVICES AG: OTHERS, JANUARY 2021–AUGUST 2024
  • TABLE 223 RENISHAW PLC: COMPANY OVERVIEW
  • TABLE 224 MALVERN PANALYTICAL LTD: COMPANY OVERVIEW
  • TABLE 225 JASCO: COMPANY OVERVIEW
  • TABLE 226 TESCAN GROUP, A.S.: COMPANY OVERVIEW
  • TABLE 227 LAMBDA SCIENTIFIC PTY LTD: COMPANY OVERVIEW
  • TABLE 228 OCEAN OPTICS: COMPANY OVERVIEW
  • TABLE 229 EDINBURGH INSTRUMENTS: COMPANY OVERVIEW
  • TABLE 230 LIGHTNOVO APS: COMPANY OVERVIEW
  • TABLE 231 HANGZHOU TIETAI AUTOMATION TECHNOLOGY CO., LTD.: COMPANY OVERVIEW
  • TABLE 232 TECHNOS INSTRUMENTS: COMPANY OVERVIEW
  • TABLE 233 TOKYO INSTRUMENTS, INC.: COMPANY OVERVIEW
LIST OF FIGURES
 
  • FIGURE 1 MICROPLASTIC DETECTION MARKET SEGMENTATION
  • FIGURE 2 MICROPLASTIC DETECTION MARKET: RESEARCH DESIGN
  • FIGURE 3 MARKET SIZE ESTIMATION METHODOLOGY: SUPPLY-SIDE APPROACH
  • FIGURE 4 MARKET SIZE ESTIMATION METHODOLOGY: DEMAND-SIDE APPROACH
  • FIGURE 5 MARKET SIZE ESTIMATION METHODOLOGY: REVENUE OF MARKET PLAYERS
  • FIGURE 6 MARKET SIZE ESTIMATION METHODOLOGY: BOTTOM-UP APPROACH
  • FIGURE 7 MARKET SIZE ESTIMATION METHODOLOGY: TOP-DOWN APPROACH
  • FIGURE 8 MICROPLASTIC DETECTION MARKET: DATA TRIANGULATION
  • FIGURE 9 POLYETHYLENE SEGMENT TO LEAD MARKET DURING FORECAST PERIOD
  • FIGURE 10 MICRO–RAMAN SPECTROSCOPY SEGMENT TO LEAD MARKET DURING FORECAST PERIOD
  • FIGURE 11 WATER TREATMENT SEGMENT TO LEAD MARKET DURING FORECAST PERIOD
  • FIGURE 12 WATER SEGMENT TO LEAD MARKET DURING FORECAST PERIOD
  • FIGURE 13 <1 MM SEGMENT TO LEAD MARKET DURING FORECAST PERIOD
  • FIGURE 14 ASIA PACIFIC TO LEAD MICROPLASTIC DETECTION MARKET DURING FORECAST PERIOD
  • FIGURE 15 GROWING USE OF MICROPLASTIC DETECTION TECHNOLOGY IN WATER TREATMENT TO CREATE LUCRATIVE OPPORTUNITIES FOR MARKET PLAYERS
  • FIGURE 16 POLYTETRAFLUOROETHYLENE TO BE FASTEST-GROWING SEGMENT DURING FORECAST PERIOD
  • FIGURE 17 CHINA TO BE FASTEST-GROWING MARKET DURING FORECAST PERIOD
  • FIGURE 18 DRIVERS, RESTRAINTS, OPPORTUNITIES, AND CHALLENGES IN MICROPLASTIC DETECTION MARKET
  • FIGURE 19 USE OF GENERATIVE AI IN MICROPLASTIC DETECTION MARKET
  • FIGURE 20 TRENDS/DISRUPTIONS INFLUENCING CUSTOMER BUSINESS
  • FIGURE 21 MICROPLASTIC DETECTION MARKET: VALUE CHAIN ANALYSIS
  • FIGURE 22 MICROPLASTIC DETECTION MARKET: INVESTMENT AND FUNDING SCENARIO, 2021, 2023, AND 2024 (USD MILLION)
  • FIGURE 23 AVERAGE SELLING PRICE TREND OF MICROPLASTIC DETECTION, BY REGION, 2020–2023 (USD/TON)
  • FIGURE 24 AVERAGE SELLING PRICE TREND OF MICROPLASTIC DETECTION OFFERED BY KEY PLAYERS, BY TYPE, 2023 (USD/KILOTON)
  • FIGURE 25 MICROPLASTIC DETECTION MARKET: ECOSYSTEM
  • FIGURE 26 PATENTS GRANTED OVER LAST 11 YEARS, 2014–2024
  • FIGURE 27 PATENT ANALYSIS, BY LEGAL STATUS, 2014–2024
  • FIGURE 28 REGIONAL ANALYSIS OF PATENTS GRANTED RELATED TO MICROPLASTIC DETECTION, 2014–2024
  • FIGURE 29 TOP 5 COMPANIES WITH SUBSTANTIAL NUMBER OF PATENTS, 2014–2024
  • FIGURE 30 IMPORT DATA RELATED TO HS CODE 902730-COMPLIANT PRODUCTS, BY COUNTRY, 2020–2023 (USD THOUSAND)
  • FIGURE 31 EXPORT DATA RELATED TO HS CODE 902730-COMPLIANT PRODUCTS, BY COUNTRY, 2020–2023 (USD THOUSAND)
  • FIGURE 32 MICROPLASTIC DETECTION MARKET: PORTER’S FIVE FORCES ANALYSIS
  • FIGURE 33 INFLUENCE OF STAKEHOLDERS ON BUYING PROCESS, BY END-USE INDUSTRY
  • FIGURE 34 KEY BUYING CRITERIA, BY END-USE INDUSTRY
  • FIGURE 35 POLYETHYLENE SEGMENT TO LEAD MICROPLASTIC DETECTION MARKET IN 2024
  • FIGURE 36 WATER SEGMENT TO LEAD MICROPLASTIC DETECTION MARKET IN 2024
  • FIGURE 37 <1 MM TO BE LARGEST SEGMENT OF MICROPLASTIC DETECTION MARKET DURING FORECAST PERIOD
  • FIGURE 38 MICRO-RAMAN SPECTROSCOPY SEGMENT TO LEAD MICROPLASTIC DETECTION MARKET IN 2024
  • FIGURE 39 WATER TREATMENT SEGMENT TO HOLD LARGEST SHARE OF MICROPLASTIC DETECTION MARKET IN 2024
  • FIGURE 40 ASIA PACIFIC TO BE FASTEST-GROWING MARKET DURING FORECAST PERIOD
  • FIGURE 41 ASIA PACIFIC: MICROPLASTIC DETECTION MARKET SNAPSHOT
  • FIGURE 42 NORTH AMERICA: MICROPLASTIC DETECTION MARKET SNAPSHOT
  • FIGURE 43 EUROPE: MICROPLASTIC DETECTION MARKET SNAPSHOT
  • FIGURE 44 MARKET SHARE ANALYSIS OF TOP FIVE PLAYERS, 2023
  • FIGURE 45 REVENUE ANALYSIS OF KEY COMPANIES IN LAST FIVE YEARS
  • FIGURE 46 MICROPLASTIC DETECTIONS MARKET: COMPANY EVALUATION MATRIX (KEY PLAYERS), 2023
  • FIGURE 47 MICROPLASTIC DETECTION MARKET: COMPANY FOOTPRINT
  • FIGURE 48 MICROPLASTIC DETECTION MARKET: COMPANY EVALUATION MATRIX (STARTUPS/SMES), 2023
  • FIGURE 49 BRAND/PRODUCT COMPARATIVE ANALYSIS, BY MICROPLASTIC DETECTION PRODUCTS
  • FIGURE 50 EV/EBITDA OF KEY MANUFACTURERS OF MICROPLASTIC DETECTION
  • FIGURE 51 YEAR-TO-DATE (YTD) PRICE TOTAL RETURN
  • FIGURE 52 THERMO FISHER SCIENTIFIC INC.: COMPANY SNAPSHOT
  • FIGURE 53 AGILENT TECHNOLOGIES, INC.: COMPANY SNAPSHOT
  • FIGURE 54 BRUKER: COMPANY SNAPSHOT
  • FIGURE 55 SHIMADZU CORPORATION: COMPANY SNAPSHOT
  • FIGURE 56 JEOL LTD.: COMPANY SNAPSHOT
  • FIGURE 57 METTLER TOLEDO: COMPANY SNAPSHOT
  • FIGURE 58 OXFORD INSTRUMENTS: COMPANY SNAPSHOT
  • FIGURE 59 ZEISS GROUP: COMPANY SNAPSHOT
  • FIGURE 60 DANAHER CORPORATION: COMPANY SNAPSHOT
  • FIGURE 61 PERKINELMER: COMPANY SNAPSHOT
  • FIGURE 62 ENDRESS+HAUSER GROUP SERVICES AG: COMPANY SNAPSHOT

The study involved four major activities in estimating the market size of the Microplastic Detections market. Exhaustive secondary research was done to collect information on the market, the peer market, and the parent market. The next step was to validate these findings, assumptions, and sizing with industry experts across the value chain through primary research. Both top-down and bottom-up approaches were employed to estimate the complete market size. Thereafter, the market breakdown and data triangulation procedures were used to estimate the market size of the segments and subsegments.

Secondary Research

In the secondary research process, various secondary sources have been referred to for identifying and collecting information for this study. These secondary sources include annual reports, press releases, investor presentations of companies, white papers, certified publications, trade directories, certified publications, articles from recognized authors, gold standard and silver standard websites, and databases.

Secondary research has been used to obtain key information about the value chain of the industry, monetary chain of the market, the total pool of key Microplastic Detections, market classification and segmentation according to industry trends to the bottom-most level, and regional markets. It was also used to obtain information about the key developments from a market-oriented perspective.

Primary Research

The Microplastic Detections market comprises several stakeholders in the value chain, which include raw material suppliers, manufacturers, and end users. Various primary sources from the supply and demand sides of the Microplastic Detections market have been interviewed to obtain qualitative and quantitative information. The primary interviewees from the demand side include key opinion leaders in end-use sectors. The primary sources from the supply side include manufacturers, associations, and institutions involved in the Microplastic Detections industry.

Primary interviews were conducted to gather insights such as market statistics, data of revenue collected from the products and services, market breakdowns, market size estimations, market forecasting, and data triangulation. Primary research also helped in understanding the various trends related to chemistry, application, and region. Stakeholders from the demand side, such as CIOs, CTOs, and CSOs were interviewed to understand the buyer’s perspective on the suppliers, products, component providers, and their current usage of Microplastic Detections and future outlook of their business which will affect the overall market.

The breakdown of profiles of the primary interviewees is illustrated in the figure below:

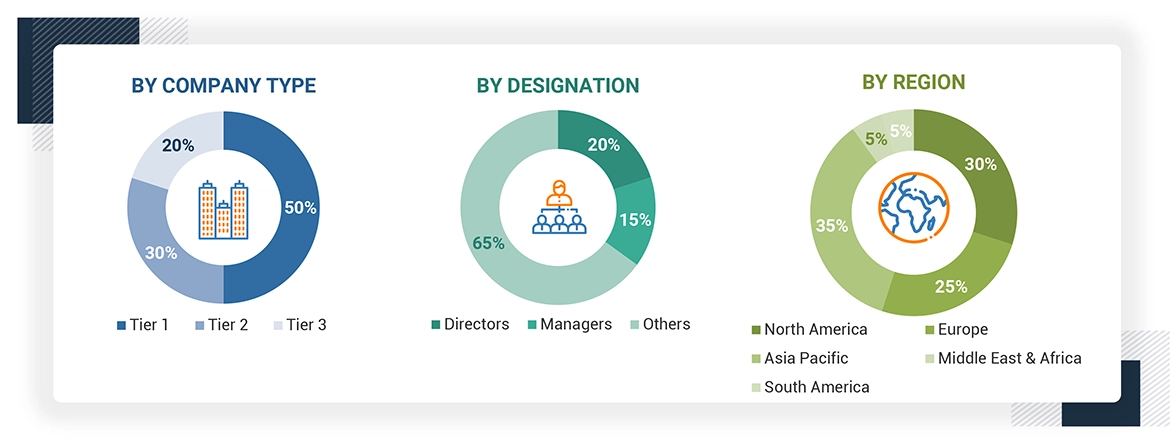
Note: Tier 1, Tier 2, and Tier 3 companies are classified based on their market revenue in 2023 available in the public domain, product portfolios, and geographical presence.

Other designations include sales representatives, production heads, and technicians.

To know about the assumptions considered for the study, download the pdf brochure

Market Size Estimation

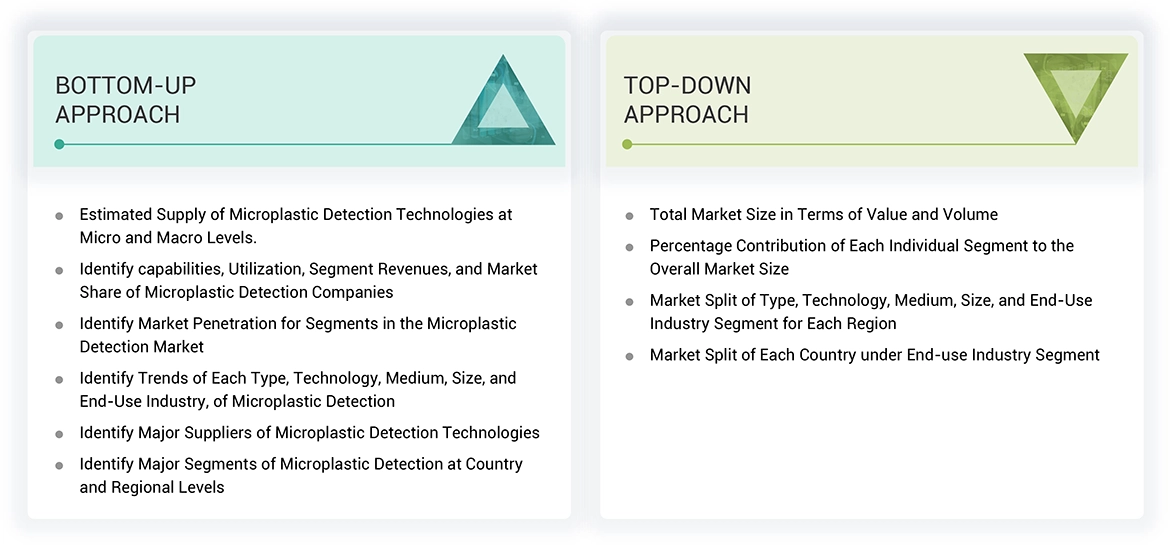
The top-down approach was used to estimate and validate the size of various submarkets for Microplastic Detections for each region. The research methodology used to estimate the market size included the following steps:

  • The key players in the industry have been identified through extensive secondary research.
  • The supply chain of the industry has been determined through primary and secondary research.
  • The global market was then segmented into five major regions and validated by industry experts.
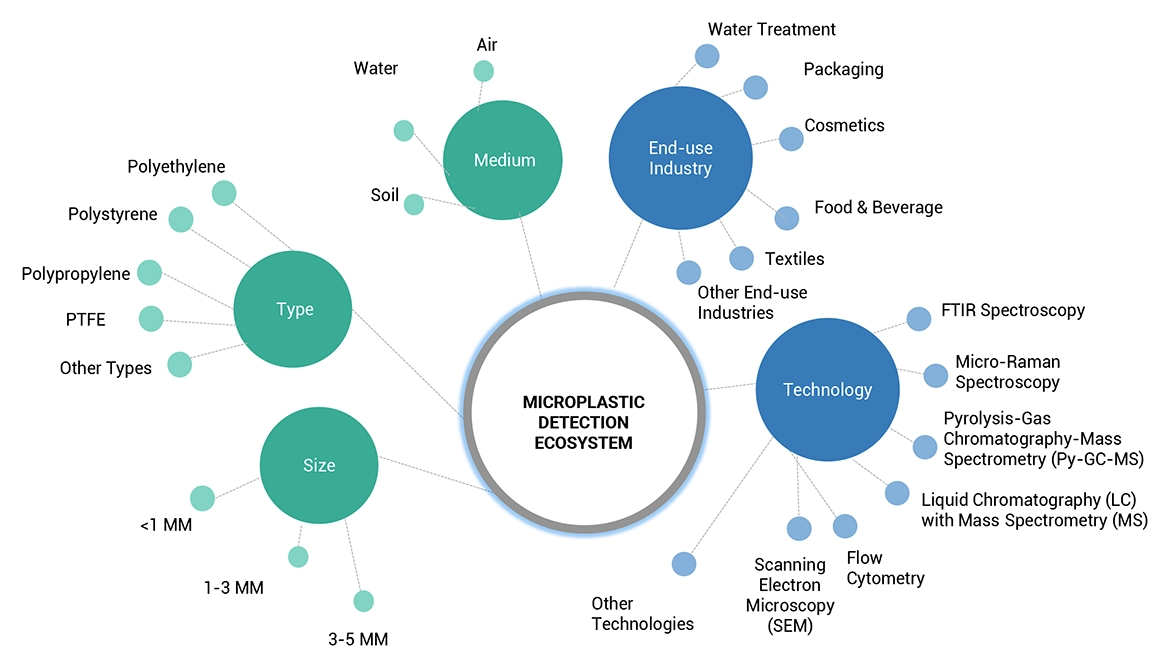
  • All percentage shares, splits, and breakdowns based on type, technology, medium, size, end-use industry, and regions were determined using secondary sources and verified through primary sources.
  • All possible parameters that affect the markets covered in this research study were accounted for, viewed in extensive detail, verified through primary research, and analyzed to get the final quantitative and qualitative data. This data was consolidated and added with detailed inputs and analysis and presented in this report.

Top-down Approach

Data Triangulation

After arriving at the total market size from the estimation process Microplastic Detections above, the overall market has been split into several segments and sub-segments. To complete the overall market engineering process and arrive at the exact statistics for all the segments and sub-segments, the data triangulation and market breakdown procedures have been employed, wherever applicable. The data has been triangulated by studying various factors and trends from both the demand and supply sides. Along with this, the market size has been validated by using both the top-down and bottom-up approaches and primary interviews. Hence, for every data segment, there have been three sources—top-down approach, bottom-up approach, and expert interviews. The data was assumed correct when the values arrived from the three sources matched.

Market Definition

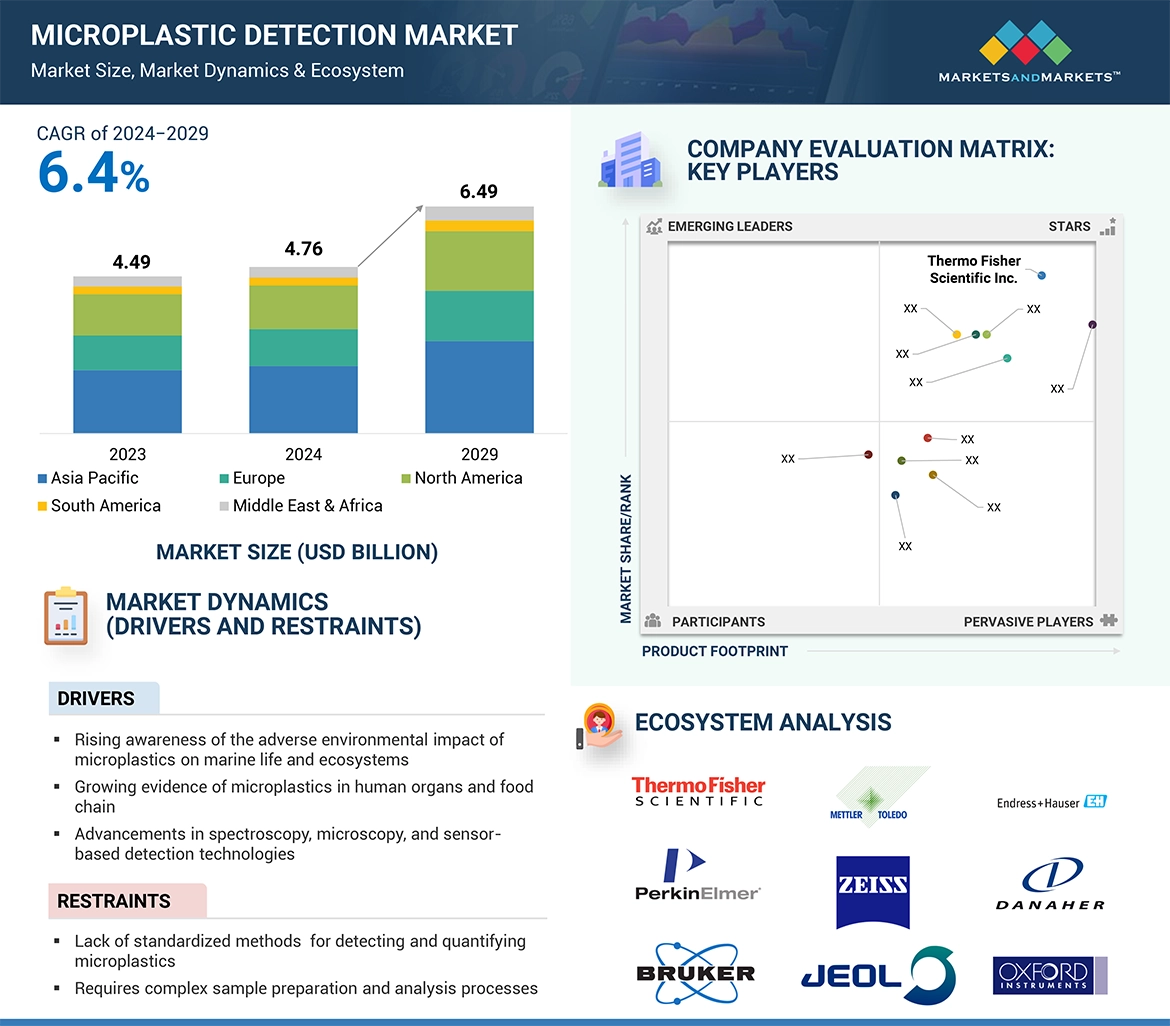
Microplastic detection is a relatively new, rapidly developing field focused on the development and application of technologies and methodologies for identifying and quantifying microplastic particles in ecosystems, industries, and consumer products. Detection of microplastics is extremely challenging due to the complexity of the task and the necessitates the use of advanced analytical techniques: spectroscopy, chromatography, microscopy, and emerging technologies such as sensor-based automated systems and machine learning algorithms. These tools are capable of identifying and quantifying the presence of microplastics in a wide variety of matrices, running from marine and fresh environments, soil, air, and human tissues. This is accompanied by a demand from environmental agency, research institutions, water treatment facilities, and manufacturing industries that can help manage microplastic pollution and comply with regulatory standards.

Stakeholders

  • Microplastic Detections Manufacturers
  • Microplastic Detections Traders, Distributors, and Suppliers
  • Raw Type Suppliers
  • Government and Private Research Organizations
  • Associations and Industrial Bodies
  • R&D Institutions
  • Environmental Support Agencies

Report Objectives

  • To define, describe, and forecast the size of the Microplastic Detections market, in terms of value and volume.
  • To provide detailed information regarding the major factors (drivers, opportunities, restraints, and challenges) influencing the growth of the market.
  • To estimate and forecast the market size based on type, technology, medium, size, end-use industry, and region.
  • To forecast the size of the market with respect to major regions, namely, Europe, North America, Asia Pacific, Middle East & Africa, and South America, along with their key countries.
  • To strategically analyze micromarkets1 with respect to individual growth trends, prospects, and their contribution to the overall market.
  • To analyze opportunities in the market for stakeholders and provide a competitive landscape of market leaders.
  • To track and analyze recent development such as announcement in the market.
  • To strategically profile key market players and comprehensively analyze their core competencies.

Previous Versions of this Report

Custom Market Research Services

We Will Customise The Research For You, In Case The Report Listed Above Does Not Meet With Your Requirements

Get 10% Free Customisation

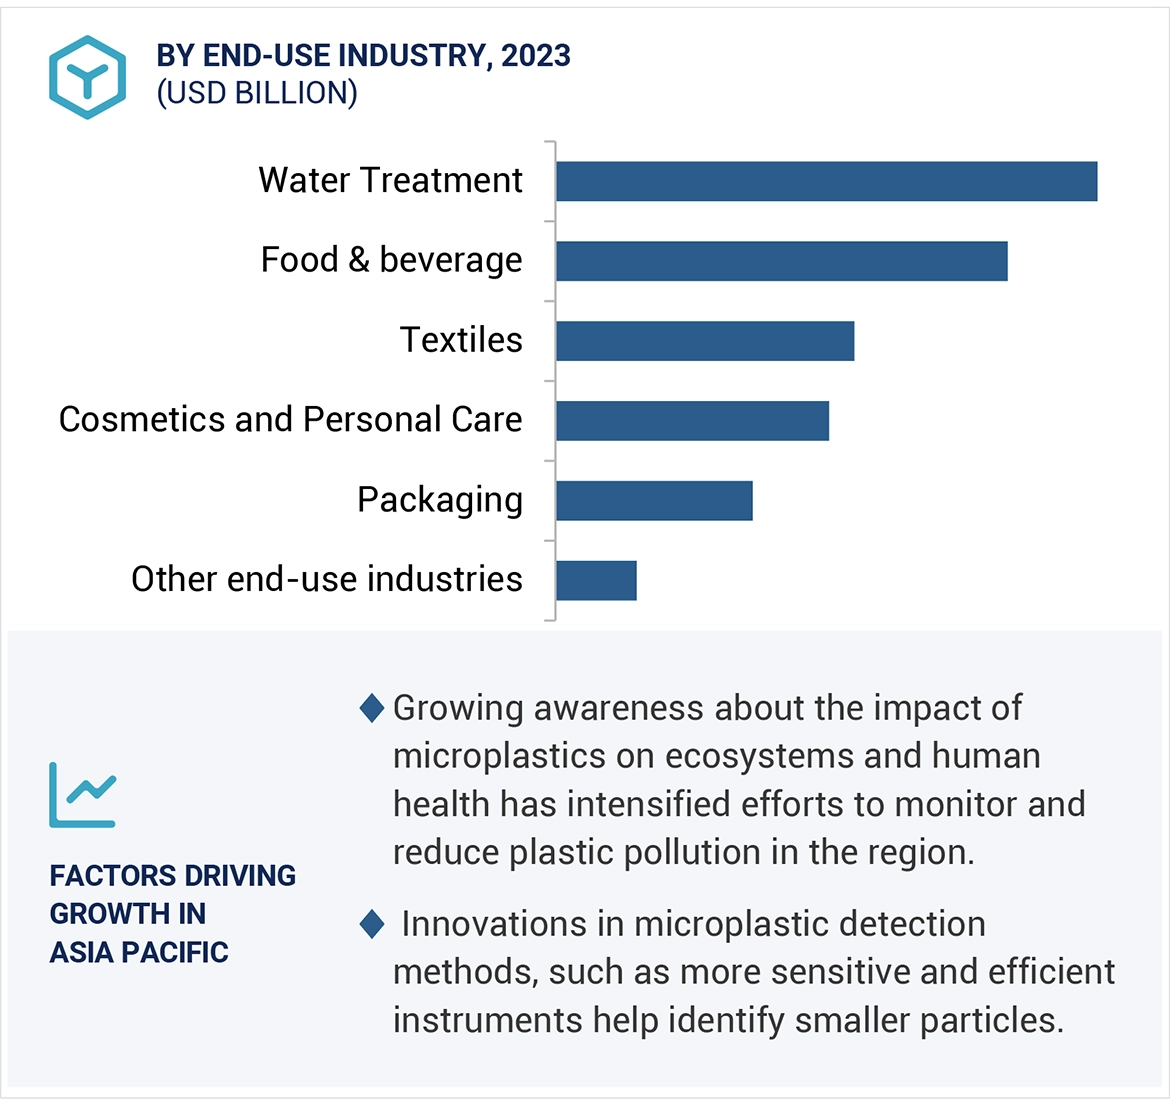
Growth opportunities and latent adjacency in Microplastic Detection Market

DMCA.com Protection Status