Medical Billing Market

Medical Billing Market Size, Share & Trends by Product (Software, Service), Application (RCM, EHR, Practice Management), Type (Account receivable, Claim, Coding, Analytics), Service (Managed, Professional), End User (Hospital, Speciality), & Region- Global Forecast to 2029

Report Code: HIT 9077 Jul, 2024, by marketsandmarkets.com

Medical Billing Market Size, Share & Trends

The size of global medical billing market in terms of revenue was estimated to be worth $16.8 billion in 2024 and is poised to reach $27.7 billion by 2029, growing at a CAGR of 10.5% from 2024 to 2029. The comprehensive research encompasses an exhaustive examination of industry trends, meticulous pricing analysis, patent scrutiny, insights derived from conferences and webinars, identification of key stakeholders, and a nuanced understanding of market purchasing dynamics.

The market's growth is mainly driven by the increasing number of patients, rising complexity of medical billing and coding procedures, expanding healthcare insurance coverage, growing healthcare expenditure, and the need for regulatory compliance. Additionally, the shift towards electronic health records (EHR) integration and digitalization initiatives and the need to reduce billing errors and administrative costs contribute significantly. Outsourcing medical billing services to specialized firms for better revenue cycle management and the adoption of advanced technologies such as AI, cloud solutions, and automation also propel market expansion.

Medical Billing Market Trends

Medical Billing Market

To know about the assumptions considered for the study, Request for Free Sample Report

Medical Billing Market

Global Medical Billing Market Dynamics

DRIVER: Growing patient numbers and the ensuing expansion of health insurance

The growing geriatric population, the chronic diseases pervasiveness, and the burgeoning demand for quality healthcare in global healthcare are these days posing an increasing strain on the global healthcare system. The World Health Organization (WHO) reports that the number of people aged 60 and older is expected to grow from roughly 900 million in 2015 to about 2 billion by 2050. The CDC stated that chronic diseases like cancer, cardiovascular disease (CVD), diabetes, and respiratory diseases cause approximately 70% of deaths in the US every year. In addition to this according to Eurostat, 21% of the Europe population was aged 65 and over, compared to the 16% in 2001.

With a rapid increase in the elderly population and the subsequent rise in the prevalence of chronic diseases, the number of insurance claims has increased manifold across the globe. This will further aid the demand for medical billing solutions. Moreover, according to the US Department of Health and Human Services Office of the Assistant Secretary for Planning and Evaluation (ASPE), as of 2024, over 45 million people have coverage through the Affordable Care Act's Marketplaces and Medicaid expansion. According to McKinsey, consumer participation rose by 25%, reaching approximately 16 million between 2020 and 2022. This increase coincided with extended enrollment periods and enhanced subsidies introduced under the American Rescue Plan Act of 2021 and extended through 2025 by the Inflation Reduction Act of 2022.

Rising healthcare costs also compel people to opt for health insurance. According to the American Medical Association, in 2022, the US spent around USD 4,464.4 billion or USD 13,493 per person on various health consumption expenditures (HCE). According to the National Association of Insurance Commissioners, in 2022, private health insurance expenditures accounted for USD 1,290 billion (30.4% of overall HCE), Medicare program accounted for USD 944 billion, and Medicaid or CHIP amounted to USD 829 billion. Programs such as TRICARE, and the Department of Veterans Affairs accounted for USD 148 billion (3.5% of total HCE) whereas out-of-pocket spending was USD 471 billion. Similarly, healthcare expenditure in Germany, France, Austria, and Sweden accounted for 12.8%, 12.2 %, 11.5%, and 11.4% respectively as a percentage relative to GDP in 2020. With increasing healthcare spending, the demand for healthcare insurance is rising, this will further increase the burden on healthcare systems, as the growing volume of insurance claims necessitates the implementation of streamlined workflows for payment processing, coding, and fraud detection. Thus driving the demand for medical billing solutions.

Restraint: High cost of deployment

Factors influencing the cost of medical billing services include the volume and complexity of services handled, impacting the need for extensive billing resources. Medical billing systems are expensive software solutions, with maintenance and software update costs often exceeding the initial purchase price. Support and maintenance services, which include software modifications and upgrades represent a huge recurring expenditure. This contributes to a large portion of the total cost of ownership. Additionally, the healthcare industry often lacks internal IT expertise, necessitating end-user training to maximize the efficiency of medical billing solutions, further increasing the cost of ownership. Post-sale custom interface development for software integration also requires additional verification and validation to ensure accuracy and completeness, adding to the overall expenses.

The cost of medical billing services varies based on the software used. Practices may utilize various tools like online schedulers and payment platforms, each with its own cost. Basic medical billing software ranges from USD 65 to USD 599 per month. Advanced features can cost up to USD 15,600 monthly, typically for large facilities. Some software offers free trials, while others require outright purchase. Opting for experienced medical billing providers increases costs due to staffing expertise. Choosing between outsourcing and in-house management affects expenses, with outsourcing involving service fees relative to service complexity, while in-house incurs salaries, training, and technology costs. Additionally, selecting cloud or self-hosted systems influences costs, with cloud solutions typically costing around USD 300 per month initially, compared to self-hosted systems ranging from USD 3,000 to USD 8,000 annually. As a result of the high costs involved, small healthcare facilities, especially in emerging countries, are reluctant to replace their legacy systems with medical billing solutions.

OPPORTUNITY: Rising demand for AI and cloud-based deployment

Using machine learning algorithms and predictive analytics to shorten drug discovery times, give patients virtual help, and speed up illness diagnosis by analyzing medical images, combining data and artificial intelligence (AI) can potentially improve outcomes and save costs. Because Al can optimize both clinical and non-clinical processes, it is becoming increasingly popular in the healthcare industry. This is because Al can solve a wide range of issues for patients, providers, and the industry as a whole. With Al's assistance, manual and repetitive processes that arise during patient access, automated coding, expediting claim processing, lowering billing errors, collections, and denials can all be automated. When AI is combined with medical billing, it can mimic intelligent human behavior and carry out these tasks more precisely

Predictive analytics use historical data to forecast claim acceptance and patient payment trends, optimizing revenue strategies. Patient billing is personalized through Al analysis, offering tailored payment plans. It optimizes revenue cycle management by streamlining workflows and leveraging natural language processing for accurate coding from clinical notes, aiming to ease administrative burdens and improve financial outcomes in healthcare. For instance, Gentem Health uses Al to automate claim submission, ensuring accuracy and analyzing denial patterns. It offers proactive strategies and dedicated RCM support. CureMD's Al automates tasks, detects fraud, and streamlines workflows. PatientPay uses Al to predict payment behaviors, optimizing collection strategies with personalized approaches.

CHALLENGE: Concerns about confidentiality and data security

The shift to digital medical records has amplified data vulnerabilities, escalating the risk of breaches. Issues include inadequate internal controls, outdated policies, and insufficient training. While technologies like EHRs and health data exchanges enhance healthcare efficiency, they also widen security risks. Safeguarding proprietary data and applications remains a pivotal challenge hindering the growth of the medical billing market.

From 2009 to 2023, the Office for Civil Rights (OCR) published reports of 5,887 healthcare data breaches involving 500 or more records. In 2022 there was a significant breach with 51.9 million records compromised, but 2023, the situation escalated dramatically, shattering all prior records with an astounding 133 million records were exposed, stolen, or improperly disclosed. This is expected to impact the adoption of medical billing solutions negatively. Hackers are increasingly using phishing tactics to steal login credentials, allowing them to hijack automated clearing house (ACH) payments to US-based bank accounts by targeting reimbursement payment logins used by insurance companies and Medicare. Security breaches in healthcare impact the adoption of HCIT and medical billing solutions, necessitating improved safeguards for patient confidentiality to boost trust and adoption rates in the industry.

The Medical Billing Market Ecosystem

The medical billing market is highly fragmented, with many intermediaries involved. The medical billing software and services that businesses offer to healthcare providers to help them manage their billing and reimbursement tasks are included in the market. Furthermore, through financial programs, regulatory monitoring, and policy decisions, government organizations like the National Health Service (NHS) and the Centers for Medicare and Medicaid Services (CMS) affect market dynamics. In the meantime, the need for medical billing solutions is driven by end users, who include healthcare providers such as hospitals, specialty centers, ambulatory surgical centers, and other end users. These end users want to improve patient care delivery, simplify workflow efficiency, and improve diagnostic accuracy. The smooth integration and efficient application of medical billing systems within the healthcare environment is contingent upon cooperation, innovation, and compliance with regulatory standards within this integrated ecosystem.

Medical Billing Market Ecosystem

Source: Secondary Literature, Interviews with Experts, and MarketsandMarkets Analysis

The global medical billing industry is segmented by component, facility size, end users and region

By component type, the service segment accounted for the largest share of the medical billing industry in 2023.

The medical billing market is segmented by component type into software and service solutions. The service segment accounted for the largest market share in 2023. This segment is further sub-segmented into managed services and professional services. The service segment holds the largest share in the medical billing market because of its critical role in providing complete solutions and specialized knowledge that expedites healthcare providers' billing processes. These services include vital tasks like medical coding, claims submission, denial management, and revenue cycle management to maximize reimbursement and financial performance. The dominance of the service segment is further supported by its capacity to provide scalable solutions that can adjust to changing patient volumes and practice sizes, as well as by its dedication to upholding compliance with strict healthcare laws like HIPAA, which guarantees patient privacy and data security.

The cloud based deployment model is the fastest growing segment in the medical billing industry.

Based on deployment, the medical billing market is segmented into on-premises model, cloud-based based model and SaaS based model. The cloud-based model Medical Billing market is poised for significant growth in the forecast period. As these solutions benefits over conventional on-premise options. First off, cloud-based medical billing systems lower startup expenses and increase accessibility for smaller healthcare businesses by doing away with the requirement for upfront hardware infrastructure investments. Second, these systems are scalable, which frees healthcare providers from the limitations of physical infrastructure to quickly modify resources in response to shifting patient volume and commercial needs.

Large-sized facilities accounted for the largest share of the medical billing industry share in 2023.

Based on facility size, the medical billing market is segmented into large, mid, and small-sized facilities. Some important variables drive the expansion of large-scale facilities in the medical billing industry. The rising cost of healthcare and the intricacy of medical billing procedures call for sophisticated billing solutions, which major facilities can provide. These facilities offer a wide range of services necessary for effectively managing large numbers of patient data and transactions. These services include revenue cycle management, coding, compliance, and claims processing

North America accounts the largest share of medical billing industry in 2023.

Based on the region, the medical billing market is segmented into North America, Europe, Asia Pacific, Latin America, and Middle East and Africa. In 2023 North America accounted for the largest share of the Medical Billing market. The need for effective billing solutions is being driven by integrated billing systems, a complicated and varied healthcare payer landscape, strict regulatory compliance requirements like HIPAA, and substantial healthcare costs. The area also benefits from a sizable patient and healthcare provider base, which encourages competition and innovation among medical billing service providers and technology vendors.

Medical Billing Market by Region

To know about the assumptions considered for the study, download the pdf brochure

Prominent players in Medical Billing market include Oracle (US), Mckesson Corporation (US), Veradigm LLC (US), Athenahealth, Inc. (US), , Quest Diagnostics Incorporated (US), eClinicalWorks (US), CureMD (US), DrChrono (US), NextGen Healthcare, Inc. (US), CareCloud, Inc. (US), AdvancedMD, Inc. (US), , Kareo, Inc. (US), TherapyNotes LLC. (US), RXNT (US), WebPT (US), CentralReach LLC (US), Epic Systems Corporation (US), CollaborateMD Inc. (US), Advanced Data Systems Corporation (US), ChartLogic (US), Meditab (US), EZClaim (US), RevenueXL Inc. (US), Ambula Health (US), , AllStars Medical Billing (US), Apero Health, Inc. (US), TotalMD (US), Proclaim Billing Services (US).

Scope of the Medical Billing Industry

Report Metric

Details

Market Revenue in 2024

$16.8 billion

Projected Revenue by 2029

$27.7 billion

Revenue Rate

Poised to Grow at a CAGR of 10.5%

Market Driver

Growing patient numbers and the ensuing expansion of health insurance

Market Opportunity

Rising demand for AI and cloud-based deployment

The study categorizes the medical billing Market to forecast revenue and analyze trends in each of the following submarkets:

By Component
  • Software
  • Services
    • Software, By Type
      • Integrated medical billing software
      • Standalone medical billing software
    • Software, By Deployment
      • On-Premise Model
      • Cloud-Based Model
      • SaaS- Based Model
    • Software, By Application
      • RCM
      • Practice management software
      • Patient engagement software
      • EHR
      • Others
  • Services
    • Managed Services
      • Accounts Receivable/Aging Claims
      • Medical coding
      • Claim submission and management
      • Payment posting and collection
      • Reporting and analytics
      • Denial management
      • Others
    • Professional Services
      • Implementation and training
      • Technical support
      • Others
By Facility Size
  • Large-sized facility
  • Medium-sized facility
  • Small-sized facility
By End User
  • Hospitals
  • Specialty Centers
  • Orthopedic
  • Cardiology
  • Radiology & imaging centers
  • Oncology
  • Others
  • Ambulatory surgical centers
  • Other end users
By Region
  • North America
    • US
    • Canada
  • Europe
    • Germany
    • UK
    • France
    • Italy
    • Spain
    • RoE
  • Asia Pacific
    • Japan
    • China
    • India
    • RoAPAC
  • Latin America
    • Brazil
    • Mexico
    • Rest of Latin America
  • Middle East and Africa
    • GCC Countries
    • Rest of Middle East and Africa

Recent Developments of Medical Billing Industry:

  • In January 2024, McKesson Corporation (US) collaborated with Hoffmann-La Roche Limited (Switzerland) to launch patient support program that address administrative challenges and enhances patient experience, streamline the administrative process and accelerates the reimbursement process.
  • In November 2023, Veradigm LLC (US) launched a software platform named Veradigm Intelligent Payments to offer Intelligent Payments within Veradigm Payerpath via a collaboration with RevSpring to accelerate payment rates and decrease the time spent manually reconciling records for healthcare provider practices.
  • In May 2023, athenahealth, Inc. (US) partnered with LCH Health and Community Services (US) to implemented athenaOne, athenahealth, Inc.’s integrated, cloud-based electronic health record (EHR), medical billing, and patient engagement solution, as well as athenaOne Dental to provide a more seamless experience for its patients and providers and to support the nonprofit’s growth strategy.

Frequently Asked Questions (FAQ):

To speak to our analyst for a discussion on the above findings, click Speak to Analyst

TABLE OF CONTENTS
 
1 INTRODUCTION 
    1.1 OBJECTIVES OF THE STUDY 
    1.2 MARKET DEFINITION 
           1.2.1 INCLUSIONS AND EXCLUSIONS
    1.3 MARKET SCOPE 
           1.3.1 MARKET SEGMENTATION
           1.3.2 REGIONAL SEGMENTATION
           1.3.3 YEARS CONSIDERED FOR THE STUDY
    1.4 CURRENCY CONSIDERED 
    1.5 STAKEHOLDERS 
    1.6 RECESSION IMPACT 
 
2 RESEARCH METHODOLOGY 
    2.1 RESEARCH DATA 
    2.2 RESEARCH APPROACH 
           2.2.1 SECONDARY DATA
                    2.2.1.1 Key data from secondary sources
           2.2.2 PRIMARY DATA
                    2.2.2.1 Primary sources
                               2.2.2.1.1 Key data from primary sources
                               2.2.2.1.2 Key industry insights
                               2.2.2.1.3 Breakdown of primaries
    2.3 MARKET SIZE ESTIMATION 
    2.4 MARKET BREAKDOWN AND DATA TRIANGULATION 
    2.5 ASSUMPTIONS FOR THE STUDY 
    2.6 RISK ASSESSMENT 
    2.7 LIMITATIONS 
           2.7.1 METHEDOLOGY RELATED LIMITATIONS
           2.7.2 SCOPE RELATED LIMITATIONS
    2.8 IMPACT OF RECESSION ON MEDICAL BILLING MARKET 
 
3 EXECUTIVE SUMMARY 
 
4 PREMIUM INSIGHTS 
 
5 MARKET OVERVIEW 
    5.1 INTRODUCTION 
    5.2 MARKET DYNAMICS 
           5.2.1 MARKET DRIVERS
           5.2.2 MARKET RESTRAINTS
           5.2.3 MARKET OPPORTUNITIES
           5.2.4 MARKET CHALLENGES
    5.3 KEY INDUSTRY TRENDS 
    5.4 TECHNOLOGY ANALYSIS 
           5.4.1 KEY TECHNOLOGIES
                    5.4.1.1 ARTIFICIAL INTELLIGENCE (AI) & MACHINE LEARNING (ML)
                    5.4.1.2 COMPUTER-ASSISTED CODING (CAC)
           5.4.2 COMPLIMENTARY TECHNOLOGIES
                    5.4.2.1 BLOCKCHAIN
           5.4.3 ADJACENT TECHNOLOGIES
    5.5 ECOSYSTEM ANALYSIS 
    5.6 VALUE/ SUPPLY CHAIN ANALYSIS 
    5.7 PORTER’S FIVE FORCES ANALYSIS 
           5.7.1 THREAT OF NEW ENTRANTS
           5.7.2 THREAT OF SUBSTITUTES
           5.7.3 BARGAINING POWER OF BUYERS
           5.7.4 BARGAINING POWER OF SUPPLIERS
           5.7.5 INTENSITY OF COMPETITIVE RIVALRY
    5.8 PATENT ANALYSIS 
           5.8.1 PATENT PUBLICATION TRENDS FOR MEDICAL BILLING
           5.8.2 JURISDICTION ANALYSIS: TOP APPLICANT COUNTRIES
           5.8.3 MAJOR PATENTS
           5.8.4 PATENT FILED
    5.9 REGULATORY LANDSCAPE 
           5.9.1 REGULATORY BODIES, GOVERNMENT AGENCIES AND OTHER ORGANIZATIONS
           5.9.2 REGULATORY ANALYSIS
                    5.9.2.1 NORTH AMERICA
                    5.9.2.2 EUROPE
                    5.9.2.3 ASIA PACIFIC
                    5.9.2.4 LATIN AMERICA
                    5.9.2.5 MIDDLE EAST AND AFRICA
    5.10 PRICING ANALYSIS 
           5.10.1 AVERAGE SELLING PRICE TREND, BY REGION
           5.10.2 AVERAGE SELLING PRICE TREND OF KEY PLAYERS, BY PRODUCT TYPE
    5.11 KEY CONFERENCES & EVENTS IN 2024–2025 
    5.12 KEY STAKEHOLDERS & BUYING CRITERIA 
           5.12.1 KEY STAKEHOLDERS IN BUYING PROCESS
           5.12.2 BUYING CRITERIA
    5.13 CASE STUDIES 
    5.14 UNMET NEEDS 
           5.14.1 END-USER EXPECTATIONS
    5.15 BUSINESS MODEL ANALYSIS 
    5.16 REIMBURSEMENT SCENARIO ANALYSIS 
    5.17 TRENDS/DISRUPTIONS IMPACTING CUSTOMERS’ BUSINESSES 
    5.18 INVESTMENT & FUNDING SCENARIO 
 
6 MEDICAL BILLING MARKET, BY COMPONENT, (USD MILLION: 2018-2029) 
    6.1 INTRODUCTION 
    6.2 SOFTWARE 
           6.2.1 BY TYPE
                    6.2.1.1 INTEGRATED MEDICAL BILLING SOFTWARE
                    6.2.1.2 STANDALONE MEDICAL BILLING SOFTWARE
           6.2.2 BY APPLICATION
                    6.2.2.1 RCM
                    6.2.2.2 PRACTICE MANAGEMENT SOFTWARE 
                    6.2.2.3 PATIENT ENGAGEMENT SOFTWARE
                    6.2.2.4 EHR
                    6.2.2.5 OTHERS 
           6.2.3 BY DEPLOYMENT
                    6.2.3.1 ON-PREMISES MODEL
                    6.2.3.2 CLOUD-BASED MODEL
                    6.2.3.3 SAAS BASED
    6.3 SERVICES 
           6.3.1 MANAGED SERVICES
                    6.3.1.1 MEDICAL CODING
                    6.3.1.2 CLAIM SUBMISSION AND MANAGEMENT
                    6.3.1.3 PAYMENT POSTING AND COLLECTION
                    6.3.1.4 REPORTING AND ANALYTICS
                    6.3.1.5 DENIAL MANAGEMENT
                    6.3.1.6 OTHERS
                    6.3.1.7 ACCOUNT RECEIVABLE/ AGING CLAIMS 
           6.3.2 PROFESSIONAL SERVICES
                    6.3.2.1 IMPLEMENTATION AND TRAINING
                    6.3.2.2 TECHNICAL SUPPORT
                    6.3.2.3 OTHERS
 
7 MEDICAL BILLING MARKET, BY FACILITY SIZE, (USD MILLION: 2018-2029) 
    7.1 INTRODUCTION 
    7.2 LARGE 
    7.3 MEDIUM 
    7.4 SMALL 
 
8 MEDICAL BILLING MARKET, BY END USER (USD MILLION: 2018-2029) 
    8.1 INTRODUCTION 
    8.2 HOSPITALS 
    8.3 SPECIALTY CENTERS 
           8.3.1 ORTHOPEDIC
           8.3.2 CARDIOLOGY
           8.3.3 RADIOLOGY & IMAGING CENTERS
           8.3.4 ONCOLOGY
           8.3.5 OTHERS
    8.4 AMBULATORY SURGICAL CENTERS 
    8.5 OTHER END USERS 
 
9 MEDICAL BILLING MARKET, BY REGION, (USD MILLION: 2018-2029) 
    9.1 INTRODUCTION 
    9.2 NORTH AMERICA 
           9.2.1 US
           9.2.2 CANADA
           9.2.3 NORTH AMERICA: IMPACT OF ECONOMIC RECESSION
    9.3 EUROPE 
           9.3.1 GERMANY
           9.3.2 UK
           9.3.3 FRANCE
           9.3.4 ITALY
           9.3.5 SPAIN
           9.3.6 REST OF EUROPE
           9.3.7 EUROPE: IMPACT OF ECONOMIC RECESSION
    9.4 ASIA PACIFIC 
           9.4.1 JAPAN
           9.4.2 CHINA
           9.4.3 INDIA
           9.4.4 REST OF ASIA PACIFIC
           9.4.5 ASIA PACIFIC: IMPACT OF ECONOMIC RECESSION
    9.5 LATAM 
           9.5.1 BRAZIL
           9.5.2 MEXICO
           9.5.3 REST OF LATIN AMERICA
           9.5.4 LATIN AMERICA: IMPACT OF ECONOMIC RECESSION
    9.6 MIDDLE EAST AND AFRICA 
           9.6.1 GCC COUNTRIES
           9.6.2 REST OF MIDDLE EAST AND AFRICA
           9.6.3 MIDDLE EAST & AFRICA: IMPACT OF ECONOMIC RECESSION
 
10 COMPETITIVE LANDSCAPE 
     10.1 OVERVIEW 
     10.2 STRATEGIES ADOPTED BY KEY PLAYERS 
     10.3 REVENUE SHARE ANALYSIS OF TOP MARKET PLAYERS (2023) 
     10.4 MARKET SHARE ANALYSIS (2023) 
     10.5 COMPANY EVALUATION MATRIX: KEY PLAYERS, 2023 
             10.5.1  STARS
             10.5.2 EMERGING LEADERS
             10.5.3 PERVASIVE PLAYERS
             10.5.4 PARTICIPANTS
             10.5.5 COMPANY FOOTPRINT: KEY PLAYERS, 2023
                        10.5.5.1 COMPANY FOOTPRINT
                        10.5.5.2 REGION FOOTPRINT
                        10.5.5.3 COMPONENT FOOTPRINT
                        10.5.5.4 FACILITY SIZE FOOTPRINT
                        10.5.5.5 END-USER FOOTPRINT
     10.6 COMPANY EVALUATION MATRIX: STARTUPS/SMES, 2023 
             10.6.1 PROGRESSIVE COMPANIES
             10.6.2 RESPONSIVE COMAPNIES
             10.6.3 DYNAMIC COMPANIES
             10.6.4 STARTING BLOCKS
             10.6.5 COMPETITIVE BENCHMARKING: STARTUPS/ SMES, 2023
                        10.6.5.1 DETAILED LIST OF KEY STARTUPS/SMES
                        10.6.5.2 COMPETITIVE BENCHMARKING OF KEY STARTUPS/SMES
     10.7 VALUATION AND FINANCIAL METRICS OF MEDICAL BILLING VENDORS 
     10.8 BRAND COMPARATIVE ANALYSIS 
     10.9 COMPETITIVE SCENARIO AND TRENDS 
             10.9.1 MEDICAL BILLING MARKET: PRODUCT LAUNCHES
             10.9.2 MEDICAL BILLING MARKET: DEALS
             10.9.3 MEDICAL BILLING MARKET: OTHER DEVELOPMENTS
 
11 COMPANY PROFILES 
     11.1 KEY PLAYERS 
             11.1.1 VERADIGM LLC
             11.1.2 ORACLE
             11.1.3 MCKESSON CORPORATION
             11.1.4 QUEST DIAGNOSTICS INCORPORATED
             11.1.5 ADVANCEDMD
             11.1.6 CUREMD
             11.1.7 DRCHRONO
             11.1.8 KAREO
             11.1.9 NEXTGEN HEALTHCARE INC
             11.1.10 CARECLOUD INC,.
             11.1.11 ECLINICALWORKS
             11.1.12 ATHENAHEALTH
             11.1.13 EPIC SYSTEMS CORPORATION
             11.1.14 THERAPYNOTES LLC
             11.1.15 ADVANCED DATA SYSTEM CORPORATION
             11.1.16 RXNT
             11.1.17 WEBPT
             11.1.18 CENTRALREACH
             11.1.19 COLLABORATEMD
             11.1.20 CHARTLOGIC
     11.2 OTHER PLAYERS  
             11.2.1 MEDITAB
             11.2.2 EZCLAIMS
             11.2.3 REVENUEXL
             11.2.4 PROCLAIM BILLING SERVICES
             11.2.5 TOTALMD
 
12 APPENDIX 
     12.1 INSIGHTS OF INDUSTRY EXPERTS 
     12.2 DISCUSSION GUIDE 
     12.3 KNOWLEDGE STORE: MARKETSANDMARKETS’ SUBSCRIPTION PORTAL 
     12.4 CUSTOMIZATION OPTIONS 
     12.5 RELATED REPORTS 
     12.6 AUTHOR DETAILS  

The study involved five major activities to estimate the current size of the Medical Billing market. Exhaustive secondary research collected information on the market and its different subsegments. The next step was to validate these findings, assumptions, and sizing with industry experts across the value chain through primary research. Both top-down and bottom-up approaches were employed to estimate the complete market size. Thereafter, market breakdown and data triangulation procedures were used to estimate the market size of the segments and subsegments.

Secondary Research

In the secondary research process, various secondary sources such as annual reports, press releases & investor presentations of companies, white papers, certified publications, articles by recognized authors, gold-standard & silver-standard websites, regulatory bodies, and databases (such as D&B Hoovers, Bloomberg Business, and Factiva) were referred to to identify and collect information for the study of Medical Billing Market. It was also used to obtain important information about the top players, market classification, and segmentation according to industry trends to the bottom-most level, geographic markets, and key developments related to the market. A database of the key industry leaders was also prepared using secondary research.

Primary Research

Extensive primary research was conducted after acquiring basic knowledge about the global Medical Billing market scenario through secondary research. Several primary interviews were conducted with market experts from both the demand side (Hospital directors, Hospital Vice Presidents, Department heads, and Critical care specialists ) and supply side (such as C-level and D-level executives, technology experts, product managers, marketing and sales managers, among others) across five major regions—North America, Europe, the Asia Pacific, Latin America, Middle East, and Africa. This primary data was collected through questionnaires, e-mails, online surveys, personal interviews, and telephonic interviews

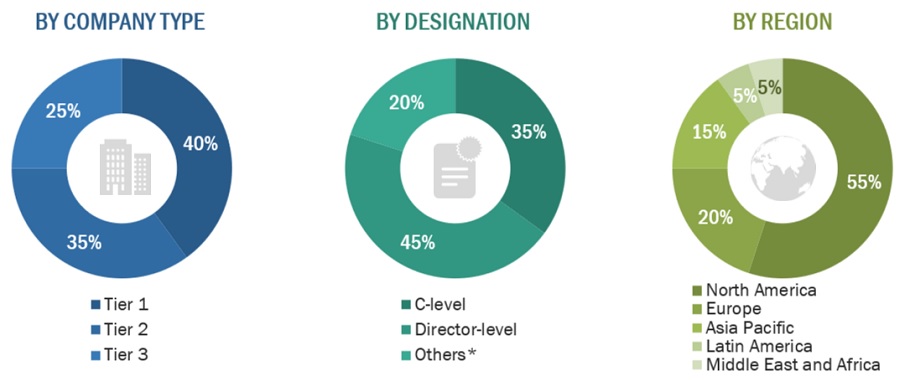
The following is a breakdown of the primary respondents:

Breakdown of Primary Participants:
Medical Billing Market Size, and Share

Note 1: Others include sales, marketing, and product managers.

Note 2: Tiers of companies are defined based on their total revenues in 2023. Tier 1 = >USD 1 billion, Tier 2 = USD 500 million to USD 1 billion, and Tier 3 = <USD 500 million.

To know about the assumptions considered for the study, download the pdf brochure

Market Size Estimation

Both top-down and bottom-up approaches were used to estimate and validate the total size of the Medical Billing market. These methods were also used extensively to estimate the size of various subsegments in the market. The research methodology used to estimate the market size includes the following:

  • The key players in the industry and markets have been identified through extensive secondary research.
  • In terms of value, the industry’s supply chain and market size have been determined through primary and secondary research processes.
  • All percentage shares, splits, and breakdowns have been determined using secondary sources and verified through primary sources.

Global Medical Billing Market Size: Bottom-Up Approach

Medical Billing Market Size, and Share

To know about the assumptions considered for the study, Request for Free Sample Report

Global Medical Billing Market Size: Top-Down Approach

Medical Billing Market Size, and Share

Data Triangulation

After arriving at the overall market size—using the market size estimation processes—the market was split into several segments and subsegments. To complete the overall market engineering process and arrive at the exact statistics of each market segment and sub-segment, the data triangulation and market breakdown procedures were employed, wherever applicable. The data was triangulated by studying various factors and trends from both the demand and supply sides in the Medical Billing market.

Market Definition:

Medical billing is the process of creating healthcare claims to be submitted to insurance companies to get payment for medical services provided by providers and provider groups. The medical biller converts a healthcare service into a billing claim and then monitors the claim to make sure the organization is paid for the provider's work. A medical practice or healthcare organization can maximize revenue performance with the help of an experienced medical biller.

Key Stakeholders:

  • Medical Billing Vendors
  • Government Bodies
  • Healthcare Service Providers
  • Clinical/Physician Centers
  • Healthcare Professionals
  • Health IT service Providers
  • Healthcare Associations/Institutes
  • Ambulatory Care Centers
  • Venture Capitalists
  • Distributors And Resellers
  • Maintenance And Support Service Providers
  • Integration Service Providers
  • Healthcare Payers
  • Advocacy Groups
  • Data Security And Privacy Experts
  • Investors And Financial Institutions
  • Industry Associations And Trade Groups

Report Objectives

  • To define, describe, and forecast the global Medical Billing market based on component, facility size, end user, and region.
  • To provide detailed information regarding the major factors (such as drivers, restraints, opportunities, and challenges) influencing the market growth
  • To strategically analyze micro-markets with respect to individual growth trends, prospects, and contributions to the overall medical billing market
  • To analyze opportunities in the market for stakeholders and provide details of the competitive landscape for market leaders.
  • To strategically analyze the market structure profile the key players of the medical billing market and comprehensively analyze their core competencies.
  • To forecast the size of the market segments with respect to five regions: North America, Europe, Asia Pacific, Latin America, and the Middle East & Africa.
  • To track and analyze competitive developments such as product launches and enhancements and investments, partnerships, collaborations, acquisitions, expansions, agreements, sales contracts, and alliances in the Medical Billing market during the forecast period.

Available Customizations:

With the given market data, MarketsandMarkets offers customizations to meet the company’s specific needs. The following customization options are available for the report:

  • Product Analysis: Product matrix, which gives a detailed comparison of the product portfolios of each company.
  • Geographic Analysis: Further breakdown of Latin American Medical Billing into specific countries, the Middle East and Africa Medical Billing into specific countries, and further breakdown of European Medical Billing into specific countries.
Custom Market Research Services

We will customize the research for you, in case the report listed above does not meet with your exact requirements. Our custom research will comprehensively cover the business information you require to help you arrive at strategic and profitable business decisions.

Request Customization
Report Code
HIT 9077
Published ON
Jul, 2024
Choose License Type
BUY NOW
  • SHARE
X
Request Customization
Speak to Analyst
Speak to Analyst
OR FACE-TO-FACE MEETING
PERSONALIZE THIS RESEARCH
  • Triangulate with your Own Data
  • Get Data as per your Format and Definition
  • Gain a Deeper Dive on a Specific Application, Geography, Customer or Competitor
  • Any level of Personalization
REQUEST A FREE CUSTOMIZATION
LET US HELP YOU!
  • What are the Known and Unknown Adjacencies Impacting the Medical Billing Market
  • What will your New Revenue Sources be?
  • Who will be your Top Customer; what will make them switch?
  • Defend your Market Share or Win Competitors
  • Get a Scorecard for Target Partners
CUSTOMIZED WORKSHOP REQUEST
  • Call Us
  • +1-888-600-6441 (Corporate office hours)
  • +1-888-600-6441 (US/Can toll free)
  • +44-800-368-9399 (UK office hours)
CONNECT WITH US
ABOUT TRUST ONLINE
©2024 MarketsandMarkets Research Private Ltd. All rights reserved
DMCA.com Protection Status Website Feedback