Matting Agents Market

Matting Agents Market by Material (Silica, Waxes, Thermoplastics), Technology (Water-borne, Solvent-borne, Powder, Radiation cure & High Solids), and Application (Industrial, Architectural, Leather, Wood, Printing Inks), & Region - Global Forecast to 2028

Report Code: CH 5398 Oct, 2023, by marketsandmarkets.com

Updated on : June 27, 2024

Matting Agents Market

Matting Agents Market was valued at USD 400 million in 2023 and is projected to reach USD 533 million by 2028, growing at 5.8% cagr from 2023 to 2028. The growth of the construction and furniture industries plays a key role in driving the matting agents market. The increased consumption of matting agents in end-use industries is backed by their potential advantages, such as scratch resistance, high water resistance, and ease of use. In the building & construction industry, matting agents are used as additives in decorative paints, wood strainers, flooring, emulsion paints, and others. The antiglare property of matting agents is the major reason for the growing popularity of coatings in the construction industry.

Global Matting Agents Market Trends

Matting Agents Market

To know about the assumptions considered for the study, Request for Free Sample Report

Matting Agents Market

Matting Agents Market Dynamics

Driver: Growth of construction sector

Globalization, urbanization, rising standard of living, increasing purchasing power parity (PPP), infrastructural development, and the growing need to construct megacities in emerging economies fuel the construction industry worldwide. The construction industry accounts for about 5% of the GDP in developed countries and 8% in developing economies. A large demand for infrastructure in emerging economies in the next two decades is expected. By 2040, global infrastructure investment is estimated to be USD 3.7 trillion annually.

The COVID-19 pandemic impacted every region, country, and industry worldwide. Lockdowns and slowdowns were the norms for months. However, the crisis has subsided, and businesses are returning to usual. A construction boom is expected in Asia Pacific with infrastructure projects, increasing urbanization, and increased interest in technology implementation and business model remodeling. Sustainability trends such as adopting prefabricated construction, sustainable construction, and green building technology are likely to revolutionize conventional business in the construction sector.

Restraints: Requirement of more drying time for waterborne matting agents

The drying and curing of waterborne matting agents require more time than that of solvent-borne matting agents. Waterborne matting agents have excellent flow properties that change with humidity, affecting the coating application. During high humidity, water does not evaporate easily, resulting in poor cure and decreased performance. Waterborne matting agents are also sensitive to freezing conditions. Many waterborne matting agents are not usable after freezing.

Opportunities: Shifting focus to Asia Pacific

The construction and automotive industries are witnessing rapid growth in Asia Pacific, creating ample opportunities for matting agent producers to commercialize their products in decorative paints and automotive interiors. Growing awareness among consumers and rising demand for antiglare properties in various industries are expected to benefit the matting agents market in the region. Matting agents are used as additive in architectural coatings , industrial coatings, and printing inks across end-use industries such as construction, automotive, furniture, footwear and electrical and electronics.

Challenges: Adoption of new technologies

The difficulty in attaining widespread acceptance of a technology that may modify how one formulates is high. This implies that the manufacturer’s offerings must either be transformational or aid in effectively applying a new coating. Collaborations in the coating technology between matting agent manufacturers and raw material suppliers will be necessary to bring forward new coating technologies. The firm or manufacturer must demonstrate that they are knowledgeable in their field and can cater to their demands with feasible solutions. The industry is still very conservative and reluctant to take new forms of cooperation, such as open innovation.

Matting Agents Market Ecosystem

The value chain of the coating additives industry includes the entire process of converting raw materials—resins, solvents, pigments, hardeners—into finished additives for various applications in end-use industries, such as architecture, automotive, general industrial, protective, wood, and printing inks. The coating additive industry focuses on advanced, sustainable, cost-effective, high-performance materials that offer less permeability, thereby increasing the product’s shelf-life. It is undergoing continuous technological upgrades concerning the design and development of raw materials.


Matting Agents Market Ecosystem

Based on the material, silica was the largest segment of the matting agents market, in terms of value, in 2022.

Silica-based matting agents accounted for a major share of the global market, in terms of value, in 2022. Silica is majorly used as a matting agent owing to its compatibility with coating formulations. Both precipitated and pyrogenic silica are used as matting agents in various applications. However, some of the silica-based matting agents are treated with waxes and other chemicals to change their chemical properties and improve the matte finish.

Based on technology, water-borne were the largest segment of the matting agents market, in terms of value, in 2022.

Water-based matting agents accounted for the largest share of the global market in terms of value in 2022. Stringent government regulations for the manufacture of environmentally friendly products in developed markets have pushed the coatings industry to invest in finding alternatives that meet regulatory standards. The use of water-based inks is increasingly becoming common due to concerns regarding the use of organic solvents in coating additives such as surface and rheology modifiers.

Based on application, architectural was the largest segment of the matting agents market, in terms of value, in 2022.

The architectural coatings application led the matting agents market and accounted for the largest in global market, in terms of value, in 2022. Matting agents used in architectural coatings provide corrosion and temperature resistance and antiglare properties in end products. The growing popularity of the matte finish among consumers in both developed and emerging nations, coupled with the growth in the construction industry, is estimated to drive the matting agents market in architectural coatings.

Based on application, skin care was the largest segment of the matting agents market, in terms of value, in 2022.

Matting agents are used in skincare and hair care products to deliver the proposed benefits. The skin care application accounted for the larger market share, in terms of value, of the global matting agents market in 2022. It is estimated to have high demand due to growing aspirations to have younger skin and even skin tone and aging population growth. The increasing impact of global warming, with a rise in excess heat levels, is surging the demand for sun protection and moisturizing agents.

Asia Pacific accounted for the largest market share of the matting agents market, in terms of value, in 2022.

The construction industry has witnessed significant growth over the past few years in Asia Pacific. The demand for coatings is expected to grow due to the increase in construction activities, which is supported by rapid urbanization and growing household maintenance activities globally. The demand for coatings has been negatively impacted due to stringent government regulations and high safety standards regarding the use of volatile organic compounds. However, the development of environment-friendly matting agents such as water-based, powder, and high solids is expected to drive the matting agents market.

Matting Agents Market by Region

To know about the assumptions considered for the study, download the pdf brochure

Matting Agents Market Players

The key players in this market are Evonik Industries AG (Germany), PPG Industries, Inc. (US), Huntsman International LLC (US), Imerys S.A. (France), W. R. Grace & Co.-Conn. (US), J.M. Huber Corporation (US), ALTANA (Germany), Akzo Nobel N.V. (Netherlands), Arkema S.A. (France), and Lubrizol Corporation (US) and others. These are the key manufacturers that secured a major market share in the last few years.

Matting Agents Market Report Scope

Report Metric

Details

Years considered for the study

2017–2028

Base year considered

2022

Forecast period

2023–2028

Units considered

Value (USD Million)

Segments Covered

Material, Technology, Application, and Region

Regions covered

Asia Pacific, North America, Europe, Middle East & Africa, and South America

Companies profiled

The key players profiled in the report are Evonik Industries AG (Germany), PPG Industries, Inc. (US), Huntsman International LLC (US), Imerys S.A. (France), W. R. Grace & Co.-Conn. (US), J.M. Huber Corporation (US), ALTANA (Germany), Akzo Nobel N.V. (Netherlands), Arkema S.A. (France), and Lubrizol Corporation (US) and others.

This report categorizes the global matting agents market based on material, technology, application, and region.

On the basis of Material, the matting agents market has been segmented as follows:
  • Silica
  • Waxes
  • Thermoplastics
  • Others
On the basis of Technology, the matting agents market has been segmented as follows:
  • Water-borne
  • Solvent-borne
  • Powder
  • Radiation cure & High Solids
On the basis of Application, the matting agents market has been segmented as follows: 
On the basis of region, the matting agents market has been segmented as follows:
  • Asia Pacific
  • North America
  • Europe
  • Middle East & Arica
  • South America

Recent Developments

  • In March 2023, BYK, subsegment of ALTANA launched three new additives under the CERAFLOUR product line. With the corn starch-based polymers with wax-like properties, BYK has further expanded its portfolio of sustainable additives. Both additives ensure good matting while maintaining high transparency.
  • In March 2023, BYK officially opened its second manufacturing facility in China, expanding existing premises with laboratories and administration in Shanghai. With an initial output of 4,750 tonnes, the integrated site is part of a larger project at Shanghai Chemical Industry Park (SCIP).
  • In March 2023, AkzoNobel Aerospace Coatings launched Aerofleet Coatings Management, a new digital, data-driven service that helps airlines and other large operators to tailor and optimize the coatings’ replacement and maintenance schedule for individual aircraft within an airline fleet.
  • In July 2022, Evonik launched three new silicas from the specialty chemicals group that are characterized by a combination of efficient, ultra-deep matting, high transparency, and extremely fine surface haptics. All three matting agents can be used universally in water- and solvent-based systems as well as in pigmented and clear formulations.
  • In August 2022, Evonik’s Coating Additives business line is expanding the production capacity of its ACEMATT precipitated matting agents at its manufacturing facility in Taiwan.s.

Frequently Asked Questions (FAQ):

To speak to our analyst for a discussion on the above findings, click Speak to Analyst

Exclusive indicates content/data unique to MarketsandMarkets and not available with any competitors.

INTRODUCTION
23
RESEARCH METHODOLOGY
29
EXECUTIVE SUMMARY
40
PREMIUM INSIGHTS
43
MARKET OVERVIEW
46
  • 5.1 INTRODUCTION
  • 5.2 MARKET DYNAMICS
    DRIVERS
    - Increasing demand from end-use industries
    - Growth of construction sector
    - Superior properties of glossy finishes
    - Technological advancements in powder coating technology
    RESTRAINTS
    - Stringent regulatory policies
    - Requirement of more drying time for waterborne matting agents
    OPPORTUNITIES
    - Shifting focus to Asia Pacific
    - Investments in emerging economies
    CHALLENGES
    - Difficulties in use of water-based, radiation cure, and solvent-based coatings
    - Adoption of new technologies
  • 5.3 PORTER’S FIVE FORCES ANALYSIS
    THREAT OF NEW ENTRANTS
    THREAT OF SUBSTITUTES
    BARGAINING POWER OF SUPPLIERS
    BARGAINING POWER OF BUYERS
    INTENSITY OF COMPETITIVE RIVALRY
  • 5.4 MACROECONOMIC INDICATORS
    GDP TRENDS AND FORECASTS FOR MAJOR ECONOMIES
INDUSTRY TRENDS
55
  • 6.1 SUPPLY CHAIN ANALYSIS
    RAW MATERIALS
    MANUFACTURERS
    DISTRIBUTION NETWORK
    END-USE INDUSTRIES
  • 6.2 KEY STAKEHOLDERS & BUYING CRITERIA
    KEY STAKEHOLDERS IN BUYING PROCESS
    BUYING CRITERIA
  • 6.3 PRICING ANALYSIS
    AVERAGE SELLING PRICE TREND, BY REGION
    AVERAGE SELLING PRICE TREND OF KEY PLAYERS, BY APPLICATION
  • 6.4 TRENDS/DISRUPTIONS IMPACTING BUSINESSES
    REVENUE SHIFTS & NEW REVENUE POCKETS FOR MATTING AGENTS MARKET
  • 6.5 ECOSYSTEM MAPPING
  • 6.6 TECHNOLOGY ANALYSIS
    SUPERCRITICAL FLUID EXTRACTION TECHNOLOGY
  • 6.7 CASE STUDY ANALYSIS
    CASE STUDY: USE OF ORGANIC MATTING AGENT TO MODIFY ESTHETICS OF INDUSTRIAL COATINGS MADE WITH ALUMINUM FLAKE PIGMENTS
  • 6.8 TRADE DATA STATISTICS
    IMPORT SCENARIO OF MATTING AGENTS
    EXPORT SCENARIO OF MATTING AGENTS
  • 6.9 TARIFF AND REGULATORY LANDSCAPE
    LEGISLATIVE AND REGULATORY POLICY UPDATE
    - VOC regulations
    - HAP regulations
    - Regulations on use of matting agents
    REGULATORY BODIES, GOVERNMENT AGENCIES, AND OTHER ORGANIZATIONS
  • 6.10 KEY CONFERENCES & EVENTS IN 2023–2024
  • 6.11 PATENT ANALYSIS
    APPROACH
    DOCUMENT TYPE
    JURISDICTION ANALYSIS
    TOP APPLICANTS
MATTING AGENTS MARKET, BY MATERIAL
75
  • 7.1 INTRODUCTION
  • 7.2 SILICA
  • 7.3 WAXES
  • 7.4 THERMOPLASTICS
  • 7.5 OTHERS
MATTING AGENTS MARKET, BY TECHNOLOGY
79
  • 8.1 INTRODUCTION
  • 8.2 WATER-BORNE
  • 8.3 SOLVENT-BORNE
  • 8.4 POWDER
  • 8.5 RADIATION CURE AND HIGH SOLIDS
MATTING AGENTS MARKET, BY APPLICATION
83
  • 9.1 INTRODUCTION
  • 9.2 INDUSTRIAL COATINGS
    ADHESION, DURABILITY, AND CHEMICAL RESISTANCE PROPERTIES TO DRIVE MARKET
    AUTOMOTIVE COATINGS
    CAN AND COIL COATINGS
    GENERAL INDUSTRIAL COATINGS
    OTHER INDUSTRIAL COATINGS
  • 9.3 ARCHITECTURAL COATINGS
    GROWING PREFERENCE FOR MATTE FINISH TO FUEL DEMAND
  • 9.4 LEATHER COATINGS
    FOCUS ON LUXURY AND PREMIUM LEATHER PRODUCTS TO DRIVE MARKET
  • 9.5 WOOD COATINGS
    SUSTAINABILITY, TECHNOLOGICAL ADVANCEMENTS, AND COMPLIANCE WITH REGULATIONS TO FUEL MARKET
  • 9.6 PRINTING INKS
    ADVANCEMENTS IN INK FORMULATIONS TO BOOST MARKET
  • 9.7 OTHER APPLICATIONS
MATTING AGENTS MARKET, BY REGION
99
  • 10.1 INTRODUCTION
  • 10.2 ASIA PACIFIC
    RECESSION IMPACT
    ASIA PACIFIC: MATTING AGENTS MARKET, BY APPLICATION
    ASIA PACIFIC: MATTING AGENTS MARKET, BY COUNTRY
    CHINA
    - Rising demand from housing activity to drive market
    JAPAN
    - Investments in residential and infrastructural sectors to drive market
    INDIA
    - Population growth, rising income levels, and minimal regulatory intervention to propel market
    SOUTH KOREA
    - Increasing requirements for automotive refinishing to drive market
    INDONESIA
    - Strong growth of end-use industries to drive market
    VIETNAM
    - Economic development programs in agricultural and infrastructure sectors to drive market
    THAILAND
    - Global sustainability initiatives to propel market
    MALAYSIA
    - Low labor and production costs to drive market
  • 10.3 NORTH AMERICA
    RECESSION IMPACT
    NORTH AMERICA: MATTING AGENTS MARKET, BY APPLICATION
    NORTH AMERICA: MATTING AGENTS MARKET, BY COUNTRY
    US
    - Urbanization, growth in construction activities, and high demand from automotive industry to drive market
    CANADA
    - Increasing construction activities and developed automotive sector to drive market
    MEXICO
    - Construction output and growth in local manufacturing businesses to boost market
  • 10.4 EUROPE
    RECESSION IMPACT
    EUROPE: MATTING AGENTS MARKET, BY APPLICATION
    EUROPE: MATTING AGENTS MARKET, BY COUNTRY
    GERMANY
    - High level of industrialization and automotive production to drive market
    UK
    - Trade agreements and regulations that affect automotive industry to drive market
    FRANCE
    - Residential construction and automotive coatings to drive market
    ITALY
    - Foreign direct investments in manufacturing sector to fuel demand for matting agents
    NETHERLANDS
    - Low-VOC and water-based systems to boost demand
    SPAIN
    - Significant production of paint and other chemicals to drive market
  • 10.5 MIDDLE EAST & AFRICA
    RECESSION IMPACT
    MIDDLE EAST & AFRICA: MATTING AGENTS MARKET, BY APPLICATION
    MIDDLE EAST & AFRICA: MATTING AGENTS MARKET, BY COUNTRY
    SAUDI ARABIA
    - Infrastructural developments to drive market
    UAE
    - Rising investments in infrastructure to drive market
    EGYPT
    - Strong demand for decorative paints to drive market
  • 10.6 SOUTH AMERICA
    RECESSION IMPACT
    SOUTH AMERICA: MATTING AGENTS MARKET, BY APPLICATION
    SOUTH AMERICA: MATTING AGENTS MARKET, BY COUNTRY
    BRAZIL
    - Rising home ownership and increasing living standards to drive market
    ARGENTINA
    - Increase in public funds offered by government to fuel market
COMPETITIVE LANDSCAPE
166
  • 11.1 INTRODUCTION
  • 11.2 KEY PLAYER STRATEGIES
  • 11.3 RANKING OF KEY MARKET PLAYERS, 2022
  • 11.4 MARKET SHARE ANALYSIS
  • 11.5 REVENUE ANALYSIS OF TOP 5 PLAYERS
  • 11.6 COMPANY EVALUATION MATRIX (TIER 1)
    STARS
    EMERGING LEADERS
    PERVASIVE PLAYERS
    PARTICIPANTS
    COMPANY FOOTPRINT
  • 11.7 START-UP/SME EVALUATION MATRIX
    PROGRESSIVE COMPANIES
    RESPONSIVE COMPANIES
    DYNAMIC COMPANIES
    STARTING BLOCKS
    COMPETITIVE BENCHMARKING
  • 11.8 COMPETITIVE SITUATIONS AND TRENDS
    PRODUCT LAUNCHES
    DEALS
    OTHER DEVELOPMENTS
COMPANY PROFILES
183
  • 12.1 KEY PLAYERS
    EVONIK INDUSTRIES AG
    - Business overview
    - Products/Solutions/Services offered
    - Recent developments
    - MnM view
    PPG INDUSTRIES, INC.
    - Business overview
    - Products/Solutions/Services offered
    - MnM view
    HUNTSMAN INTERNATIONAL LLC
    - Business overview
    - Products/Solutions/Services offered
    - MnM view
    IMERYS S.A.
    - Business overview
    - Products/Solutions/Services offered
    - MnM view
    W. R. GRACE & CO.-CONN.
    - Business overview
    - Products/Solutions/Services offered
    J.M. HUBER CORPORATION
    - Business overview
    - Products/Solutions/Services offered
    ALTANA
    - Business overview
    - Products/Solutions/Services offered
    - Recent developments
    - MnM view
    AKZONOBEL N.V.
    - Business overview
    - Products/Solutions/Services offered
    - Recent developments
    - MnM view
    ARKEMA S.A.
    - Business overview
    - Products offered
    - MnM view
    LUBRIZOL CORPORATION
    - Products/Solutions/Services offered
  • 12.2 OTHER PLAYERS
    ALLNEX
    PQ CORPORATION
    AXALTA COATING SYSTEM
    MICHELMAN, INC.
    CHT GERMANY GMBH
    HEUBACH COLOUR PVT. LTD.
    VIACOR POLYMER GMBH
    TOYOBO CO., LTD.
    REMMERS AG
    DOG CHEMIE
    THOMAS SWAN CO. & LTD.
    WATTYL INDUSTRIAL COATINGS
    CHROMA COLOR CORPORATION
    DALIAN FUCHANG CHEMICAL GROUP CO., LTD.
    DEUTERON GMBH
ADJACENT & RELATED MARKETS
218
  • 13.1 INTRODUCTION
  • 13.2 LIMITATIONS
  • 13.3 COATING ADDITIVES MARKET
    MARKET DEFINITION
    MARKET OVERVIEW
    COATING ADDITIVES MARKET, BY REGION
    - Asia Pacific
    - North America
    - Europe
    - South America
    - Middle East & Africa
APPENDIX
231
  • 14.1 DISCUSSION GUIDE
  • 14.2 KNOWLEDGESTORE: MARKETSANDMARKETS’ SUBSCRIPTION PORTAL
  • 14.3 CUSTOMIZATION OPTIONS
  • 14.4 RELATED REPORTS
  • 14.5 AUTHOR DETAILS
LIST OF TABLES
 
  • TABLE 1 MATTING AGENTS MARKET: PORTER’S FIVE FORCES ANALYSIS
  • TABLE 2 GDP TRENDS AND FORECAST FOR MAJOR ECONOMIES, 2020–2028 (USD BILLION)
  • TABLE 3 INFLUENCE OF STAKEHOLDERS ON BUYING PROCESS FOR TOP 3 APPLICATIONS (%)
  • TABLE 4 KEY BUYING CRITERIA FOR TOP 3 END-USE INDUSTRIES
  • TABLE 5 AVERAGE SELLING PRICE TREND OF MATTING AGENTS, BY REGION (USD/KG)
  • TABLE 6 AVERAGE SELLING PRICE TREND OF KEY PLAYERS, BY APPLICATION (USD/KG)
  • TABLE 7 MATTING AGENTS MARKET: ECOSYSTEM MAPPING
  • TABLE 8 IMPORT OF MATTING AGENTS, BY REGION, 2013–2022 (USD MILLION)
  • TABLE 9 EXPORT OF MATTING AGENTS, BY REGION, 2013–2022 (USD MILLION)
  • TABLE 10 NORTH AMERICA: REGULATORY BODIES, GOVERNMENT AGENCIES, AND OTHER ORGANIZATIONS
  • TABLE 11 EUROPE: REGULATORY BODIES, GOVERNMENT AGENCIES, AND OTHER ORGANIZATIONS
  • TABLE 12 MIDDLE EAST & AFRICA: REGULATORY BODIES, GOVERNMENT AGENCIES, AND OTHER ORGANIZATIONS
  • TABLE 13 ASIA PACIFIC: REGULATORY BODIES, GOVERNMENT AGENCIES, AND OTHER ORGANIZATIONS
  • TABLE 14 MATTING AGENTS MARKET: CONFERENCES & EVENTS
  • TABLE 15 TOTAL NUMBER OF PATENTS IN LAST 11 YEARS (2012–2022 )
  • TABLE 16 PATENTS BY FUJIFILM HOLDINGS CORPORATION
  • TABLE 17 PATENTS BY MITSUBISHI GAS CHEMICAL COMPANY, INC.
  • TABLE 18 TOP 10 PATENT OWNERS IN US, 2012–2022
  • TABLE 19 MATTING AGENTS MARKET, BY MATERIAL, 2017–2021 (USD MILLION)
  • TABLE 20 MATTING AGENTS MARKET, BY MATERIAL, 2022–2028 (USD MILLION)
  • TABLE 21 MATTING AGENTS MARKET, BY MATERIAL, 2017–2021 (TON)
  • TABLE 22 MATTING AGENTS MARKET, BY MATERIAL, 2022–2028 (TON)
  • TABLE 23 MATTING AGENTS MARKET, BY TECHNOLOGY, 2017–2021 (USD MILLION)
  • TABLE 24 MATTING AGENTS MARKET, BY TECHNOLOGY, 2022–2028 (USD MILLION)
  • TABLE 25 MATTING AGENTS MARKET, BY TECHNOLOGY, 2017–2021 (TON)
  • TABLE 26 MATTING AGENTS MARKET, BY TECHNOLOGY, 2022–2028 (TON)
  • TABLE 27 MATTING AGENTS MARKET, BY APPLICATION, 2017–2021 (USD MILLION)
  • TABLE 28 MATTING AGENTS MARKET, BY APPLICATION, 2022–2028 (USD MILLION)
  • TABLE 29 MATTING AGENTS MARKET, BY APPLICATION, 2017–2021 (TON)
  • TABLE 30 MATTING AGENTS MARKET, BY APPLICATION, 2022–2028 (TON)
  • TABLE 31 INDUSTRIAL COATINGS: MATTING AGENTS MARKET, BY SUB-APPLICATION, 2017–2021 (USD MILLION)
  • TABLE 32 INDUSTRIAL COATINGS: MATTING AGENTS MARKET, BY SUB-APPLICATION, 2022–2028 (USD MILLION)
  • TABLE 33 INDUSTRIAL COATINGS: MATTING AGENTS MARKET, BY SUB-APPLICATION, 2017–2021 (TON)
  • TABLE 34 INDUSTRIAL COATINGS: MATTING AGENTS MARKET, BY SUB-APPLICATION, 2022–2028 (TON)
  • TABLE 35 INDUSTRIAL COATINGS: MATTING AGENTS MARKET, BY REGION, 2017–2021 (USD MILLION)
  • TABLE 36 INDUSTRIAL COATINGS: MATTING AGENTS MARKET, BY REGION, 2022–2028 (USD MILLION)
  • TABLE 37 INDUSTRIAL COATINGS: MATTING AGENTS MARKET, BY REGION, 2017–2021 (TON)
  • TABLE 38 INDUSTRIAL COATINGS: MATTING AGENTS MARKET, BY REGION, 2022–2028 (TON)
  • TABLE 39 ARCHITECTURAL COATINGS: MATTING AGENTS MARKET, BY REGION, 2017–2021 (USD MILLION)
  • TABLE 40 ARCHITECTURAL COATINGS: MATTING AGENTS MARKET, BY REGION, 2022–2028 (USD MILLION)
  • TABLE 41 ARCHITECTURAL COATINGS: MATTING AGENTS MARKET, BY REGION, 2017–2021 (TON)
  • TABLE 42 ARCHITECTURAL COATINGS: MATTING AGENTS MARKET, BY REGION, 2022–2028 (TON)
  • TABLE 43 LEATHER COATINGS: MATTING AGENTS MARKET, BY REGION, 2017–2021 (USD MILLION)
  • TABLE 44 LEATHER COATINGS: MATTING AGENTS MARKET, BY REGION, 2022–2028 (USD MILLION)
  • TABLE 45 LEATHER COATINGS: MATTING AGENTS MARKET, BY REGION, 2017–2021 (TON)
  • TABLE 46 LEATHER COATINGS: MATTING AGENTS MARKET, BY REGION, 2022–2028 (TON)
  • TABLE 47 WOOD COATINGS: MATTING AGENTS MARKET, BY REGION, 2017–2021 (USD MILLION)
  • TABLE 48 WOOD COATINGS: MATTING AGENTS MARKET, BY REGION, 2022–2028 (USD MILLION)
  • TABLE 49 WOOD COATINGS: MATTING AGENTS MARKET, BY REGION, 2017–2021 (TON)
  • TABLE 50 WOOD COATINGS: MATTING AGENTS MARKET, BY REGION, 2022–2028 (TON)
  • TABLE 51 PRINTING INKS: MATTING AGENTS MARKET, BY REGION, 2017–2021 (USD MILLION)
  • TABLE 52 PRINTING INKS: MATTING AGENTS MARKET, BY REGION, 2022–2028 (USD MILLION)
  • TABLE 53 PRINTING INKS: MATTING AGENTS MARKET, BY REGION, 2017–2021 (TON)
  • TABLE 54 PRINTING INKS: MATTING AGENTS MARKET, BY REGION, 2022–2028 (TON)
  • TABLE 55 OTHERS: MATTING AGENTS MARKET, BY REGION, 2017–2021 (USD MILLION)
  • TABLE 56 OTHERS: MATTING AGENTS MARKET, BY REGION, 2022–2028 (USD MILLION)
  • TABLE 57 OTHERS: MATTING AGENTS MARKET, BY REGION, 2017–2021 (TON)
  • TABLE 58 OTHERS: MATTING AGENTS MARKET, BY REGION, 2022–2028 (TON)
  • TABLE 59 MATTING AGENTS MARKET, BY REGION, 2017–2021 (USD MILLION)
  • TABLE 60 MATTING AGENTS MARKET, BY REGION, 2022–2028 (USD MILLION)
  • TABLE 61 MATTING AGENTS MARKET, BY REGION, 2017–2021 (TON)
  • TABLE 62 MATTING AGENTS MARKET, BY REGION, 2022–2028 (TON)
  • TABLE 63 ASIA PACIFIC: MATTING AGENTS MARKET, BY APPLICATION, 2017–2021 (USD MILLION)
  • TABLE 64 ASIA PACIFIC: MATTING AGENTS MARKET, BY APPLICATION, 2022–2028 (USD MILLION)
  • TABLE 65 ASIA PACIFIC: MATTING AGENTS MARKET, BY APPLICATION, 2017–2021 (TON)
  • TABLE 66 ASIA PACIFIC: MATTING AGENTS MARKET, BY APPLICATION, 2022–2028 (TON)
  • TABLE 67 ASIA PACIFIC: MATTING AGENTS MARKET, BY COUNTRY, 2017–2021 (USD MILLION)
  • TABLE 68 ASIA PACIFIC: MATTING AGENTS MARKET, BY COUNTRY, 2022–2028 (USD MILLION)
  • TABLE 69 ASIA PACIFIC: MATTING AGENTS MARKET, BY COUNTRY, 2017–2021 (TON)
  • TABLE 70 ASIA PACIFIC: MATTING AGENTS MARKET, BY COUNTRY, 2022–2028 (TON)
  • TABLE 71 CHINA: MATTING AGENTS MARKET, BY APPLICATION, 2017–2021 (USD MILLION)
  • TABLE 72 CHINA: MATTING AGENTS MARKET, BY APPLICATION, 2022–2028 (USD MILLION)
  • TABLE 73 CHINA: MATTING AGENTS MARKET, BY APPLICATION, 2017–2021 (TON)
  • TABLE 74 CHINA: MATTING AGENTS MARKET, BY APPLICATION, 2022–2028 (TON)
  • TABLE 75 JAPAN: MATTING AGENTS MARKET, BY APPLICATION, 2017–2021 (USD MILLION)
  • TABLE 76 JAPAN: MATTING AGENTS MARKET, BY APPLICATION, 2022–2028 (USD MILLION)
  • TABLE 77 JAPAN: MATTING AGENTS MARKET, BY APPLICATION, 2017–2021 (TON)
  • TABLE 78 JAPAN: MATTING AGENTS MARKET, BY APPLICATION, 2022–2028 (TON)
  • TABLE 79 INDIA: MATTING AGENTS MARKET, BY APPLICATION, 2017–2021 (USD MILLION)
  • TABLE 80 INDIA: MATTING AGENTS MARKET, BY APPLICATION, 2022–2028 (USD MILLION)
  • TABLE 81 INDIA: MATTING AGENTS MARKET, BY APPLICATION, 2017–2021 (TON)
  • TABLE 82 INDIA: MATTING AGENTS MARKET, BY APPLICATION, 2022–2028 (TON)
  • TABLE 83 SOUTH KOREA: MATTING AGENTS MARKET, BY APPLICATION, 2017–2021 (USD MILLION)
  • TABLE 84 SOUTH KOREA: MATTING AGENTS MARKET, BY APPLICATION, 2022–2028 (USD MILLION)
  • TABLE 85 SOUTH KOREA: MATTING AGENTS MARKET, BY APPLICATION, 2017–2021 (TON)
  • TABLE 86 SOUTH KOREA: MATTING AGENTS MARKET, BY APPLICATION, 2022–2028 (TON)
  • TABLE 87 INDONESIA: MATTING AGENTS MARKET, BY APPLICATION, 2017–2021 (USD MILLION)
  • TABLE 88 INDONESIA: MATTING AGENTS MARKET, BY APPLICATION, 2022–2028 (USD MILLION)
  • TABLE 89 INDONESIA: MATTING AGENTS MARKET, BY APPLICATION, 2017–2021 (TON)
  • TABLE 90 INDONESIA: MATTING AGENTS MARKET, BY APPLICATION, 2022–2028 (TON)
  • TABLE 91 VIETNAM: MATTING AGENTS MARKET, BY APPLICATION, 2017–2021 (USD MILLION)
  • TABLE 92 VIETNAM: MATTING AGENTS MARKET, BY APPLICATION, 2022–2028 (USD MILLION)
  • TABLE 93 VIETNAM: MATTING AGENTS MARKET, BY APPLICATION, 2017–2021 (TON)
  • TABLE 94 VIETNAM: MATTING AGENTS MARKET, BY APPLICATION, 2022–2028 (TON)
  • TABLE 95 THAILAND: MATTING AGENTS MARKET, BY APPLICATION, 2017–2021 (USD MILLION)
  • TABLE 96 THAILAND: MATTING AGENTS MARKET, BY APPLICATION, 2022–2028 (USD MILLION)
  • TABLE 97 THAILAND: MATTING AGENTS MARKET, BY APPLICATION, 2017–2021 (TON)
  • TABLE 98 THAILAND: MATTING AGENTS MARKET, BY APPLICATION, 2022–2028 (TON)
  • TABLE 99 MALAYSIA: MATTING AGENTS MARKET, BY APPLICATION, 2017–2021 (USD MILLION)
  • TABLE 100 MALAYSIA: MATTING AGENTS MARKET, BY APPLICATION, 2022–2028 (USD MILLION)
  • TABLE 101 MALAYSIA: MATTING AGENTS MARKET, BY APPLICATION, 2017–2021 (TON)
  • TABLE 102 MALAYSIA: MATTING AGENTS MARKET, BY APPLICATION, 2022–2028 (TON)
  • TABLE 103 NORTH AMERICA: MATTING AGENTS MARKET, BY APPLICATION, 2017–2021 (USD MILLION)
  • TABLE 104 NORTH AMERICA: MATTING AGENTS MARKET, BY APPLICATION, 2022–2028 (USD MILLION)
  • TABLE 105 NORTH AMERICA: MATTING AGENTS MARKET, BY APPLICATION, 2017–2021 (TON)
  • TABLE 106 NORTH AMERICA: MATTING AGENTS MARKET, BY APPLICATION, 2022–2028 (TON)
  • TABLE 107 NORTH AMERICA: MATTING AGENTS MARKET, BY COUNTRY, 2017–2021 (USD MILLION)
  • TABLE 108 NORTH AMERICA: MATTING AGENTS MARKET, BY COUNTRY, 2022–2028 (USD MILLION)
  • TABLE 109 NORTH AMERICA: MATTING AGENTS MARKET, BY COUNTRY, 2017–2021 (TON)
  • TABLE 110 NORTH AMERICA: MATTING AGENTS MARKET, BY COUNTRY, 2022–2028 (TON)
  • TABLE 111 US: MATTING AGENTS MARKET, BY APPLICATION, 2017–2021 (USD MILLION)
  • TABLE 112 US: MATTING AGENTS MARKET, BY APPLICATION, 2022–2028 (USD MILLION)
  • TABLE 113 US: MATTING AGENTS MARKET, BY APPLICATION, 2017–2021 (TON)
  • TABLE 114 US: MATTING AGENTS MARKET, BY APPLICATION, 2022–2028 (TON)
  • TABLE 115 CANADA: MATTING AGENTS MARKET, BY APPLICATION, 2017–2021 (USD MILLION)
  • TABLE 116 CANADA: MATTING AGENTS MARKET, BY APPLICATION, 2022–2028 (USD MILLION)
  • TABLE 117 CANADA: MATTING AGENTS MARKET, BY APPLICATION, 2017–2021 (TON)
  • TABLE 118 CANADA: MATTING AGENTS MARKET, BY APPLICATION, 2022–2028 (TON)
  • TABLE 119 MEXICO: MATTING AGENTS MARKET, BY APPLICATION, 2017–2021 (USD MILLION)
  • TABLE 120 MEXICO: MATTING AGENTS MARKET, BY APPLICATION, 2022–2028 (USD MILLION)
  • TABLE 121 MEXICO: MATTING AGENTS MARKET, BY APPLICATION, 2017–2021 (TON)
  • TABLE 122 MEXICO: MATTING AGENTS MARKET, BY APPLICATION, 2022–2028 (TON)
  • TABLE 123 EUROPE: MATTING AGENTS MARKET, BY APPLICATION, 2017–2021 (USD MILLION)
  • TABLE 124 EUROPE: MATTING AGENTS MARKET, BY APPLICATION, 2022–2028 (USD MILLION)
  • TABLE 125 EUROPE: MATTING AGENTS MARKET, BY APPLICATION, 2017–2021 (TON)
  • TABLE 126 EUROPE: MATTING AGENTS MARKET, BY APPLICATION, 2022–2028 (TON)
  • TABLE 127 EUROPE: MATTING AGENTS MARKET, BY COUNTRY, 2017–2021 (USD MILLION)
  • TABLE 128 EUROPE: MATTING AGENTS MARKET, BY COUNTRY, 2022–2028 (USD MILLION)
  • TABLE 129 EUROPE: MATTING AGENTS MARKET, BY COUNTRY, 2017–2021 (TON)
  • TABLE 130 EUROPE: MATTING AGENTS MARKET, BY COUNTRY, 2022–2028 (TON)
  • TABLE 131 GERMANY: MATTING AGENTS MARKET, BY APPLICATION, 2017–2021 (USD MILLION)
  • TABLE 132 GERMANY: MATTING AGENTS MARKET, BY APPLICATION, 2022–2028 (USD MILLION)
  • TABLE 133 GERMANY: MATTING AGENTS MARKET, BY APPLICATION, 2017–2021 (TON)
  • TABLE 134 GERMANY: MATTING AGENTS MARKET, BY APPLICATION, 2022–2028 (TON)
  • TABLE 135 UK: MATTING AGENTS MARKET, BY APPLICATION, 2017–2021 (USD MILLION)
  • TABLE 136 UK: MATTING AGENTS MARKET, BY APPLICATION, 2022–2028 (USD MILLION)
  • TABLE 137 UK: MATTING AGENTS MARKET, BY APPLICATION, 2017–2021 (TON)
  • TABLE 138 UK: MATTING AGENTS MARKET, BY APPLICATION, 2022–2028 (TON)
  • TABLE 139 FRANCE: MATTING AGENTS MARKET, BY APPLICATION, 2017–2021 (USD MILLION)
  • TABLE 140 FRANCE: MATTING AGENTS MARKET, BY APPLICATION, 2022–2028 (USD MILLION)
  • TABLE 141 FRANCE: MATTING AGENTS MARKET, BY APPLICATION, 2017–2021 (TON)
  • TABLE 142 FRANCE: MATTING AGENTS MARKET, BY APPLICATION, 2022–2028 (TON)
  • TABLE 143 ITALY: MATTING AGENTS MARKET, BY APPLICATION, 2017–2021 (USD MILLION)
  • TABLE 144 ITALY: MATTING AGENTS MARKET, BY APPLICATION, 2022–2028 (USD MILLION)
  • TABLE 145 ITALY: MATTING AGENTS MARKET, BY APPLICATION, 2017–2021 (TON)
  • TABLE 146 ITALY: MATTING AGENTS MARKET, BY APPLICATION, 2022–2028 (TON)
  • TABLE 147 NETHERLANDS: MATTING AGENTS MARKET, BY APPLICATION, 2017–2021 (USD MILLION)
  • TABLE 148 NETHERLANDS: MATTING AGENTS MARKET, BY APPLICATION, 2022–2028 (USD MILLION)
  • TABLE 149 NETHERLANDS: MATTING AGENTS MARKET, BY APPLICATION, 2017–2021 (TON)
  • TABLE 150 NETHERLANDS: MATTING AGENTS MARKET, BY APPLICATION, 2022–2028 (TON)
  • TABLE 151 SPAIN: MATTING AGENTS MARKET, BY APPLICATION, 2017–2021 (USD MILLION)
  • TABLE 152 SPAIN: MATTING AGENTS MARKET, BY APPLICATION, 2022–2028 (USD MILLION)
  • TABLE 153 SPAIN: MATTING AGENTS MARKET, BY APPLICATION, 2017–2021 (TON)
  • TABLE 154 SPAIN: MATTING AGENTS MARKET, BY APPLICATION, 2022–2028 (TON)
  • TABLE 155 MIDDLE EAST & AFRICA: MATTING AGENTS MARKET, BY APPLICATION, 2017–2021 (USD MILLION)
  • TABLE 156 MIDDLE EAST & AFRICA: MATTING AGENTS MARKET, BY APPLICATION, 2022–2028 (USD MILLION)
  • TABLE 157 MIDDLE EAST & AFRICA: MATTING AGENTS MARKET, BY APPLICATION, 2017–2021 (TON)
  • TABLE 158 MIDDLE EAST & AFRICA: MATTING AGENTS MARKET, BY APPLICATION, 2022–2028 (TON)
  • TABLE 159 MIDDLE EAST & AFRICA: MATTING AGENTS MARKET, BY COUNTRY, 2017–2021 (USD MILLION)
  • TABLE 160 MIDDLE EAST & AFRICA: MATTING AGENTS MARKET, BY COUNTRY, 2022–2028 (USD MILLION)
  • TABLE 161 MIDDLE EAST & AFRICA: MATTING AGENTS MARKET, BY COUNTRY, 2017–2021 (TON)
  • TABLE 162 MIDDLE EAST & AFRICA: MATTING AGENTS MARKET, BY COUNTRY, 2022–2028 (TON)
  • TABLE 163 SAUDI ARABIA: MATTING AGENTS MARKET, BY APPLICATION, 2017–2021 (USD MILLION)
  • TABLE 164 SAUDI ARABIA: MATTING AGENTS MARKET, BY APPLICATION, 2022–2028 (USD MILLION)
  • TABLE 165 SAUDI ARABIA: MATTING AGENTS MARKET, BY APPLICATION, 2017–2021 (TON)
  • TABLE 166 SAUDI ARABIA: MATTING AGENTS MARKET, BY APPLICATION, 2022–2028 (TON)
  • TABLE 167 UAE: MATTING AGENTS MARKET, BY APPLICATION, 2017–2021 (USD MILLION)
  • TABLE 168 UAE: MATTING AGENTS MARKET, BY APPLICATION, 2022–2028 (USD MILLION)
  • TABLE 169 UAE: MATTING AGENTS MARKET, BY APPLICATION, 2017–2021 (TON)
  • TABLE 170 UAE: MATTING AGENTS MARKET, BY APPLICATION, 2022–2028 (TON)
  • TABLE 171 EGYPT: MATTING AGENTS MARKET, BY APPLICATION, 2017–2021 (USD MILLION)
  • TABLE 172 EGYPT: MATTING AGENTS MARKET, BY APPLICATION, 2022–2028 (USD MILLION)
  • TABLE 173 EGYPT: MATTING AGENTS MARKET, BY APPLICATION, 2017–2021 (TON)
  • TABLE 174 EGYPT: MATTING AGENTS MARKET, BY APPLICATION, 2022–2028 (TON)
  • TABLE 175 SOUTH AMERICA: MATTING AGENTS MARKET, BY APPLICATION, 2017–2021 (USD MILLION)
  • TABLE 176 SOUTH AMERICA: MATTING AGENTS MARKET, BY APPLICATION, 2022–2028 (USD MILLION)
  • TABLE 177 SOUTH AMERICA: MATTING AGENTS MARKET, BY APPLICATION, 2017–2021 (TON)
  • TABLE 178 SOUTH AMERICA: MATTING AGENTS MARKET, BY APPLICATION, 2022–2028 (TON)
  • TABLE 179 SOUTH AMERICA: MATTING AGENTS MARKET, BY COUNTRY, 2017–2021 (USD MILLION)
  • TABLE 180 SOUTH AMERICA: MATTING AGENTS MARKET, BY COUNTRY, 2022–2028 (USD MILLION)
  • TABLE 181 SOUTH AMERICA: MATTING AGENTS MARKET, BY COUNTRY, 2017–2021 (TON)
  • TABLE 182 SOUTH AMERICA: MATTING AGENTS MARKET, BY COUNTRY, 2022–2028 (TON)
  • TABLE 183 BRAZIL: MATTING AGENTS MARKET, BY APPLICATION, 2017–2021 (USD MILLION)
  • TABLE 184 BRAZIL: MATTING AGENTS MARKET, BY APPLICATION, 2022–2028 (USD MILLION)
  • TABLE 185 BRAZIL: MATTING AGENTS MARKET, BY APPLICATION, 2017–2021 (TON)
  • TABLE 186 BRAZIL: MATTING AGENTS MARKET, BY APPLICATION, 2022–2028 (TON)
  • TABLE 187 ARGENTINA: MATTING AGENTS MARKET, BY APPLICATION, 2017–2021 (USD MILLION)
  • TABLE 188 ARGENTINA: MATTING AGENTS MARKET, BY APPLICATION, 2022–2028 (USD MILLION)
  • TABLE 189 ARGENTINA: MATTING AGENTS MARKET, BY APPLICATION, 2017–2021 (TON)
  • TABLE 190 ARGENTINA: MATTING AGENTS MARKET, BY APPLICATION, 2022–2028 (TON)
  • TABLE 191 OVERVIEW OF STRATEGIES ADOPTED BY KEY MATTING AGENT MANUFACTURERS
  • TABLE 192 MATTING AGENTS MARKET: DEGREE OF COMPETITION
  • TABLE 193 MATTING AGENTS MARKET: MATERIAL TYPE FOOTPRINT
  • TABLE 194 MATTING AGENTS MARKET: TECHNOLOGY FOOTPRINT
  • TABLE 195 MATTING AGENTS MARKET: APPLICATION FOOTPRINT
  • TABLE 196 MATTING AGENTS MARKET: COMPANY REGION FOOTPRINT
  • TABLE 197 MATTING AGENTS MARKET: DETAILED LIST OF KEY START-UPS/SMES
  • TABLE 198 MATTING AGENTS MARKET: COMPETITIVE BENCHMARKING OF KEY START-UPS/SMES
  • TABLE 199 MATTING AGENTS MARKET: PRODUCT LAUNCHES (2018–2023)
  • TABLE 200 MATTING AGENTS MARKET: DEALS (2018–2023)
  • TABLE 201 MATTING AGENTS MARKET: EXPANSIONS, INVESTMENTS, AND INNOVATIONS (2018–2023)
  • TABLE 202 EVONIK INDUSTRIES AG: COMPANY OVERVIEW
  • TABLE 203 EVONIK INDUSTRIES AG: PRODUCT LAUNCHES
  • TABLE 204 EVONIK INDUSTRIES AG: OTHER DEVELOPMENTS
  • TABLE 205 PPG INDUSTRIES, INC.: COMPANY OVERVIEW
  • TABLE 206 HUNTSMAN INTERNATIONAL LLC: COMPANY OVERVIEW
  • TABLE 207 IMERYS S.A.: COMPANY OVERVIEW
  • TABLE 208 W. R. GRACE & CO.-CONN.: COMPANY OVERVIEW
  • TABLE 209 W. R. GRACE & CO.-CONN.: DEALS
  • TABLE 210 W. R. GRACE & CO.-CONN.: PRODUCT LAUNCHES
  • TABLE 211 J.M. HUBER CORPORATION: COMPANY OVERVIEW
  • TABLE 212 ALTANA: COMPANY OVERVIEW
  • TABLE 213 ALTANA: PRODUCT LAUNCHES
  • TABLE 214 ALTANA: OTHER DEVELOPMENTS
  • TABLE 215 AKZONOBEL N.V.: COMPANY OVERVIEW
  • TABLE 216 AKZONOBEL N.V.: OTHER DEVELOPMENTS
  • TABLE 217 ARKEMA S.A.: COMPANY OVERVIEW
  • TABLE 218 LUBRIZOL CORPORATION: COMPANY OVERVIEW
  • TABLE 219 ALLNEX: COMPANY OVERVIEW
  • TABLE 220 PQ CORPORATION: COMPANY OVERVIEW
  • TABLE 221 AXALTA COATING SYSTEM: COMPANY OVERVIEW
  • TABLE 222 MICHELMAN, INC.: COMPANY OVERVIEW
  • TABLE 223 CHT GERMANY GMBH: COMPANY OVERVIEW
  • TABLE 224 HEUBACH COLOUR PVT. LTD.: COMPANY OVERVIEW
  • TABLE 225 VIACOR POLYMER GMBH: COMPANY OVERVIEW
  • TABLE 226 TOYOBO CO., LTD.: COMPANY OVERVIEW
  • TABLE 227 REMMERS AG: COMPANY OVERVIEW
  • TABLE 228 DOG CHEMIE: COMPANY OVERVIEW
  • TABLE 229 THOMAS SWAN CO. & LTD.: COMPANY OVERVIEW
  • TABLE 230 WATTYL INDUSTRIAL COATINGS: COMPANY OVERVIEW
  • TABLE 231 CHROMA COLOR CORPORATION: COMPANY OVERVIEW
  • TABLE 232 DALIAN FUCHANG CHEMICAL GROUP CO., LTD.: COMPANY OVERVIEW
  • TABLE 233 DEUTERON GMBH: COMPANY OVERVIEW
  • TABLE 234 COATING ADDITIVES MARKET, BY REGION, 2017–2021 (USD MILLION)
  • TABLE 235 COATING ADDITIVES MARKET, BY REGION, 2022–2028 (USD MILLION)
  • TABLE 236 COATING ADDITIVES MARKET, BY REGION, 2017–2021 (KILOTON)
  • TABLE 237 COATING ADDITIVES MARKET, BY REGION, 2022–2028 (KILOTON)
  • TABLE 238 ASIA PACIFIC: COATING ADDITIVES MARKET, BY COUNTRY, 2017–2021 (USD MILLION)
  • TABLE 239 ASIA PACIFIC: COATING ADDITIVES MARKET, BY COUNTRY, 2022–2028 (USD MILLION)
  • TABLE 240 ASIA PACIFIC: COATING ADDITIVES MARKET, BY COUNTRY, 2017–2021 (KILOTON)
  • TABLE 241 ASIA PACIFIC: COATING ADDITIVES MARKET, BY COUNTRY, 2022–2028 (KILOTON)
  • TABLE 242 NORTH AMERICA: COATING ADDITIVES MARKET, BY COUNTRY, 2017–2021 (USD MILLION)
  • TABLE 243 NORTH AMERICA: COATING ADDITIVES MARKET, BY COUNTRY, 2022–2028 (USD MILLION)
  • TABLE 244 NORTH AMERICA: COATING ADDITIVES MARKET, BY COUNTRY, 2017–2021 (KILOTON)
  • TABLE 245 NORTH AMERICA: COATING ADDITIVES MARKET, BY COUNTRY, 2022–2028 (KILOTON)
  • TABLE 246 EUROPE: COATING ADDITIVES MARKET, BY COUNTRY, 2017–2021 (USD MILLION)
  • TABLE 247 EUROPE: COATING ADDITIVES MARKET, BY COUNTRY, 2022–2028 (USD MILLION)
  • TABLE 248 EUROPE: COATING ADDITIVES MARKET, BY COUNTRY, 2017–2021 (KILOTON)
  • TABLE 249 EUROPE: COATING ADDITIVES MARKET, BY COUNTRY, 2022–2028 (KILOTON)
  • TABLE 250 SOUTH AMERICA: COATING ADDITIVES MARKET, BY COUNTRY, 2017–2021 (USD MILLION)
  • TABLE 251 SOUTH AMERICA: COATING ADDITIVES MARKET, BY COUNTRY, 2022–2028 (USD MILLION)
  • TABLE 252 SOUTH AMERICA: COATING ADDITIVES MARKET, BY COUNTRY, 2017–2021 (KILOTON)
  • TABLE 253 SOUTH AMERICA: COATING ADDITIVES MARKET, BY COUNTRY, 2022–2028 (KILOTON)
  • TABLE 254 MIDDLE EAST & AFRICA: COATING ADDITIVES MARKET, BY COUNTRY, 2017–2021 (USD MILLION)
  • TABLE 255 MIDDLE EAST & AFRICA: COATING ADDITIVES MARKET, BY COUNTRY, 2022–2028 (USD MILLION)
  • TABLE 256 MIDDLE EAST & AFRICA: COATING ADDITIVES MARKET, BY COUNTRY, 2017–2021 (KILOTON)
  • TABLE 257 MIDDLE EAST & AFRICA: COATING ADDITIVES MARKET, BY COUNTRY, 2022–2028 (KILOTON)
LIST OF FIGURES
 
  • FIGURE 1 MATTING AGENTS MARKET SEGMENTATION
  • FIGURE 2 MATTING AGENTS MARKET: RESEARCH DESIGN
  • FIGURE 3 MARKET SIZE ESTIMATION METHODOLOGY - APPROACH 1 (SUPPLY-SIDE): COMBINED MARKET SHARE OF MAJOR PLAYERS
  • FIGURE 4 MARKET SIZE ESTIMATION METHODOLOGY - APPROACH 1 BOTTOM-UP (SUPPLY SIDE): COLLECTIVE REVENUE OF ALL TYPES
  • FIGURE 5 MARKET SIZE ESTIMATION METHODOLOGY - APPROACH 2 BOTTOM-UP (DEMAND-SIDE): PRODUCTS SOLD AND THEIR AVERAGE SELLING PRICE
  • FIGURE 6 MARKET SIZE ESTIMATION METHODOLOGY: APPROACH 3 TOP-DOWN
  • FIGURE 7 MATTING AGENTS MARKET: DATA TRIANGULATION
  • FIGURE 8 MARKET CAGR PROJECTIONS FROM SUPPLY SIDE
  • FIGURE 9 MARKET GROWTH PROJECTIONS FROM DEMAND SIDE DRIVERS AND OPPORTUNITIES
  • FIGURE 10 SILICA TO BE LARGEST MATERIAL OF MATTING AGENTS IN 2022
  • FIGURE 11 WATER-BORNE TECHNOLOGY TO BE LARGEST SEGMENT OF MATTING AGENTS MARKET DURING FORECAST PERIOD
  • FIGURE 12 ARCHITECTURAL COATINGS APPLICATION TO LEAD MATTING AGENTS MARKET DURING FORECAST PERIOD
  • FIGURE 13 ASIA PACIFIC ACCOUNTED FOR LARGEST SHARE OF MATTING AGENTS MARKET IN 2022
  • FIGURE 14 INCREASING APPLICATION AREAS OFFER GROWTH OPPORTUNITIES FOR MATTING AGENTS MARKET
  • FIGURE 15 ASIA PACIFIC TO RECORD HIGHEST CAGR DURING FORECAST PERIOD
  • FIGURE 16 ARCHITECTURAL AND CHINA ACCOUNTED FOR LARGEST MARKET SHARES OF ASIA PACIFIC MATTING AGENTS MARKET IN 2022
  • FIGURE 17 ARCHITECTURAL LED MATTING AGENTS MARKET ACROSS REGIONS
  • FIGURE 18 INDIA TO REGISTER HIGHEST CAGR DURING FORECAST PERIOD
  • FIGURE 19 DRIVERS, RESTRAINTS, OPPORTUNITIES, AND CHALLENGES IN MATTING AGENTS MARKET
  • FIGURE 20 PRODUCTION OF AUTOMOBILES ACROSS COUNTRIES IN 2022 (MILLION UNITS)
  • FIGURE 21 REGIONAL CONSTRUCTION GROWTH, 2021–2030 (CAGR)
  • FIGURE 22 MATTING AGENTS MARKET: PORTER’S FIVE FORCES ANALYSIS
  • FIGURE 23 MATTING AGENTS MARKET: SUPPLY CHAIN
  • FIGURE 24 INFLUENCE OF STAKEHOLDERS ON BUYING PROCESS FOR TOP 3 APPLICATION
  • FIGURE 25 KEY BUYING CRITERIA FOR TOP 3 APPLICATIONS
  • FIGURE 26 AVERAGE SELLING PRICE TREND OF MATTING AGENTS, BY REGION (USD/KG)
  • FIGURE 27 AVERAGE SELLING PRICE TREND OF KEY PLAYERS, BY APPLICATION
  • FIGURE 28 REVENUE SHIFT FOR MATTING AGENTS MARKET
  • FIGURE 29 MATTING AGENTS MARKET: ECOSYSTEM
  • FIGURE 30 IMPORT OF MATTING AGENTS, BY KEY COUNTRIES (2013–2022)
  • FIGURE 31 EXPORT OF MATTING AGENTS, BY KEY COUNTRIES (2013–2022)
  • FIGURE 32 PATENTS REGISTERED IN MATTING AGENTS MARKET, 2012–2022
  • FIGURE 33 PATENT PUBLICATION TRENDS, 2012–2022
  • FIGURE 34 LEGAL STATUS OF PATENTS FILED IN MATTING AGENTS MARKET
  • FIGURE 35 TOP JURISDICTION
  • FIGURE 36 FUJIFILM HOLDINGS CORPORATION REGISTERED MAXIMUM NUMBER OF PATENTS BETWEEN 2012 AND 2022
  • FIGURE 37 SILICA TO BE LARGEST SEGMENT OF MATTING AGENTS MARKET DURING FORECAST PERIOD
  • FIGURE 38 WATER-BORNE TECHNOLOGY TO LEAD MARKET DURING FORECAST PERIOD
  • FIGURE 39 ARCHITECTURAL APPLICATION TO LEAD MATTING AGENTS MARKET DURING FORECAST PERIOD
  • FIGURE 40 ASIA PACIFIC TO BE FASTEST-GROWING MATTING AGENTS MARKET DURING FORECAST PERIOD
  • FIGURE 41 ASIA PACIFIC: MATTING AGENTS MARKET SNAPSHOT
  • FIGURE 42 NORTH AMERICA: MATTING AGENTS MARKET SNAPSHOT
  • FIGURE 43 EUROPE: MATTING AGENTS MARKET SNAPSHOT
  • FIGURE 44 RANKING OF TOP 5 PLAYERS IN MATTING AGENTS MARKET, 2022
  • FIGURE 45 EVONIK INDUSTRIES AG LED MATTING AGENTS MARKET IN 2022
  • FIGURE 46 REVENUE ANALYSIS OF KEY COMPANIES IN LAST 5 YEARS
  • FIGURE 47 COMPANY EVALUATION MATRIX, 2022
  • FIGURE 48 MATTING AGENTS MARKET: COMPANY FOOTPRINT
  • FIGURE 49 START-UP/SME EVALUATION MATRIX, 2022
  • FIGURE 50 EVONIK INDUSTRIES AG: COMPANY SNAPSHOT
  • FIGURE 51 PPG INDUSTRIES, INC.: COMPANY SNAPSHOT
  • FIGURE 52 HUNTSMAN INTERNATIONAL LLC: COMPANY SNAPSHOT
  • FIGURE 53 IMERYS S.A.: COMPANY SNAPSHOT
  • FIGURE 54 ALTANA: COMPANY SNAPSHOT
  • FIGURE 55 AKZONOBEL N.V.: COMPANY SNAPSHOT
  • FIGURE 56 ARKEMA S.A.: COMPANY SNAPSHOT

The study involved four major activities in estimating the market size for matting agents. Exhaustive secondary research was done to collect information on the market, the peer market, and the parent market. The next step was to validate these findings, assumptions, and sizing with industry experts across the value chain through primary research. Both top-down and bottom-up approaches were employed to estimate the complete market size. Post that, the market breakdown and data triangulation procedures were used to estimate the market size of the segments and subsegments.

Secondary Research

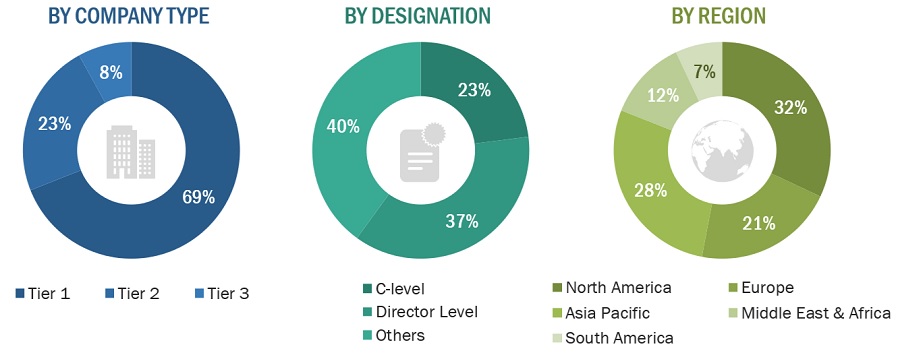
Secondary sources used in this study included annual reports, press releases, and investor presentations of companies; white papers; certified publications; articles from recognized authors; and gold standard & silver standard websites such as Factiva, ICIS, Bloomberg, and others. The findings of this study were verified through primary research by conducting extensive interviews with key officials such as CEOs, VPs, directors, and other executives. The breakdown of profiles of the primary interviewees is illustrated in the figure below:

Primary Research

The Matting agents market comprises several stakeholders, such as raw material suppliers, end-product manufacturers, and regulatory organizations in the supply chain. The demand side of this market is characterized by the automotive, medical, electronics, and others. The supply side is characterized by advancements in technology and diverse application industries. Various primary sources from both the supply and demand sides of the market were interviewed to obtain qualitative and quantitative information.

Breakdown of Primary Participants
Matting Agents Market Size, and Share

Note: Tier 1, Tier 2, and Tier 3 companies are classified based on their market revenue in 2022, available in the public domain, product portfolios, and geographical presence.

Other designations include consultants and sales, marketing, and procurement managers.

To know about the assumptions considered for the study, download the pdf brochure

COMPANY NAME

DESIGNATION

Evonik Industries AG

Director of Marketing

PPG Industries, Inc.

Manager- Sales & Marketing

Imerys S.A.

Sales Manager

W. R. Grace & Co.-Conn.

Production Manager

Arkema S.A.

Sales Manager

Market Size Estimation

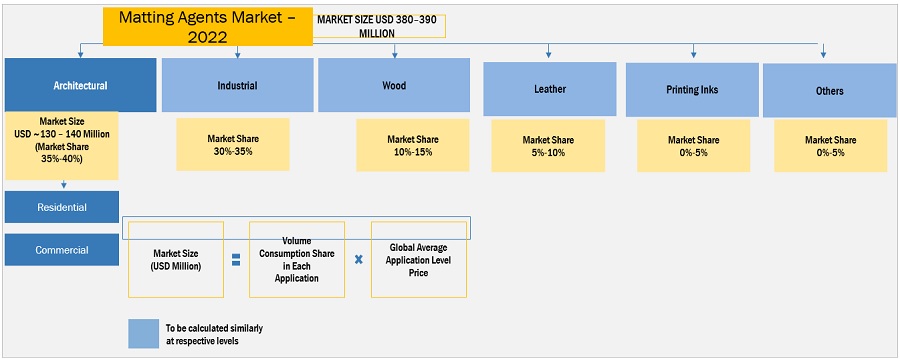
Both top-down and bottom-up approaches were used to estimate and validate the total size of the Matting agents market. These methods were also used extensively to estimate the size of various subsegments in the market. The research methodology used to estimate the market size includes the following:

  • The key players in the industry have been identified through extensive secondary research.
  • The supply chain of the industry has been determined through primary and secondary research.
  • All percentage shares, splits, and breakdowns have been determined using secondary sources and verified through primary sources.
  • All possible parameters that affect the markets covered in this research study have been accounted for, viewed in extensive detail, verified through primary research, and analyzed to obtain the final quantitative and qualitative data.

Matting agents Market: Bottom-Up Approach
Matting Agents Market Size, and Share

To know about the assumptions considered for the study, Request for Free Sample Report

Matting agents Market: Top-Down Approach

Matting Agents Market Size, and Share

Data Triangulation

After arriving at the overall market size—using the market size estimation processes as explained above—the market was split into several segments and subsegments. To complete the overall market engineering process and arrive at the exact statistics of each market segment and subsegment, data triangulation and market breakdown procedures were employed, wherever applicable. The data was triangulated by studying various factors and trends from both the demand and supply sides in the matting agents industry.

Market Definition

According to the American Coatings Association, “matting agents are substances or additives used in coatings, paints, varnishes, and other surface finishes to reduce gloss or shine on a surface. They create a matte or low-gloss appearance by scattering light and reducing light reflection.” The primary function of matting agents is to alter the surface properties of a coating or finish, making it less reflective and more diffuse in terms of light. This effect is achieved by introducing particles or substances into the coating that disrupt the smooth surface, causing light to scatter rather than reflect directly. As a result, the surface appears matte or less shiny.

Key Stakeholders

  • Matting agents manufacturers
  • Matting agents distributors
  • Raw material suppliers
  • Government and research organizations
  • Investment banks and private equity firms
  • Research & development institutions
  • Environment support agencies
  • Investment banks and private equity firms

Report Objectives

  • To define, describe, and forecast the global matting agents market size in terms of volume and value
  • To provide detailed information about the significant drivers, restraints, challenges, and opportunities influencing market growth
  • To estimate and forecast the market size based on material, technology, and application
  • To forecast the size of the market based on five major regions–Asia Pacific, North America, Europe, the Middle East & Africa, and South America, along with their key countries
  • To strategically analyze the micromarkets1 with respect to individual growth trends, prospects, and their contribution to the overall market
  • To analyze opportunities in the market for stakeholders and to provide a competitive landscape of market leaders
  • To analyze recent developments such as agreements, mergers & acquisitions, expansions, and product launches in the market
  • To strategically profile key market players and comprehensively analyze their core competencies2 and market share

Available Customizations

Along with the given market data, MarketsandMarkets offers customizations according to the company’s specific needs. The following customization options are available for the report:

Regional Analysis

  • Further breakdown of a region with respect to a particular country or additional application type

Company Information

  • Detailed analysis and profiles of additional market players (up to five)
Custom Market Research Services

We will customize the research for you, in case the report listed above does not meet with your exact requirements. Our custom research will comprehensively cover the business information you require to help you arrive at strategic and profitable business decisions.

Request Customization
Report Code
CH 5398
Published ON
Oct, 2023
Choose License Type
BUY NOW
  • SHARE
X
Request Customization
Speak to Analyst
Speak to Analyst
OR FACE-TO-FACE MEETING
PERSONALIZE THIS RESEARCH
  • Triangulate with your Own Data
  • Get Data as per your Format and Definition
  • Gain a Deeper Dive on a Specific Application, Geography, Customer or Competitor
  • Any level of Personalization
REQUEST A FREE CUSTOMIZATION
LET US HELP YOU!
  • What are the Known and Unknown Adjacencies Impacting the Matting Agents Market
  • What will your New Revenue Sources be?
  • Who will be your Top Customer; what will make them switch?
  • Defend your Market Share or Win Competitors
  • Get a Scorecard for Target Partners
CUSTOMIZED WORKSHOP REQUEST
knowledgestore logo

Want to explore hidden markets that can drive new revenue in Matting Agents Market?

Find Hidden Markets
  • Call Us
  • +1-888-600-6441 (Corporate office hours)
  • +1-888-600-6441 (US/Can toll free)
  • +44-800-368-9399 (UK office hours)
CONNECT WITH US
ABOUT TRUST ONLINE
©2024 MarketsandMarkets Research Private Ltd. All rights reserved
DMCA.com Protection Status
Website Feedback