LoRa and LoRaWAN IoT Market by Network Deployment (Public, Private, Hybrid), Application (Asset Tracking, Industrial IoT, Smart Cities, Smart Healthcare, Smart Agriculture & Livestock Management, Disaster Management) - Global Forecast to 2029
[294 Pages Report] The global LoRa and LoRaWAN IoT market size is projected to grow from USD 8.0 billion in 2024 to USD 32.7 billion by 2029 at a Compound Annual Growth Rate (CAGR) of 32.4% during the forecast period. The affordability and scalability of LoRa and LoRaWAN technologies drive their growth in the IoT market. Thanks to its simple hardware requirements and efficient communication protocols, LoRa technology's ability to enable the development of low-cost IoT devices and sensors is pivotal. This affordability expands the accessibility of IoT solutions across various industries and applications, particularly benefiting those with budget constraints or limited resources. Furthermore, LoRaWAN's scalable architecture facilitates the deployment of massive IoT networks, accommodating thousands to millions of devices. This scalability is crucial for IoT applications requiring widespread coverage and large-scale deployment, such as smart cities, industrial automation, and supply chain management. As a result, the combination of low-cost device development and scalable network deployment capabilities positions LoRa and LoRaWAN as key enablers for driving IoT adoption across diverse sectors, fueling their continued growth and market penetration.
To know about the assumptions considered for the study, Request for Free Sample Report
To know about the assumptions considered for the study, download the pdf brochure
Driver: Rising demand for low-power, long-range, wide-area network connectivity
As the number of connected devices explodes, the need for efficient communication solutions such as LPWANs also increases. Many governments are backing smart city initiatives and infrastructure projects, often relying on LPWANs. Improvements in LPWAN technologies, including LoRaWAN and NB-IoT, promise better range, data rates, and security. The low-power, long-range, and wide-area coverage offered by LPWANs helps to address a critical need in the expanding world of IoT. This technology is poised to play a vital role in connecting devices and enabling innovative applications across various industries. Sensors monitoring traffic flow, parking availability, and environmental conditions can all benefit from LoRaWAN connectivity. It also helps to monitor soil moisture, crop health, and irrigation systems in remote fields.
Restraint: Interoperability issues
Interoperability issues in the LoRa and LoRaWAN IoT market refer to the challenges businesses face when their devices, such as sensors or gateways, can't easily communicate or work together due to differences in how they're made or programmed. This can happen because different companies may interpret or use the technology differently. When devices from one company don't "talk" well with those from another, it can slow down or stall IoT projects, making it harder for businesses to expand or switch suppliers. It's like trying to make pieces from different puzzle sets fit together—they might not align perfectly, causing frustration and extra work for businesses.
Opportunity: Increasing smart city initiatives worldwide
LoRaWAN technology provides connectivity, scalability, cost-effectiveness, real-time data insights, and environmental sustainability, contributing to the growth of smart city initiatives. LoRaWAN provides better coverage and insights for smart city applications, making it ideal for connecting a wide range of IoT devices and sensors over a large area. These insights are used to make informed decisions and improve city services. Additionally, LoRaWAN provides efficient energy consumption and reduces carbon footprint, contributing to environmental sustainability.
Governments worldwide are increasingly investing in smart city initiatives leveraging LoRaWAN IoT to improve the quality of life for citizens and make cities more sustainable and efficient. The EU has funded several LoRaWAN-based smart city projects, such as the CityFlows project in Amsterdam, which uses LoRaWAN-enabled sensors to monitor and manage urban traffic flow. The US Department of Transportation's Smart City Challenge funded several cities to develop smart city solutions for transportation. Additionally, the National Institute of Standards and Technology (NIST) has developed a Smart City Framework that provides guidelines and best practices for developing smart city solutions. The Chinese government's Smart City 3.0 initiative includes the development of smart city solutions for transportation, energy, and public safety. The Chinese government has invested heavily in LoRaWAN infrastructure to deploy over 600,000 LoRaWAN base stations by 2025.
Challenge: Lack of governance
LoRaWAN faces challenges due to a lack of governance, as there are no universally enforced rules or standards for LoRaWAN devices and networks. Different LoRaWAN networks might use varying frequencies, data rates, and protocols, making it difficult for devices to connect and share data across different networks. These issues can hinder the growth and adoption of LoRaWAN in the long run.
The lack of governance in LoRaWAN IoT can also lead to privacy concerns. LoRaWAN devices can collect sensitive data, such as location data and personal information, which can be used for unauthorized purposes if not properly secured. As LoRaWAN networks and devices become more prevalent, there is a growing need for regulatory compliance. However, the lack of governance in LoRaWAN IoT can make it difficult to enforce regulations and standards, leading to potential legal and ethical issues.
Ecosystem Of LoRa and LoRaWAN IoT Market
The prominent players in the LoRa and LoRaWAN IoT market include The Bosch Group (Germany), Cisco (US), Orange SA (France), and Comcast Corp. (US) and so on. These companies have been operating in the market for several years and possess a diversified product portfolio and state-of-the-art technologies with a well-established geographic footprint.
"By application, asset tracking segment to hold the largest market size during the forecast period.”
LoRa-based asset tracking solutions offer hospitals and healthcare facilities a powerful tool to enhance operational efficiency and patient care delivery. By providing real-time visibility into the location and availability of critical resources like beds, medical equipment, and staff, these solutions enable healthcare providers to optimize resource utilization and streamline workflow processes. For instance, staff can quickly locate available equipment or personnel, reducing delays in patient care and improving response times during emergencies. Moreover, the ability to monitor asset utilization trends over time allows for proactive resource allocation and planning, ensuring that resources are allocated efficiently to meet patient demand. This not only enhances patient flow management and reduces wait times but also contributes to overall patient satisfaction by providing a smoother and more responsive healthcare experience. Additionally, by minimizing the risk of asset loss or misplacement, LoRa-based asset tracking solutions help hospitals save costs associated with asset replacement and improve compliance with regulatory requirements, ultimately fostering a safer and more efficient healthcare environment.
“Healthcare segment is expected to have the fastest growth rate during the forecast period.”
In the realm of healthcare, LoRaWAN's capability to enable remote patient monitoring solutions revolutionizes the way vital signs are collected and managed. By leveraging LoRaWAN, healthcare providers can seamlessly collect critical patient data in real time, including heart rate, blood pressure, and glucose levels, without the need for patients to physically visit healthcare facilities. This remote monitoring approach empowers healthcare professionals to detect potential health issues early, allowing for proactive intervention and timely medical care. As a result, patients benefit from improved health outcomes, reduced risks of complications, and enhanced quality of life. Moreover, by minimizing the need for frequent hospital visits, LoRaWAN-based remote patient monitoring solutions alleviate the burden on healthcare facilities, reduce healthcare costs, and optimize resource allocation. Ultimately, the integration of LoRaWAN into remote patient monitoring systems not only enhances patient care but also contributes to the overall efficiency and sustainability of the healthcare ecosystem.
“North America to have the largest market size during the forecast period.”
In North America, the Industrial Internet of Things (IIoT) is witnessing a significant surge in adoption across industries, driven by the compelling advantages it offers. Industries are increasingly leveraging IIoT solutions to enhance operational efficiency, streamline supply chains, and implement predictive maintenance strategies. In this landscape, LoRa and LoRaWAN technologies play a pivotal role by providing cost-effective connectivity solutions for industrial sensors and devices. These technologies enable real-time monitoring and control of manufacturing processes, asset tracking, and logistics management, thereby facilitating streamlined operations and optimized resource utilization. Moreover, governmental support at the federal, state, and local levels further accelerates the adoption of IoT initiatives, including grants, incentives, and regulatory frameworks. This support fosters investment in IoT infrastructure and encourages widespread adoption of LoRa and LoRaWAN technologies across various sectors, propelling the region's IoT ecosystem towards further growth and innovation.
LoRa and LoRaWAN IoT Companies:
The major players in the LoRa and LoRaWAN IoT market are The Bosch Group (Germany), Cisco (US), Orange SA (France), Comcast Corporation (US), Semtech (US),NEC Corporation (Japan), Tata Communications (India), AWS (US), Advantech (Taiwan), SK Telecom (South Korea), Murata (Japan), Kerlink (France), Actility (France), Digi International (US), MultiTech (US), Ezurio (US), Sensoterra (Netherlands), Nwave Technologies (US), RAKwireless (China), TheThings.io (Spain), Datacake (Germany), Milesight (China), LORIOT (Switzerland), Exosite (US), Orbiwise (Switzerland), Netmore Group (Sweden), and Radio Bridge Inc (US). These players have adopted various growth strategies, such as partnerships, agreements and collaborations, new product launches and enhancements, and acquisitions to expand their LoRa and LoRaWAN IoT market footprint.
Want to explore hidden markets that can drive new revenue in LoRa and LoRaWAN IoT Market?
Scope of the Report
Want to explore hidden markets that can drive new revenue in LoRa and LoRaWAN IoT Market?
Report Metrics |
Details |
Market size available for years |
2018-2029 |
Base year considered |
2023 |
Forecast period |
2024–2029 |
Forecast units |
Value (USD Billion) |
Segments Covered |
Offering, Network Deployment, Application, End User, and Region |
Region covered |
North America, Europe, Asia Pacific, Middle East & Africa, and Latin America. |
List of Companies in LoRa and LoRaWAN IoT |
The Bosch Group (Germany), Cisco (US), Orange SA (France), Comcast Corporation (US), Semtech (US), NEC Corporation(Japan), Tata Communications (India), AWS (US), Advantech (Taiwan), SK Telecom (South Korea), Murata (Japan), Kerlink (France), Actility (France), Digi International (US), MultiTech (US), Ezurio (US), Sensoterra (Netherlands), Nwave Technologies (US), RAKwireless (China), TheThings.io (Spain), Datacake (Germany), Milesight (China), LORIOT (Switzerland), Exosite (US), Orbiwise (Switzerland), Netmore Group (Sweden), and Radio Bridge Inc (US). |
This research report categorizes the LoRa and LoRaWAN IoT market to forecast revenues and analyze trends in each of the following submarkets:
Based on Offering:
-
Hardware
- Sensors
- System on Chip
- Networking Gateways
- Other Hardware (Actuators, External Antennas, And Servers)
- Platforms
-
Services
-
Professional Services
- Consulting
- Deployment & Integration
- Support & Maintenance
- Managed Services
-
Professional Services
Based onNetwork Deployment:
- Public Network
- Private Network
- Hybrid Network
Based on Application:
- Asset Tracking
- Industrial IoT
- Smart Cities
- Smart Buildings
- Smart Utilities
- Smart Healthcare
- Smart Agriculture & Livestock Management
- Other Applications (Space Utilization and Disaster Management & Emergency Response)
Based on End User:
- Manufacturing
- Transportation & Logistics
- Energy & Utilities
- Agriculture
- Government & Public Safety
- Healthcare
- Retail
- Residential
- Other End Users (Travel & Hospitality, Construction & Mining, Education, and Sports)
By Region:
-
North America
- United States (US)
- Canada
-
Europe
- United Kingdom (UK)
- Germany
- France
- Italy
- Spain
- Nordic countries
- Rest of Europe
-
Asia Pacific
- China
- Japan
- India
- South Korea
- Australia & New Zealand
- South Korea
- Southeast Asia
- Rest of Asia Pacific
-
Middle East & Africa
-
GCC Countries
- Kingdom of Saudi Arabia (KSA)
- United Arab Emirates (UAE)
- Rest of GCC Countries
- South Africa
- Rest of the Middle East & Africa
-
GCC Countries
-
Latin America
- Brazil
- Mexico
- Rest of Latin America
Recent Developments
- In January 2024, LORIOT signed a partnership agreement with SYSCOM to extend the LoRaWAn ecosystem in Latin America. The partnership enabled both companies to expand their reach globally and collaborate on end-to-end solutions, fulfilling the growing IoT solutions demand in the Latin American region.
- In July 2023, MachineQ, a subsidiary of Comcast Corporation, launched new active RFID asset tracking tags for indoor positioning, along with a new IoT occupancy monitoring solution, which is an extension of its hybrid Bluetooth Low Energy (BLE) and LoRaWAN real-time location system (RTLS) combo-solution. The tags provide real-time location, sub-room level accuracy, and long battery life and are suitable for applications such as asset tracking in various fields
- In May 2023, Cisco and NTT announced a collaboration to develop and deploy joint solutions to enhance operational efficiencies and sustainability goals. The companies will deliver solutions that combine NTT’s Managed Services expertise, automation capabilities at the edge, and management of complex IT environments with Cisco’s IoT capabilities, including LoRaWAN.
Frequently Asked Questions (FAQ):
What is the definition of the LoRa and LoRaWAN IoT market?
LoRa (Long Range) technology is a wireless communication protocol designed for long-range, low-power communication between IoT devices. LoRaWAN (Long Range Wide Area Network) is a networking protocol built on top of LoRa, enabling secure bi-directional communication, efficient power management, and long-range connectivity for IoT devices. Together, they form a comprehensive ecosystem for IoT applications, providing a robust solution for various industries such as smart cities, agriculture, industrial automation, and asset tracking. The LoRa and LoRaWAN market encompasses hardware manufacturers, network operators, application developers, and service providers, driving innovation and deployment of scalable IoT solutions worldwide.
What is the market size of the LoRa and LoRaWAN IoT market?
The LoRa and LoRaWAN IoT market is estimated at USD USD 8.0 billion in 2024 to USD 32.7 billion by 2029, at a Compound Annual Growth Rate (CAGR) of 32.4 % from 2024 to 2029.
What are the major drivers in the LoRa and LoRaWAN IoT market?
The major drivers in the LoRa and LoRaWAN IoT market are the rising demand for low-power, long-range, wide-area network connectivity and advancements in IoT technologies.
Who are the key companies operating in the LoRa and LoRaWAN IoT market?
The key companies profiled in the LoRa and LoRaWAN IoT market are The Bosch Group (Germany), Cisco (US), Orange SA (France), Comcast Corporation (US), Semtech (US), NEC Corporation(Japan), Tata Communications (India), AWS (US), Advantech (Taiwan), SK Telecom (South Korea), Murata (Japan), Kerlink (France), Actility (France), Digi International (US), MultiTech (US), Ezurio (US), Sensoterra (Netherlands), Nwave Technologies (US), RAKwireless (China), TheThings.io (Spain), Datacake (Germany), Milesight (China), LORIOT (Switzerland), Exosite (US), Orbiwise (Switzerland), Netmore Group (Sweden), and Radio Bridge Inc (US).
What are the key technology trends prevailing in the LoRa and LoRaWAN IoT market?
The key technology trends in LoRa and LoRaWAN IoT include IoT, 5G, Cloud computing. .
To speak to our analyst for a discussion on the above findings, click Speak to Analyst
Exclusive indicates content/data unique to MarketsandMarkets and not available with any competitors.
- 5.1 INTRODUCTION
-
5.2 MARKET DYNAMICSDRIVERS- Rising demand for low-power, long-range, wide-area network connectivity- Advancements in IoT technologies- Increasing focus on cost efficiencyRESTRAINTS- Data security and privacy concerns- High initial deployment costs- Interoperability issuesOPPORTUNITIES- Increasing smart city initiatives worldwide- Integration with 5GCHALLENGES- Lack of governance- Technical complexity
- 5.3 BRIEF HISTORY OF LORA AND LORAWAN IOT
- 5.4 LORA AND LORAWAN IOT MARKET: ECOSYSTEM ANALYSIS/MARKET MAP
-
5.5 CASE STUDY ANALYSISNWAVE TECHNOLOGIES’ SOLUTION HELPED HARROGATE IMPROVE PARKING EXPERIENCESADVANTECH AND PACE PROVIDED GENERAL MINING WELLFIELD WITH COST-FRIENDLY SYSTEM CONNECTING TO SCADAGMN OFFERED FARMERS 24X7 INSIGHTS BY DEPLOYING IOT SOLUTIONS FROM SENSOTERRAARGOS INSPECTION AND TECHNOLOGIES USED THE THINGS STACK FOR STOCK MONITORINGNEW YORK WIRELESS MONITORING COMPANY PROSENTRY USED SENET’S PLATFORM-AS-A-SERVICE (PAAS) FOR PRIVATE LORAWAN DEPLOYMENTS AND SMART BUILDING SENSOR MANAGEMENT
- 5.6 VALUE CHAIN ANALYSIS
-
5.7 TARIFF AND REGULATORY LANDSCAPETARIFF RELATED TO LORA AND LORAWAN IOT DEVICES (851769)REGULATORY BODIES, GOVERNMENT AGENCIES, AND OTHER ORGANIZATIONS- North America- Europe- Asia Pacific- Middle East & Africa- Latin America
-
5.8 PRICING ANALYSISAVERAGE SELLING PRICE OF KEY PLAYERS, BY HARDWAREAVERAGE SELLING PRICE OF KEY PLAYERS, BY SOLUTION
-
5.9 TECHNOLOGY ANALYSISKEY TECHNOLOGIES- LoRa Modulation- LoRaWAN Protocol- Gateway InfrastructureCOMPLEMENTARY TECHNOLOGIES- Edge Computing- Blockchain- Artificial Intelligence (AI) and Machine Learning (ML)- Cloud ComputingADJACENT TECHNOLOGIES- Zigbee- Cellular IoT- Sigfox- BLE- LTE-M
-
5.10 PATENT ANALYSISLIST OF MAJOR PATENTS
-
5.11 PORTER’S FIVE FORCES ANALYSISTHREAT OF NEW ENTRANTSTHREAT OF SUBSTITUTESBARGAINING POWER OF BUYERSBARGAINING POWER OF SUPPLIERSINTENSITY OF COMPETITIVE RIVALRY
- 5.12 TRENDS/DISRUPTIONS IMPACTING CUSTOMERS’ BUSINESSES IN LORA AND LORAWAN IOT MARKET
-
5.13 KEY STAKEHOLDERS & BUYING CRITERIAKEY STAKEHOLDERS IN BUYING PROCESS- Buying criteria
- 5.14 KEY CONFERENCES & EVENTS, 2024–2025
-
5.15 TECHNOLOGY ROADMAP FOR LORA AND LORAWAN IOT MARKETSHORT-TERM ROADMAP (2023–2025)MID-TERM ROADMAP (2026–2028)LONG-TERM ROADMAP (2029–2030)
-
5.16 BEST PRACTICES IN LORA AND LORAWAN IOT MARKETELIMINATING UNNECESSARY JOIN REQUESTSLIMITING TRANSMISSION LENGTH, PAYLOAD SIZE, AND DUTY CYCLEUSING ADAPTIVE DATA RATE (ADR) FOR STATIONARY DEVICESUSING OVER-THE-AIR ACTIVATION (OTAA)
-
5.17 CURRENT AND EMERGING BUSINESS MODELSDEVICE SALES MODELSUBSCRIPTION MODELPLATFORM AS A SERVICE (PAAS) MODELVALUE-ADDED RESELLER (VAR) MODELHYBRID MODEL
- 5.18 MARKET: TOOLS, FRAMEWORKS, AND TECHNIQUES
-
5.19 HS CODE ANALYSIS: ELECTRONIC INTEGRATED CIRCUITS AS PROCESSORS AND CONTROLLERS, WHETHER OR NOT COMBINED WITH MEMORIES, CONVERTERS, LOGIC CIRCUITS, AMPLIFIERS, CLOCK AND TIMING CIRCUITS, OR OTHER CIRCUITS (8542)EXPORT SCENARIO FOR HS CODE: 8542IMPORT SCENARIO FOR HS CODE: 8542
-
6.1 INTRODUCTIONOFFERING: MARKET DRIVERS
-
6.2 HARDWARESENSORS- LoRaWAN sensors to enable long-range, low-power, and cost-effective wireless communicationsNETWORKING GATEWAYS- Networking gateways to bridge connectivity between IoT devices and networkSYSTEM ON CHIP (SOC)- SOC technology to facilitate compact, long-range, low-power connectivity for IoT devicesOTHER HARDWARE (ACTUATORS, EXTERNAL ANTENNAS, AND SERVERS)
-
6.3 PLATFORMSNEED FOR COMPREHENSIVE SOLUTION FOR DEVICE MANAGEMENT, APPLICATION DEVELOPMENT, AND NETWORK MANAGEMENT TO DRIVE MARKET
-
6.4 SERVICESPROFESSIONAL SERVICESCONSULTING- Need to create scalable and secure LoRaWAN network designs to drive demand for consulting servicesDEPLOYMENT & INTEGRATION- Need to integrate IoT devices with cloud platforms and existing IT infrastructure to boost marketSUPPORT & MAINTENANCE- Need to ensure smooth deployment of LoRaWAN IoT to drive demand for support & maintenanceMANAGED SERVICES- Need for quick and cost-effective managed services to drive market
-
7.1 INTRODUCTIONNETWORK DEPLOYMENT: MARKET DRIVERS
-
7.2 PUBLIC NETWORKNEED FOR DIVERSE IOT APPLICATION DEPLOYMENT TO DRIVE GROWTH OF LORA AND LORAWAN TECHNOLOGY
-
7.3 PRIVATE NETWORKNEED FOR SECURE NETWORK TO DRIVE GROWTH OF PRIVATE NETWORKS
-
7.4 HYBRID NETWORKRISING CUSTOMIZED CONNECTIVITY NEEDS TO DRIVE HIGHER ADOPTION OF TECHNOLOGY
-
8.1 INTRODUCTIONAPPLICATION: MARKET DRIVERS
-
8.2 ASSET TRACKINGGROWING NEED FOR COST-EFFECTIVE ASSET TRACKING SOLUTIONS TO DRIVE MARKET GROWTH
-
8.3 INDUSTRIAL IOTNEED TO AUTOMATE INDUSTRIAL PROCESSES USING LONG-RANGE, LOW-POWER CAPABILITIES TO DRIVE MARKET GROWTH
-
8.4 SMART BUILDINGSNEED FOR EFFECTIVE MONITORING AND ROBUST CONTROL SYSTEMS DEPLOYED ACROSS BUILDINGS TO FOSTER MARKET GROWTH
-
8.5 SMART AGRICULTURE AND LIVESTOCK MANAGEMENTNEED FOR EFFICIENT ENVIRONMENTAL MONITORING TO FOSTER ADOPTION OF LORA AND LORAWAN TECHNOLOGY IN SMART AGRICULTURE AND LIVESTOCK MANAGEMENT
-
8.6 SMART CITIESGROWING FOCUS ON URBANIZATION TO BOOST ADOPTION OF LORA AND LORAWAN TECHNOLOGY IN SMART CITIES FIELD
-
8.7 SMART HEALTHCARENEED FOR REAL-TIME PATIENT MONITORING TO IMPROVE HEALTHCARE SYSTEM TO DRIVE GROWTH
-
8.8 SMART UTILITIESNEED FOR MODERN INFRASTRUCTURE AND REAL-TIME MONITORING TO DRIVE MARKET GROWTH
- 8.9 OTHER APPLICATIONS
-
9.1 INTRODUCTIONEND USER: MARKET DRIVERS
-
9.2 MANUFACTURINGNEED TO OPTIMIZE AND ENABLE SMARTER OPERATIONS ACROSS MANUFACTURING INDUSTRIES TO DRIVE MARKET GROWTHMANUFACTURING: LORA AND LORAWAN IOT USE CASES- Predictive maintenance- Inventory and supply chain optimization- Environment monitoring- Asset tracking and management- Worker safety and security
-
9.3 ENERGY & UTILITIESGROWING ADOPTION OF SMART GRIDS, SMART METERS, AND WATER MANAGEMENT SYSTEMS TO PROPEL MARKET GROWTHENERGY & UTILITIES: LORA AND LORAWAN IOT USE CASES- Smart metering- Smart grid management and optimization- Water management- Environmental monitoring
-
9.4 AGRICULTUREREAL-TIME SMART AGRICULTURAL PRACTICES TO FOSTER MARKET GROWTHAGRICULTURE: LORA AND LORAWAN IOT USE CASES- Livestock monitoring- Precision farming- Crop monitoring and disease prevention
-
9.5 RETAILRISING INVENTORY MANAGEMENT AND ASSET TRACKING NEEDS TO DRIVE GROWTHRETAIL: LORA AND LORAWAN IOT USE CASES- Inventory management- Precise asset tracking- Smart store monitoring- Customer analytics
-
9.6 HEALTHCAREEMERGENCY SERVICES AND COLD STORAGE MONITORING NEEDS TO DRIVE MARKET GROWTHHEALTHCARE: LORA AND LORAWAN IOT USE CASES- Remote patient monitoring- Medical asset monitoring- Patient safety and security- Cold storage temperature monitoring- Smart medical waste management- Fall detection and emergency response
-
9.7 TRANSPORTATION & LOGISTICSRISING NEED FOR REAL-TIME MONITORING AND PREDICTIVE MAINTENANCE TO DRIVE MARKET GROWTHTRANSPORTATION & LOGISTICS: LORA AND LORAWAN IOT USE CASES- Asset tracking and management- Predictive maintenance optimization- Cargo monitoring and security- Safety and security measures
-
9.8 GOVERNMENT & PUBLIC SAFETYGROWING AWARENESS AMONGST GOVERNMENTS AND SMART CITY APPLICATIONS TO FOSTER MARKET GROWTHGOVERNMENT & PUBLIC SAFETY: LORA AND LORAWAN IOT USE CASES- Smart cities- Emergency response systems- Water energy management- Public health monitoring
-
9.9 RESIDENTIALSMART HOME AUTOMATION NEEDS TO PROPEL MARKET GROWTHRESIDENTIAL: LORA AND LORAWAN IOT USE CASES- Smart home automation- Energy and water management- Home security and monitoring- Neighborhood connectivity
-
9.10 OTHER END USERSOTHER END USERS: LORA AND LORAWAN IOT USE CASES- Network monitoring- Real-time occupancy management- Smart office solutions- Athlete performance monitoring- Smart campus solutions
- 10.1 INTRODUCTION
-
10.2 NORTH AMERICANORTH AMERICA: MARKET DRIVERSNORTH AMERICA: RECESSION IMPACTUS- Robust financial ecosystem and major players to drive marketCANADA- Government initiatives and immense participation from private players to drive market growth
-
10.3 EUROPEEUROPE: MARKET DRIVERSEUROPE: RECESSION IMPACTGERMANY- Robust financial ecosystem to drive growthUK- Government initiatives and availability of advanced connectivity to drive growthITALY- Demand for LoRa and LoRAWAN IoT solutions from industrial sector to drive marketFRANCE- Strategic investments and innovative solutions to fuel market growthSPAIN- Government funding and smart city initiatives to drive growth of marketNORDICS- Government initiatives to drive growth of marketREST OF EUROPE
-
10.4 ASIA PACIFICASIA PACIFIC: MARKET DRIVERSASIA PACIFIC: RECESSION IMPACTCHINA- Substantial market size, emphasis on IoT development, and extensive industrial base to drive demandINDIA- Focus on adopting latest technologies and investments to propel marketJAPAN- Need for resource and infrastructure monitoring for smart city projects to drive marketAUSTRALIA & NEW ZEALAND- Network coverage expansion and supportive regulations to boost marketSOUTH KOREA- Substantial developments and adoption of LoRa and LoRaWAN IoT from various industries to propel marketSOUTHEAST ASIA- Increasing technological advancements, government initiatives, and dynamic startup ecosystem to drive marketREST OF ASIA PACIFIC
-
10.5 MIDDLE EAST & AFRICAMIDDLE EAST & AFRICA: LORA AND LORAWAN IOT MARKET DRIVERSMIDDLE EAST & AFRICA: RECESSION IMPACTGCC COUNTRIES- UAE- Kingdom of Saudi ArabiaREST OF GCC COUNTRIESSOUTH AFRICA- Innovative digital payment solutions to drive growthREST OF MIDDLE EAST & AFRICA
-
10.6 LATIN AMERICALATIN AMERICA: MARKET DRIVERSLATIN AMERICA: RECESSION IMPACTBRAZIL- Demand from agricultural sector, resource management requirements, and smart city initiatives to drive marketMEXICO- Smart city initiatives and implementation of LoRa and LoRaWAN technology by IoT startups to fuel marketREST OF LATIN AMERICA
- 11.1 INTRODUCTION
-
11.2 KEY PLAYER STRATEGIES/RIGHT TO WINOVERVIEW OF STRATEGIES ADOPTED BY KEY PLAYERS
- 11.3 REVENUE ANALYSIS
-
11.4 MARKET SHARE ANALYSISMARKET RANKING ANALYSIS
-
11.5 COMPANY EVALUATION MATRIX: KEY PLAYERSSTARSEMERGING LEADERSPERVASIVE PLAYERSPARTICIPANTSCOMPANY FOOTPRINT
-
11.6 COMPANY EVALUATION MATRIX: STARTUPS/SMESPROGRESSIVE COMPANIESRESPONSIVE COMPANIESDYNAMIC COMPANIESSTARTING BLOCKSCOMPETITIVE BENCHMARKING
-
11.7 COMPETITIVE SCENARIO AND TRENDSPRODUCT LAUNCHESDEALSOTHERS
- 11.8 BRAND/PRODUCT COMPARISON
- 11.9 COMPANY VALUATION AND FINANCIAL METRICS OF KEY LORA AND LORAWAN IOT PROVIDERS
-
12.1 KEY PLAYERSTHE BOSCH GROUP- Business overview- Products/Solutions/Services offered- Recent developments- MnM viewCISCO- Business overview- Products/Solutions/Services offered- Recent developments- MnM viewORANGE SA- Business overview- Products/Solutions/Services offered- Recent developments- MnM viewCOMCAST CORPORATION- Business overview- Products/Solutions/Services offered- Recent developments- MnM viewSEMTECH CORPORATION- Business overview- Products/Solutions/Services offered- Recent developments- MnM viewNEC CORPORATION- Business overview- Products/Solutions/Services offered- Recent developmentsTATA COMMUNICATIONS- Business overview- Products/Solutions/Services offered- Recent developmentsAWS- Business overview- Products/Solutions/Services offered- Recent developmentsADVANTECH- Business overview- Products/Solutions/Services offered- Recent developmentsSK TELECOM- Business overview- Products/Solutions/Services offered- Recent developmentsMURATANETMORE GROUPDIGI INTERNATIONALMULTITECHEZURIO
-
12.2 STARTUPS/SMESKERLINKACTILITYSENSOTERRANWAVE TECHNOLOGIESRAKWIRELESSTHETHINGS.IODATACAKEMILESIGHTLORIOTEXOSITEORBIWISE
- 13.1 INTRODUCTION
-
13.2 SD-WAN MARKETMARKET DEFINITIONMARKET OVERVIEWSD-WAN MARKET, BY COMPONENTSD-WAN MARKET, BY DEPLOYMENT MODESD-WAN MARKET, BY ORGANIZATION SIZESD-WAN MARKET, BY END USERSD-WAN MARKET, BY REGION
-
13.3 5G IOT MARKETMARKET DEFINITIONMARKET OVERVIEW5G IOT MARKET, BY COMPONENT5G IOT MARKET, BY NETWORK TYPE5G IOT MARKET, BY ORGANIZATION SIZE5G IOT MARKET, BY TYPE5G IOT MARKET, BY END USER5G IOT MARKET, BY REGION
- 14.1 DISCUSSION GUIDE
- 14.2 KNOWLEDGESTORE: MARKETSANDMARKETS’ SUBSCRIPTION PORTAL
- 14.3 CUSTOMIZATION OPTIONS
- 14.4 RELATED REPORTS
- 14.5 AUTHOR DETAILS
- TABLE 1 USD EXCHANGE RATES, 2019–2023
- TABLE 2 RISK ASSESSMENT
- TABLE 3 RESEARCH ASSUMPTIONS
- TABLE 4 LORA AND LORAWAN IOT MARKET: ECOSYSTEM
- TABLE 5 TARIFF RELATED TO MACHINES FOR RECEPTION, CONVERSION, AND TRANSMISSION OR REGENERATION OF VOICE, IMAGES, OR OTHER DATA (851769)
- TABLE 6 NORTH AMERICA: LIST OF REGULATORY BODIES, GOVERNMENT AGENCIES, AND OTHER ORGANIZATIONS
- TABLE 7 EUROPE: LIST OF REGULATORY BODIES, GOVERNMENT AGENCIES, AND OTHER ORGANIZATIONS
- TABLE 8 ASIA PACIFIC: LIST OF REGULATORY BODIES, GOVERNMENT AGENCIES, AND OTHER ORGANIZATIONS
- TABLE 9 ROW: LIST OF REGULATORY BODIES, GOVERNMENT AGENCIES, AND OTHER ORGANIZATIONS
- TABLE 10 AVERAGE SELLING PRICE OF KEY PLAYERS, BY HARDWARE (USD)
- TABLE 11 AVERAGE SELLING PRICE OF KEY PLAYERS, BY SOLUTION
- TABLE 12 LORA AND LORAWAN IOT MARKET: PORTER’S FIVE FORCES MODEL
- TABLE 13 INFLUENCE OF STAKEHOLDERS ON BUYING PROCESS FOR TOP THREE END USERS
- TABLE 14 KEY BUYING CRITERIA FOR TOP THREE END USERS
- TABLE 15 LORA AND LORAWAN IOT MARKET: LIST OF CONFERENCES & EVENTS, 2024–2025
- TABLE 16 MARKET, BY OFFERING, 2018–2023 (USD MILLION)
- TABLE 17 LORA AND LORAWAN IOT MARKET, BY OFFERING, 2024–2029 (USD MILLION)
- TABLE 18 HARDWARE: MARKET, BY REGION, 2018–2023 (USD MILLION)
- TABLE 19 HARDWARE: MARKET, BY REGION, 2024–2029 (USD MILLION)
- TABLE 20 SENSORS: MARKET, BY REGION, 2018–2023 (USD MILLION)
- TABLE 21 SENSORS: MARKET, BY REGION, 2024–2029 (USD MILLION)
- TABLE 22 NETWORKING GATEWAYS: MARKET, BY REGION, 2018–2023 (USD MILLION)
- TABLE 23 NETWORKING GATEWAYS: MARKET, BY REGION, 2024–2029 (USD MILLION)
- TABLE 24 SYSTEM ON CHIP (SOC): MARKET, BY REGION, 2018–2023 (USD MILLION)
- TABLE 25 SYSTEM ON CHIP (SOC): MARKET, BY REGION, 2024–2029 (USD MILLION)
- TABLE 26 OTHER HARDWARE: MARKET, BY REGION, 2018–2023 (USD MILLION)
- TABLE 27 OTHER HARDWARE: MARKET, BY REGION, 2024–2029 (USD MILLION)
- TABLE 28 PLATFORMS: MARKET, BY REGION, 2018–2023 (USD MILLION)
- TABLE 29 PLATFORMS: MARKET, BY REGION, 2024–2029 (USD MILLION)
- TABLE 30 SERVICES: MARKET, BY REGION, 2018–2023 (USD MILLION)
- TABLE 31 SERVICES: MARKET, BY REGION, 2024–2029 (USD MILLION)
- TABLE 32 PROFESSIONAL SERVICES: MARKET, BY REGION, 2018–2023 (USD MILLION)
- TABLE 33 PROFESSIONAL SERVICES: MARKET, BY REGION, 2024–2029 (USD MILLION)
- TABLE 34 CONSULTING: MARKET, BY REGION, 2018–2023 (USD MILLION)
- TABLE 35 CONSULTING: MARKET, BY REGION, 2024–2029 (USD MILLION)
- TABLE 36 DEPLOYMENT & INTEGRATION: MARKET, BY REGION, 2018–2023 (USD MILLION)
- TABLE 37 DEPLOYMENT & INTEGRATION: MARKET, BY REGION, 2024–2029 (USD MILLION)
- TABLE 38 SUPPORT & MAINTENANCE: MARKET, BY REGION, 2018–2023 (USD MILLION)
- TABLE 39 SUPPORT & MAINTENANCE: MARKET, BY REGION, 2024–2029 (USD MILLION)
- TABLE 40 MANAGED SERVICES: MARKET, BY REGION, 2018–2023 (USD MILLION)
- TABLE 41 MANAGED SERVICES: LORA AND LORAWAN IOT MARKET, BY REGION, 2024–2029 (USD MILLION)
- TABLE 42 NETWORK DEPLOYMENT: MARKET, BY REGION, 2018–2023 (USD MILLION)
- TABLE 43 NETWORK DEPLOYMENT: MARKET, BY REGION, 2024–2029 (USD MILLION)
- TABLE 44 PUBLIC NETWORK: MARKET, BY REGION, 2018–2023 (USD MILLION)
- TABLE 45 PUBLIC NETWORK: MARKET, BY REGION, 2024–2029 (USD MILLION)
- TABLE 46 PRIVATE NETWORK: MARKET, BY REGION, 2018–2023 (USD MILLION)
- TABLE 47 PRIVATE NETWORK: MARKET, BY REGION, 2024–2029 (USD MILLION)
- TABLE 48 HYBRID NETWORK: MARKET, BY REGION, 2018–2023 (USD MILLION)
- TABLE 49 HYBRID NETWORK: MARKET, BY REGION, 2024–2029 (USD MILLION)
- TABLE 50 ASSET TRACKING: MARKET, BY REGION, 2018–2023 (USD MILLION)
- TABLE 51 ASSET TRACKING: MARKET, BY REGION, 2024–2029 (USD MILLION)
- TABLE 52 INDUSTRIAL IOT: MARKET, BY REGION, 2018–2023 (USD MILLION)
- TABLE 53 INDUSTRIAL IOT: MARKET, BY REGION, 2024–2029 (USD MILLION)
- TABLE 54 SMART BUILDINGS: MARKET, BY REGION, 2018–2023 (USD MILLION)
- TABLE 55 SMART BUILDINGS: MARKET, BY REGION, 2024–2029 (USD MILLION)
- TABLE 56 SMART AGRICULTURE AND LIVESTOCK MANAGEMENT: MARKET, BY REGION, 2018–2023 (USD MILLION)
- TABLE 57 SMART AGRICULTURE AND LIVESTOCK MANAGEMENT: MARKET, BY REGION, 2024–2029 (USD MILLION)
- TABLE 58 SMART CITIES: LORA AND LORAWAN IOT MARKET, BY REGION, 2018–2023 (USD MILLION)
- TABLE 59 SMART CITIES: MARKET, BY REGION, 2024–2029 (USD MILLION)
- TABLE 60 SMART HEALTHCARE: MARKET, BY REGION, 2018–2023 (USD MILLION)
- TABLE 61 SMART HEALTHCARE: MARKET, BY REGION, 2024–2029 (USD MILLION)
- TABLE 62 SMART UTILITIES: MARKET, BY REGION, 2018–2023 (USD MILLION)
- TABLE 63 SMART UTILITIES: MARKET, BY REGION, 2024–2029 (USD MILLION)
- TABLE 64 OTHER APPLICATIONS: MARKET, BY REGION, 2018–2023 (USD MILLION)
- TABLE 65 OTHER APPLICATIONS: MARKET, BY REGION, 2024–2029 (USD MILLION)
- TABLE 66 MANUFACTURING: MARKET, BY REGION, 2018–2023 (USD MILLION)
- TABLE 67 MANUFACTURING: MARKET, BY REGION, 2024–2029 (USD MILLION)
- TABLE 68 ENERGY & UTILITIES: MARKET, BY REGION, 2018–2023 (USD MILLION)
- TABLE 69 ENERGY & UTILITIES: MARKET, BY REGION, 2024–2029 (USD MILLION)
- TABLE 70 AGRICULTURE: MARKET, BY REGION, 2018–2023 (USD MILLION)
- TABLE 71 AGRICULTURE: MARKET, BY REGION, 2024–2029 (USD MILLION)
- TABLE 72 RETAIL: MARKET, BY REGION, 2018–2023 (USD MILLION)
- TABLE 73 RETAIL: MARKET, BY REGION, 2024–2029 (USD MILLION)
- TABLE 74 HEALTHCARE: MARKET, BY REGION, 2018–2023 (USD MILLION)
- TABLE 75 HEALTHCARE: LORA AND LORAWAN IOT MARKET, BY REGION, 2024–2029 (USD MILLION)
- TABLE 76 TRANSPORTATION & LOGISTICS: MARKET, BY REGION, 2018–2023 (USD MILLION)
- TABLE 77 TRANSPORTATION & LOGISTICS: MARKET, BY REGION, 2024–2029 (USD MILLION)
- TABLE 78 GOVERNMENT AND PUBLIC SAFETY: MARKET, BY REGION, 2018–2023 (USD MILLION)
- TABLE 79 GOVERNMENT AND PUBLIC SAFETY: MARKET, BY REGION, 2024–2029 (USD MILLION)
- TABLE 80 RESIDENTIAL: MARKET, BY REGION, 2018–2023 (USD MILLION)
- TABLE 81 RESIDENTIAL: MARKET, BY REGION, 2024–2029 (USD MILLION)
- TABLE 82 OTHER END USERS: MARKET, BY REGION, 2018–2023 (USD MILLION)
- TABLE 83 OTHER END USERS: MARKET, BY REGION, 2024–2029 (USD MILLION)
- TABLE 84 LORA AND LORAWAN IOT MARKET, BY REGION, 2018–2023 (USD MILLION)
- TABLE 85 MARKET, BY REGION, 2024–2029 (USD MILLION)
- TABLE 86 NORTH AMERICA: MARKET, BY OFFERING, 2018–2023 (USD MILLION)
- TABLE 87 NORTH AMERICA: MARKET, BY OFFERING, 2024–2029 (USD MILLION)
- TABLE 88 NORTH AMERICA: MARKET, BY HARDWARE, 2018–2023 (USD MILLION)
- TABLE 89 NORTH AMERICA: MARKET, BY HARDWARE, 2024–2029 (USD MILLION)
- TABLE 90 NORTH AMERICA: MARKET, BY SERVICE, 2018–2023 (USD MILLION)
- TABLE 91 NORTH AMERICA: LORA AND LORAWAN IOT MARKET, BY SERVICE, 2024–2029 (USD MILLION)
- TABLE 92 NORTH AMERICA: MARKET, BY PROFESSIONAL SERVICE, 2018–2023 (USD MILLION)
- TABLE 93 NORTH AMERICA: MARKET, BY PROFESSIONAL SERVICE, 2024–2029 (USD MILLION)
- TABLE 94 NORTH AMERICA: MARKET, BY NETWORK DEPLOYMENT, 2018–2023 (USD MILLION)
- TABLE 95 NORTH AMERICA: MARKET, BY NETWORK DEPLOYMENT, 2024–2029 (USD MILLION)
- TABLE 96 NORTH AMERICA: MARKET, BY END USER, 2018–2023 (USD MILLION)
- TABLE 97 NORTH AMERICA: MARKET, BY END USER, 2024–2029 (USD MILLION)
- TABLE 98 NORTH AMERICA: MARKET, BY APPLICATION, 2018–2023 (USD MILLION)
- TABLE 99 NORTH AMERICA: MARKET, BY APPLICATION, 2024–2029 (USD MILLION)
- TABLE 100 NORTH AMERICA: MARKET, BY COUNTRY, 2018–2023 (USD MILLION)
- TABLE 101 NORTH AMERICA: MARKET, BY COUNTRY, 2024–2029 (USD MILLION)
- TABLE 102 US: MARKET, BY OFFERING, 2018–2023 (USD MILLION)
- TABLE 103 US: MARKET, BY OFFERING, 2024–2029 (USD MILLION)
- TABLE 104 US: MARKET, BY HARDWARE, 2018–2023 (USD MILLION)
- TABLE 105 US: MARKET, BY HARDWARE, 2024–2029 (USD MILLION)
- TABLE 106 US: MARKET, BY SERVICE, 2018–2023 (USD MILLION)
- TABLE 107 US: LORA AND LORAWAN IOT MARKET, BY SERVICE, 2024–2029 (USD MILLION)
- TABLE 108 US: MARKET, BY PROFESSIONAL SERVICE, 2018–2023 (USD MILLION)
- TABLE 109 US: MARKET, BY PROFESSIONAL SERVICE, 2024–2029 (USD MILLION)
- TABLE 110 US: MARKET, BY NETWORK DEPLOYMENT, 2018–2023 (USD MILLION)
- TABLE 111 US: MARKET, BY NETWORK DEPLOYMENT, 2024–2029 (USD MILLION)
- TABLE 112 US: MARKET, BY END USER, 2018–2023 (USD MILLION)
- TABLE 113 US: MARKET, BY END USER, 2024–2029 (USD MILLION)
- TABLE 114 US: MARKET, BY APPLICATION, 2018–2023 (USD MILLION)
- TABLE 115 US: MARKET, BY APPLICATION, 2024–2029 (USD MILLION)
- TABLE 116 CANADA: MARKET, BY OFFERING, 2018–2023 (USD MILLION)
- TABLE 117 CANADA: MARKET, BY OFFERING, 2024–2029 (USD MILLION)
- TABLE 118 CANADA: MARKET, BY HARDWARE, 2018–2023 (USD MILLION)
- TABLE 119 CANADA: MARKET, BY HARDWARE, 2024–2029 (USD MILLION)
- TABLE 120 CANADA: MARKET, BY SERVICE, 2018–2023 (USD MILLION)
- TABLE 121 CANADA: MARKET, BY SERVICE, 2024–2029 (USD MILLION)
- TABLE 122 CANADA: MARKET, BY PROFESSIONAL SERVICE, 2018–2023 (USD MILLION)
- TABLE 123 CANADA: MARKET, BY PROFESSIONAL SERVICE, 2024–2029 (USD MILLION)
- TABLE 124 CANADA: MARKET, BY NETWORK DEPLOYMENT, 2018–2023 (USD MILLION)
- TABLE 125 CANADA: MARKET, BY NETWORK DEPLOYMENT, 2024–2029 (USD MILLION)
- TABLE 126 CANADA: MARKET, BY END USER, 2018–2023 (USD MILLION)
- TABLE 127 CANADA: MARKET, BY END USER, 2024–2029 (USD MILLION)
- TABLE 128 CANADA: MARKET, BY APPLICATION, 2018–2023 (USD MILLION)
- TABLE 129 CANADA: MARKET, BY APPLICATION, 2024–2029 (USD MILLION)
- TABLE 130 EUROPE: LORA AND LORAWAN IOT MARKET, BY OFFERING, 2018–2023 (USD MILLION)
- TABLE 131 EUROPE: MARKET, BY OFFERING, 2024–2029 (USD MILLION)
- TABLE 132 EUROPE: MARKET, BY HARDWARE, 2018–2023 (USD MILLION)
- TABLE 133 EUROPE: MARKET, BY HARDWARE, 2024–2029 (USD MILLION)
- TABLE 134 EUROPE: MARKET, BY SERVICE, 2018–2023 (USD MILLION)
- TABLE 135 EUROPE: MARKET, BY SERVICE, 2024–2029 (USD MILLION)
- TABLE 136 EUROPE: MARKET, BY PROFESSIONAL SERVICE, 2018–2023 (USD MILLION)
- TABLE 137 EUROPE: MARKET, BY PROFESSIONAL SERVICE, 2024–2029 (USD MILLION)
- TABLE 138 EUROPE: MARKET, BY NETWORK DEPLOYMENT, 2018–2023 (USD MILLION)
- TABLE 139 EUROPE: MARKET, BY NETWORK DEPLOYMENT, 2024–2029 (USD MILLION)
- TABLE 140 EUROPE: MARKET, BY END USER, 2018–2023 (USD MILLION)
- TABLE 141 EUROPE: MARKET, BY END USER, 2024–2029 (USD MILLION)
- TABLE 142 EUROPE: MARKET, BY APPLICATION, 2018–2023 (USD MILLION)
- TABLE 143 EUROPE: MARKET, BY APPLICATION, 2024–2029 (USD MILLION)
- TABLE 144 EUROPE: MARKET, BY COUNTRY, 2018–2023 (USD MILLION)
- TABLE 145 EUROPE: MARKET, BY COUNTRY, 2024–2029 (USD MILLION)
- TABLE 146 GERMANY: MARKET, BY OFFERING, 2018–2023 (USD MILLION)
- TABLE 147 GERMANY: LORA AND LORAWAN IOT MARKET, BY OFFERING, 2024–2029 (USD MILLION)
- TABLE 148 GERMANY: MARKET, BY HARDWARE, 2018–2023 (USD MILLION)
- TABLE 149 GERMANY: MARKET, BY HARDWARE, 2024–2029 (USD MILLION)
- TABLE 150 GERMANY: MARKET, BY SERVICE, 2018–2023 (USD MILLION)
- TABLE 151 GERMANY: MARKET, BY SERVICE, 2024–2029 (USD MILLION)
- TABLE 152 GERMANY: MARKET, BY PROFESSIONAL SERVICE, 2018–2023 (USD MILLION)
- TABLE 153 GERMANY: MARKET, BY PROFESSIONAL SERVICE, 2024–2029 (USD MILLION)
- TABLE 154 GERMANY: MARKET, BY NETWORK DEPLOYMENT, 2018–2023 (USD MILLION)
- TABLE 155 GERMANY: MARKET, BY NETWORK DEPLOYMENT, 2024–2029 (USD MILLION)
- TABLE 156 GERMANY: MARKET, BY END USER, 2018–2023 (USD MILLION)
- TABLE 157 GERMANY: MARKET, BY END USER, 2024–2029 (USD MILLION)
- TABLE 158 GERMANY: MARKET, BY APPLICATION, 2018–2023 (USD MILLION)
- TABLE 159 GERMANY: MARKET, BY APPLICATION, 2024–2029 (USD MILLION)
- TABLE 160 ASIA PACIFIC: MARKET, BY OFFERING, 2018–2023 (USD MILLION)
- TABLE 161 ASIA PACIFIC: MARKET, BY OFFERING, 2024–2029 (USD MILLION)
- TABLE 162 ASIA PACIFIC: LORA AND LORAWAN IOT MARKET, BY HARDWARE, 2018–2023 (USD MILLION)
- TABLE 163 ASIA PACIFIC: MARKET, BY HARDWARE, 2024–2029 (USD MILLION)
- TABLE 164 ASIA PACIFIC: MARKET, BY SERVICE, 2018–2023 (USD MILLION)
- TABLE 165 ASIA PACIFIC: MARKET, BY SERVICE, 2024–2029 (USD MILLION)
- TABLE 166 ASIA PACIFIC: MARKET, BY PROFESSIONAL SERVICE, 2018–2023 (USD MILLION)
- TABLE 167 ASIA PACIFIC: MARKET, BY PROFESSIONAL SERVICE, 2024–2029 (USD MILLION)
- TABLE 168 ASIA PACIFIC: MARKET, BY NETWORK DEPLOYMENT, 2018–2023 (USD MILLION)
- TABLE 169 ASIA PACIFIC: MARKET, BY NETWORK DEPLOYMENT, 2024–2029 (USD MILLION)
- TABLE 170 ASIA PACIFIC: MARKET, BY END USER, 2018–2023 (USD MILLION)
- TABLE 171 ASIA PACIFIC: MARKET, BY END USER, 2024–2029 (USD MILLION)
- TABLE 172 ASIA PACIFIC: MARKET, BY APPLICATION, 2018–2023 (USD MILLION)
- TABLE 173 ASIA PACIFIC: MARKET, BY APPLICATION, 2024–2029 (USD MILLION)
- TABLE 174 ASIA PACIFIC: MARKET, BY COUNTRY, 2018–2023 (USD MILLION)
- TABLE 175 ASIA PACIFIC: MARKET, BY COUNTRY, 2024–2029 (USD MILLION)
- TABLE 176 CHINA: MARKET, BY OFFERING, 2018–2023 (USD MILLION)
- TABLE 177 CHINA: MARKET, BY OFFERING, 2024–2029 (USD MILLION)
- TABLE 178 CHINA: MARKET, BY HARDWARE, 2018–2023 (USD MILLION)
- TABLE 179 CHINA: MARKET, BY HARDWARE, 2024–2029 (USD MILLION)
- TABLE 180 CHINA: MARKET, BY SERVICE, 2018–2023 (USD MILLION)
- TABLE 181 CHINA: MARKET, BY SERVICE, 2024–2029 (USD MILLION)
- TABLE 182 CHINA: MARKET, BY PROFESSIONAL SERVICE, 2018–2023 (USD MILLION)
- TABLE 183 CHINA: MARKET, BY PROFESSIONAL SERVICE, 2024–2029 (USD MILLION)
- TABLE 184 CHINA: MARKET, BY NETWORK DEPLOYMENT, 2018–2023 (USD MILLION)
- TABLE 185 CHINA: MARKET, BY NETWORK DEPLOYMENT, 2024–2029 (USD MILLION)
- TABLE 186 CHINA: MARKET, BY END USER, 2018–2023 (USD MILLION)
- TABLE 187 CHINA: MARKET, BY END USER, 2024–2029 (USD MILLION)
- TABLE 188 CHINA: MARKET, BY APPLICATION, 2018–2023 (USD MILLION)
- TABLE 189 CHINA: MARKET, BY APPLICATION, 2024–2029 (USD MILLION)
- TABLE 190 MIDDLE EAST & AFRICA: MARKET, BY OFFERING, 2018–2023 (USD MILLION)
- TABLE 191 MIDDLE EAST & AFRICA: LORA AND LORAWAN IOT MARKET, BY OFFERING, 2024–2029 (USD MILLION)
- TABLE 192 MIDDLE EAST & AFRICA: MARKET, BY HARDWARE, 2018–2023 (USD MILLION)
- TABLE 193 MIDDLE EAST & AFRICA: MARKET, BY HARDWARE, 2024–2029 (USD MILLION)
- TABLE 194 MIDDLE EAST & AFRICA: MARKET, BY SERVICE, 2018–2023 (USD MILLION)
- TABLE 195 MIDDLE EAST & AFRICA: MARKET, BY SERVICE, 2024–2029 (USD MILLION)
- TABLE 196 MIDDLE EAST & AFRICA: MARKET, BY PROFESSIONAL SERVICE, 2018–2023 (USD MILLION)
- TABLE 197 MIDDLE EAST & AFRICA: MARKET, BY PROFESSIONAL SERVICE, 2024–2029 (USD MILLION)
- TABLE 198 MIDDLE EAST & AFRICA: MARKET, BY NETWORK DEPLOYMENT, 2018–2023 (USD MILLION)
- TABLE 199 MIDDLE EAST & AFRICA: MARKET, BY NETWORK DEPLOYMENT, 2024–2029 (USD MILLION)
- TABLE 200 MIDDLE EAST & AFRICA: MARKET, BY END USER, 2018–2023 (USD MILLION)
- TABLE 201 MIDDLE EAST & AFRICA: MARKET, BY END USER, 2024–2029 (USD MILLION)
- TABLE 202 MIDDLE EAST & AFRICA: MARKET, BY APPLICATION, 2018–2023 (USD MILLION)
- TABLE 203 MIDDLE EAST & AFRICA: MARKET, BY APPLICATION, 2024–2029 (USD MILLION)
- TABLE 204 MIDDLE EAST & AFRICA: MARKET, BY REGION/COUNTRY, 2018–2023 (USD MILLION)
- TABLE 205 MIDDLE EAST & AFRICA: MARKET, BY REGION/COUNTRY, 2024–2029 (USD MILLION)
- TABLE 206 GCC COUNTRIES: MARKET, BY OFFERING, 2018–2023 (USD MILLION)
- TABLE 207 GCC COUNTRIES: LORA AND LORAWAN IOT MARKET, BY OFFERING, 2024–2029 (USD MILLION)
- TABLE 208 GCC COUNTRIES: MARKET, BY HARDWARE, 2018–2023 (USD MILLION)
- TABLE 209 GCC COUNTRIES: MARKET, BY HARDWARE, 2024–2029 (USD MILLION)
- TABLE 210 GCC COUNTRIES: MARKET, BY SERVICE, 2018–2023 (USD MILLION)
- TABLE 211 GCC COUNTRIES: MARKET, BY SERVICE, 2024–2029 (USD MILLION)
- TABLE 212 GCC COUNTRIES: MARKET, BY PROFESSIONAL SERVICE, 2018–2023 (USD MILLION)
- TABLE 213 GCC COUNTRIES: MARKET, BY PROFESSIONAL SERVICE, 2024–2029 (USD MILLION)
- TABLE 214 GCC COUNTRIES: MARKET, BY NETWORK DEPLOYMENT, 2018–2023 (USD MILLION)
- TABLE 215 GCC COUNTRIES: MARKET, BY NETWORK DEPLOYMENT, 2024–2029 (USD MILLION)
- TABLE 216 GCC COUNTRIES: MARKET, BY END USER, 2018–2023 (USD MILLION)
- TABLE 217 GCC COUNTRIES: MARKET, BY END USER, 2024–2029 (USD MILLION)
- TABLE 218 GCC COUNTRIES: MARKET, BY APPLICATION, 2018–2023 (USD MILLION)
- TABLE 219 GCC COUNTRIES: MARKET, BY APPLICATION, 2024–2029 (USD MILLION)
- TABLE 220 GCC COUNTRIES: MARKET, BY COUNTRY, 2018–2023 (USD MILLION)
- TABLE 221 GCC COUNTRIES: MARKET, BY COUNTRY, 2024–2029 (USD MILLION)
- TABLE 222 LATIN AMERICA: MARKET, BY OFFERING, 2018–2023 (USD MILLION)
- TABLE 223 LATIN AMERICA: LORA AND LORAWAN IOT MARKET, BY OFFERING, 2024–2029 (USD MILLION)
- TABLE 224 LATIN AMERICA: MARKET, BY HARDWARE, 2018–2023 (USD MILLION)
- TABLE 225 LATIN AMERICA: MARKET, BY HARDWARE, 2024–2029 (USD MILLION)
- TABLE 226 LATIN AMERICA: MARKET, BY SERVICE, 2018–2023 (USD MILLION)
- TABLE 227 LATIN AMERICA: MARKET, BY SERVICE, 2024–2029 (USD MILLION)
- TABLE 228 LATIN AMERICA: MARKET, BY PROFESSIONAL SERVICE, 2018–2023 (USD MILLION)
- TABLE 229 LATIN AMERICA: MARKET, BY PROFESSIONAL SERVICE, 2024–2029 (USD MILLION)
- TABLE 230 LATIN AMERICA: MARKET, BY NETWORK DEPLOYMENT, 2018–2023 (USD MILLION)
- TABLE 231 LATIN AMERICA: MARKET, BY NETWORK DEPLOYMENT, 2024–2029 (USD MILLION)
- TABLE 232 LATIN AMERICA: MARKET, BY END USER, 2018–2023 (USD MILLION)
- TABLE 233 LATIN AMERICA: MARKET, BY END USER, 2024–2029 (USD MILLION)
- TABLE 234 LATIN AMERICA: MARKET, BY APPLICATION, 2018–2023 (USD MILLION)
- TABLE 235 LATIN AMERICA: MARKET, BY APPLICATION, 2024–2029 (USD MILLION)
- TABLE 236 LATIN AMERICA: MARKET, BY COUNTRY, 2018–2023 (USD MILLION)
- TABLE 237 LATIN AMERICA: MARKET, BY COUNTRY, 2024–2029 (USD MILLION)
- TABLE 238 BRAZIL: MARKET, BY OFFERING, 2018–2023 (USD MILLION)
- TABLE 239 BRAZIL: MARKET, BY OFFERING, 2024–2029 (USD MILLION)
- TABLE 240 BRAZIL: MARKET, BY HARDWARE, 2018–2023 (USD MILLION)
- TABLE 241 BRAZIL: LORA AND LORAWAN IOT MARKET, BY HARDWARE, 2024–2029 (USD MILLION)
- TABLE 242 BRAZIL: MARKET, BY SERVICE, 2018–2023 (USD MILLION)
- TABLE 243 BRAZIL: MARKET, BY SERVICE, 2024–2029 (USD MILLION)
- TABLE 244 BRAZIL: MARKET, BY PROFESSIONAL SERVICE, 2018–2023 (USD MILLION)
- TABLE 245 BRAZIL: MARKET, BY PROFESSIONAL SERVICE, 2024–2029 (USD MILLION)
- TABLE 246 BRAZIL: MARKET, BY NETWORK DEPLOYMENT, 2018–2023 (USD MILLION)
- TABLE 247 BRAZIL: MARKET, BY NETWORK DEPLOYMENT, 2024–2029 (USD MILLION)
- TABLE 248 BRAZIL: MARKET, BY END USER, 2018–2023 (USD MILLION)
- TABLE 249 BRAZIL: MARKET, BY END USER, 2024–2029 (USD MILLION)
- TABLE 250 BRAZIL: MARKET, BY APPLICATION, 2018–2023 (USD MILLION)
- TABLE 251 BRAZIL: MARKET, BY APPLICATION, 2024–2029 (USD MILLION)
- TABLE 252 MARKET: DEGREE OF COMPETITION
- TABLE 253 COMPANY OFFERING FOOTPRINT
- TABLE 254 COMPANY APPLICATION FOOTPRINT
- TABLE 255 COMPANY REGION FOOTPRINT
- TABLE 256 LORA AND LORAWAN IOT MARKET: KEY STARTUPS/SMES
- TABLE 257 MARKET: COMPETITIVE BENCHMARKING OF KEY STARTUPS/SMES
- TABLE 258 LORA AND LORAWAN IOT MARKET: PRODUCT LAUNCHES, JANUARY 2021–JANUARY 2024
- TABLE 259 LORA AND LORAWAN IOT MARKET: DEALS, JANUARY 2021–JANUARY 2024
- TABLE 260 LORA AND LORAWAN IOT MARKET: EXPANSIONS, MARCH 2022
- TABLE 261 THE BOSCH GROUP: COMPANY OVERVIEW
- TABLE 262 THE BOSCH GROUP: PRODUCTS/SOLUTIONS/SERVICES OFFERED
- TABLE 263 THE BOSCH GROUP: PRODUCT LAUNCHES
- TABLE 264 THE BOSCH GROUP: DEALS
- TABLE 265 CISCO: COMPANY OVERVIEW
- TABLE 266 CISCO: PRODUCTS/SOLUTIONS/SERVICES OFFERED
- TABLE 267 CISCO: PRODUCT LAUNCHES AND ENHANCEMENTS
- TABLE 268 CISCO: DEALS
- TABLE 269 ORANGE SA: COMPANY OVERVIEW
- TABLE 270 ORANGE SA: PRODUCTS/SOLUTIONS/SERVICES OFFERED
- TABLE 271 ORANGE SA: DEALS
- TABLE 272 COMCAST CORPORATION: COMPANY OVERVIEW
- TABLE 273 COMCAST CORPORATION: PRODUCTS/SOLUTIONS/SERVICES OFFERED
- TABLE 274 COMCAST CORPORATION: PRODUCT LAUNCHES AND ENHANCEMENTS
- TABLE 275 COMCAST CORPORATION: DEALS
- TABLE 276 SEMTECH CORPORATION: COMPANY OVERVIEW
- TABLE 277 SEMTECH CORPORATION: PRODUCTS/SOLUTIONS/SERVICES OFFERED
- TABLE 278 SEMTECH: PRODUCT LAUNCHES AND ENHANCEMENTS
- TABLE 279 SEMTECH: DEALS
- TABLE 280 NEC CORPORATION: COMPANY OVERVIEW
- TABLE 281 NEC CORPORATION: PRODUCTS/SOLUTIONS/SERVICES OFFERED
- TABLE 282 NEC CORPORATION: DEALS
- TABLE 283 TATA COMMUNICATIONS: COMPANY OVERVIEW
- TABLE 284 TATA COMMUNICATIONS: PRODUCTS/SOLUTIONS/SERVICES OFFERED
- TABLE 285 TATA COMMUNICATIONS: DEALS
- TABLE 286 AWS: COMPANY OVERVIEW
- TABLE 287 AWS: PRODUCTS/SOLUTIONS/SERVICES OFFERED
- TABLE 288 AWS: PRODUCT LAUNCHES AND ENHANCEMENTS
- TABLE 289 AWS: DEALS
- TABLE 290 AWS: OTHERS
- TABLE 291 ADVANTECH: COMPANY OVERVIEW
- TABLE 292 ADVANTECH: PRODUCTS/SOLUTIONS/SERVICES OFFERED
- TABLE 293 ADVANTECH: DEALS
- TABLE 294 SK TELECOM: COMPANY OVERVIEW
- TABLE 295 SK TELECOM: PRODUCTS/SOLUTIONS/SERVICES OFFERED
- TABLE 296 SK TELECOM: DEALS
- TABLE 297 SD-WAN MARKET, BY COMPONENT, 2016–2021 (USD MILLION)
- TABLE 298 SD-WAN MARKET, BY COMPONENT, 2022–2027 (USD MILLION)
- TABLE 299 SOLUTIONS: SD-WAN MARKET, BY TYPE, 2016–2021 (USD MILLION)
- TABLE 300 SOLUTIONS: SD-WAN MARKET, BY TYPE, 2022–2027 (USD MILLION)
- TABLE 301 SERVICES: SD-WAN MARKET, BY TYPE, 2016–2021 (USD MILLION)
- TABLE 302 SERVICES: SD-WAN MARKET, BY TYPE, 2022–2027 (USD MILLION)
- TABLE 303 SD-WAN MARKET, BY DEPLOYMENT MODE, 2016–2021 (USD MILLION)
- TABLE 304 SD-WAN MARKET, BY DEPLOYMENT MODE, 2022–2027 (USD MILLION)
- TABLE 305 SD-WAN MARKET, BY ORGANIZATION SIZE, 2016–2021 (USD MILLION)
- TABLE 306 SD-WAN MARKET, BY ORGANIZATION SIZE, 2022–2027 (USD MILLION)
- TABLE 307 SD-WAN MARKET, BY END USER, 2016–2021 (USD MILLION)
- TABLE 308 SD-WAN MARKET, BY END USER, 2022–2027 (USD MILLION)
- TABLE 309 SD-WAN MARKET, BY VERTICAL, 2016–2021 (USD MILLION)
- TABLE 310 SD-WAN MARKET, BY VERTICAL, 2022–2027 (USD MILLION)
- TABLE 311 SD-WAN MARKET, BY REGION, 2016–2021 (USD MILLION)
- TABLE 312 SD-WAN MARKET, BY REGION, 2022–2027 (USD MILLION)
- TABLE 313 5G IOT MARKET, BY COMPONENT, 2020–2028 (USD MILLION)
- TABLE 314 5G IOT MARKET, BY SERVICE, 2020–2028 (USD MILLION)
- TABLE 315 5G IOT MARKET, BY PROFESSIONAL SERVICE, 2020–2028 (USD MILLION)
- TABLE 316 5G IOT MARKET, BY NETWORK TYPE, 2020–2028 (USD MILLION)
- TABLE 317 5G IOT MARKET, BY ORGANIZATION SIZE, 2020–2028 (USD MILLION)
- TABLE 318 5G IOT MARKET, BY TYPE, 2020–2028 (USD MILLION)
- TABLE 319 5G IOT MARKET, BY END USER, 2020–2028 (USD MILLION)
- TABLE 320 5G IOT MARKET, BY REGION, 2020–2028 (USD MILLION)
- FIGURE 1 LORA AND LORAWAN IOT MARKET: RESEARCH DESIGN
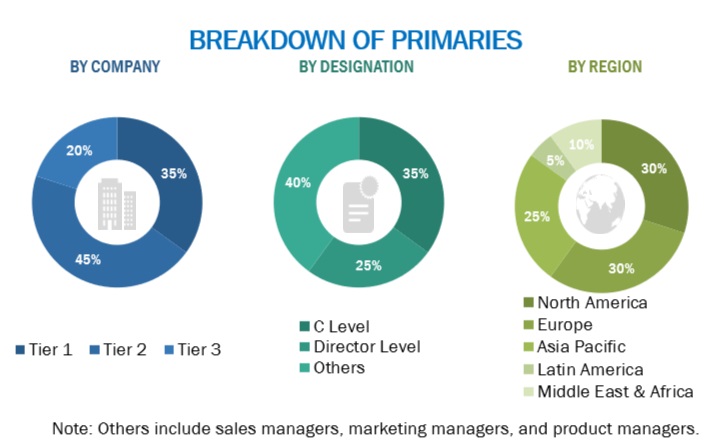
- FIGURE 2 BREAKDOWN OF PRIMARY INTERVIEWS BY COMPANY TYPE, DESIGNATION, AND REGION
- FIGURE 3 MARKET: TOP-DOWN AND BOTTOM-UP APPROACHES
- FIGURE 4 MARKET SIZE ESTIMATION METHODOLOGY – APPROACH 1 (SUPPLY SIDE): REVENUE OF VENDORS IN LORA AND LORAWAN IOT MARKET
- FIGURE 5 MARKET SIZE ESTIMATION METHODOLOGY – APPROACH 2 (DEMAND SIDE): LORA AND LORAWAN IOT MARKET
- FIGURE 6 MARKET SIZE ESTIMATION METHODOLOGY: DEMAND-SIDE ANALYSIS
- FIGURE 7 MARKET SIZE ESTIMATION USING BOTTOM-UP APPROACH
- FIGURE 8 DATA TRIANGULATION
- FIGURE 9 LORA AND LORAWAN IOT MARKET, 2022–2029 (USD MILLION)
- FIGURE 10 LORA AND LORAWAN IOT MARKET, BY REGION, 2024
- FIGURE 11 GROWING ADOPTION OF CONNECTED DEVICES FOR EFFICIENT COMMUNICATION AND DATA EXCHANGE TO DRIVE MARKET
- FIGURE 12 HARDWARE SEGMENT TO DOMINATE MARKET DURING FORECAST PERIOD
- FIGURE 13 MANAGED SERVICES SEGMENT TO ACCOUNT FOR HIGHER CAGR DURING FORECAST PERIOD
- FIGURE 14 SUPPORT & MAINTENANCE SEGMENT TO LEAD MARKET DURING FORECAST PERIOD
- FIGURE 15 HYBRID NETWORK SEGMENT TO WITNESS HIGHEST CAGR DURING FORECAST PERIOD
- FIGURE 16 ASSET TRACKING SEGMENT TO REGISTER LARGEST MARKET SHARE DURING FORECAST PERIOD
- FIGURE 17 MANUFACTURING SEGMENT TO LEAD MARKET DURING FORECAST PERIOD
- FIGURE 18 ASSET TRACKING AND MANUFACTURING SEGMENTS TO ACCOUNT FOR SIGNIFICANT MARKET SHARES IN 2024
- FIGURE 19 DRIVERS, RESTRAINTS, OPPORTUNITIES, AND CHALLENGES: LORA AND LORAWAN IOT MARKET
- FIGURE 20 EVOLUTION OF LORA AND LORAWAN IOT
- FIGURE 21 KEY PLAYERS IN LORA AND LORAWAN IOT MARKET ECOSYSTEM
- FIGURE 22 VALUE CHAIN ANALYSIS
- FIGURE 23 AVERAGE SELLING PRICE OF KEY PLAYERS, BY HARDWARE
- FIGURE 24 MAJOR PATENTS FOR LORA AND LORAWAN IOT MARKET
- FIGURE 25 TRENDS/DISRUPTIONS IMPACTING BUYERS/CLIENTS’ BUSINESSES
- FIGURE 26 INFLUENCE OF STAKEHOLDERS ON BUYING PROCESS FOR TOP THREE END USERS
- FIGURE 27 KEY BUYING CRITERIA FOR TOP THREE END USERS
- FIGURE 28 LORA AND LORAWAN IOT MARKET: TOOLS, FRAMEWORKS, AND TECHNIQUES
- FIGURE 29 ELECTRONIC INTEGRATED CIRCUITS AS PROCESSORS AND CONTROLLERS, WHETHER OR NOT COMBINED WITH MEMORIES, CONVERTERS, LOGIC CIRCUITS, AMPLIFIERS, CLOCK AND TIMING CIRCUITS, OR OTHER CIRCUITS, BY KEY COUNTRY, 2016–2023 (USD BILLION)
- FIGURE 30 ELECTRONIC INTEGRATED CIRCUITS AS PROCESSORS AND CONTROLLERS, WHETHER OR NOT COMBINED WITH MEMORIES, CONVERTERS, LOGIC CIRCUITS, AMPLIFIERS, CLOCK AND TIMING CIRCUITS, OR OTHER CIRCUITS, BY KEY COUNTRY, 2016–2023 (USD BILLION)
- FIGURE 31 SERVICES SEGMENT TO GROW AT HIGHEST CAGR DURING FORECAST PERIOD
- FIGURE 32 SENSORS SEGMENT TO GROW AT HIGHEST CAGR DURING FORECAST PERIOD
- FIGURE 33 MANAGED SERVICES SEGMENT TO GROW AT HIGHER CAGR DURING FORECAST PERIOD
- FIGURE 34 CONSULTING SEGMENT TO GROW AT HIGHEST CAGR DURING FORECAST PERIOD
- FIGURE 35 HYBRID NETWORK SEGMENT TO REGISTER HIGHEST GROWTH RATE DURING FORECAST PERIOD
- FIGURE 36 ASSET TRACKING TO HOLD LARGEST MARKET SIZE DURING FORECAST PERIOD
- FIGURE 37 HEALTHCARE SEGMENT TO REGISTER HIGHEST GROWTH RATE DURING FORECAST PERIOD
- FIGURE 38 NORTH AMERICA: MARKET SNAPSHOT
- FIGURE 39 ASIA PACIFIC: MARKET SNAPSHOT
- FIGURE 40 HISTORICAL REVENUE ANALYSIS OF KEY PLAYERS, 2019–2023 (USD MILLION)
- FIGURE 41 MARKET SHARE ANALYSIS, 2023
- FIGURE 42 MARKET RANKING ANALYSIS OF TOP 5 PLAYERS
- FIGURE 43 LORA AND LORAWAN IOT MARKET: COMPANY EVALUATION MATRIX (KEY PLAYERS), 2023
- FIGURE 44 COMPANY FOOTPRINT
- FIGURE 45 MARKET: COMPANY EVALUATION MATRIX (STARTUPS/SMES), 2023
- FIGURE 46 BRAND/PRODUCT COMPARISON
- FIGURE 47 FINANCIAL METRICS OF KEY LORA AND LORAWAN IOT VENDORS
- FIGURE 48 COMPANY VALUATION OF KEY LORA AND LORAWAN IOT VENDORS
- FIGURE 49 THE BOSCH GROUP: COMPANY SNAPSHOT
- FIGURE 50 CISCO: COMPANY SNAPSHOT
- FIGURE 51 ORANGE SA: COMPANY SNAPSHOT
- FIGURE 52 COMCAST CORPORATION: COMPANY SNAPSHOT
- FIGURE 53 SEMTECH: COMPANY SNAPSHOT
- FIGURE 54 NEC CORPORATION: COMPANY SNAPSHOT
- FIGURE 55 TATA COMMUNICATIONS: COMPANY SNAPSHOT
- FIGURE 56 AWS: COMPANY SNAPSHOT
- FIGURE 57 ADVANTECH: COMPANY SNAPSHOT
- FIGURE 58 SK TELECOM: COMPANY SNAPSHOT
This research study involved the extensive use of secondary sources, directories, and databases, such as Dun & Bradstreet (D&B) Hoovers and Bloomberg BusinessWeek, to identify and collect information useful for a technical, market-oriented, and commercial study of the LoRa and LoRaWAN IoT market. The primary sources have been mainly industry experts from the core and related industries and preferred suppliers, manufacturers, distributors, service providers, technology developers, alliances, and organizations related to all segments of the value chain of this market. In-depth interviews have been conducted with various primary respondents, including key industry participants, subject matter experts, C-level executives of key market players, and industry consultants to obtain and verify critical qualitative and quantitative information.
Secondary Research
The market for companies offering LoRa and LoRaWAN IoT solutions and services to different verticals has been estimated and projected based on the secondary data made available through paid and unpaid sources, as well as by analyzing their product portfolios in the ecosystem of the LoRa and LoRaWAN IoT market. It also involved rating company products based on their performance and quality. In the secondary research process, various sources such as the Institute of Electrical and Electronics Engineers (IEEE), ScienceDirect, ResearchGate, Academic Journals, Scientific.net have been referred to for identifying and collecting information for this study on the LoRa and LoRaWAN IoT industry. The secondary sources included annual reports, press releases, investor presentations of companies, white papers, journals, certified publications and articles by recognized authors, directories, and databases. Secondary research has been mainly used to obtain key information about the supply chain of the market, the total pool of key players, market classification, segmentation according to industry trends to the bottommost level, regional markets, and key developments from both market- and technology-oriented perspectives that have been further validated by primary sources.
Primary Research
In the primary research process, various primary sources from both the supply and demand sides were interviewed to obtain qualitative and quantitative information on the market. The primary sources from the supply side included various industry experts, including Chief Experience Officers (CXOs); Vice Presidents (VPs); directors from business development, marketing, and product development/innovation teams; related key executives from LoRa and LoRaWAN IoT solution vendors, SIs, professional service providers, and industry associations; and key opinion leaders. Primary interviews were conducted to gather insights, such as market statistics, revenue data collected from solutions and services, market breakups, market size estimations, market forecasts, and data triangulation. Primary research also helped in understanding various trends related to technologies, applications, deployments, and regions. Stakeholders from the demand side, such as Chief Information Officers (CIOs), Chief Technology Officers (CTOs), Chief Strategy Officers (CSOs), and end users using LoRa and LoRaWAN IoT solutions, were interviewed to understand the buyer’s perspective on suppliers, products, service providers, and their current usage of LoRa and LoRaWAN IoT solutions which would impact the overall LoRa and LoRaWAN IoT market.
To know about the assumptions considered for the study, download the pdf brochure
LoRa and LoRaWAN IoT Market Size Estimation
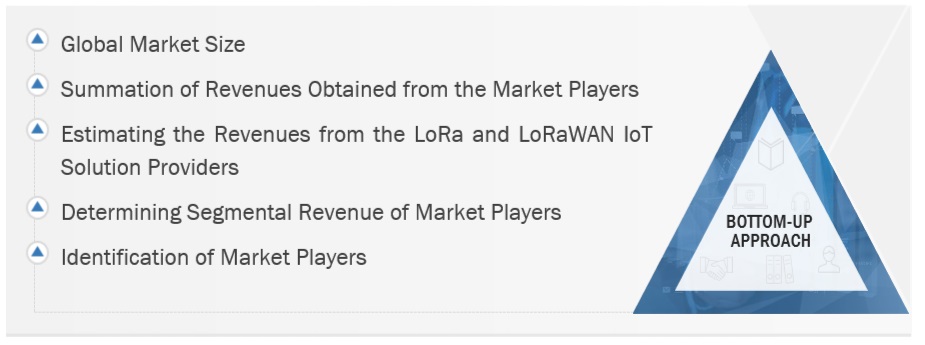
Multiple approaches were adopted to estimate and forecast the size of the LoRa and LoRaWAN IoT industry. The first approach involves estimating market size by summing up the revenue generated by companies through the sale of LoRa and LoRaWAN IoT offerings.
Both top-down and bottom-up approaches were used to estimate and validate the total size of the LoRa and LoRaWAN IoT market. These methods were extensively used to estimate the size of various segments in the market. The research methodology used to estimate the market size includes the following:
- Key players in the market have been identified through extensive secondary research.
- In terms of value, the industry’s supply chain and market size have been determined through primary and secondary research processes.
- All percentage shares, splits, and breakups have been determined using secondary sources and verified through primary sources.
Market Size Estimation Methodology-Bottom-up approach
To know about the assumptions considered for the study, Request for Free Sample Report
Market Size Estimation Methodology-Top-Down Approach
Data Triangulation
After arriving at the overall market size, the LoRa and LoRaWAN IoT market was divided into several segments and subsegments. A data triangulation procedure was used to complete the overall market engineering process and arrive at the exact statistics for all segments and subsegments, wherever applicable. The data was triangulated by studying various factors and trends from the demand and supply sides. Along with data triangulation and market breakdown, the market size was validated by the top-down and bottom-up approaches.
Market Definition
LoRa (Long Range) and LoRaWAN (Long Range Wide Area Network) represent a significant segment in the Internet of Things (IoT) market, offering low-power, long-range communication solutions ideal for various applications. LoRa technology provides the physical layer for long-distance communication, while LoRaWAN offers the protocol and network architecture for secure and scalable connectivity across vast geographic areas. This combination is particularly suited for smart city initiatives, industrial automation, agriculture, and environmental monitoring, where devices need to operate with minimal power consumption while maintaining reliable data transmission over several kilometers. The LoRa and LoRaWAN market is driven by the growing demand for efficient, cost-effective IoT networks that can support a wide range of devices and applications, fostering innovation and operational efficiencies across numerous sectors.
Key Stakeholders
- Manufactures and Vendors
- Network Operators
- Application Developers
- System Integrators (SIs)
- End-Users and Enteprises
- Standardization Bodies and Alliances
- Investment Firms
- LoRa and LoRaWAN IoT Alliances/Groups
Report Objectives
- To determine, segment, and forecast the LoRa and LoRaWAN IoT market by offering, technology, end use, and region in terms of value
- To forecast the size of the market segments with respect to 5 main regions: North America, Europe, Asia Pacific, Middle East & Africa, and Latin America
- To provide detailed information about the major factors (drivers, restraints, opportunities, and challenges) influencing the growth of the market
- To study the complete value chain and related industry segments and perform a value chain analysis of the market landscape
- To strategically analyze the macro and micro-markets with respect to individual growth trends, prospects, and contributions to the total market
- To analyze the industry trends, pricing data, patents, and innovations related to the market
- To analyze the opportunities for stakeholders by identifying the high-growth segments of the market
- To profile the key players in the market and comprehensively analyze their market share/ranking and core competencies
- To track and analyze competitive developments, such as mergers & acquisitions, product launches & developments, partnerships, agreements, collaborations, business expansions, and R&D activities
Available Customizations
With the given market data, MarketsandMarkets offers customizations as per the company’s specific needs. The following customization options are available for the report:
- Country-wise information
- Analysis for additional countries (up to five)
Company Information
- Detailed analysis and profiling of additional market players (up to 5)
Growth opportunities and latent adjacency in LoRa and LoRaWAN IoT Market