Integrated Visual Augmentation System Market Size, Trends, Growth Forecast

Integrated Visual Augmentation System Market by End-User (Air Force, Army, Navy), Product (Helmet Mounted Display, Night Vision Device), Technology (Augmented Reality, Virtual Reality, Mixed Reality), Application and Region - Global Forecast to 2029

Report Code: AS 9107 Aug, 2024, by marketsandmarkets.com

Update: 9/19/2024

Integrated Visual Augmentation System Market Size and Share

[265 Pages Report] The IVAS Market is valued at USD 1.0 Billion in 2024 and is projected to reach USD 1.7 Billion by 2029, at a CAGR of 11.1% from 2024 to 2029. The volume of aircrafts utilising the HMDs and NVDs in IVAS market is projected to grow from 520 (units) in 2024 to 1024 (units) by 2029. The market for IVAS has been estimated to account for a volume of 520 (units) of aircrafts utilizing the HMDs and NVDs in 2024 and is projected to reach 1024 (units) by 2029. The concept of IVAS integrates VR and AR technologies into a single system; this improves the level of situational awareness significantly for military personnel. IVAS is a combination of helmet-mounted displays (HMD), night vision devices (NVD), and AR/VR with other wearable technologies to develop a fully immersed interactive experience. The developed systems are ideal for uses in combat missions, simulations, and training exercises. Growing military budgets are fostering IVAS Industry development and procurement, as governments allocate more resources to advanced soldier technologies. IVAS bridges human and machine capabilities, enhancing visual tasks like depth perception and object identification. IVAS gives the user enhanced ways of interpreting and interacting with their environment by overlaying real-time data processing and display on the human eye, thus augmenting the natural capabilities of the human eye and fulfilling the traditional limitations of sight.

Integrated Visual Augmentation System Market

Integrated Visual Augmentation System Market

Integrated Visual Augmentation System Market Forecast to 2029

To know about the assumptions considered for the study, Request for Free Sample Report

Integrated Virtual Augmented System (IVAS) Market Trends

Driver: Need of Transformation in Traditional Military Capabilities for the New Era

In response to a new era of geopolitical uncertainty and a rapidly shifting national security landscape, nations worldwide are enhancing their military capabilities. This transformation, driven by evolving mission requirements across multidomain operations, is creating a demand for new tools and technologies, increasingly supplied by new entrants to the defense industry. National security agencies are now seeking technologies from firms beyond the traditional defense industrial base. This trend has manifested in three significant waves of defense tech start-ups over the past 20 years.

For decades, national security strategies focused primarily on asymmetric and transnational threats such as terrorism and cybercrime. However, the current global geopolitical climate has shifted focus towards peer and near-peer competition. National security strategies published since 2022 in countries like Germany, Japan, the United Kingdom, and the United States underscore this shift. These strategies emphasize the need for technologies that enhance resilience and efficacy, particularly those supporting new disaggregated and “joint all-domain” operational concepts. The surge in global defense budgets, driven by geopolitical uncertainty and shifting national security priorities, is significantly boosting the IVAS market. Countries are increasingly seeking advanced technologies from new entrants outside the traditional defense sector. Companies like SpaceX, Palantir, Anduril, and ShieldAI have demonstrated the potential of integrating commercially derived technologies into defense applications. This trend is supported by significant venture capital investments and government initiatives, such as the U.S. Defense Innovation Unit and NATO's €1 billion Innovation Fund. The demand for resilient, high-tech solutions is propelling the adoption of IVAS to enhance military operational capabilities.

Restraints: OST and Implementation Complexity

The development and deployment of Integrated Visual Augmentation Systems (IVAS) require significant financial investment. This includes costs for advanced hardware, software development, and system integration. The high price of cutting-edge technologies like AR, VR, and MR components contributes to the overall expense. Integrating IVAS with existing military systems is complex and time-consuming. Compatibility issues, ensuring seamless communication between new and old systems, and the need for specialized technical expertise add to the implementation hurdles. The complexity of customizing IVAS to meet specific operational needs further complicates the integration process. Complexity and interoperability issues.

Opportunities: Advanced Training Capabilities for Complex Battlefields

Modern military operations are increasingly complex, requiring sophisticated training and equipment to ensure soldier effectiveness and mission success. The integration of augmented visual systems, such as the Integrated Visual Augmentation System (IVAS), represents a transformative opportunity to address these challenges. IVAS leverages advanced technologies to enhance situational awareness, improve training outcomes, and increase overall battlefield efficiency. This detailed analysis explores the multifaceted benefits of IVAS and its potential to revolutionize defense capabilities. The U.S. Army's planned operational test and full-rate production decision for IVAS units by fiscal 2025 marks a strategic investment in advanced soldier-worn technology. This investment indicates a growing market for augmented reality systems that enhance situational awareness, lethality, and mission efficiency. In recent exercises, such as Project Convergence, the US Army has shown a number of different ways IVAS can be used on the battlefield, ranging from ingesting video and data from small Unmanned Aerial Systems to integrating with ground and air platform sensors to provide Soldiers the ability to see what the platform drivers, commanders and pilots see before dismounting into a hazardous situation.

Challenges: Governments Regulations and Standards

A key challenge facing the IVAS market in defense is government regulations and standards, which can act as significant restraints, particularly when compliance requirements are stringent or change rapidly. These regulatory challenges impact both manufacturers and the broader market. Manufacturers may face increased production costs and extended development timelines as they navigate these regulatory complexities. This can introduce uncertainties, especially when standards evolve, leading to difficulties in maintaining consistent compliance across different regions and affecting overall market growth.

Strict or changing regulations can hinder IVAS manufacturers' ability to bring new products to market efficiently. Navigating the compliance landscape is crucial, as adherence to regulatory standards affects manufacturing processes and market growth. Balancing innovation with compliance is essential for sustained market development. This highlights the need for industry stakeholders to engage with evolving regulatory frameworks to support IVAS advancements in defense.

Integrated Virtual Augmented System Market Ecosystem

Integrated  Virtual Augmented System Market by Ecosystem

Integrated Virtual Augmented System Market Segment Analysis

Based on the End User, Air Force Segment is Estimated to Account for the Largest Market Share During the Forecast Period

Based on the end-user, air force is projected to hold the largest market share in the global IVAS market. This dominance is fueled by several factors, including their strategic deployment capabilities, and versatility in various missions. The Air Force commands the highest market share in the Integrated Visual Augmentation System (IVAS) market due to its complex operational needs and significant investment in modernization. In an environment where the threats have increased with access denial, and technology leveled by use of commercial technologies, Air Forces need high security and safety communications to secure their national airspace and to have air dominance during operations. Such operations are increasingly joint operations, and more often in coalition. IVAS technologies like Helmet-Mounted Displays and Night Vision Devices enhance situational awareness and decision-making by integrating advanced AR/VR capabilities directly into pilots' visual fields. This integration is crucial for high-speed, dynamic air operations, making IVAS systems particularly valuable for training, navigation, and combat scenarios. Additionally, the Air Force's substantial funding for technological advancements supports widespread IVAS adoption across its diverse fleet, from drones to fighter jets, ensuring enhanced safety and operational efficiency.

Based on the Product, the Helmet Mounted Display Segment is Anticipated to Dominate the Market

Based product , the helmet mounted display segment holds the largest market share. Helmet-Mounted Displays (HMDs) equip pilots with enhanced situational awareness by projecting an improved image of the surroundings directly where they are looking. In military settings, these helmets also cue weapon systems to align with the pilot's head direction. Designed for durability, HMDs are built to resist ballistic impacts and are compatible with essential features like communication systems and night vision devices, ensuring comprehensive functionality in diverse operational environments. As HMD technology matures and production scales, costs are decreasing, making these devices more accessible across sectors. As these systems continue to evolve and integrate with other cutting-edge technologies like augmented reality, their adoption is likely to expand, further boosting their market growth in defense.

Integrated Virtual Augmented System Market Regional Analysis

The North America Market is Projected to Account Largest Share for the IVAS Market

In the global IVAS market, the North Ameria region is poised to claim the highest market share. The US and Canada have a robust defense industry with established players well-positioned for IVAS development and production.The U.S. Army's adoption of the Integrated Visual Augmentation System (IVAS) highlights a significant trend in the North American defense sector's use of augmented reality (AR) technologies. IVAS integrates advanced features such as next-generation night vision, navigation, and targeting into a single wearable device, marking a major technological advancement over traditional systems. This development not only boosts the effectiveness of individual soldiers but also enhances the operational capabilities of entire military units, demonstrating a transformative shift in how military operations are conducted. North America's strong military focus, established infrastructure, and focus on innovation position it for significant growth in the IVAS market within the military sector.

Integrated Visual Augmentation System Markett by Region

Integrated Visual Augmentation System Market by Region

To know about the assumptions considered for the study, download the pdf brochure

Integrated Visual Augmentation System Market Companies: Key Market Players

The Integrated Visual Augmentation System companies is dominated by a few globally established players such as:

They are the key manufacturers and solution providers that secured IVAS contracts in the last few years. Major focus was given to the contracts and new product development due to the changing requirements in defense and commercial industries.

Get online access to the report on the World's First Market Intelligence Cloud

  • Easy to Download Historical Data & Forecast Numbers
  • Company Analysis Dashboard for high growth potential opportunities
  • Research Analyst Access for customization & queries
  • Competitor Analysis with Interactive dashboard
  • Latest News, Updates & Trend analysis
Request Sample

Scope of the Report

Report Metric

Details

Estimated Market Size

USD 1.0 Billion in 2024

Projected Market Size

USD 1.7 Billion by 2029

Growth Rate

11.1%

Market Size Available for Years

2020–2029

Base Year Considered

2023

Forecast Period

2024-2029

Forecast Units

Value (USD Million/Billion)

Segments Covered

By End-User, Product, Application, Technology, and Region

Geographies Covered

North America, Europe, Asia Pacific, Middle East, and the Rest of the world

Companies Covered

Lockheed Martin Corporation (US), Elbit Systems, Ltd. (Israel), RTX (US), BAE Systems (UK), and Microsoft  (US) are some of the major players in the Integrated Virtual Augmented System (IVAS) market.

Integrated Visual Augmentation System Market Highlights

The study categorizes the Integrated Virtual Augmented System (IVAS) market based on end-user, product, application, technologyand Region.

Segment

Subsegment

By End-User

  • Air Force
  • Army
  • Navy

By Product

  • Helmet Mounted Display
  • Night Vision Device

By Application

  • Combat Missions
  • Simulation & Training

By Technology

  • Augmented Reality
  • Virtual Reality
  • Mixed reality

By Region

  • North America
  • Europe
  • Asia Pacific
  • Middle East
  • Rest of the World

Recent Developments

  • In September 2023,  Microsoft :- The US Army has awarded a contract to Microsoft for advanced mixed reality goggles, following positive feedback from soldiers testing updated prototypes. The improved design aims to address issues like nausea and discomfort, enhancing usability in combat situations. The contract value is USD 165 million. This includes USD 40 million allocated by Congress to improve the system, and an additional USD 125 million awarded by the Army to Microsoft for continued development.
  • In August 2023,  Lockheed Martin Corporation:- The US Navy's Naval Air Systems Command awarded Lockheed Martin a USD 347.4 million contract for a specialized helmet for F-35 fighter jet pilots. Produced in collaboration with Collins Aerospace and Elbit Systems of America, the advanced helmet combines a standard HUD, helmet-mounted display, and night vision, providing real-time feed from six infrared cameras around the jet to enable pilots to see in all directions, including through the plane's structure.
  • In September 2022, Elbit Systems, Ltd.:- Elbit Systems of America LLC, a subsidiary of Elbit Systems Ltd., has been awarded a USD 10 million contract by SOSSEC, Inc (US). The contract is for phase II development of an Advanced Low Light Level Sensor (ALLLS) to support the U.S. Army's Integrated Visual Augmentation System (IVAS) 2.0 for soldiers. The contract spans until 2025, and the work will be carried out in Roanoke, Virginia.

Frequently Asked Questions (FAQs) Addressed by the Report:

To speak to our analyst for a discussion on the above findings, click Speak to Analyst

TABLE OF CONTENTS
 
1 INTRODUCTION (Page No. - 27)
    1.1 STUDY OBJECTIVES 
    1.2 MARKET DEFINITION 
    1.3 MARKET SCOPE 
           1.3.1 MARKETS COVERED
           1.3.2 YEARS CONSIDERED
    1.4 CURRENCY CONSIDERED 
    1.5 INCLUSIONS AND EXCLUSIONS 
    1.6 STAKEHOLDERS 
 
2 RESEARCH METHODOLOGY (Page No. - 31)
    2.1 RESEARCH DATA 
           2.1.1 SECONDARY DATA
                    2.1.1.1 Key data from secondary sources
           2.1.2 PRIMARY DATA
                    2.1.2.1 Key data from primary sources
                    2.1.2.2 Breakdown of primary interviews
    2.2 FACTOR ANALYSIS 
           2.2.1 INTRODUCTION
           2.2.2 DEMAND-SIDE INDICATORS
                    2.2.2.1 Increasing focus on soldier modernization
                    2.2.2.2 Rise in defense budgets of emerging economies
           2.2.3 SUPPLY-SIDE ANALYSIS
                    2.2.3.1 Advancements in AR/VR technologies
    2.3 MARKET SIZE ESTIMATION 
           2.3.1 BOTTOM-UP APPROACH
           2.3.2 TOP-DOWN APPROACH
    2.4 MARKET BREAKDOWN AND DATA TRIANGULATION 
    2.5 GROWTH RATE ASSUMPTIONS 
    2.6 RESEARCH ASSUMPTIONS 
    2.7 RISK ASSESSMENT 
    2.8 RESEARCH LIMITATIONS 
 
3 EXECUTIVE SUMMARY (Page No. - 41)
 
4 PREMIUM INSIGHTS (Page No. - 45)
    4.1 ATTRACTIVE OPPORTUNITIES FOR PLAYERS IN INTEGRATED VISUAL AUGMENTATION SYSTEM MARKET 
    4.2 INTEGRATED VISUAL AUGMENTATION SYSTEM MARKET, BY PRODUCT 
    4.3 INTEGRATED VISUAL AUGMENTATION SYSTEM MARKET, BY APPLICATION 
    4.4 INTEGRATED VISUAL AUGMENTATION SYSTEM MARKET, BY TECHNOLOGY 
    4.5 INTEGRATED VISUAL AUGMENTATION SYSTEM MARKET, BY END USER 
    4.6 INTEGRATED VISUAL AUGMENTATION SYSTEM MARKET, BY COUNTRY 
 
5 MARKET OVERVIEW (Page No. - 48)
    5.1 INTRODUCTION 
    5.2 MARKET DYNAMICS 
           5.2.1 DRIVERS
                    5.2.1.1 Increasing adoption of AR/VR in military simulation and training and air forces
                    5.2.1.2 Need for enhancement of military capabilities
                    5.2.1.3 Surge in defense budgets of major countries
                    5.2.1.4 Growing investments by key players for development of helmet-mounted displays
           5.2.2 RESTRAINTS
                    5.2.2.1 Lack of helmet-mounted design standardization
                    5.2.2.2 Cost and implementation complexities
                    5.2.2.3 Data security concerns
           5.2.3 OPPORTUNITIES
                    5.2.3.1 Reduced cognitive load
                    5.2.3.2 Advanced training capabilities for complex battlefields
           5.2.4 CHALLENGES
                    5.2.4.1 Government regulations and standards
                    5.2.4.2 Maintenance and support
    5.3 TRENDS/DISRUPTIONS IMPACTING CUSTOMER BUSINESS 
    5.4 INDICATIVE PRICING ANALYSIS 
           5.4.1 INDICATIVE PRICING ANALYSIS, BY PRODUCT AND REGION
    5.5 OPERATIONAL DATA 
    5.6 ECOSYSTEM ANALYSIS 
           5.6.1 PROMINENT COMPANIES
           5.6.2 PRIVATE AND SMALL ENTERPRISES
           5.6.3 END USERS
    5.7 VALUE CHAIN ANALYSIS 
    5.8 USE CASE ANALYSIS 
           5.8.1 INTEGRATED VISUAL AUGMENTATION SYSTEM FOR ENHANCING SOLDIER TRAINING AND MISSION EXECUTION FOR US ARMY
           5.8.2 ENHANCED NIGHT VISION GOGGLE-BINOCULAR (ENVG-B) FOR US ARMY
           5.8.3 LIGHTWEIGHT HELMET-MOUNTED DISPLAY SYSTEMS FOR INDIAN AIR FORCE
           5.8.4 INTEGRATED VISUAL AUGMENTATION SYSTEMS FOR US NAVY
    5.9 TRADE DATA ANALYSIS 
    5.10 TECHNOLOGY ANALYSIS 
           5.10.1 KEY TECHNOLOGY
                    5.10.1.1 Tactical augmented reality
                    5.10.1.2 Virtual reality
           5.10.2 COMPLEMENTARY TECHNOLOGY
                    5.10.2.1 Haptic technology
                    5.10.2.2 Biometric sensors
           5.10.3 ADJACENT TECHNOLOGY
                    5.10.3.1 Natural language processing
    5.11 KEY STAKEHOLDERS AND BUYING CRITERIA 
           5.11.1 KEY STAKEHOLDERS IN BUYING PROCESS
           5.11.2 BUYING CRITERIA
    5.12 TECHNOLOGY ROADMAP 
    5.13 BILL OF MATERIALS 
    5.14 TOTAL COST OF OWNERSHIP 
    5.15 BUSINESS MODEL 
    5.16 REGULATORY LANDSCAPE 
    5.17 KEY CONFERENCES AND EVENTS 
    5.18 INVESTMENT AND FUNDING SCENARIO 
    5.19 IMPACT OF GENERATIVE AI ON INTEGRATED VISUAL AUGMENTATION SYSTEM MARKET 
           5.19.1 INTRODUCTION
           5.19.2 ADOPTION OF GENERATIVE AI IN MILITARY, BY TOP COUNTRIES
           5.19.3 IMPACT OF GENERATIVE AI ON DEFENSE USE CASES
           5.19.4 IMPACT OF GENERATIVE AI ON INTEGRATED VISUAL AUGMENTATION SYSTEM MARKET
 
6 INDUSTRY TRENDS (Page No. - 90)
    6.1 INTRODUCTION 
    6.2 TECHNOLOGY TRENDS 
           6.2.1 CLOUD-BASED PROCESSING
           6.2.2 SENSOR FUSION
           6.2.3 INTEROPERABILITY
           6.2.4 INTUITIVE INTERFACES
    6.3 IMPACT OF MEGATRENDS 
           6.3.1 ARTIFICIAL INTELLIGENCE AND MACHINE LEARNING INTEGRATION
           6.3.2 INTERNET OF THINGS
           6.3.3 SHIFT IN GLOBAL ECONOMIC POWER
    6.4 SUPPLY CHAIN ANALYSIS 
    6.5 PATENT ANALYSIS 
 
7 INTEGRATED VISUAL AUGMENTATION SYSTEM MARKET, BY PRODUCT (Page No. - 97)
    7.1 INTRODUCTION 
    7.2 HELMET-MOUNTED DISPLAY 
           7.2.1 INCREASING USE TO ENHANCE SITUATIONAL AWARENESS IN COMBAT OPERATIONS TO DRIVE MARKET
    7.3 NIGHT VISION DEVICE 
           7.3.1 GROWING USE IN ENHANCING OPERATIONAL EFFECTIVENESS TO DRIVE MARKET
 
8 INTEGRATED VISUAL AUGMENTATION SYSTEM MARKET, BY TECHNOLOGY (Page No. - 101)
    8.1 INTRODUCTION 
    8.2 AUGMENTED REALITY 
           8.2.1 INCREASING APPLICATIONS IN AEROSPACE & DEFENSE, GAMING, EDUCATION, AND NAVIGATION TO DRIVE MARKET
           8.2.2 MARKER-BASED AUGMENTED REALITY
                    8.2.2.1 Active marker
                    8.2.2.2 Passive marker
           8.2.3 MARKERLESS AUGMENTED REALITY
                    8.2.3.1 Model-based tracking
                    8.2.3.2 Image processing-based tracking
           8.2.4 ANCHOR-BASED AUGMENTED REALITY
    8.3 VIRTUAL REALITY TECHNOLOGY 
           8.3.1 ENHANCES TRAINING REALISM, IMPROVES OPERATIONAL PLANNING, AND FACILITATES COST-EFFECTIVE SIMULATIONS
           8.3.2 NON-IMMERSIVE TECHNOLOGY
           8.3.3 SEMI-IMMERSIVE AND FULLY IMMERSIVE TECHNOLOGY
    8.4 MIXED REALITY 
           8.4.1 CAPABILITY TO INTEGRATE VIRTUAL AND AUGMENTED ELEMENTS SEAMLESSLY TO DRIVE MARKET
 
9 INTEGRATED VISUAL AUGMENTATION SYSTEM MARKET, BY APPLICATION (Page No. - 107)
    9.1 INTRODUCTION 
    9.2 COMBAT MISSIONS 
           9.2.1 MULTI-MISSION CAPABILITY TO DRIVE MARKET
    9.3 SIMULATION & TRAINING 
           9.3.1 GROWING DEMAND FOR ENHANCED SITUATIONAL AWARENESS AND OPERATIONAL READINESS TO DRIVE MARKET
 
10 INTEGRATED VISUAL AUGMENTATION SYSTEM MARKET, BY END USER (Page No. - 111)
     10.1 INTRODUCTION 
     10.2 ARMY 
             10.2.1 DEVELOPMENT AND PROCUREMENT OF NEXT-GENERATION IVAS TO DRIVE MARKET
     10.3 AIR FORCE 
             10.3.1 DEVELOPMENT OF ADVANCED LIGHTWEIGHT IVAS TO DRIVE MARKET
     10.4 NAVY 
             10.4.1 ADOPTION OF AUTONOMOUS MOBILITY TECHNOLOGY TO DRIVE MARKET
 
11 REGIONAL ANALYSIS (Page No. - 115)
     11.1 INTRODUCTION 
     11.2 NORTH AMERICA 
             11.2.1 PESTLE ANALYSIS
             11.2.2 US
                        11.2.2.1 Advancements in situational awareness capabilities of US Army to drive market
             11.2.3 CANADA
                        11.2.3.1 Increasing investment in virtual simulation and training technologies to drive market
     11.3 ASIA PACIFIC 
             11.3.1 PESTLE ANALYSIS
             11.3.2 INDIA
                        11.3.2.1 Adoption of AR/VR for improved combat capabilities to drive market
             11.3.3 JAPAN
                        11.3.3.1 Continuous efforts to strengthen combat capabilities to drive market
             11.3.4 SOUTH KOREA
                        11.3.4.1 Modernization efforts in defense sector to drive market
             11.3.5 AUSTRALIA
                        11.3.5.1 Incorporation of IVAS in military training programs to drive market
             11.3.6 REST OF ASIA PACIFIC
     11.4 EUROPE 
             11.4.1 PESTLE ANALYSIS
             11.4.2 UK
                        11.4.2.1 High military spending to drive market
             11.4.3 FRANCE
                        11.4.3.1 Commitment to advancing military technology to drive market
             11.4.4 GERMANY
                        11.4.4.1 Integration of virtual and mixed realities to modernize defense training to drive market
             11.4.5 ITALY
                        11.4.5.1 Emphasis on live-virtual-constructive training to drive market
             11.4.6 REST OF EUROPE
     11.5 MIDDLE EAST 
             11.5.1 PESTLE ANALYSIS
             11.5.2 GCC COUNTRIES
                        11.5.2.1 Saudi Arabia
                                     11.5.2.1.1 Strategic partnerships for integrating AR and VR in training and simulation to drive market
                        11.5.2.2 UAE
                                     11.5.2.2.1 Increasing focus on use of advanced technologies for defense training to drive market
             11.5.3 ISRAEL
                        11.5.3.1 Adoption of AR for operational efficiency to drive market
             11.5.4 TÜRKIYE
                        11.5.4.1 Innovations related to helmet-mounted displays to drive market
     11.6 REST OF THE WORLD 
             11.6.1 PESTLE ANALYSIS
             11.6.2 AFRICA
                        11.6.2.1 Focus on enhancing soldier capabilities to drive market
             11.6.3 LATIN AMERICA
                        11.6.3.1 Increasing focus on AR/VR in defense sector to drive market
 
12 COMPETITIVE LANDSCAPE (Page No. - 184)
     12.1 INTRODUCTION 
     12.2 KEY PLAYER STRATEGIES/RIGHT TO WIN 
     12.3 MARKET SHARE ANALYSIS 
             12.3.1 MARKET RANKING ANALYSIS
     12.4 REVENUE ANALYSIS 
     12.5 BRAND COMPARISON 
     12.6 COMPANY EVALUATION MATRIX, 2023 
             12.6.1 STARS
             12.6.2 EMERGING LEADERS
             12.6.3 PERVASIVE PLAYERS
             12.6.4 PARTICIPANTS
     12.7 COMPANY FOOTPRINT, 2023 
     12.8 COMPANY VALUATION AND FINANCIAL METRICS 
     12.9 STARTUP/SME EVALUATION MATRIX, 2023 
             12.9.1 PROGRESSIVE COMPANIES
             12.9.2 RESPONSIVE COMPANIES
             12.9.3 DYNAMIC COMPANIES
             12.9.4 STARTING BLOCKS
             12.9.5 COMPETITIVE BENCHMARKING: STARTUPS/SMES, 2023
     12.10 COMPETITIVE SCENARIOS AND TRENDS 
     12.11 MARKET EVALUATION FRAMEWORK 
             12.11.1 PRODUCT LAUNCHES/DEVELOPMENTS
             12.11.2 DEALS
             12.11.3 OTHER DEVELOPMENTS
 
13 COMPANY PROFILES (Page No. - 208)
     13.1 KEY PLAYERS 
             13.1.1 LOCKHEED MARTIN CORPORATION
                        13.1.1.1 Business overview
                        13.1.1.2 Products/Solutions/Services offered
                        13.1.1.3 Recent developments
                                     13.1.1.3.1 Product launches
                                     13.1.1.3.2 Deals
                                     13.1.1.3.3 Other developments
                        13.1.1.4 MnM view
                                     13.1.1.4.1 Right to win
                                     13.1.1.4.2 Strategic choices
                                     13.1.1.4.3 Weaknesses and competitive threats
             13.1.2 MICROSOFT
                        13.1.2.1 Business overview
                        13.1.2.2 Products/Solutions/Services offered
                        13.1.2.3 Recent developments
                                     13.1.2.3.1 Other developments
                        13.1.2.4 MnM view
                                     13.1.2.4.1 Right to win
                                     13.1.2.4.2 Strategic choices
                                     13.1.2.4.3 Weaknesses and competitive threats
             13.1.3 ELBIT SYSTEMS LTD.
                        13.1.3.1 Business overview
                        13.1.3.2 Products/Solutions/Services offered
                        13.1.3.3 Recent developments
                                     13.1.3.3.1 Product launches
                                     13.1.3.3.2 Other developments
                        13.1.3.4 MnM view
                                     13.1.3.4.1 Right to win
                                     13.1.3.4.2 Strategic choices
                                     13.1.3.4.3 Weaknesses and competitive threats
             13.1.4 RTX
                        13.1.4.1 Business overview
                        13.1.4.2 Products/Solutions/Services offered
                        13.1.4.3 Recent developments
                                     13.1.4.3.1 Other developments
                        13.1.4.4 MnM view
                                     13.1.4.4.1 Right to win
                                     13.1.4.4.2 Strategic choices
                                     13.1.4.4.3 Weaknesses and competitive threats
             13.1.5 BAE SYSTEMS
                        13.1.5.1 Business overview
                        13.1.5.2 Products/Solutions/Services offered
                        13.1.5.3 Recent developments
                                     13.1.5.3.1 Deals
                        13.1.5.4 MnM view
                                     13.1.5.4.1 Right to win
                                     13.1.5.4.2 Strategic choices
                                     13.1.5.4.3 Weaknesses and competitive threats
             13.1.6 VIRTRA, INC.
                        13.1.6.1 Business overview
                        13.1.6.2 Products/Solutions/Services offered
                        13.1.6.3 Recent developments
                                     13.1.6.3.1 Product launches
                                     13.1.6.3.2 Other developments
             13.1.7 HANWHA SYSTEMS CO., LTD.
                        13.1.7.1 Business overview
                        13.1.7.2 Products/Solutions/Services offered
             13.1.8 HONEYWELL INTERNATIONAL INC.
                        13.1.8.1 Business overview
                        13.1.8.2 Products/Solutions/Services offered
                        13.1.8.3 Recent developments
                                     13.1.8.3.1 Product launches
             13.1.9 THALES
                        13.1.9.1 Business overview
                        13.1.9.2 Products/Solutions/Services offered
             13.1.10 VRGINEERS, INC.
                        13.1.10.1 Business overview
                        13.1.10.2 Products/Solutions/Services offered
                        13.1.10.3 Recent developments
                                     13.1.10.3.1 Product launches
             13.1.11 INVERIS TRAINING SOLUTIONS
                        13.1.11.1 Business overview
                        13.1.11.2 Products/Solutions/Services offered
                        13.1.11.3 Recent developments
                                     13.1.11.3.1 Product launches
             13.1.12 HUNTINGTON INGALLS INDUSTRIES INC
                        13.1.12.1 Business overview
                        13.1.12.2 Products/Solutions/Services offered
             13.1.13 VUZIX
                        13.1.13.1 Business overview
                        13.1.13.2 Products/Solutions/Services offered
                        13.1.13.3 Recent developments
                                     13.1.13.3.1 Other developments
             13.1.14 OPTEX SYSTEMS, INC.
                        13.1.14.1 Business overview
                        13.1.14.2 Products/Solutions/Services offered
                        13.1.14.3 Recent developments
                                     13.1.14.3.1 Other developments
     13.2 OTHER PLAYERS 
             13.2.1 AJNALENS
             13.2.2 VARJO
             13.2.3 RED SIX AEROSPACE, INC.
             13.2.4 INFIVR
             13.2.5 DESIGN INTERACTIVE INC.
             13.2.6 SIX15 TECHNOLOGIES
             13.2.7 THERMOTEKNIX SYSTEMS LTD
             13.2.8 STEELE INDUSTRIES INC.
             13.2.9 OPTINVENT
             13.2.10 THE DISTI CORPORATION
             13.2.11 DIGITAL AGENTS INTERACTIVE
 
14 APPENDIX (Page No. - 256)
     14.1 DISCUSSION GUIDE 
     14.2 ANNEXURE A: DEFENSE PROGRAM MAPPING
     14.3 ANNEXURE B: OTHER MAPPED COMPANIES 
     14.4 KNOWLEDGESTORE: MARKETSANDMARKETS’ SUBSCRIPTION PORTAL 
     14.5 CUSTOMIZATION OPTIONS 
     14.6 RELATED REPORTS 
     14.7 AUTHOR DETAILS 
 
LIST OF TABLES (293 TABLES)
 
TABLE 1 USD EXCHANGE RATES
TABLE 2 INCLUSIONS AND EXCLUSIONS
TABLE 3 DEFENSE EXPENDITURE OF MAJOR COUNTRIES, 2020–2023 (USD BILLION)
TABLE 4 INDICATIVE PRICING, BY PRODUCT (USD MILLION)
TABLE 5 INDICATIVE PRICING, BY REGION (USD MILLION)
TABLE 6 OPERATIONAL DATA: NUMBER OF AIRCRAFT ASSOCIATED WITH INTEGRATED VISUAL AUGMENTATION SYSTEM MARKET, BY COUNTRY, 2023
TABLE 7 ROLE OF COMPANIES IN ECOSYSTEM
TABLE 8 PRODUCT HARMONIZED SYSTEM CODE (8524): COUNTRY-WISE EXPORTS, 2021–2022 (USD THOUSAND)
TABLE 9 PRODUCT HARMONIZED SYSTEM CODE (8524): COUNTRY-WISE IMPORTS, 2021–2022 (USD THOUSAND)
TABLE 10 INFLUENCE OF STAKEHOLDERS ON BUYING PROCESS FOR INTEGRATED VISUAL AUGMENTATION SYSTEMS, BY END USER (%)
TABLE 11 KEY BUYING CRITERIA FOR INTEGRATED VISUAL AUGMENTATION SYSTEMS, BY END USER
TABLE 12 BILL OF MATERIALS: F35-GEN III HELMET-MOUNTED DISPLAY SYSTEMS
TABLE 13 BILL OF MATERIALS: ENHANCED NIGHT VISION GOGGLE-BINOCULARS
TABLE 14 INTEGRATED VISUAL AUGMENTATION SYSTEM MARKET: TOTAL COST OF OWNERSHIP
TABLE 15 NORTH AMERICA: REGULATORY BODIES, GOVERNMENT AGENCIES, AND OTHER ORGANIZATIONS
TABLE 16 EUROPE: REGULATORY BODIES, GOVERNMENT AGENCIES, AND OTHER ORGANIZATIONS
TABLE 17 ASIA PACIFIC: REGULATORY BODIES, GOVERNMENT AGENCIES, AND OTHER ORGANIZATIONS
TABLE 18 MIDDLE EAST & AFRICA: REGULATORY BODIES, GOVERNMENT AGENCIES, AND OTHER ORGANIZATIONS
TABLE 19 LATIN AMERICA: REGULATORY BODIES, GOVERNMENT AGENCIES, AND OTHER ORGANIZATIONS
TABLE 20 KEY CONFERENCES AND EVENTS, 2024
TABLE 21 VENTURE CAPITAL AND DEALS, 2019–2022
TABLE 22 INNOVATIONS AND PATENT REGISTRATIONS, 2020–2024
TABLE 23 MARKET, BY PRODUCT, 2020–2023 (USD MILLION)
TABLE 24 MARKET, BY PRODUCT, 2024–2029 (USD MILLION)
TABLE 25 MARKET, BY TECHNOLOGY, 2020–2023 (USD MILLION)
TABLE 26 MARKET, BY TECHNOLOGY, 2024–2029 (USD MILLION)
TABLE 27 MARKET, BY APPLICATION, 2020–2023 (USD MILLION)
TABLE 28 MARKET, BY APPLICATION, 2024–2029 (USD MILLION)
TABLE 29 MARKET, BY END USER, 2020–2023 (USD MILLION)
TABLE 30 MARKET, BY END USER, 2024–2029 (USD MILLION)
TABLE 31 MARKET, BY REGION, 2020–2023 (USD MILLION)
TABLE 32 MARKET, BY REGION, 2024–2029 (USD MILLION)
TABLE 33 NORTH AMERICA: IVAS MARKET, BY COUNTRY, 2020–2023 (USD MILLION)
TABLE 34 NORTH AMERICA: IVAS MARKET, BY COUNTRY, 2024–2029 (USD MILLION)
TABLE 35 NORTH AMERICA: IVAS MARKET, BY END USER, 2020–2023 (USD MILLION)
TABLE 36 NORTH AMERICA: IVAS MARKET, BY END USER, 2024–2029 (USD MILLION)
TABLE 37 NORTH AMERICA: IVAS MARKET, BY PRODUCT, 2020–2023 (USD MILLION)
TABLE 38 NORTH AMERICA: IVAS MARKET, BY PRODUCT, 2024–2029 (USD MILLION)
TABLE 39 NORTH AMERICA: IVAS MARKET, BY APPLICATION, 2020–2023 (USD MILLION)
TABLE 40 NORTH AMERICA: IVAS MARKET, BY APPLICATION, 2024–2029 (USD MILLION)
TABLE 41 NORTH AMERICA: IVAS MARKET, BY TECHNOLOGY, 2020–2023 (USD MILLION)
TABLE 42 NORTH AMERICA: IVAS MARKET, BY TECHNOLOGY, 2024–2029 (USD MILLION)
TABLE 43 US: IVAS MARKET, BY END USER, 2020–2023 (USD MILLION)
TABLE 44 US: IVAS MARKET, BY END USER, 2024–2029 (USD MILLION)
TABLE 45 US: IVAS MARKET, BY PRODUCT, 2020–2023 (USD MILLION)
TABLE 46 US: IVAS MARKET, BY PRODUCT, 2024–2029 (USD MILLION)
TABLE 47 US: IVAS MARKET, BY APPLICATION, 2020–2023 (USD MILLION)
TABLE 48 US: IVAS MARKET, BY APPLICATION, 2024–2029 (USD MILLION)
TABLE 49 US: IVAS MARKET, BY TECHNOLOGY, 2020–2023 (USD MILLION)
TABLE 50 US: IVAS MARKET, BY TECHNOLOGY, 2024–2029 (USD MILLION)
TABLE 51 CANADA: IVAS MARKET, BY END USER, 2020–2023 (USD MILLION)
TABLE 52 CANADA: IVAS MARKET, BY END USER, 2024–2029 (USD MILLION)
TABLE 53 CANADA: IVAS MARKET, BY PRODUCT, 2020–2023 (USD MILLION)
TABLE 54 CANADA: IVAS MARKET, BY PRODUCT, 2024–2029 (USD MILLION)
TABLE 55 CANADA: IVAS MARKET, BY APPLICATION, 2020–2023 (USD MILLION)
TABLE 56 CANADA: IVAS MARKET, BY APPLICATION, 2024–2029 (USD MILLION)
TABLE 57 CANADA: IVAS MARKET, BY TECHNOLOGY, 2020–2023 (USD MILLION)
TABLE 58 CANADA: IVAS MARKET, BY TECHNOLOGY, 2024–2029 (USD MILLION)
TABLE 59 ASIA PACIFIC: IVAS MARKET, BY COUNTRY, 2020–2023 (USD MILLION)
TABLE 60 ASIA PACIFIC: IVAS MARKET, BY COUNTRY, 2024–2029 (USD MILLION)
TABLE 61 ASIA PACIFIC: IVAS MARKET, BY END USER, 2020–2023 (USD MILLION)
TABLE 62 ASIA PACIFIC: IVAS MARKET, BY END USER, 2024–2029 (USD MILLION)
TABLE 63 ASIA PACIFIC: IVAS MARKET, BY PRODUCT, 2020–2023 (USD MILLION)
TABLE 64 ASIA PACIFIC: IVAS MARKET, BY PRODUCT, 2024–2029 (USD MILLION)
TABLE 65 ASIA PACIFIC: IVAS MARKET, BY APPLICATION, 2020–2023 (USD MILLION)
TABLE 66 ASIA PACIFIC: IVAS MARKET, BY APPLICATION, 2024–2029 (USD MILLION)
TABLE 67 ASIA PACIFIC: IVAS MARKET, BY TECHNOLOGY, 2020–2023 (USD MILLION)
TABLE 68 ASIA PACIFIC: IVAS MARKET, BY TECHNOLOGY, 2024–2029 (USD MILLION)
TABLE 69 INDIA: IVAS MARKET, BY END USER, 2020–2023 (USD MILLION)
TABLE 70 INDIA: IVAS MARKET, BY END USER, 2024–2029 (USD MILLION)
TABLE 71 INDIA: IVAS MARKET, BY PRODUCT, 2020–2023 (USD MILLION)
TABLE 72 INDIA: IVAS MARKET, BY PRODUCT, 2024–2029 (USD MILLION)
TABLE 73 INDIA: IVAS MARKET, BY APPLICATION, 2020–2023 (USD MILLION)
TABLE 74 INDIA: IVAS MARKET, BY APPLICATION, 2024–2029 (USD MILLION)
TABLE 75 INDIA: IVAS MARKET, BY TECHNOLOGY, 2020–2023 (USD MILLION)
TABLE 76 INDIA: IVAS MARKET, BY TECHNOLOGY, 2024–2029 (USD MILLION)
TABLE 77 JAPAN: IVAS MARKET, BY END USER, 2020–2023 (USD MILLION)
TABLE 78 JAPAN: IVAS MARKET, BY END USER, 2024–2029 (USD MILLION)
TABLE 79 JAPAN: IVAS MARKET, BY PRODUCT, 2020–2023 (USD MILLION)
TABLE 80 JAPAN: IVAS MARKET, BY PRODUCT, 2024–2029 (USD MILLION)
TABLE 81 JAPAN: IVAS MARKET, BY APPLICATION, 2020–2023 (USD MILLION)
TABLE 82 JAPAN: IVAS MARKET, BY APPLICATION, 2024–2029 (USD MILLION)
TABLE 83 JAPAN: IVAS MARKET, BY TECHNOLOGY, 2020–2023 (USD MILLION)
TABLE 84 JAPAN: IVAS MARKET, BY TECHNOLOGY, 2024–2029 (USD MILLION)
TABLE 85 SOUTH KOREA: IVAS MARKET, BY END USER, 2020–2023 (USD MILLION)
TABLE 86 SOUTH KOREA: IVAS MARKET, BY END USER, 2024–2029 (USD MILLION)
TABLE 87 SOUTH KOREA: IVAS MARKET, BY PRODUCT, 2020–2023 (USD MILLION)
TABLE 88 SOUTH KOREA: IVAS MARKET, BY PRODUCT, 2024–2029 (USD MILLION)
TABLE 89 SOUTH KOREA: IVAS MARKET, BY APPLICATION, 2020–2023 (USD MILLION)
TABLE 90 SOUTH KOREA: IVAS MARKET, BY APPLICATION, 2024–2029 (USD MILLION)
TABLE 91 SOUTH KOREA: IVAS MARKET, BY TECHNOLOGY, 2020–2023 (USD MILLION)
TABLE 92 SOUTH KOREA: IVAS MARKET, BY TECHNOLOGY, 2024–2029 (USD MILLION)
TABLE 93 AUSTRALIA: IVAS MARKET, BY END USER, 2020–2023 (USD MILLION)
TABLE 94 AUSTRALIA: IVAS MARKET, BY END USER, 2024–2029 (USD MILLION)
TABLE 95 AUSTRALIA: IVAS MARKET, BY PRODUCT, 2020–2023 (USD MILLION)
TABLE 96 AUSTRALIA: IVAS MARKET, BY PRODUCT, 2024–2029 (USD MILLION)
TABLE 97 AUSTRALIA: IVAS MARKET, BY APPLICATION, 2020–2023 (USD MILLION)
TABLE 98 AUSTRALIA: IVAS MARKET, BY APPLICATION, 2024–2029 (USD MILLION)
TABLE 99 AUSTRALIA: IVAS MARKET, BY TECHNOLOGY, 2020–2023 (USD MILLION)
TABLE 100 AUSTRALIA: IVAS MARKET, BY TECHNOLOGY, 2024–2029 (USD MILLION)
TABLE 101 REST OF ASIA PACIFIC: IVAS MARKET, BY END USER, 2020–2023 (USD MILLION)
TABLE 102 REST OF ASIA PACIFIC: IVAS MARKET, BY END USER, 2024–2029 (USD MILLION)
TABLE 103 REST OF ASIA PACIFIC: IVAS MARKET, BY PRODUCT, 2020–2023 (USD MILLION)
TABLE 104 REST OF ASIA PACIFIC: IVAS MARKET, BY PRODUCT, 2024–2029 (USD MILLION)
TABLE 105 REST OF ASIA PACIFIC: IVAS MARKET, BY APPLICATION, 2020–2023 (USD MILLION)
TABLE 106 REST OF ASIA PACIFIC: IVAS MARKET, BY APPLICATION, 2024–2029 (USD MILLION)
TABLE 107 REST OF ASIA PACIFIC: IVAS MARKET, BY TECHNOLOGY, 2020–2023 (USD MILLION)
TABLE 108 REST OF ASIA PACIFIC: IVAS MARKET, BY TECHNOLOGY, 2024–2029 (USD MILLION)
TABLE 109 EUROPE: IVAS MARKET, BY COUNTRY, 2020–2023 (USD MILLION)
TABLE 110 EUROPE: IVAS MARKET, BY COUNTRY, 2024–2029 (USD MILLION)
TABLE 111 EUROPE: IVAS MARKET, BY END USER, 2020–2023 (USD MILLION)
TABLE 112 EUROPE: IVAS MARKET, BY END USER, 2024–2029 (USD MILLION)
TABLE 113 EUROPE: IVAS MARKET, BY PRODUCT, 2020–2023 (USD MILLION)
TABLE 114 EUROPE: IVAS MARKET, BY PRODUCT, 2024–2029 (USD MILLION)
TABLE 115 EUROPE: IVAS MARKET, BY APPLICATION, 2020–2023 (USD MILLION)
TABLE 116 EUROPE: IVAS MARKET, BY APPLICATION, 2024–2029 (USD MILLION)
TABLE 117 EUROPE: IVAS MARKET, BY TECHNOLOGY, 2020–2023 (USD MILLION)
TABLE 118 EUROPE: IVAS MARKET, BY TECHNOLOGY, 2024–2029 (USD MILLION)
TABLE 119 UK: IVAS MARKET, BY END USER, 2020–2023 (USD MILLION)
TABLE 120 UK: IVAS MARKET, BY END USER, 2024–2029 (USD MILLION)
TABLE 121 UK: IVAS MARKET, BY PRODUCT, 2020–2023 (USD MILLION)
TABLE 122 UK: IVAS MARKET, BY PRODUCT, 2024–2029 (USD MILLION)
TABLE 123 UK: IVAS MARKET, BY APPLICATION, 2020–2023 (USD MILLION)
TABLE 124 UK: IVAS MARKET, BY APPLICATION, 2024–2029 (USD MILLION)
TABLE 125 UK: IVAS MARKET, BY TECHNOLOGY, 2020–2023 (USD MILLION)
TABLE 126 UK: IVAS MARKET, BY TECHNOLOGY, 2024–2029 (USD MILLION)
TABLE 127 FRANCE: IVAS MARKET, BY END USER, 2020–2023 (USD MILLION)
TABLE 128 FRANCE: IVAS MARKET, BY END USER, 2024–2029 (USD MILLION)
TABLE 129 FRANCE: IVAS MARKET, BY PRODUCT, 2020–2023 (USD MILLION)
TABLE 130 FRANCE: IVAS MARKET, BY PRODUCT, 2024–2029 (USD MILLION)
TABLE 131 FRANCE: IVAS MARKET, BY APPLICATION, 2020–2023 (USD MILLION)
TABLE 132 FRANCE: IVAS MARKET, BY APPLICATION, 2024–2029 (USD MILLION)
TABLE 133 FRANCE: IVAS MARKET, BY TECHNOLOGY, 2020–2023 (USD MILLION)
TABLE 134 FRANCE: IVAS MARKET, BY TECHNOLOGY, 2024–2029 (USD MILLION)
TABLE 135 GERMANY: IVAS MARKET, BY END USER, 2020–2023 (USD MILLION)
TABLE 136 GERMANY: IVAS MARKET, BY END USER, 2024–2029 (USD MILLION)
TABLE 137 GERMANY: IVAS MARKET, BY PRODUCT, 2020–2023 (USD MILLION)
TABLE 138 GERMANY: IVAS MARKET, BY PRODUCT, 2024–2029 (USD MILLION)
TABLE 139 GERMANY: IVAS MARKET, BY APPLICATION, 2020–2023 (USD MILLION)
TABLE 140 GERMANY: IVAS MARKET, BY APPLICATION, 2024–2029 (USD MILLION)
TABLE 141 GERMANY: IVAS MARKET, BY TECHNOLOGY, 2020–2023 (USD MILLION)
TABLE 142 GERMANY: IVAS MARKET, BY TECHNOLOGY, 2024–2029 (USD MILLION)
TABLE 143 ITALY: IVAS MARKET, BY END USER, 2020–2023 (USD MILLION)
TABLE 144 ITALY: IVAS MARKET, BY END USER, 2024–2029 (USD MILLION)
TABLE 145 ITALY: IVAS MARKET, BY PRODUCT, 2020–2023 (USD MILLION)
TABLE 146 ITALY: IVAS MARKET, BY PRODUCT, 2024–2029 (USD MILLION)
TABLE 147 ITALY: IVAS MARKET, BY APPLICATION, 2020–2023 (USD MILLION)
TABLE 148 ITALY: IVAS MARKET, BY APPLICATION, 2024–2029 (USD MILLION)
TABLE 149 ITALY: IVAS MARKET, BY TECHNOLOGY, 2020–2023 (USD MILLION)
TABLE 150 ITALY: IVAS MARKET, BY TECHNOLOGY, 2024–2029 (USD MILLION)
TABLE 151 REST OF EUROPE: IVAS MARKET, BY END USER, 2020–2023 (USD MILLION)
TABLE 152 REST OF EUROPE: IVAS MARKET, BY END USER, 2024–2029 (USD MILLION)
TABLE 153 REST OF EUROPE: IVAS MARKET, BY PRODUCT, 2020–2023 (USD MILLION)
TABLE 154 REST OF EUROPE: IVAS MARKET, BY PRODUCT, 2024–2029 (USD MILLION)
TABLE 155 REST OF EUROPE: IVAS MARKET, BY APPLICATION, 2020–2023 (USD MILLION)
TABLE 156 REST OF EUROPE: IVAS MARKET, BY APPLICATION, 2024–2029 (USD MILLION)
TABLE 157 REST OF EUROPE: IVAS MARKET, BY TECHNOLOGY, 2020–2023 (USD MILLION)
TABLE 158 REST OF EUROPE: IVAS MARKET, BY TECHNOLOGY, 2024–2029 (USD MILLION)
TABLE 159 MIDDLE EAST: BY COUNTRY, 2020–2023 (USD MILLION)
TABLE 160 MIDDLE EAST: BY COUNTRY, 2024–2029 (USD MILLION)
TABLE 161 MIDDLE EAST: BY END USER, 2020–2023 (USD MILLION)
TABLE 162 MIDDLE EAST: BY END USER, 2024–2029 (USD MILLION)
TABLE 163 MIDDLE EAST: BY PRODUCT, 2020–2023 (USD MILLION)
TABLE 164 MIDDLE EAST: BY PRODUCT, 2024–2029 (USD MILLION)
TABLE 165 MIDDLE EAST: BY APPLICATION, 2020–2023 (USD MILLION)
TABLE 166 MIDDLE EAST: BY APPLICATION, 2024–2029 (USD MILLION)
TABLE 167 MIDDLE EAST: BY TECHNOLOGY, 2020–2023 (USD MILLION)
TABLE 168 MIDDLE EAST: BY TECHNOLOGY, 2024–2029 (USD MILLION)
TABLE 169 GCC COUNTRIES: BY COUNTRY, 2020–2023 (USD MILLION)
TABLE 170 GCC COUNTRIES: BY COUNTRY, 2024–2029 (USD MILLION)
TABLE 171 SAUDI ARABIA: BY END USER, 2020–2023 (USD MILLION)
TABLE 172 SAUDI ARABIA: BY END USER, 2024–2029 (USD MILLION)
TABLE 173 SAUDI ARABIA: BY PRODUCT, 2020–2023 (USD MILLION)
TABLE 174 SAUDI ARABIA: BY PRODUCT, 2024–2029 (USD MILLION)
TABLE 175 SAUDI ARABIA: BY APPLICATION, 2020–2023 (USD MILLION)
TABLE 176 SAUDI ARABIA: BY APPLICATION, 2024–2029 (USD MILLION)
TABLE 177 SAUDI ARABIA: BY TECHNOLOGY, 2020–2023 (USD MILLION)
TABLE 178 SAUDI ARABIA: BY TECHNOLOGY, 2024–2029 (USD MILLION)
TABLE 179 UAE: BY END USER, 2020–2023 (USD MILLION)
TABLE 180 UAE: BY END USER, 2024–2029 (USD MILLION)
TABLE 181 UAE: BY PRODUCT, 2020–2023 (USD MILLION)
TABLE 182 UAE: BY PRODUCT, 2024–2029 (USD MILLION)
TABLE 183 UAE: BY APPLICATION, 2020–2023 (USD MILLION)
TABLE 184 UAE: BY APPLICATION, 2024–2029 (USD MILLION)
TABLE 185 UAE: BY TECHNOLOGY, 2020–2023 (USD MILLION)
TABLE 186 UAE: BY TECHNOLOGY, 2024–2029 (USD MILLION)
TABLE 187 ISRAEL: BY END USER, 2020–2023 (USD MILLION)
TABLE 188 ISRAEL: BY END USER, 2024–2029 (USD MILLION)
TABLE 189 ISRAEL: BY PRODUCT, 2020–2023 (USD MILLION)
TABLE 190 ISRAEL: BY PRODUCT, 2024–2029 (USD MILLION)
TABLE 191 ISRAEL: BY APPLICATION, 2020–2023 (USD MILLION)
TABLE 192 ISRAEL: BY APPLICATION, 2024–2029 (USD MILLION)
TABLE 193 ISRAEL: BY TECHNOLOGY, 2020–2023 (USD MILLION)
TABLE 194 ISRAEL: BY TECHNOLOGY, 2024–2029 (USD MILLION)
TABLE 195 TÜRKIYE: BY END USER, 2020–2023 (USD MILLION)
TABLE 196 TÜRKIYE: BY END USER, 2024–2029 (USD MILLION)
TABLE 197 TÜRKIYE: BY PRODUCT, 2020–2023 (USD MILLION)
TABLE 198 TÜRKIYE: BY PRODUCT, 2024–2029 (USD MILLION)
TABLE 199 TÜRKIYE: BY APPLICATION, 2020–2023 (USD MILLION)
TABLE 200 TÜRKIYE: BY APPLICATION, 2024–2029 (USD MILLION)
TABLE 201 TÜRKIYE: BY TECHNOLOGY, 2020–2023 (USD MILLION)
TABLE 202 TÜRKIYE: BY TECHNOLOGY, 2024–2029 (USD MILLION)
TABLE 203 REST OF THE WORLD: BY REGION, 2020–2023 (USD MILLION)
TABLE 204 REST OF THE WORLD: BY REGION, 2024–2029 (USD MILLION)
TABLE 205 REST OF THE WORLD: BY END USER, 2020–2023 (USD MILLION)
TABLE 206 REST OF THE WORLD: BY END USER, 2024–2029 (USD MILLION)
TABLE 207 REST OF THE WORLD: PRODUCT, 2020–2023 (USD MILLION)
TABLE 208 REST OF THE WORLD: BY PRODUCT, 2024–2029 (USD MILLION)
TABLE 209 REST OF THE WORLD: BY APPLICATION, 2020–2023 (USD MILLION)
TABLE 210 REST OF THE WORLD: BY APPLICATION, 2024–2029 (USD MILLION)
TABLE 211 REST OF THE WORLD: BY TECHNOLOGY, 2020–2023 (USD MILLION)
TABLE 212 REST OF THE WORLD: BY TECHNOLOGY, 2024–2029 (USD MILLION)
TABLE 213 AFRICA: INTEGRATED VISUAL AUGMENTATION SYSTEM MARKET, BY END USER, 2020–2023 (USD MILLION)
TABLE 214 AFRICA: INTEGRATED VISUAL AUGMENTATION SYSTEM MARKET, BY END USER, 2024–2029 (USD MILLION)
TABLE 215 AFRICA: INTEGRATED VISUAL AUGMENTATION SYSTEM MARKET, BY PRODUCT, 2020–2023 (USD MILLION)
TABLE 216 AFRICA: INTEGRATED VISUAL AUGMENTATION SYSTEM MARKET, BY PRODUCT, 2024–2029 (USD MILLION)
TABLE 217 AFRICA: INTEGRATED VISUAL AUGMENTATION SYSTEM MARKET, BY APPLICATION, 2020–2023 (USD MILLION)
TABLE 218 AFRICA: INTEGRATED VISUAL AUGMENTATION SYSTEM MARKET, BY APPLICATION, 2024–2029 (USD MILLION)
TABLE 219 AFRICA: INTEGRATED VISUAL AUGMENTATION SYSTEM MARKET, BY TECHNOLOGY, 2020–2023 (USD MILLION)
TABLE 220 AFRICA: INTEGRATED VISUAL AUGMENTATION SYSTEM MARKET, BY TECHNOLOGY, 2024–2029 (USD MILLION)
TABLE 221 LATIN AMERICA: INTEGRATED VISUAL AUGMENTATION SYSTEM MARKET, BY END USER, 2020–2023 (USD MILLION)
TABLE 222 LATIN AMERICA: INTEGRATED VISUAL AUGMENTATION SYSTEM MARKET, BY END USER, 2024–2029 (USD MILLION)
TABLE 223 LATIN AMERICA: INTEGRATED VISUAL AUGMENTATION SYSTEM MARKET, BY PRODUCT, 2020–2023 (USD MILLION)
TABLE 224 LATIN AMERICA: INTEGRATED VISUAL AUGMENTATION SYSTEM MARKET, BY PRODUCT, 2024–2029 (USD MILLION)
TABLE 225 LATIN AMERICA: INTEGRATED VISUAL AUGMENTATION SYSTEM MARKET, BY APPLICATION, 2020–2023 (USD MILLION)
TABLE 226 LATIN AMERICA: INTEGRATED VISUAL AUGMENTATION SYSTEM MARKET, BY APPLICATION, 2024–2029 (USD MILLION)
TABLE 227 LATIN AMERICA: INTEGRATED VISUAL AUGMENTATION SYSTEM MARKET, BY TECHNOLOGY, 2020–2023 (USD MILLION)
TABLE 228 LATIN AMERICA: INTEGRATED VISUAL AUGMENTATION SYSTEM MARKET, BY TECHNOLOGY, 2024–2029 (USD MILLION)
TABLE 229 KEY STRATEGIES ADOPTED BY LEADING PLAYERS IN INTEGRATED VISUAL AUGMENTATION SYSTEM MARKET
TABLE 230 INTEGRATED VISUAL AUGMENTATION SYSTEM MARKET: DEGREE OF COMPETITION
TABLE 231 INTEGRATED VISUAL AUGMENTATION SYSTEM MARKET: COMPANY TECHNOLOGY FOOTPRINT
TABLE 232 INTEGRATED VISUAL AUGMENTATION SYSTEM MARKET: COMPANY APPLICATION FOOTPRINT
TABLE 233 INTEGRATED VISUAL AUGMENTATION SYSTEM MARKET: COMPANY END USER FOOTPRINT
TABLE 234 INTEGRATED VISUAL AUGMENTATION SYSTEM MARKET: COMPANY REGION FOOTPRINT
TABLE 235 INTEGRATED VISUAL AUGMENTATION SYSTEM MARKET: LIST OF STARTUPS/SMES
TABLE 236 INTEGRATED VISUAL AUGMENTATION SYSTEM MARKET: COMPETITIVE BENCHMARKING OF STARTUPS/SMES
TABLE 237 INTEGRATED VISUAL AUGMENTATION SYSTEM MARKET: PRODUCT LAUNCHES/DEVELOPMENTS, JANUARY 2021–JANUARY 2024
TABLE 238 INTEGRATED VISUAL AUGMENTATION SYSTEM MARKET: DEALS, JANUARY 2022–DECEMBER 2023
TABLE 239 INTEGRATED VISUAL AUGMENTATION SYSTEM MARKET: OTHER DEVELOPMENTS, JANUARY 2020–APRIL 2024
TABLE 240 LOCKHEED MARTIN CORPORATION: COMPANY OVERVIEW
TABLE 241 LOCKHEED MARTIN CORPORATION: PRODUCTS/SOLUTIONS/SERVICES OFFERED
TABLE 242 LOCKHEED MARTIN CORPORATION: PRODUCT LAUNCHES
TABLE 243 LOCKHEED MARTIN CORPORATION: DEALS
TABLE 244 LOCKHEED MARTIN CORPORATION: OTHER DEVELOPMENTS
TABLE 245 MICROSOFT: COMPANY OVERVIEW
TABLE 246 MICROSOFT: PRODUCTS/SOLUTIONS/SERVICES OFFERED
TABLE 247 MICROSOFT: OTHER DEVELOPMENTS
TABLE 248 ELBIT SYSTEMS LTD.: COMPANY OVERVIEW
TABLE 249 ELBIT SYSTEMS LTD.: PRODUCTS/SOLUTIONS/SERVICES OFFERED
TABLE 250 ELBIT SYSTEMS LTD.: PRODUCT LAUNCHES
TABLE 251 ELBIT SYSTEMS LTD.: OTHER DEVELOPMENTS
TABLE 252 RTX: COMPANY OVERVIEW
TABLE 253 RTX: PRODUCTS/SOLUTIONS/SERVICES OFFERED
TABLE 254 RTX: OTHER DEVELOPMENTS
TABLE 255 BAE SYSTEMS: COMPANY OVERVIEW
TABLE 256 BAE SYSTEMS: PRODUCTS/SOLUTIONS/SERVICES OFFERED
TABLE 257 BAE SYSTEMS: DEALS
TABLE 258 VIRTRA, INC.: COMPANY OVERVIEW
TABLE 259 VIRTRA, INC.: PRODUCTS/SOLUTIONS/SERVICES OFFERED
TABLE 260 VIRTRA, INC.: PRODUCT LAUNCHES
TABLE 261 VIRTRA, INC.: OTHER DEVELOPMENTS
TABLE 262 HANWHA SYSTEMS CO., LTD.: COMPANY OVERVIEW
TABLE 263 HANWHA SYSTEMS CO., LTD.: PRODUCTS/SOLUTIONS/SERVICES OFFERED
TABLE 264 HONEYWELL INTERNATIONAL INC.: COMPANY OVERVIEW
TABLE 265 HONEYWELL INTERNATIONAL INC.: PRODUCTS/SOLUTIONS/SERVICES OFFERED
TABLE 266 HONEYWELL INTERNATIONAL INC.: PRODUCT LAUNCHES
TABLE 267 THALES: COMPANY OVERVIEW
TABLE 268 THALES: PRODUCTS/SOLUTIONS/SERVICES OFFERED
TABLE 269 VRGINEERS, INC.: COMPANY OVERVIEW
TABLE 270 VRGINEERS, INC.: PRODUCTS/SOLUTIONS/SERVICES OFFERED
TABLE 271 VRGINEERS, INC.: PRODUCT LAUNCHES
TABLE 272 INVERIS TRAINING SOLUTIONS: COMPANY OVERVIEW
TABLE 273 INVERIS TRAINING SOLUTIONS: PRODUCTS/SOLUTIONS/SERVICES OFFERED
TABLE 274 INVERIS TRAINING SOLUTIONS: PRODUCT LAUNCHES
TABLE 275 HUNTINGTON INGALLS INDUSTRIES INC: COMPANY OVERVIEW
TABLE 276 HUNTINGTON INGALLS INDUSTRIES INC: PRODUCTS/SOLUTIONS/ SERVICES OFFERED
TABLE 277 VUZIX: COMPANY OVERVIEW
TABLE 278 VUZIX: PRODUCTS/SOLUTIONS/SERVICES OFFERED
TABLE 279 VUZIX: OTHER DEVELOPMENTS
TABLE 280 OPTEX SYSTEMS, INC.: COMPANY OVERVIEW
TABLE 281 OPTEX SYSTEMS, INC.: PRODUCTS/SOLUTIONS/SERVICES OFFERED
TABLE 282 OPTEX SYSTEMS, INC.: OTHER DEVELOPMENTS
TABLE 283 AJNALENS: COMPANY OVERVIEW
TABLE 284 VARJO: COMPANY OVERVIEW
TABLE 285 RED SIX AEROSPACE, INC.: COMPANY OVERVIEW
TABLE 286 INFIVR: COMPANY OVERVIEW
TABLE 287 DESIGN INTERACTIVE INC.: COMPANY OVERVIEW
TABLE 288 SIX15 TECHNOLOGIES: COMPANY OVERVIEW
TABLE 289 THERMOTEKNIX SYSTEMS LTD: COMPANY OVERVIEW
TABLE 290 STEELE INDUSTRIES INC.: COMPANY OVERVIEW
TABLE 291 OPTINVENT: COMPANY OVERVIEW
TABLE 292 THE DISTI CORPORATION: COMPANY OVERVIEW
TABLE 293 DIGITAL AGENTS INTERACTIVE: COMPANY OVERVIEW
 
 
LIST OF FIGURES (72 FIGURES)
 
FIGURE 1 INTEGRATED VISUAL AUGMENTATION SYSTEM MARKET SEGMENTATION
FIGURE 2 RESEARCH FLOW
FIGURE 3 RESEARCH DESIGN
FIGURE 4 BREAKDOWN OF PRIMARY INTERVIEWS: BY COMPANY TYPE, DESIGNATION, AND REGION
FIGURE 5 BOTTOM-UP APPROACH
FIGURE 6 TOP-DOWN APPROACH
FIGURE 7 DATA TRIANGULATION
FIGURE 8 RESEARCH LIMITATIONS
FIGURE 9 HELMET-MOUNTED DISPLAY SEGMENT TO LEAD MARKET DURING FORECAST PERIOD
FIGURE 10 COMBAT MISSIONS SEGMENT TO REGISTER HIGHER CAGR DURING FORECAST PERIOD
FIGURE 11 VIRTUAL REALITY SEGMENT TO HAVE LARGEST MARKET SHARE DURING FORECAST PERIOD
FIGURE 12 AIR FORCE TO BE DOMINANT SEGMENT DURING FORECAST PERIOD
FIGURE 13 NORTH AMERICA TO ACCOUNT FOR LARGEST MARKET SHARE IN 2024
FIGURE 14 INCREASING DEFENSE BUDGET TO DRIVE MARKET
FIGURE 15 HELMET-MOUNTED DISPLAY SEGMENT TO CAPTURE DOMINANT MARKET SHARE IN 2024
FIGURE 16 SIMULATION & TRAINING TO CAPTURE LARGER MARKET SHARE DURING FORECAST PERIOD
FIGURE 17 VIRTUAL REALITY SEGMENT TO ACCOUNT FOR LARGEST MARKET SHARE DURING FORECAST PERIOD
FIGURE 18 AIR FORCE SEGMENT TO HOLD LARGEST MARKET SHARE DURING FORECAST PERIOD
FIGURE 19 US TO BE FASTEST-GROWING COUNTRY-LEVEL MARKET DURING FORECAST PERIOD
FIGURE 20 INTEGRATED VISUAL AUGMENTATION SYSTEM MARKET: DRIVERS, RESTRAINTS, OPPORTUNITIES, AND CHALLENGES
FIGURE 21 DEFENSE EXPENDITURE OF MAJOR COUNTRIES, 2022 VS. 2023 (%)
FIGURE 22 REVENUE SHIFT AND NEW REVENUE POCKETS FOR INTEGRATED VISUAL AUGMENTATION SYSTEM MANUFACTURERS
FIGURE 23 INDICATIVE PRICING, BY END USER
FIGURE 24 INTEGRATED VISUAL AUGMENTATION SYSTEM MARKET ECOSYSTEM
FIGURE 25 VALUE CHAIN ANALYSIS
FIGURE 26 PRODUCT HARMONIZED SYSTEM CODE (8524): EXPORT DATA FOR 12 COUNTRIES
FIGURE 27 PRODUCT HARMONIZED SYSTEM CODE (8524): IMPORT DATA FOR 10 COUNTRIES
FIGURE 28 INFLUENCE OF STAKEHOLDERS ON BUYING PROCESS FOR INTEGRATED VISUAL AUGMENTATION SYSTEMS, BY END USER
FIGURE 29 KEY BUYING CRITERIA FOR INTEGRATED VISUAL AUGMENTATION SYSTEMS, BY END USER
FIGURE 30 INTEGRATED VISUAL AUGMENTATION SYSTEM MARKET: TECHNOLOGY ROADMAP, 2020–2035
FIGURE 31 INTEGRATED VISUAL AUGMENTATION SYSTEM MARKET: ADOPTION OF LEADING TECHNOLOGIES
FIGURE 32 BILL OF MATERIALS: F35-GEN III HELMET-MOUNTED DISPLAY SYSTEMS
FIGURE 33 BILL OF MATERIALS: ENHANCED NIGHT VISION GOGGLE-BINOCULARS
FIGURE 34 TOTAL COST OF OWNERSHIP IN INTEGRATED VISUAL AUGMENTATION SYSTEM MARKET
FIGURE 35 BUSINESS MODEL
FIGURE 36 VENTURE CAPITAL AND DEALS, 2019–2022
FIGURE 37 GENERATIVE AI IN DEFENSE: LANDSCAPE
FIGURE 38 ADOPTION OF GENERATIVE AI IN MILITARY, BY TOP COUNTRIES
FIGURE 39 IMPACT OF GENERATIVE AI ON VARIOUS MILITARY PLATFORMS
FIGURE 40 IMPACT OF GENERATIVE AI ON INTEGRATED VISUAL AUGMENTATION SYSTEM MARKET
FIGURE 41 GENERATIVE AI APPLICATIONS IN INTEGRATED VISUAL AUGMENTATION SYSTEM MARKET,2024–2026
FIGURE 42 SUPPLY CHAIN ANALYSIS
FIGURE 43 LIST OF MAJOR PATENTS RELATED TO IVAS MARKET
FIGURE 44 HELMET-MOUNTED DISPLAY SEGMENT TO LEAD INTEGRATED VISUAL AUGMENTATION SYSTEM MARKET FROM 2024 TO 2029
FIGURE 45 VIRTUAL REALITY SEGMENT TO GROW AT HIGHEST CAGR DURING FORECAST PERIOD
FIGURE 46 COMBAT MISSIONS APPLICATION SEGMENT TO GROW AT HIGHER CAGR DURING FORECAST PERIOD
FIGURE 47 AIR FORCE SEGMENT TO GROW AT HIGHEST CAGR DURING FORECAST PERIOD
FIGURE 48 NORTH AMERICA TO BE FASTEST-GROWING REGIONAL-LEVEL MARKET FROM 2024 TO 2029
FIGURE 49 NORTH AMERICA: INTEGRATED VISUAL AUGMENTATION SYSTEM MARKET SNAPSHOT
FIGURE 50 ASIA PACIFIC: INTEGRATED VISUAL AUGMENTATION SYSTEM MARKET SNAPSHOT
FIGURE 51 EUROPE: INTEGRATED VISUAL AUGMENTATION SYSTEM MARKET SNAPSHOT
FIGURE 52 MIDDLE EAST: INTEGRATED VISUAL AUGMENTATION SYSTEM MARKET SNAPSHOT
FIGURE 53 REST OF THE WORLD: INTEGRATED VISUAL AUGMENTATION SYSTEM MARKET SNAPSHOT
FIGURE 54 MARKET SHARE ANALYSIS OF TOP 5 PLAYERS IN INTEGRATED VISUAL AUGMENTATION SYSTEM MARKET, 2023
FIGURE 55 REVENUE ANALYSIS OF TOP 5 PLAYERS, 2021–2023
FIGURE 56 COMPANY EVALUATION MATRIX OF KEY PLAYERS, 2023
FIGURE 57 INTEGRATED VISUAL AUGMENTATION SYSTEM MARKET: COMPANY FOOTPRINT
FIGURE 58 FINANCIAL METRICS OF PROMINENT MARKET PLAYERS
FIGURE 59 VALUATION OF PROMINENT MARKET PLAYERS
FIGURE 60 COMPANY EVALUATION MATRIX OF STARTUPS/SMES, 2023
FIGURE 61 LOCKHEED MARTIN CORPORATION: COMPANY SNAPSHOT
FIGURE 62 MICROSOFT: COMPANY SNAPSHOT
FIGURE 63 ELBIT SYSTEMS LTD.: COMPANY SNAPSHOT
FIGURE 64 RTX: COMPANY SNAPSHOT
FIGURE 65 BAE SYSTEMS: COMPANY SNAPSHOT
FIGURE 66 VIRTRA, INC.: COMPANY SNAPSHOT
FIGURE 67 HANWHA SYSTEMS CO., LTD.: COMPANY SNAPSHOT
FIGURE 68 HONEYWELL INTERNATIONAL INC.: COMPANY SNAPSHOT
FIGURE 69 THALES: COMPANY SNAPSHOT
FIGURE 70 HUNTINGTON INGALLS INDUSTRIES INC: COMPANY SNAPSHOT
FIGURE 71 VUZIX: COMPANY SNAPSHOT
FIGURE 72 OPTEX SYSTEMS, INC.: COMPANY SNAPSHOT
 

The study involved four major activities in estimating the current size of the The Integrated Visual Augmentation System (IVAS)  Market. Exhaustive secondary research was done to collect information on the The Integrated Visual Augmentation System (IVAS) Market, its adjacent markets, and its parent market. The next step was to validate these findings, assumptions, and sizing with industry experts across the value chain through primary research. Demand-side analyses were carried out to estimate the overall size of the market. After that, market breakdown and data triangulation procedures were used to estimate the sizes of different segments and subsegments of the The Integrated Visual Augmentation System (IVAS) Market.

Secondary Research

In the secondary research process, various sources were referred to for identifying and collecting information for this study. The secondary sources included government sources, such as SIPRI; corporate filings such as annual reports, press releases, and investor presentations of companies; white papers, journals, and certified publications; and articles from recognized authors, directories, and databases.

Primary Research

Extensive primary research was conducted after acquiring information regarding the the Integrated Visual Augmentation System (IVAS) Market scenario through secondary research. Several primary interviews were conducted with market experts from both the demand and supply sides across major countries of North America, Europe, Asia Pacific, the Middle East, and the Rest of the World, which includes Africa and Latin America. Primary data was collected through questionnaires, emails, and telephonic interviews.

Integrated Visual Augmentation System Market
 Size, and Share

To know about the assumptions considered for the study, download the pdf brochure

Market Size Estimation

The top-down and bottom-up approaches were used to estimate and validate the size of the Integrated Visual Augmentation System Market. The research methodology used to estimate the size of the market includes the following details.

Key players in the Integrated Visual Augmentation System Market were identified through secondary research, and their market share was determined through primary and secondary research. This included a study of the annual and financial reports of the top market players and extensive interviews with leaders such as directors, engineers, marketing executives, and other stakeholders of leading companies operating in the Integrated Visual Augmentation System Market.

All percentage shares, splits, and breakdowns were determined using secondary sources and verified through primary sources. All possible parameters that affect the markets covered in this research study were accounted for, viewed in extensive detail, verified through primary research, and analyzed to obtain the final quantitative and qualitative data on the Integrated Visual Augmentation System market. This data was consolidated, enhanced with detailed inputs, analyzed by MarketsandMarkets, and presented in this report.

Integrated Visual Augmentation System Market Size: Bottom-up Approach

Integrated Visual Augmentation System Market
 Size, and Bottom-up Approach

Integrated Visual Augmentation System Market Size: Top-Down Approach

Integrated Visual Augmentation System Market
 Size, and Top-Down Approach

Data Triangulation

After arriving at the overall market size, the total market was split into several segments and subsegments. The data triangulation and market breakdown procedures explained below were implemented, wherever applicable, to complete the overall market engineering process and arrive at the estimated market numbers for the market segments and subsegments. The data was triangulated by studying various factors and trends from the demand and supply sides. Along with this, the market size was validated using the top-down and bottom-up approaches.

Market Definition

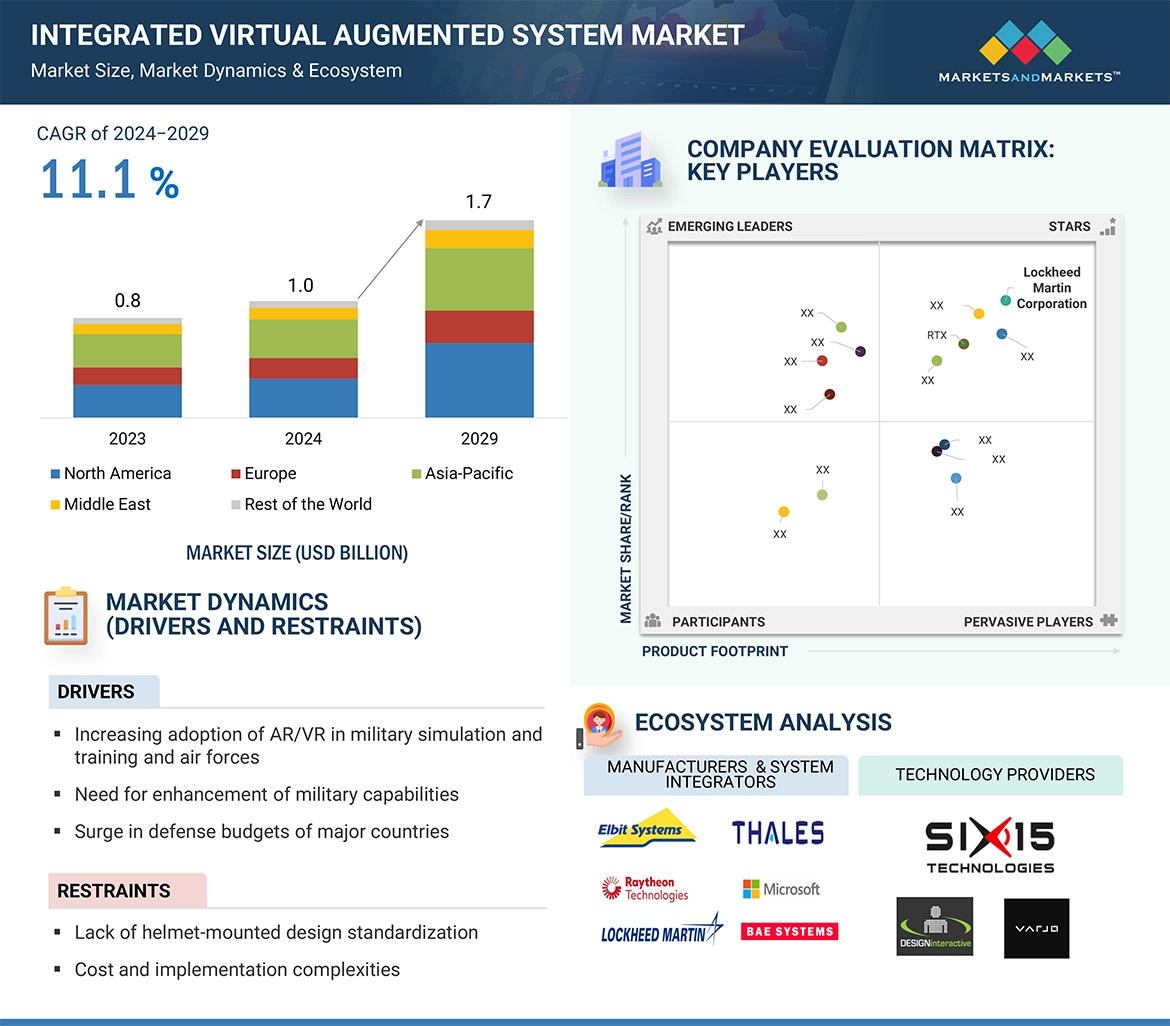
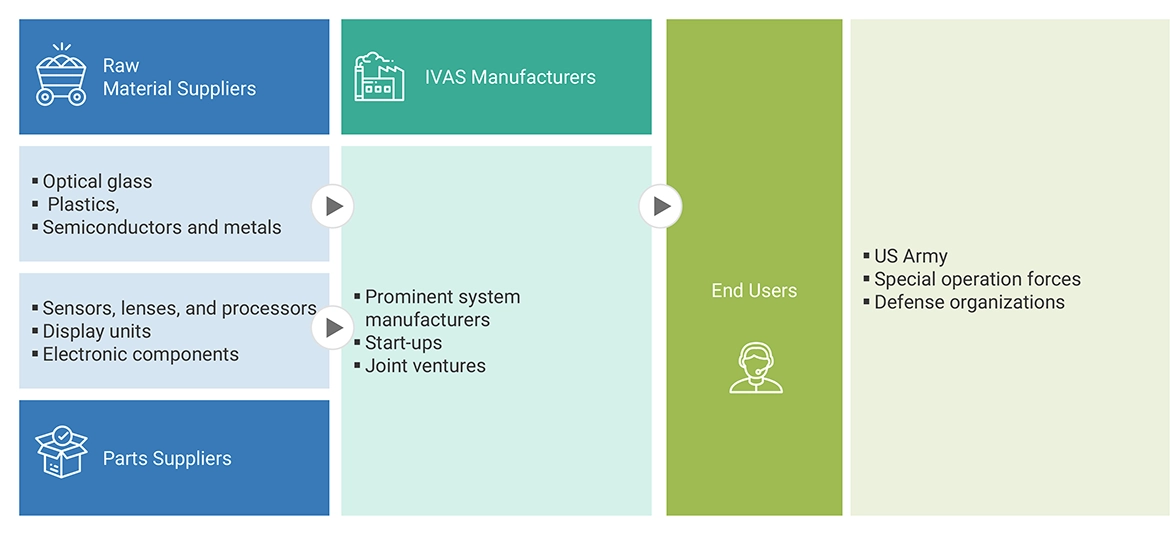
The Integrated Virtual Augmented System (IVAS) market integrates virtual reality (VR) and augmented reality (AR) technologies into a single system that improves situational awareness for military personnel. IVAS incorporates helmet-mounted displays (HMDs), night vision devices (NVDs), and AR/VR systems, among other wearable technologies, to create practical, interactive experiences that combine digital content with the real-world setting. This technology is used in various applications including combat missions, simulations, and training exercises.

Market Stakeholders

  • Army
  • Navy
  • Air Force
  • Special Forces
  • Traing and Simulation Troops

Report Objectives

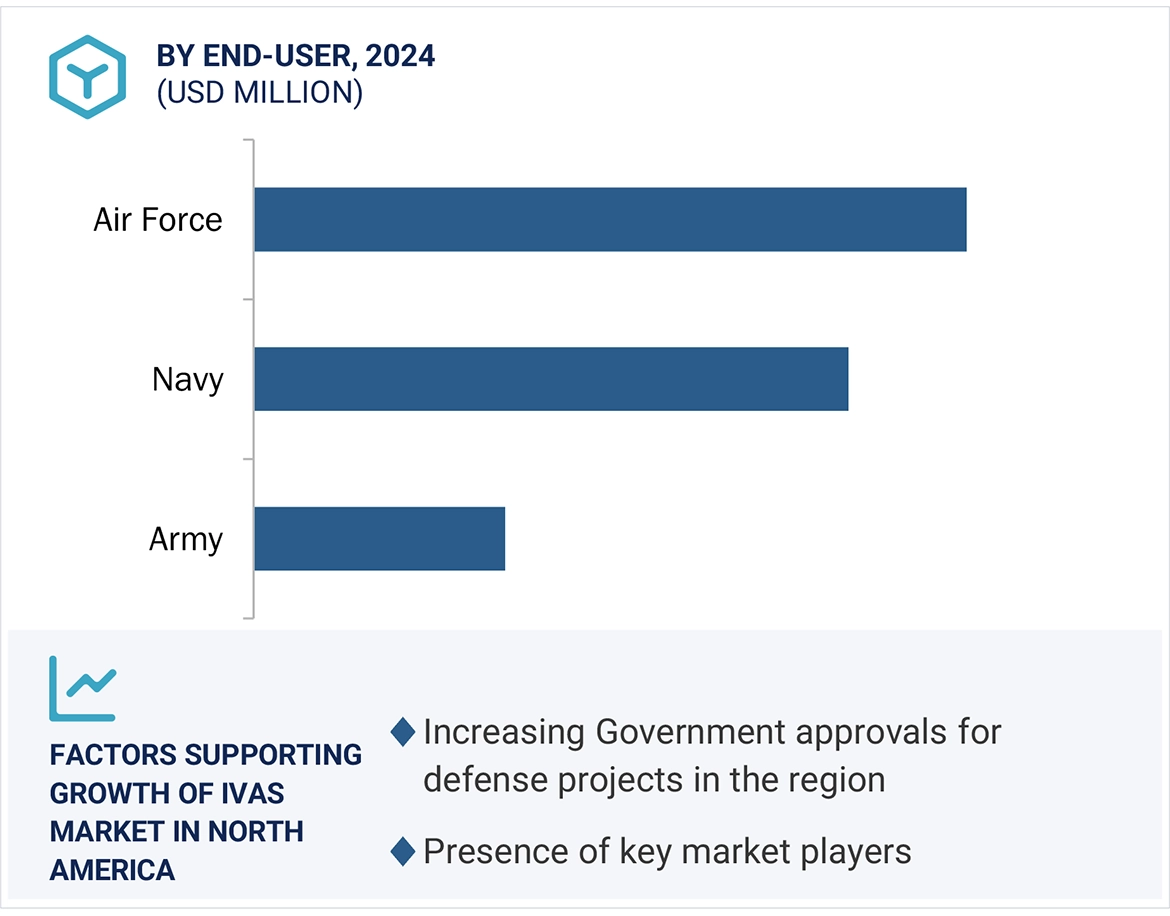
  • To define, describe, and forecast the Integrated Virtual Augmented System (IVAS) market size based on end-user, application, technology,product and Region.
  • To forecast the size of different segments of the market with respect to five major regions: North America, Europe, Asia Pacific, the Middle East, and the Rest of the World, along with their respective key countries
  • To identify and analyze key drivers, restraints, opportunities, and challenges influencing the market’s growth
  • To identify industry trends and technology trends currently prevailing in the market
  • To analyze micromarkets1 with respect to their individual growth trends, prospects, and contribution to the overall market
  • To profile companies operating in the market based on their product portfolios, market share, and key growth strategies
  • To analyze the degree of competition among players in the market by identifying and analyzing their business revenues,   products offered, and recent developments and ranking them based on these parameters
  • To analyze competitive developments such as deals, new product launches/developments, and partnerships/acquisitions undertaken by key market players
  • To strategically profile key players and comprehensively analyze their share and core competencies in the market

Available Customizations

MarketsandMarkets offers the following customizations for this market report:

  • Additional country-level analysis of the Integrated Virtual Augmented System (IVAS) market
  • Profiling of other market players (up to 5)

Product Analysis

  • Product matrix, which provides a detailed comparison of the product portfolio of each company in the Integrated Virtual Augmented System (IVAS)
Custom Market Research Services

We will customize the research for you, in case the report listed above does not meet with your exact requirements. Our custom research will comprehensively cover the business information you require to help you arrive at strategic and profitable business decisions.

Request Customization
Report Code
AS 9107
Published ON
Aug, 2024
Choose License Type
BUY NOW
  • SHARE
X
Request Customization
Speak to Analyst
Speak to Analyst
OR FACE-TO-FACE MEETING
PERSONALIZE THIS RESEARCH
  • Triangulate with your Own Data
  • Get Data as per your Format and Definition
  • Gain a Deeper Dive on a Specific Application, Geography, Customer or Competitor
  • Any level of Personalization
REQUEST A FREE CUSTOMIZATION
LET US HELP YOU!
  • What are the Known and Unknown Adjacencies Impacting the Integrated Visual Augmentation System Market
  • What will your New Revenue Sources be?
  • Who will be your Top Customer; what will make them switch?
  • Defend your Market Share or Win Competitors
  • Get a Scorecard for Target Partners
CUSTOMIZED WORKSHOP REQUEST
  • Call Us
  • +1-888-600-6441 (Corporate office hours)
  • +1-888-600-6441 (US/Can toll free)
  • +44-800-368-9399 (UK office hours)
CONNECT WITH US
ABOUT TRUST ONLINE
©2024 MarketsandMarkets Research Private Ltd. All rights reserved
DMCA.com Protection Status Website Feedback