IDaaS Market by Component (Provisioning, Single Sign-on, Advance Authentication, Audit, Compliance, and Governance, Directory Services, Password Management), Deployment type, Verticals and Region - Global Forecast to 2028
[367 Pages Report] The global IDaaS market size is projected to grow from USD 7.0 billion in 2023 to USD 21.4 billion by 2028 at a Compound Annual Growth Rate (CAGR) of 25.0% during the forecast period. The expansion of the IDaaS market can be attributed to government initiatives and regulations to support digital identity transformation and the rise in identity and authentication frauds.
Moreover, the IDaaS market is experiencing growth due to the introduction of AI/ML-powered services. These factors contribute to the market’s promising growth potential, providing organizations with enhanced security measures.
To know about the assumptions considered for the study, Request for Free Sample Report
To know about the assumptions considered for the study, download the pdf brochure
IDaaS Market Dynamics
Driver: Rise in identity and authentication frauds
The rise in identity and authentication fraud has become a significant concern for businesses across various industries. The trend represents a growing challenge that organizations must address to safeguard their operations and customer data. In today’s digital landscape, where remote work and online transactions have become the norm, cybercriminals are becoming increasingly sophisticated in their methods. They exploit vulnerabilities in identity verification and authentication processes to gain unauthorized access to systems, steal sensitive information, and engage in fraudulent activities. In 2021, more than 5.88 million fraud reports were filed with the FTC, a 19% increase from the previous year. Identity theft complaints were the largest fraud category, accounting for 1,686,121 complaints received by the FTC. These attacks can lead to operational shutdowns, data leakage, and revenue loss. These losses cause significant financial concerns for organizations, and those organizations' reputations are constantly at stake.
Restraint: Reluctance of organizations to adopt cloud-based security
Due to security concerns, several enterprises are dubious about adopting cloud-based security solutions. According to a cloud survey, identity security is one of the top issues for businesses worldwide. Despite the financial advantages of cloud-based security, companies prefer to handle their data and apps on-premises. The hesitation among organizations to embrace cloud-based security solutions stems from several valid concerns rooted in the desire to protect their digital assets and sensitive data.
Another common misconception is that cloud-based standards are not yet developed enough to meet IT security requirements. Additionally, despite a surge in cloud-based security solutions, few businesses know these solutions' potential dangers and hazards. Enterprises' hesitation is constraining the expansion of the IDaaS market to migrate to the cloud.
Opportunity: Integration of AI, ML, and blockchain technologies to enhance digital identities
Integrating AI, ML, and blockchain technologies is a trending concept. Designed computerized systems are replacing human efforts and minimizing potential risks. AI and ML are playing a pivotal role in enhancing digital security by enabling predictive threat analysis and rapid response. They can identify patterns and anomalies within vast datasets, swiftly detecting unusual activities that might indicate a security breach. The proactive approach allows businesses to address vulnerabilities before they can be exploited. AI and ML also empower security systems to adapt and learn from new threats, continually improving their ability to thwart cyberattacks. IDaaS solution vendors can apply ML-based analytics to large volumes of identity-related data and access activities. It helps reduce the identity attack surface by accurately measuring and reporting on a user, account, application, department, and organizational risk posture. It also exposes anomalous access and helps implement risk-based access certifications, which help identify and authenticate. Sectors such as automobiles, BFSI, and the government have started implementing these technologies.
Challenge:Ownership and privacy challenges
IDaaS is a cloud-based identity and access management system hosted and managed by a third-party vendor. The Identity as a Service (IDaaS) market is experiencing rapid growth, but it also presents certain ownership and privacy challenges for businesses. One of the primary challenges pertains to the ownership of user identity data. When organizations adopt IDaaS solutions, they often entrust a third-party service provider with critical user identity information. It raises concerns about who ultimately owns the data - the business or the IDaaS provider. Clarity on data ownership is crucial, as it impacts control, compliance, and the ability to switch service providers if needed..
IDaaS Market Ecosystem
By verticals, government vertical is expected to grow at the highest CAGR during the forecast period.
Cyberattackers always target government agencies to gain access to confidential government data. Governments in emerging economies are deploying web and mobile applications to serve their citizens efficiently. Due to this, the public sector and government organizations handle data and consumer identities of a critical nature more efficiently. These applications are becoming the prime targets for cybercriminals to access sensitive data. Identity frauds in the government/public sector include misappropriation of assets, identity thefts, bribery and corruption, accounting fraud, data thefts, and money laundering. The incidents of identity thefts to access confidential government data have increased, resulting in the adoption of IDaaS solutions in government agencies.
By deployment mode, private cloud is expected to grow at the highest CAGR during the forecast period.
Private cloud refers to computing wherein the computing resource is accessed by a single organization and restricted to external entities. Organizations that invest in their on-premises data centers can also use it as a private deployment type. Private cloud IDaaS provides organizations with greater control and data sovereignty. Private cloud offerings can be customized to meet an organization's specific needs. It particularly appeals to businesses operating in highly regulated industries or regions with strict data privacy requirements. With a private cloud, organizations can maintain sensitive data within their infrastructure and under their direct supervision, ensuring compliance with data protection regulations.
By region, North America accounts for the highest market size during the forecast period.
North American companies are quite advanced when it comes to making a shift towards cloud-based technology and implementing Identity and security management solutions to have best practices for their everyday business processes with the presence of key IDaaS solution vendors in the region, including Okta, Idaptive, Sail Point, Ping Identity, Microsoft, Oracle, IBM, and OneLogin resulting in the adoption of IDaaS solutions in the region. The other drivers for the growing demand for IDaaS solutions in the region include the need to comply with strict compliance regulations. North America is a highly regulated region globally with numerous regulations and compliances, such as the Federal Energy Regulatory Commission (FERC), HIPAA, PCI DSS, and SOX, across verticals. These regulations are also driving the IDaaS market in North America.
Key Market Players
The key players in the IDaaS market are Okta (US), Microsoft (US), Thales (France), Ping Identity (US), IBM (US), Atos (France), Oracle (US), Salesforce (US), Google (US), CyberArk (US) and others.
Want to explore hidden markets that can drive new revenue in IDaaS Market?
Scope of the Report
Want to explore hidden markets that can drive new revenue in IDaaS Market?
Report Metrics |
Details |
Market size available for years |
2017-2028 |
Base year considered |
2022 |
Forecast period |
2023–2028 |
Forecast units |
Value (USD Million/USD Billion) |
Segments Covered |
Component, deployment type, verticals and regions |
Geographies covered |
North America, Europe, Asia Pacific, Middle East & Africa, and Latin America |
Companies covered |
Major vendors in the global IDaaS market include Okta (US), Microsoft (US), Thales (France), Ping Identity (US), IBM (US), Atos (France), Oracle (US), Salesforce (US), Google (US), CyberArk (US), OpenText (Canada), SailPoint (US), VMware (US), HCL Tech (India), Entrust (US), SecureAuth (US), Simeio (US), Ilantus Technology (India), LoginRadius (US), JumpCloud (US), IDNow (Germany), One Identity (US), 1Kosmos (US), Idenfy (Lithuania), ShareID (France) |
The study categorizes the IDaaS market by component, deployment type, verticals, and regions.
By Component:
- Provisioning
- Single Sign-on
- Advance Authentication
- Audit, Compliance, and Governance
- Directory Services
- Password Management
By Deployment type:
- Public Cloud
- Private Cloud
- Hybrid Cloud
By Vertical:
- BFSI
- IT & ITeS
- Energy and Utilities
- Government
- Manufacturing
- Healthcare
- Telecommunication
- Other Verticals
By Region:
- North America
- Europe
- Asia Pacific
- Middle East & Africa
- Latin America
Recent Developments
- In September 2023, Eviden, a security industry leader inside the Atos Group, announced a partnership with HID Global. Through the agreement, businesses employing HID technology for logical and physical access control aims to use Eviden's Identity and Access Management suite to access their digital assets.
- In May 2023, Ping Identity launched PingOne Protect, a new fraud detection and risk management service. By integrating Identity and Access Management (IAM) with comprehensive, intelligence-based fraud detection across the entire user experience, PingOne Protect adopts a distinctive strategy for threat protection.
- In December 2022, Thales Group partnered with Zimbra. In the partnership, Zimbra will utilize Thales Group’s SafeNet Trusted Access (STA) to provide SSO, policy configuration, and MFA.
- In November 2022, Okta launched Okta Customer Identity Cloud, an easy-to-implement and customizable customer identity solution. The Okta Customer Identity Cloud for Consumer Apps helps any organization with advanced security features like Adaptive MFA.
- In September 2022, Microsoft partnered with Silverfort to bring unified identity protection to on-premises and cloud. Silverfort developed a unified identity protection system with the aid of Microsoft’s MFA.
Frequently Asked Questions (FAQ):
What are the opportunities in the global IDaaS market?
The rising trend of cost shift and complexity reduction, Integration of AI, ML, and blockchain technologies to enhance digital identities and adoption of advanced authentication techniques across verticals are a few factors contributing to the growth and creating new opportunities for the IDaaS market.
What is the definition of the IDaaS market?
Identity as a Service (IDaaS) refers to Identity and Access Management (IAM) services offered through the cloud or Software-as-a-Service (SaaS) on a subscription basis. IDaaS enables users to connect and use identity management services from the cloud.
Businesses are increasingly moving toward the cloud, offering advantages such as low costs, improved management and security, and easy network access. It has led to an increased usage of IDaaS, an authentication infrastructure kept in the cloud. IDaaS comprises cloud-based solutions that provide IAM and access governance capabilities as a service, ranging from Single Sign-On (SSO) to identity provisioning and access governance.
Which region is expected to show the highest market share in the IDaaS market?
North America is expected to account for the largest market share during the forecast period.
What are the major market players covered in the report?
Major vendors, namely, include Okta (US), Microsoft (US), Thales (France), Ping Identity (US), IBM (US), Atos (France), Oracle (US), Salesforce (US), Google (US), CyberArk (US).
What is the current size of the global IDaaS market?
The global IDaaS market size is projected to grow from USD 7.0 billion in 2023 to USD 21.4 billion by 2028 at a Compound Annual Growth Rate (CAGR) of 25.0% during the forecast period.
To speak to our analyst for a discussion on the above findings, click Speak to Analyst
Exclusive indicates content/data unique to MarketsandMarkets and not available with any competitors.
- 5.1 INTRODUCTION
-
5.2 MARKET DYNAMICSDRIVERS- Government initiatives and regulations to support digital identity transformation- Need for effective compliance management- Rise in identity and authentication threatsRESTRAINTS- Reluctance of organizations in adopting cloud-based security- Lack of data securityOPPORTUNITIES- Rising focus of organizations on enhancing user experience- Integration of AI, ML, and blockchain technologies to enhance digital identities- Adoption of advance authentication techniques across verticalsCHALLENGES- Compliance and control challenges- Ownership and privacy issues
-
5.3 CASE STUDY ANALYSISEHEALTH DEPLOYED PING IDENTITY’S OFFERINGS TO ENHANCE ONLINE CUSTOMER EXPERIENCEBLAIZE ADOPTED MATCHPOINT’S SOLUTIONS TO ENABLE EXTERNAL USER ACCESS AND CENTRALIZED IDENTITY MANAGEMENTTHALES GROUP HELPED MAJOR TELECOM OPERATOR WITH DIGITAL IDENTITY SETUP
- 5.4 VALUE CHAIN ANALYSIS
- 5.5 ECOSYSTEM ANALYSIS
-
5.6 PORTER’S FIVE FORCES ANALYSISTHREAT OF NEW ENTRANTSTHREAT OF SUBSTITUTESBARGAINING POWER OF SUPPLIERSBARGAINING POWER OF BUYERSINTENSITY OF COMPETITIVE RIVALRY
-
5.7 PRICING ANALYSISAVERAGE SELLING PRICE TRENDS OF KEY PLAYERS, BY COMPONENTINDICATIVE PRICING ANALYSIS, BY COMPONENT
-
5.8 TECHNOLOGY ANALYSISZERO TRUSTBLOCKCHAIN
- 5.9 PATENT ANALYSIS
- 5.10 TRENDS AND DISRUPTIONS IMPACTING CUSTOMERS’ BUSINESSES
-
5.11 REGULATORY LANDSCAPEGENERAL DATA PROTECTION REGULATIONSARBANES-OXLEY ACT (SOX)SOC2ELECTRONIC IDENTIFICATION, AUTHENTICATION, AND TRUST SERVICESKNOW YOUR CUSTOMERANTI-MONEY LAUNDERINGREGULATORY BODIES, GOVERNMENT AGENCIES, AND OTHER ORGANIZATIONS
-
5.12 KEY STAKEHOLDERS & BUYING CRITERIAKEY STAKEHOLDERS IN BUYING PROCESSBUYING CRITERIA
- 5.13 KEY CONFERENCES & EVENTS
- 5.14 TECHNOLOGY ROADMAP
- 5.15 IDENTITY AS A SERVICE MARKET: BUSINESS MODEL ANALYSIS
- 5.16 EVOLUTION OF IDENTITY AS A SERVICE MARKET
- 6.1 INTRODUCTION
-
6.2 PROVISIONINGIDENTITY PROVISIONING CONTROLS USERS’ ACCOUNTS AND ENSURES THEY HAVE ADEQUATE ACCESS TO AVAILABLE RESOURCE INITIATIVESPROVISIONING: IDENTITY AS A SERVICE MARKET DRIVERS
-
6.3 SINGLE SIGN-ONEASE OF PASSWORDLESS AUTHENTICATION TO BOOST MARKET FOR SINGLE SIGN-ON IMPLEMENTATIONSINGLE SIGN-ON: IDENTITY AS A SERVICE MARKET DRIVERS
-
6.4 ADVANCE AUTHENTICATIONMULTIPLE VALIDATION CHECKS AND GROWING NEED FOR RISK-BASED VALIDATION TO BOOST GROWTHADVANCE AUTHENTICATION: IDENTITY AS A SERVICE MARKET DRIVERS
-
6.5 AUDIT, COMPLIANCE, AND GOVERNANCESTRICT REGULATORY COMPLIANCE MANDATING COMPANIES TO DOCUMENT AND AUDIT INTERNAL CONTROLS TO DRIVE MARKETAUDIT, COMPLIANCE, AND GOVERNANCE: IDENTITY AS A SERVICE MARKET DRIVERS
-
6.6 DIRECTORY SERVICESDIRECTORY SERVICES OFFER CENTRALIZED REPOSITORY FOR MANAGING USER IDENTITIES, ENHANCING SECURITY AND OPERATIONAL EFFICIENCYDIRECTORY SERVICES: IDENTITY AS A SERVICE MARKET DRIVERS
-
6.7 PASSWORD MANAGEMENTPASSWORD MANAGEMENT TO HELP ORGANIZATIONS ACHIEVE AND DEMONSTRATE STRICT COMPLIANCEPASSWORD MANAGEMENT: IDENTITY AS A SERVICE MARKET DRIVERS
- 7.1 INTRODUCTION
-
7.2 PUBLIC CLOUDLOW COSTS AND HIGH SCALABILITY ASSOCIATED WITH PUBLIC CLOUD TO DRIVE ITS ADOPTIONPUBLIC CLOUD: IDENTITY AS A SERVICE MARKET DRIVERS
-
7.3 PRIVATE CLOUDGROWING DEMAND FOR CUSTOMIZED CLOUD ENVIRONMENTS FOR MEETING BUSINESS NEEDS TO SPUR MARKETPRIVATE CLOUD: IDENTITY AS A SERVICE MARKET DRIVERS
-
7.4 HYBRID CLOUDNEED FOR ENHANCED SECURITY AND BETTER APPLICATION PERFORMANCE TO BOOST POPULARITY OF HYBRID MODELHYBRID CLOUD: IDENTITY AS A SERVICE MARKET DRIVERS
- 8.1 INTRODUCTION
-
8.2 BANKING, FINANCIAL SERVICES, AND INSURANCERAPID DIGITIZATION AND USE OF CUTTING-EDGE TECHNOLOGIES TO DRIVE NEED FOR IDAAS SOLUTIONSBANKING, FINANCIAL SERVICES, AND INSURANCE: IDENTITY AS A SERVICE MARKET DRIVERS
-
8.3 INFORMATION TECHNOLOGY (IT) & INFORMATION TECHNOLOGY-ENABLED SERVICES (ITES)RAPID DEPLOYMENT OF NEW TECHNOLOGICAL SOLUTIONS TO DRIVE NEED FOR IDAAS SERVICESIT & ITES: IDENTITY AS A SERVICE MARKET DRIVERS
-
8.4 ENERGY & UTILITIESGROWING TECHNOLOGICAL ADVANCEMENTS TO REDUCE INFRASTRUCTURE COSTS TO ENCOURAGE USE OF IDAAS SOLUTIONSENERGY & UTILITIES: IDENTITY AS A SERVICE MARKET DRIVERS
-
8.5 GOVERNMENTNEED FOR PROCESSING LARGE UNSTRUCTURED DATA AND STORAGE TO ACCELERATE ADOPTION OF IDAAS TECHNOLOGYGOVERNMENT: IDENTITY AS A SERVICE MARKET DRIVERS
-
8.6 MANUFACTURINGMIGRATION OF APPLICATIONS TO CLOUD ENVIRONMENT TO COMPEL MANUFACTURERS TO ADOPT SMART MANUFACTURING TECHNOLOGIESMANUFACTURING: IDENTITY AS A SERVICE MARKET DRIVERS
-
8.7 HEALTHCARESTRINGENT REGULATIONS SUCH AS HIPAA AND PCI DSS DRIVE NEED FOR IDAAS SOLUTIONS IN HEALTHCARE SECTORHEALTHCARE: IDENTITY AS A SERVICE MARKET DRIVERS
-
8.8 TELECOMMUNICATIONINCREASING INSTANCES OF IDENTITY FRAUD AND PHISHING CALLS TO BOOST NEED FOR IDAAS SOLUTIONS IN TELECOM SECTORTELECOMMUNICATION: IDENTITY AS A SERVICE MARKET DRIVERS
- 8.9 OTHER VERTICALS
- 9.1 INTRODUCTION
-
9.2 NORTH AMERICANORTH AMERICA: MARKET DRIVERSNORTH AMERICA: RECESSION IMPACTNORTH AMERICA: REGULATORY LANDSCAPEUS- High level of technology awareness and presence of identity solution and service vendors to drive growthCANADA- Digital identity initiatives by government to spur market
-
9.3 EUROPEEUROPE: MARKET DRIVERSEUROPE: RECESSION IMPACTEUROPE: REGULATORY LANDSCAPEUK- Rising instances of identity theft and fraud to boost market expansionGERMANY- Rising focus of government to protect country against threats to encourage adoption of IDaaS solutionsFRANCE- Increased reliance of organizations and people on digital platforms and services to drive need for IDaaS solutionsITALY- Expansion of digital identity landscape characterized by need for secure and efficient online identification processes to propel marketREST OF EUROPE
-
9.4 ASIA PACIFICASIA PACIFIC: MARKET DRIVERSASIA PACIFIC: RECESSION IMPACTASIA PACIFIC: REGULATORY LANDSCAPECHINA- Surge in cyberattacks to drive need for IDaaS solutions and servicesJAPAN- Rising vulnerability due to increased dependency on connected devices to boost need for IDaaS solutionsINDIA- Initiatives like ‘Digital India’ to lead to adoption of IDaaS solutionsAUSTRALIA- Need for strict rules and standards in country’s digital identity system to drive adoption of IDaaS solutionsREST OF ASIA PACIFIC
-
9.5 MIDDLE EAST & AFRICAMIDDLE EAST & AFRICA: MARKET DRIVERSMIDDLE EAST & AFRICA: RECESSION IMPACTMIDDLE EAST & AFRICA: REGULATORY LANDSCAPEMIDDLE EAST- Rapid digital transformation and diverse economy to spur market growth- UAE- KSA- Rest of Middle EastAFRICA- Rapid increase in instances of identity fraud to propel market growth
-
9.6 LATIN AMERICALATIN AMERICA: MARKET DRIVERSLATIN AMERICA: RECESSION IMPACTLATIN AMERICA: REGULATORY LANDSCAPEBRAZIL- Rapid adoption of technology across sectors to encourage popularity of IDaaS solutions and servicesMEXICO- Increasing data breaches to compel organizations and government to depend on IDaaS solutionsREST OF LATIN AMERICA
- 10.1 INTRODUCTION
- 10.2 KEY PLAYERS STRATEGIES/RIGHT TO WIN
- 10.3 REVENUE ANALYSIS
- 10.4 MARKET SHARE ANALYSIS
-
10.5 COMPANY EVALUATION MATRIXSTARSEMERGING LEADERSPERVASIVE PLAYERSPARTICIPANTSCOMPANY FOOTPRINT
-
10.6 START-UP/SME EVALUATION MATRIXPROGRESSIVE COMPANIESRESPONSIVE COMPANIESDYNAMIC COMPANIESSTARTING BLOCKSCOMPETITIVE BENCHMARKING
-
10.7 COMPETITIVE SCENARIO AND TRENDSPRODUCT LAUNCHES & ENHANCEMENTSDEALS
-
11.1 KEY PLAYERSOKTA- Business overview- Products/Solutions/Services offered- Recent developments- MnM viewMICROSOFT- Business overview- Products/Solutions/Services offered- Recent developments- MnM viewTHALES GROUP- Business overview- Products/Solutions/Services offered- Recent developments- MnM viewPING IDENTITY- Business overview- Products/Solutions/Services offered- Recent developments- MnM viewIBM- Business overview- Products/Solutions/Services offered- Recent developments- MnM viewATOS- Business overview- Products/Solutions/Services offered- Recent developmentsORACLE- Business overview- Products/Solutions/Services offered- Recent developmentsSALESFORCE- Business overview- Products/Solutions/Services offered- Recent developmentsGOOGLE- Business overview- Products/Solutions/Services offered- Recent developmentsCYBERARK- Business overview- Products/Solutions/Services offered- Recent developments
-
11.2 START-UPS/SMESOPENTEXTSAILPOINTVMWAREHCLTECHENTRUSTSECUREAUTHSIMEIOILANTUS TECHNOLOGIESLOGINRADIUSJUMPCLOUDIDNOWONE IDENTITY1KOSMOSIDENFYSHAREID
- 12.1 INTRODUCTION
- 12.2 LIMITATIONS
- 12.3 DIGITAL IDENTITY SOLUTIONS MARKET
- 12.4 MULTI-FACTOR AUTHENTICATION MARKET
- 13.1 DISCUSSION GUIDE
- 13.2 KNOWLEDGESTORE: MARKETSANDMARKETS’ SUBSCRIPTION PORTAL
- 13.3 CUSTOMIZATION OPTIONS
- 13.4 RELATED REPORTS
- 13.5 AUTHOR DETAILS
- TABLE 1 USD EXCHANGE RATES, 2018–2022
- TABLE 2 FACTOR ANALYSIS
- TABLE 3 IDENTITY AS A SERVICE MARKET SIZE AND GROWTH RATE, 2017–2022 (USD MILLION, Y-O-Y %)
- TABLE 4 IDENTITY AS A SERVICE MARKET SIZE AND GROWTH RATE, 2023–2028 (USD MILLION, Y-O-Y %)
- TABLE 5 ROLE OF PLAYERS IN MARKET ECOSYSTEM
- TABLE 6 IMPACT OF PORTER’S FIVE FORCES ON IDENTITY AS A SERVICE MARKET
- TABLE 7 AVERAGE SELLING PRICE TRENDS OF KEY PLAYERS, BY COMPONENT
- TABLE 8 IBM: INDICATIVE PRICING ANALYSIS
- TABLE 9 OKTA: INDICATIVE PRICING ANALYSIS
- TABLE 10 LIST OF PATENTS GRANTED, 2021–2023
- TABLE 11 NORTH AMERICA: LIST OF REGULATORY BODIES, GOVERNMENT AGENCIES, AND OTHER ORGANIZATIONS
- TABLE 12 EUROPE: LIST OF REGULATORY BODIES, GOVERNMENT AGENCIES, AND OTHER ORGANIZATIONS
- TABLE 13 ASIA PACIFIC: LIST OF REGULATORY BODIES, GOVERNMENT AGENCIES, AND OTHER ORGANIZATIONS
- TABLE 14 MIDDLE EAST & AFRICA: LIST OF REGULATORY BODIES, GOVERNMENT AGENCIES, AND OTHER ORGANIZATIONS
- TABLE 15 LATIN AMERICA: LIST OF REGULATORY BODIES, GOVERNMENT AGENCIES, AND OTHER ORGANIZATIONS
- TABLE 16 INFLUENCE OF STAKEHOLDERS ON BUYING PROCESS FOR TOP THREE VERTICALS
- TABLE 17 KEY BUYING CRITERIA FOR TOP THREE VERTICALS
- TABLE 18 LIST OF KEY CONFERENCES & EVENTS, 2023–2024
- TABLE 19 TECHNOLOGY ROADMAP
- TABLE 20 IDENTITY AS A SERVICE MARKET: BUSINESS MODELS
- TABLE 21 IDENTITY AS A SERVICE MARKET, BY COMPONENT, 2017–2022 (USD MILLION)
- TABLE 22 IDENTITY AS A SERVICE MARKET, BY COMPONENT, 2023–2028 (USD MILLION)
- TABLE 23 PROVISIONING: IDENTITY AS A SERVICE MARKET, BY REGION, 2017–2022 (USD MILLION)
- TABLE 24 PROVISIONING: IDENTITY AS A SERVICE MARKET, BY REGION, 2023–2028 (USD MILLION)
- TABLE 25 SINGLE SIGN-ON: IDENTITY AS A SERVICE MARKET, BY REGION, 2017–2022 (USD MILLION)
- TABLE 26 SINGLE SIGN-ON: IDENTITY AS A SERVICE MARKET, BY REGION, 2023–2028 (USD MILLION)
- TABLE 27 ADVANCE AUTHENTICATION: IDENTITY AS A SERVICE MARKET, BY REGION, 2017–2022 (USD MILLION)
- TABLE 28 ADVANCE AUTHENTICATION: IDENTITY AS A SERVICE MARKET, BY REGION, 2023–2028 (USD MILLION)
- TABLE 29 AUDIT, COMPLIANCE, AND GOVERNANCE: IDENTITY AS A SERVICE MARKET, BY REGION, 2017–2022 (USD MILLION)
- TABLE 30 AUDIT, COMPLIANCE, AND GOVERNANCE: IDENTITY AS A SERVICE MARKET, BY REGION, 2023–2028 (USD MILLION)
- TABLE 31 DIRECTORY SERVICES: IDENTITY AS A SERVICE MARKET, BY REGION, 2017–2022 (USD MILLION)
- TABLE 32 DIRECTORY SERVICES: IDENTITY AS A SERVICE MARKET, BY REGION, 2023–2028 (USD MILLION)
- TABLE 33 PASSWORD MANAGEMENT: IDENTITY AS A SERVICE MARKET, BY REGION, 2017–2022 (USD MILLION)
- TABLE 34 PASSWORD MANAGEMENT: IDENTITY AS A SERVICE MARKET, BY REGION, 2023–2028 (USD MILLION)
- TABLE 35 IDENTITY AS A SERVICE MARKET, BY DEPLOYMENT MODE, 2017–2022 (USD MILLION)
- TABLE 36 IDENTITY AS A SERVICE MARKET, BY DEPLOYMENT MODE, 2023–2028 (USD MILLION)
- TABLE 37 PUBLIC CLOUD: IDENTITY AS A SERVICE MARKET, BY REGION, 2017–2022 (USD MILLION)
- TABLE 38 PUBLIC CLOUD: IDENTITY AS A SERVICE MARKET, BY REGION, 2023–2028 (USD MILLION)
- TABLE 39 PRIVATE CLOUD: IDENTITY AS A SERVICE MARKET, BY REGION, 2017–2022 (USD MILLION)
- TABLE 40 PRIVATE CLOUD: IDENTITY AS A SERVICE MARKET, BY REGION, 2023–2028 (USD MILLION)
- TABLE 41 HYBRID CLOUD: IDENTITY AS A SERVICE MARKET, BY REGION, 2017–2022 (USD MILLION)
- TABLE 42 HYBRID CLOUD: IDENTITY AS A SERVICE MARKET, BY REGION, 2023–2028 (USD MILLION)
- TABLE 43 IDENTITY AS A SERVICE MARKET, BY VERTICAL, 2017–2022 (USD MILLION)
- TABLE 44 IDENTITY AS A SERVICE MARKET, BY VERTICAL, 2023–2028 (USD MILLION)
- TABLE 45 BANKING, FINANCIAL SERVICES, AND INSURANCE: IDENTITY AS A SERVICE MARKET, BY REGION, 2017–2022 (USD MILLION)
- TABLE 46 BANKING, FINANCIAL SERVICES, AND INSURANCE: IDENTITY AS A SERVICE MARKET, BY REGION, 2023–2028 (USD MILLION)
- TABLE 47 IT & ITES: IDENTITY AS A SERVICE MARKET, BY REGION, 2017–2022 (USD MILLION)
- TABLE 48 IT & ITES: IDENTITY AS A SERVICE MARKET, BY REGION, 2023–2028 (USD MILLION)
- TABLE 49 ENERGY & UTILITIES: IDENTITY AS A SERVICE MARKET, BY REGION, 2017–2022 (USD MILLION)
- TABLE 50 ENERGY & UTILITIES: IDENTITY AS A SERVICE MARKET, BY REGION, 2023–2028 (USD MILLION)
- TABLE 51 GOVERNMENT: IDENTITY AS A SERVICE MARKET, BY REGION, 2017–2022 (USD MILLION)
- TABLE 52 GOVERNMENT: IDENTITY AS A SERVICE MARKET, BY REGION, 2023–2028 (USD MILLION)
- TABLE 53 MANUFACTURING: IDENTITY AS A SERVICE MARKET, BY REGION, 2017–2022 (USD MILLION)
- TABLE 54 MANUFACTURING: IDENTITY AS A SERVICE MARKET, BY REGION, 2023–2028 (USD MILLION)
- TABLE 55 HEALTHCARE: IDENTITY AS A SERVICE MARKET, BY REGION, 2017–2022 (USD MILLION)
- TABLE 56 HEALTHCARE: IDENTITY AS A SERVICE MARKET, BY REGION, 2023–2028 (USD MILLION)
- TABLE 57 TELECOMMUNICATION: IDENTITY AS A SERVICE MARKET, BY REGION, 2017–2022 (USD MILLION)
- TABLE 58 TELECOMMUNICATION: IDENTITY AS A SERVICE MARKET, BY REGION, 2023–2028 (USD MILLION)
- TABLE 59 OTHER VERTICALS: IDENTITY AS A SERVICE MARKET, BY REGION, 2017–2022 (USD MILLION)
- TABLE 60 OTHER VERTICALS: IDENTITY AS A SERVICE MARKET, BY REGION, 2023–2028 (USD MILLION)
- TABLE 61 IDENTITY AS A SERVICE MARKET, BY REGION, 2017–2022 (USD MILLION)
- TABLE 62 IDENTITY AS A SERVICE MARKET, BY REGION, 2023–2028 (USD MILLION)
- TABLE 63 NORTH AMERICA: IDENTITY AS A SERVICE MARKET, BY COMPONENT, 2017–2022 (USD MILLION)
- TABLE 64 NORTH AMERICA: IDENTITY AS A SERVICE MARKET, BY COMPONENT, 2023–2028 (USD MILLION)
- TABLE 65 NORTH AMERICA: IDENTITY AS A SERVICE MARKET, BY DEPLOYMENT TYPE, 2017–2022 (USD MILLION)
- TABLE 66 NORTH AMERICA: IDENTITY AS A SERVICE MARKET, BY DEPLOYMENT TYPE, 2023–2028 (USD MILLION)
- TABLE 67 NORTH AMERICA: IDENTITY AS A SERVICE MARKET, BY VERTICAL, 2017–2022 (USD MILLION)
- TABLE 68 NORTH AMERICA: IDENTITY AS A SERVICE MARKET, BY VERTICAL, 2023–2028 (USD MILLION)
- TABLE 69 NORTH AMERICA: IDENTITY AS A SERVICE MARKET, BY COUNTRY, 2017–2022 (USD MILLION)
- TABLE 70 NORTH AMERICA: IDENTITY AS A SERVICE MARKET, BY COUNTRY, 2023–2028 (USD MILLION)
- TABLE 71 US: IDENTITY AS A SERVICE MARKET, BY COMPONENT, 2017–2022 (USD MILLION)
- TABLE 72 US: IDENTITY AS A SERVICE MARKET, BY COMPONENT, 2023–2028 (USD MILLION)
- TABLE 73 US: IDENTITY AS A SERVICE MARKET, BY DEPLOYMENT TYPE, 2017–2022 (USD MILLION)
- TABLE 74 US: IDENTITY AS A SERVICE MARKET, BY DEPLOYMENT TYPE, 2023–2028 (USD MILLION)
- TABLE 75 US: IDENTITY AS A SERVICE MARKET, BY VERTICAL, 2017–2022 (USD MILLION)
- TABLE 76 US: IDENTITY AS A SERVICE MARKET, BY VERTICAL, 2023–2028 (USD MILLION)
- TABLE 77 CANADA: IDENTITY AS A SERVICE MARKET, BY COMPONENT, 2017–2022 (USD MILLION)
- TABLE 78 CANADA: IDENTITY AS A SERVICE MARKET, BY COMPONENT, 2023–2028 (USD MILLION)
- TABLE 79 CANADA: IDENTITY AS A SERVICE MARKET, BY DEPLOYMENT TYPE, 2017–2022 (USD MILLION)
- TABLE 80 CANADA: IDENTITY AS A SERVICE MARKET, BY DEPLOYMENT TYPE, 2023–2028 (USD MILLION)
- TABLE 81 CANADA: IDENTITY AS A SERVICE MARKET, BY VERTICAL, 2017–2022 (USD MILLION)
- TABLE 82 CANADA: IDENTITY AS A SERVICE MARKET, BY VERTICAL, 2023–2028 (USD MILLION)
- TABLE 83 EUROPE: IDENTITY AS A SERVICE MARKET, BY COMPONENT, 2017–2022 (USD MILLION)
- TABLE 84 EUROPE: IDENTITY AS A SERVICE MARKET, BY COMPONENT, 2023–2028 (USD MILLION)
- TABLE 85 EUROPE: IDENTITY AS A SERVICE MARKET, BY DEPLOYMENT TYPE, 2017–2022 (USD MILLION)
- TABLE 86 EUROPE: IDENTITY AS A SERVICE MARKET, BY DEPLOYMENT TYPE, 2023–2028 (USD MILLION)
- TABLE 87 EUROPE: IDENTITY AS A SERVICE MARKET, BY VERTICAL, 2017–2022 (USD MILLION)
- TABLE 88 EUROPE: IDENTITY AS A SERVICE MARKET, BY VERTICAL, 2023–2028 (USD MILLION)
- TABLE 89 EUROPE: IDENTITY AS A SERVICE MARKET, BY COUNTRY, 2017–2022 (USD MILLION)
- TABLE 90 EUROPE: IDENTITY AS A SERVICE MARKET, BY COUNTRY, 2023–2028 (USD MILLION)
- TABLE 91 UK: IDENTITY AS A SERVICE MARKET, BY COMPONENT, 2017–2022 (USD MILLION)
- TABLE 92 UK: IDENTITY AS A SERVICE MARKET, BY COMPONENT, 2023–2028 (USD MILLION)
- TABLE 93 UK: IDENTITY AS A SERVICE MARKET, BY DEPLOYMENT TYPE, 2017–2022 (USD MILLION)
- TABLE 94 UK: IDENTITY AS A SERVICE MARKET, BY DEPLOYMENT TYPE, 2023–2028 (USD MILLION)
- TABLE 95 UK: IDENTITY AS A SERVICE MARKET, BY VERTICAL, 2017–2022 (USD MILLION)
- TABLE 96 UK: IDENTITY AS A SERVICE MARKET, BY VERTICAL, 2023–2028 (USD MILLION)
- TABLE 97 GERMANY: IDENTITY AS A SERVICE MARKET, BY COMPONENT, 2017–2022 (USD MILLION)
- TABLE 98 GERMANY: IDENTITY AS A SERVICE MARKET, BY COMPONENT, 2023–2028 (USD MILLION)
- TABLE 99 GERMANY: IDENTITY AS A SERVICE MARKET, BY DEPLOYMENT TYPE, 2017–2022 (USD MILLION)
- TABLE 100 GERMANY: IDENTITY AS A SERVICE MARKET, BY DEPLOYMENT TYPE, 2023–2028 (USD MILLION)
- TABLE 101 GERMANY: IDENTITY AS A SERVICE MARKET, BY VERTICAL, 2017–2022 (USD MILLION)
- TABLE 102 GERMANY: IDENTITY AS A SERVICE MARKET, BY VERTICAL, 2023–2028 (USD MILLION)
- TABLE 103 FRANCE: IDENTITY AS A SERVICE MARKET, BY COMPONENT, 2017–2022 (USD MILLION)
- TABLE 104 FRANCE: IDENTITY AS A SERVICE MARKET, BY COMPONENT, 2023–2028 (USD MILLION)
- TABLE 105 FRANCE: IDENTITY AS A SERVICE MARKET, BY DEPLOYMENT TYPE, 2017–2022 (USD MILLION)
- TABLE 106 FRANCE: IDENTITY AS A SERVICE MARKET, BY DEPLOYMENT TYPE, 2023–2028 (USD MILLION)
- TABLE 107 FRANCE: IDENTITY AS A SERVICE MARKET, BY VERTICAL, 2017–2022 (USD MILLION)
- TABLE 108 FRANCE: IDENTITY AS A SERVICE MARKET, BY VERTICAL, 2023–2028 (USD MILLION)
- TABLE 109 ITALY: IDENTITY AS A SERVICE MARKET, BY COMPONENT, 2017–2022 (USD MILLION)
- TABLE 110 ITALY: IDENTITY AS A SERVICE MARKET, BY COMPONENT, 2023–2028 (USD MILLION)
- TABLE 111 ITALY: IDENTITY AS A SERVICE MARKET, BY DEPLOYMENT TYPE, 2017–2022 (USD MILLION)
- TABLE 112 ITALY: IDENTITY AS A SERVICE MARKET, BY DEPLOYMENT TYPE, 2023–2028 (USD MILLION)
- TABLE 113 ITALY: IDENTITY AS A SERVICE MARKET, BY VERTICAL, 2017–2022 (USD MILLION)
- TABLE 114 ITALY: IDENTITY AS A SERVICE MARKET, BY VERTICAL, 2023–2028 (USD MILLION)
- TABLE 115 REST OF EUROPE: IDENTITY AS A SERVICE MARKET, BY COMPONENT, 2017–2022 (USD MILLION)
- TABLE 116 REST OF EUROPE: IDENTITY AS A SERVICE MARKET, BY COMPONENT, 2023–2028 (USD MILLION)
- TABLE 117 REST OF EUROPE: IDENTITY AS A SERVICE MARKET, BY DEPLOYMENT TYPE, 2017–2022 (USD MILLION)
- TABLE 118 REST OF EUROPE: IDENTITY AS A SERVICE MARKET, BY DEPLOYMENT TYPE, 2023–2028 (USD MILLION)
- TABLE 119 REST OF EUROPE: IDENTITY AS A SERVICE MARKET, BY VERTICAL, 2017–2022 (USD MILLION)
- TABLE 120 REST OF EUROPE: IDENTITY AS A SERVICE MARKET, BY VERTICAL, 2023–2028 (USD MILLION)
- TABLE 121 ASIA PACIFIC: IDENTITY AS A SERVICE MARKET, BY COMPONENT, 2017–2022 (USD MILLION)
- TABLE 122 ASIA PACIFIC: IDENTITY AS A SERVICE MARKET, BY COMPONENT, 2023–2028 (USD MILLION)
- TABLE 123 ASIA PACIFIC: IDENTITY AS A SERVICE MARKET, BY DEPLOYMENT TYPE, 2017–2022 (USD MILLION)
- TABLE 124 ASIA PACIFIC: IDENTITY AS A SERVICE MARKET, BY DEPLOYMENT TYPE, 2023–2028 (USD MILLION)
- TABLE 125 ASIA PACIFIC: IDENTITY AS A SERVICE MARKET, BY VERTICAL, 2017–2022 (USD MILLION)
- TABLE 126 ASIA PACIFIC: IDENTITY AS A SERVICE MARKET, BY VERTICAL, 2023–2028 (USD MILLION)
- TABLE 127 ASIA PACIFIC: IDENTITY AS A SERVICE MARKET, BY COUNTRY, 2017–2022 (USD MILLION)
- TABLE 128 ASIA PACIFIC: IDENTITY AS A SERVICE MARKET, BY COUNTRY, 2023–2028 (USD MILLION)
- TABLE 129 CHINA: IDENTITY AS A SERVICE MARKET, BY COMPONENT, 2017–2022 (USD MILLION)
- TABLE 130 CHINA: IDENTITY AS A SERVICE MARKET, BY COMPONENT, 2023–2028 (USD MILLION)
- TABLE 131 CHINA: IDENTITY AS A SERVICE MARKET, BY DEPLOYMENT TYPE, 2017–2022 (USD MILLION)
- TABLE 132 CHINA: IDENTITY AS A SERVICE MARKET, BY DEPLOYMENT TYPE, 2023–2028 (USD MILLION)
- TABLE 133 CHINA: IDENTITY AS A SERVICE MARKET, BY VERTICAL, 2017–2022 (USD MILLION)
- TABLE 134 CHINA: IDENTITY AS A SERVICE MARKET, BY VERTICAL, 2023–2028 (USD MILLION)
- TABLE 135 JAPAN: IDENTITY AS A SERVICE MARKET, BY COMPONENT, 2017–2022 (USD MILLION)
- TABLE 136 JAPAN: IDENTITY AS A SERVICE MARKET, BY COMPONENT, 2023–2028 (USD MILLION)
- TABLE 137 JAPAN: IDENTITY AS A SERVICE MARKET, BY DEPLOYMENT TYPE, 2017–2022 (USD MILLION)
- TABLE 138 JAPAN: IDENTITY AS A SERVICE MARKET, BY DEPLOYMENT TYPE, 2023–2028 (USD MILLION)
- TABLE 139 JAPAN: IDENTITY AS A SERVICE MARKET, BY VERTICAL, 2017–2022 (USD MILLION)
- TABLE 140 JAPAN: IDENTITY AS A SERVICE MARKET, BY VERTICAL, 2023–2028 (USD MILLION)
- TABLE 141 INDIA: IDENTITY AS A SERVICE MARKET, BY COMPONENT, 2017–2022 (USD MILLION)
- TABLE 142 INDIA: IDENTITY AS A SERVICE MARKET, BY COMPONENT, 2023–2028 (USD MILLION)
- TABLE 143 INDIA: IDENTITY AS A SERVICE MARKET, BY DEPLOYMENT TYPE, 2017–2022 (USD MILLION)
- TABLE 144 INDIA: IDENTITY AS A SERVICE MARKET, BY DEPLOYMENT TYPE, 2023–2028 (USD MILLION)
- TABLE 145 INDIA: IDENTITY AS A SERVICE MARKET, BY VERTICAL, 2017–2022 (USD MILLION)
- TABLE 146 INDIA: IDENTITY AS A SERVICE MARKET, BY VERTICAL, 2023–2028 (USD MILLION)
- TABLE 147 AUSTRALIA: IDENTITY AS A SERVICE MARKET, BY COMPONENT, 2017–2022 (USD MILLION)
- TABLE 148 AUSTRALIA: IDENTITY AS A SERVICE MARKET, BY COMPONENT, 2023–2028 (USD MILLION)
- TABLE 149 AUSTRALIA: IDENTITY AS A SERVICE MARKET, BY DEPLOYMENT TYPE, 2017–2022 (USD MILLION)
- TABLE 150 AUSTRALIA: IDENTITY AS A SERVICE MARKET, BY DEPLOYMENT TYPE, 2023–2028 (USD MILLION)
- TABLE 151 AUSTRALIA: IDENTITY AS A SERVICE MARKET, BY VERTICAL, 2017–2022 (USD MILLION)
- TABLE 152 AUSTRALIA: IDENTITY AS A SERVICE MARKET, BY VERTICAL, 2023–2028 (USD MILLION)
- TABLE 153 REST OF ASIA PACIFIC: IDENTITY AS A SERVICE MARKET, BY COMPONENT, 2017–2022 (USD MILLION)
- TABLE 154 REST OF ASIA PACIFIC: IDENTITY AS A SERVICE MARKET, BY COMPONENT, 2023–2028 (USD MILLION)
- TABLE 155 REST OF ASIA PACIFIC: IDENTITY AS A SERVICE MARKET, BY DEPLOYMENT TYPE, 2017–2022 (USD MILLION)
- TABLE 156 REST OF ASIA PACIFIC: IDENTITY AS A SERVICE MARKET, BY DEPLOYMENT TYPE, 2023–2028 (USD MILLION)
- TABLE 157 REST OF ASIA PACIFIC: IDENTITY AS A SERVICE MARKET, BY VERTICAL, 2017–2022 (USD MILLION)
- TABLE 158 REST OF ASIA PACIFIC: IDENTITY AS A SERVICE MARKET, BY VERTICAL, 2023–2028 (USD MILLION)
- TABLE 159 MIDDLE EAST & AFRICA: IDENTITY AS A SERVICE MARKET, BY COMPONENT, 2017–2022 (USD MILLION)
- TABLE 160 MIDDLE EAST & AFRICA: IDENTITY AS A SERVICE MARKET, BY COMPONENT, 2023–2028 (USD MILLION)
- TABLE 161 MIDDLE EAST & AFRICA: IDENTITY AS A SERVICE MARKET, BY DEPLOYMENT TYPE, 2017–2022 (USD MILLION)
- TABLE 162 MIDDLE EAST & AFRICA: IDENTITY AS A SERVICE MARKET, BY DEPLOYMENT TYPE, 2023–2028 (USD MILLION)
- TABLE 163 MIDDLE EAST & AFRICA: IDENTITY AS A SERVICE MARKET, BY VERTICAL, 2017–2022 (USD MILLION)
- TABLE 164 MIDDLE EAST & AFRICA: IDENTITY AS A SERVICE MARKET, BY VERTICAL, 2023–2028 (USD MILLION)
- TABLE 165 MIDDLE EAST & AFRICA: IDENTITY AS A SERVICE MARKET, BY COUNTRY, 2017–2022 (USD MILLION)
- TABLE 166 MIDDLE EAST & AFRICA: IDENTITY AS A SERVICE MARKET, BY COUNTRY, 2023–2028 (USD MILLION)
- TABLE 167 MIDDLE EAST: IDENTITY AS A SERVICE MARKET, BY COMPONENT, 2017–2022 (USD MILLION)
- TABLE 168 MIDDLE EAST: IDENTITY AS A SERVICE MARKET, BY COMPONENT, 2023–2028 (USD MILLION)
- TABLE 169 MIDDLE EAST: IDENTITY AS A SERVICE MARKET, BY DEPLOYMENT TYPE, 2017–2022 (USD MILLION)
- TABLE 170 MIDDLE EAST: IDENTITY AS A SERVICE MARKET, BY DEPLOYMENT TYPE, 2023–2028 (USD MILLION)
- TABLE 171 MIDDLE EAST: IDENTITY AS A SERVICE MARKET, BY VERTICAL, 2017–2022 (USD MILLION)
- TABLE 172 MIDDLE EAST: IDENTITY AS A SERVICE MARKET, BY VERTICAL, 2023–2028 (USD MILLION)
- TABLE 173 MIDDLE EAST: IDENTITY AS A SERVICE MARKET, BY COUNTRY, 2017–2022 (USD MILLION)
- TABLE 174 MIDDLE EAST: IDENTITY AS A SERVICE MARKET, BY COUNTRY, 2023–2028 (USD MILLION)
- TABLE 175 UAE: IDENTITY AS A SERVICE MARKET, BY COMPONENT, 2017–2022 (USD MILLION)
- TABLE 176 UAE: IDENTITY AS A SERVICE MARKET, BY COMPONENT, 2023–2028 (USD MILLION)
- TABLE 177 UAE: IDENTITY AS A SERVICE MARKET, BY DEPLOYMENT TYPE, 2017–2022 (USD MILLION)
- TABLE 178 UAE: IDENTITY AS A SERVICE MARKET, BY DEPLOYMENT TYPE, 2023–2028 (USD MILLION)
- TABLE 179 UAE: IDENTITY AS A SERVICE MARKET, BY VERTICAL, 2017–2022 (USD MILLION)
- TABLE 180 UAE: IDENTITY AS A SERVICE MARKET, BY VERTICAL, 2023–2028 (USD MILLION)
- TABLE 181 KSA: IDENTITY AS A SERVICE MARKET, BY COMPONENT, 2017–2022 (USD MILLION)
- TABLE 182 KSA: IDENTITY AS A SERVICE MARKET, BY COMPONENT, 2023–2028 (USD MILLION)
- TABLE 183 KSA: IDENTITY AS A SERVICE MARKET, BY DEPLOYMENT TYPE, 2017–2022 (USD MILLION)
- TABLE 184 KSA: IDENTITY AS A SERVICE MARKET, BY DEPLOYMENT TYPE, 2023–2028 (USD MILLION)
- TABLE 185 KSA: IDENTITY AS A SERVICE MARKET, BY VERTICAL, 2017–2022 (USD MILLION)
- TABLE 186 KSA: IDENTITY AS A SERVICE MARKET, BY VERTICAL, 2023–2028 (USD MILLION)
- TABLE 187 REST OF MIDDLE EAST: IDENTITY AS A SERVICE MARKET, BY COMPONENT, 2017–2022 (USD MILLION)
- TABLE 188 REST OF MIDDLE EAST: IDENTITY AS A SERVICE MARKET, BY COMPONENT, 2023–2028 (USD MILLION)
- TABLE 189 REST OF MIDDLE EAST: IDENTITY AS A SERVICE MARKET, BY DEPLOYMENT TYPE, 2017–2022 (USD MILLION)
- TABLE 190 REST OF MIDDLE EAST: IDENTITY AS A SERVICE MARKET, BY DEPLOYMENT TYPE, 2023–2028 (USD MILLION)
- TABLE 191 REST OF MIDDLE EAST: IDENTITY AS A SERVICE MARKET, BY VERTICAL, 2017–2022 (USD MILLION)
- TABLE 192 REST OF MIDDLE EAST: IDENTITY AS A SERVICE MARKET, BY VERTICAL, 2023–2028 (USD MILLION)
- TABLE 193 AFRICA: IDENTITY AS A SERVICE MARKET, BY COMPONENT, 2017–2022 (USD MILLION)
- TABLE 194 AFRICA: IDENTITY AS A SERVICE MARKET, BY COMPONENT, 2023–2028 (USD MILLION)
- TABLE 195 AFRICA: IDENTITY AS A SERVICE MARKET, BY DEPLOYMENT TYPE, 2017–2022 (USD MILLION)
- TABLE 196 AFRICA: IDENTITY AS A SERVICE MARKET, BY DEPLOYMENT TYPE, 2023–2028 (USD MILLION)
- TABLE 197 AFRICA: IDENTITY AS A SERVICE MARKET, BY VERTICAL, 2017–2022 (USD MILLION)
- TABLE 198 AFRICA: IDENTITY AS A SERVICE MARKET, BY VERTICAL, 2023–2028 (USD MILLION)
- TABLE 199 LATIN AMERICA: IDENTITY AS A SERVICE MARKET, BY COMPONENT, 2017–2022 (USD MILLION)
- TABLE 200 LATIN AMERICA: IDENTITY AS A SERVICE MARKET, BY COMPONENT, 2023–2028 (USD MILLION)
- TABLE 201 LATIN AMERICA: IDENTITY AS A SERVICE MARKET, BY DEPLOYMENT TYPE, 2017–2022 (USD MILLION)
- TABLE 202 LATIN AMERICA: IDENTITY AS A SERVICE MARKET, BY DEPLOYMENT TYPE, 2023–2028 (USD MILLION)
- TABLE 203 LATIN AMERICA: IDENTITY AS A SERVICE MARKET, BY VERTICAL, 2017–2022 (USD MILLION)
- TABLE 204 LATIN AMERICA: IDENTITY AS A SERVICE MARKET, BY VERTICAL, 2023–2028 (USD MILLION)
- TABLE 205 LATIN AMERICA: IDENTITY AS A SERVICE MARKET, BY COUNTRY, 2017–2022 (USD MILLION)
- TABLE 206 LATIN AMERICA: IDENTITY AS A SERVICE MARKET, BY COUNTRY, 2023–2028 (USD MILLION)
- TABLE 207 BRAZIL: IDENTITY AS A SERVICE MARKET, BY COMPONENT, 2017–2022 (USD MILLION)
- TABLE 208 BRAZIL: IDENTITY AS A SERVICE MARKET, BY COMPONENT, 2023–2028 (USD MILLION)
- TABLE 209 BRAZIL: IDENTITY AS A SERVICE MARKET, BY DEPLOYMENT TYPE, 2017–2022 (USD MILLION)
- TABLE 210 BRAZIL: IDENTITY AS A SERVICE MARKET, BY DEPLOYMENT TYPE, 2023–2028 (USD MILLION)
- TABLE 211 BRAZIL: IDENTITY AS A SERVICE MARKET, BY VERTICAL, 2017–2022 (USD MILLION)
- TABLE 212 BRAZIL: IDENTITY AS A SERVICE MARKET, BY VERTICAL, 2023–2028 (USD MILLION)
- TABLE 213 MEXICO: IDENTITY AS A SERVICE MARKET, BY COMPONENT, 2017–2022 (USD MILLION)
- TABLE 214 MEXICO: IDENTITY AS A SERVICE MARKET, BY COMPONENT, 2023–2028 (USD MILLION)
- TABLE 215 MEXICO: IDENTITY AS A SERVICE MARKET, BY DEPLOYMENT TYPE, 2017–2022 (USD MILLION)
- TABLE 216 MEXICO: IDENTITY AS A SERVICE MARKET, BY DEPLOYMENT TYPE, 2023–2028 (USD MILLION)
- TABLE 217 MEXICO: IDENTITY AS A SERVICE MARKET, BY VERTICAL, 2017–2022 (USD MILLION)
- TABLE 218 MEXICO: IDENTITY AS A SERVICE MARKET, BY VERTICAL, 2023–2028 (USD MILLION)
- TABLE 219 REST OF LATIN AMERICA: IDENTITY AS A SERVICE MARKET, BY COMPONENT, 2017–2022 (USD MILLION)
- TABLE 220 REST OF LATIN AMERICA: IDENTITY AS A SERVICE MARKET, BY COMPONENT, 2023–2028 (USD MILLION)
- TABLE 221 REST OF LATIN AMERICA: IDENTITY AS A SERVICE MARKET, BY DEPLOYMENT TYPE, 2017–2022 (USD MILLION)
- TABLE 222 REST OF LATIN AMERICA: IDENTITY AS A SERVICE MARKET, BY DEPLOYMENT TYPE, 2023–2028 (USD MILLION)
- TABLE 223 REST OF LATIN AMERICA: IDENTITY AS A SERVICE MARKET, BY VERTICAL, 2017–2022 (USD MILLION)
- TABLE 224 REST OF LATIN AMERICA: IDENTITY AS A SERVICE MARKET, BY VERTICAL, 2023–2028 (USD MILLION)
- TABLE 225 IDENTITY AS A SERVICE MARKET: INTENSITY OF COMPETITIVE RIVALRY
- TABLE 226 VERTICAL FOOTPRINT
- TABLE 227 REGIONAL FOOTPRINT
- TABLE 228 OVERALL COMPANY FOOTPRINT
- TABLE 229 DETAILED LIST OF START-UPS/SMES
- TABLE 230 COMPETITIVE BENCHMARKING OF START-UPS/SMES, VERTICAL FOOTPRINT
- TABLE 231 COMPETITIVE BENCHMARKING OF START-UPS/SMES, REGIONAL FOOTPRINT
- TABLE 232 IDENTITY AS A SERVICE MARKET: PRODUCT LAUNCHES & ENHANCEMENTS, 2021–2023
- TABLE 233 IDENTITY AS A SERVICE MARKET: DEALS, 2021—2023
- TABLE 234 OKTA: COMPANY OVERVIEW
- TABLE 235 OKTA: PRODUCTS/SOLUTIONS/SERVICES OFFERED
- TABLE 236 OKTA: PRODUCT LAUNCHES & ENHANCEMENTS
- TABLE 237 OKTA: DEALS
- TABLE 238 MICROSOFT: COMPANY OVERVIEW
- TABLE 239 MICROSOFT: PRODUCTS/SOLUTIONS/SERVICES OFFERED
- TABLE 240 MICROSOFT: PRODUCT LAUNCHES & ENHANCEMENTS
- TABLE 241 MICROSOFT: DEALS
- TABLE 242 THALES GROUP: COMPANY OVERVIEW
- TABLE 243 THALES GROUP: PRODUCTS/SOLUTIONS/SERVICES OFFERED
- TABLE 244 THALES GROUP: PRODUCT LAUNCHES & ENHANCEMENTS
- TABLE 245 THALES GROUP: DEALS
- TABLE 246 PING IDENTITY: COMPANY OVERVIEW
- TABLE 247 PING IDENTITY: PRODUCTS/SOLUTIONS/SERVICES OFFERED
- TABLE 248 PING IDENTITY: PRODUCT LAUNCHES & ENHANCEMENTS
- TABLE 249 PING IDENTITY: DEALS
- TABLE 250 IBM: COMPANY OVERVIEW
- TABLE 251 IBM: PRODUCTS/SOLUTIONS/SERVICES OFFERED
- TABLE 252 IBM: PRODUCT LAUNCHES & ENHANCEMENTS
- TABLE 253 IBM: DEALS
- TABLE 254 ATOS: BUSINESS OVERVIEW
- TABLE 255 ATOS: PRODUCTS/SOLUTIONS/SERVICES OFFERED
- TABLE 256 ATOS: PRODUCT LAUNCHES & ENHANCEMENTS
- TABLE 257 ATOS: DEALS
- TABLE 258 ORACLE: COMPANY OVERVIEW
- TABLE 259 ORACLE: PRODUCTS/SOLUTIONS/SERVICES OFFERED
- TABLE 260 ORACLE: PRODUCT LAUNCHES & ENHANCEMENTS
- TABLE 261 ORACLE: DEALS
- TABLE 262 SALESFORCE: COMPANY OVERVIEW
- TABLE 263 SALESFORCE: PRODUCTS/SOLUTIONS/SERVICES OFFERED
- TABLE 264 SALESFORCE: DEALS
- TABLE 265 GOOGLE: COMPANY OVERVIEW
- TABLE 266 GOOGLE: PRODUCTS/SOLUTIONS/SERVICES OFFERED
- TABLE 267 GOOGLE: PRODUCT LAUNCHES & ENHANCEMENTS
- TABLE 268 GOOGLE: DEALS
- TABLE 269 CYBERARK: COMPANY OVERVIEW
- TABLE 270 CYBERARK: PRODUCTS/SOLUTIONS/SERVICES OFFERED
- TABLE 271 CYBERARK: PRODUCT LAUNCHES & ENHANCEMENTS
- TABLE 272 CYBERARK: DEALS
- TABLE 273 ADJACENT MARKETS AND FORECASTS
- TABLE 274 DIGITAL IDENTITY SOLUTIONS MARKET, BY OFFERING, 2017–2022 (USD MILLION)
- TABLE 275 DIGITAL IDENTITY SOLUTIONS MARKET, BY OFFERING, 2023–2028 (USD MILLION)
- TABLE 276 SERVICES: DIGITAL IDENTITY SOLUTIONS MARKET, BY REGION, 2017–2022 USD MILLION)
- TABLE 277 SERVICES: DIGITAL IDENTITY SOLUTIONS MARKET, BY REGION, 2023–2028 (USD MILLION)
- TABLE 278 MULTI-FACTOR AUTHENTICATION MARKET, BY COMPONENT, 2017–2022 (USD MILLION)
- TABLE 279 MULTI-FACTOR AUTHENTICATION MARKET, BY COMPONENT, 2023–2028 (USD MILLION)
- TABLE 280 SERVICES: MULTI-FACTOR AUTHENTICATION MARKET, BY REGION, 2017–2022 (USD MILLION)
- TABLE 281 SERVICES: MULTI-FACTOR AUTHENTICATION MARKET, BY REGION, 2023–2028 (USD MILLION)
- FIGURE 1 IDENTITY AS A SERVICE MARKET: RESEARCH DESIGN
- FIGURE 2 BREAKDOWN OF PRIMARY INTERVIEWS: BY COMPANY TYPE, DESIGNATION, AND REGION
- FIGURE 3 DATA TRIANGULATION
- FIGURE 4 IDENTITY AS A SERVICE MARKET ESTIMATION: RESEARCH FLOW
- FIGURE 5 MARKET SIZE ESTIMATION METHODOLOGY — APPROACH 1, SUPPLY-SIDE ANALYSIS: REVENUE FROM SERVICES OF IDENTITY AS A SERVICE VENDORS
- FIGURE 6 MARKET SIZE ESTIMATION METHODOLOGY — APPROACH 2, SUPPLY-SIDE ANALYSIS
- FIGURE 7 MARKET SIZE ESTIMATION METHODOLOGY — APPROACH 3, BOTTOM-UP (SUPPLY SIDE): COLLECTIVE REVENUE FROM SERVICES OF IDENTITY AS A SERVICE VENDORS
- FIGURE 8 MARKET SIZE ESTIMATION METHODOLOGY — APPROACH 1, TOP-DOWN (DEMAND SIDE)
- FIGURE 9 IDENTITY AS A SERVICE MARKET: SEGMENTS WITH HIGH GROWTH RATE
- FIGURE 10 NORTH AMERICA TO ACCOUNT FOR LARGEST SHARE IN 2023
- FIGURE 11 GROWING INSTANCES OF DATA BREACHES AND STRINGENT REGULATIONS TO DRIVE MARKET
- FIGURE 12 PROVISIONING SEGMENT TO ACCOUNT FOR LARGEST MARKET BY 2028
- FIGURE 13 PUBLIC CLOUD SEGMENT TO ACCOUNT FOR LARGEST MARKET DURING FORECAST PERIOD
- FIGURE 14 BFSI SEGMENT AND NORTH AMERICA TO ACCOUNT FOR SIGNIFICANT SHARE IN 2023
- FIGURE 15 ASIA PACIFIC TO EMERGE AS LUCRATIVE MARKET FOR INVESTMENTS IN NEXT 5 YEARS
- FIGURE 16 IDENTITY AS A SERVICE MARKET: DRIVERS, RESTRAINTS, OPPORTUNITIES, AND CHALLENGES
- FIGURE 17 VALUE CHAIN ANALYSIS
- FIGURE 18 ECOSYSTEM: IDENTITY AS A SERVICE MARKET
- FIGURE 19 PORTER’S FIVE FORCES ANALYSIS
- FIGURE 20 AVERAGE SELLING PRICE TRENDS OF KEY PLAYERS, BY COMPONENT
- FIGURE 21 LIST OF MAJOR PATENTS GRANTED, 2013–2023
- FIGURE 22 REGIONAL ANALYSIS OF PATENTS GRANTED
- FIGURE 23 TRENDS AND DISRUPTIONS IMPACTING CUSTOMERS’ BUSINESSES
- FIGURE 24 INFLUENCE OF STAKEHOLDERS ON BUYING PROCESS FOR TOP THREE VERTICALS
- FIGURE 25 KEY BUYING CRITERIA FOR TOP THREE VERTICALS
- FIGURE 26 SINGLE SIGN-ON SEGMENT TO GROW AT HIGHEST CAGR DURING FORECAST PERIOD
- FIGURE 27 PRIVATE CLOUD SEGMENT TO GROW AT HIGHEST RATE DURING FORECAST PERIOD
- FIGURE 28 BFSI SEGMENT TO ACCOUNT FOR LARGEST MARKET DURING FORECAST PERIOD
- FIGURE 29 ASIA PACIFIC TO GROW AT HIGHEST CAGR DURING FORECAST PERIOD
- FIGURE 30 NORTH AMERICA: MARKET SNAPSHOT
- FIGURE 31 ASIA PACIFIC: MARKET SNAPSHOT
- FIGURE 32 TOP 5 PLAYERS HAVE DOMINATED THE MARKET IN LAST 5 YEARS
- FIGURE 33 SHARE OF LEADING COMPANIES IN IDENTITY AS A SERVICE MARKET
- FIGURE 34 IDENTITY AS A SERVICE MARKET: COMPANY EVALUATION MATRIX, 2022
- FIGURE 35 PRODUCT FOOTPRINT
- FIGURE 36 IDENTITY AS A SERVICE MARKET: START-UP/SME EVALUATION MATRIX, 2022
- FIGURE 37 OKTA: COMPANY SNAPSHOT
- FIGURE 38 MICROSOFT: COMPANY SNAPSHOT
- FIGURE 39 THALES GROUP: COMPANY SNAPSHOT
- FIGURE 40 IBM: COMPANY SNAPSHOT
- FIGURE 41 ATOS: COMPANY SNAPSHOT
- FIGURE 42 ORACLE: COMPANY SNAPSHOT
- FIGURE 43 SALESFORCE: COMPANY SNAPSHOT
- FIGURE 44 CYBERARK: COMPANY SNAPSHOT
The study involved major activities in estimating the current market size for the IDaaS market. Exhaustive secondary research was done to collect information on the IDaaS industry. The next step was to validate these findings, assumptions, and sizing with industry experts across the value chain using primary research. Different approaches, such as top-down and bottom-up, were employed to estimate the total market size. After that, the market breakup and data triangulation procedures were used to estimate the market size of the segments and subsegments of the IDaaS market.
Secondary Research
Secondary research was used to obtain key information about the industry’s supply chain, country-wise technology spending, the total pool of key players, market classification and segmentation, key developments from market and technology-oriented perspectives, economic trends, and currency exchange rates. For instance, the market size of companies offering IDaaS to various verticals is based on the secondary data available through paid databases and publicly available information.
In the secondary research process, various sources were referred to for identifying and collecting information, including annual reports, press releases, and investor presentations of companies; white papers, journals, and certified publications; articles from recognized authors; directories; and databases. The product portfolio of the major companies in the ecosystem was analyzed, and the companies were rated based on their performance and quality.
Primary Research
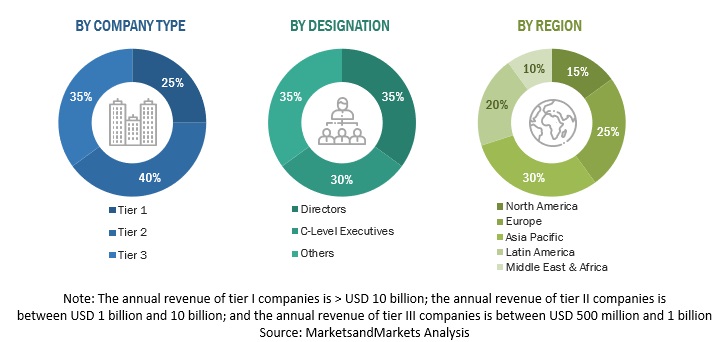
In the primary research process, various sources from both the supply and demand sides were interviewed to obtain qualitative and quantitative information for this report. The primary sources from the supply side included various industry experts, including Chief Executive Officers (CEOs), Vice Presidents (VPs), marketing directors, technology and innovation directors, and related key executives from various key companies and organizations operating on the IDaaS market.
In the market engineering process, top-down and bottom-up approaches and several data triangulation methods were extensively used to perform market estimation and market forecasting for the overall market segments and sub-segments listed in the report. Extensive qualitative and quantitative analysis was performed on the complete market engineering process to list key information/insights throughout the report.
Following is the breakup of the primary study:
To know about the assumptions considered for the study, download the pdf brochure
Market Size Estimation
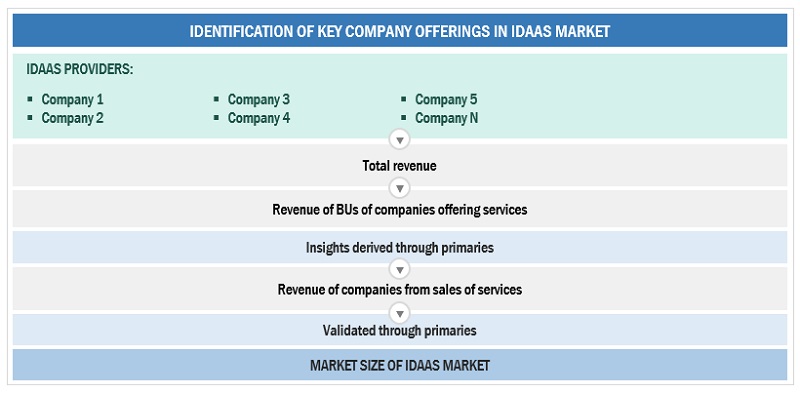
In the market engineering process, top-down and bottom-up approaches and several data triangulation methods were extensively used to perform market estimation and market forecasting for the overall market segments and subsegments listed in the report. Extensive qualitative and quantitative analysis was performed on the complete market engineering process to list key information/insights throughout the report. This entire procedure included the study of the annual and financial reports of top market players and extensive interviews for key insights from industry leaders, such as CEOs, VPs, directors, and marketing executives. All percentage splits and breakups were determined using secondary sources and verified through primary sources. All possible parameters that affect the market covered in this research study have been accounted for, viewed in extensive detail, verified through primary research, and analyzed to get the final quantitative and qualitative data. The data is consolidated and added to detailed inputs and analysis from MarketsandMarkets.
Top-Down approach:
To know about the assumptions considered for the study, Request for Free Sample Report
Data Triangulation
After arriving at the overall market size using the market size estmation processes explained above, the market was split into several segments and subsegments. The data triangulation and market breakup procedures were employed, wherever applicable, to complete the overall market engineering process and arrive at the exact statistics of each market segment and subsegment. The data was triangulated by studying various factors and trends from both the demand and supply sides.
Market Definition
Identity as a Service (IDaaS) refers to Identity and Access Management (IAM) services offered through the cloud or Software-as-a-Service (SaaS) on a subscription basis. IDaaS enables users to connect and use identity management services from the cloud. Software vendors continuously follow the transition features from on-premises to the cloud by keeping their functions and data in the cloud. It has led to an increased usage of IDaaS, an authentication infrastructure kept in the cloud. IDaaS comprises cloud-based solutions that provide IAM and access governance capabilities as a service, ranging from Single Sign-On (SSO) to identity provisioning and access governance.
Key Stakeholders
- Chief technology and data officers
- Managed Security Service Providers (MSSPs)
- IDaaS vendors
- Business analysts
- Information Technology (IT) professionals
- Investors and venture capitalists
- Third-party providers
- Consultants/consultancies/advisory firms
- Retail and eCommerce vendors
- Project managers
Report Objectives
- To describe and forecast the global IDaaS market by component, deployment type, vertical, and region.
- To forecast the market size of five main regions: North America, Europe, Asia Pacific, Middle East & Africa, and Latin America
- To analyze the subsegments of the market concerning individual growth trends, prospects, and contributions to the overall market
- To provide detailed information on significant factors (drivers, restraints, opportunities, and challenges) influencing the market’s growth
- To analyze the opportunities in the market for stakeholders and provide the competitive landscape details of major players
- To profile the key players of the IDaaS market and comprehensively analyze their market shares and core competencies
- Track and analyze competitive developments, such as mergers and acquisitions (M&A), new product developments, and partnerships and collaborations in the market.
Customization Options
With the given market data, MarketsandMarkets offers customizations based on company-specific needs. The following customization options are available for the report:
Geographic Analysis
- Further breakup of the Asia Pacific market into countries contributing 75% to the regional market size
- Further breakup of the North American market into countries contributing 75% to the regional market size
- Further breakup of the Latin American market into countries contributing 75% to the regional market size
- Further breakup of the Middle Eastern and African market into countries contributing 75% to the regional market size
- Further breakup of the European market into countries contributing 75% to the regional market size
Company Information
- Detailed analysis and profiling of additional market players (up to 5)
Growth opportunities and latent adjacency in IDaaS Market
What could be role of AI in the Identity as a Service (IDaaS) Market?