Hard Coatings Market

Report Code CH 4717
Published in Feb, 2024, By MarketsandMarkets™
Download PDF

Choose License Type

Buy Report Now Inquire Before Buying

Hard Coatings Market by Material Type (Nitrides, Oxides, Carbides, Carbon, Borides, Multi-Component), Deposition Techniques (PVD, CVD), Application, End-use industry, and Region (North America, Europe, APAC, South America, MEA) - Global Forecast to 2028

Overview

The hard coatings market is projected to grow from USD 1.2 billion in 2023 to USD 1.7 billion by 2028, at a CAGR of 7.0% between 2023 and 2028. Cutting tools, by application segment in the Asia Pacific region is expecting a boom in the forecasted period and will lead to an increase in the demand for hard coatings. The rise of precision engineering and the need for high-performance tools in machining and cutting applications further drive the demand for specialized coatings. With increasing focus on cost-efficiency and sustainability, manufacturers are investing in hard coatings to extend tool lifespan, reduce downtime, and optimize production processes, thus driving the growth of this market segment.

Attractive Opportunities in the Hard Coatings Market

ASIA PACIFIC

Market growth in Asia Pacific can be attributed to growing manufacturing sector.

Growing manufacturing industry is driving the global hard coatings market.

Mergers & acquisitions and investments & expansions are the key strategies adopted by companies operating in this market.

The cutting tools and decorative coatings applications presents the two biggest opportunity for growth of the market.

The global hard coatings market is projected to grow at a CAGR of 7.0% in terms of value, during the forecast period.

Global Hard Coatings Market Dynamics

DRIVERS: The growing need for PVD in the medical devices and equipment sector is driving the surge in sales for hard coatings

The growing need for Physical Vapor Deposition (PVD) coatings in the medical devices and equipment sector is fueling a surge in sales for hard coatings. As medical technology advances, there's an increasing demand for components and instruments that offer superior durability, biocompatibility, and wear resistance. PVD coatings, such as titanium nitride (TiN) and diamond-like carbon (DLC), provide excellent protection against corrosion, abrasion, and friction, making them ideal for medical applications. These coatings enhance the lifespan and performance of surgical tools, implants, and diagnostic equipment, ensuring reliability and safety in critical medical procedures. Moreover, PVD coatings offer precise control over coating thickness and composition, allowing for customized solutions tailored to specific medical device requirements. As the healthcare industry continues to grow and innovate, the adoption of PVD coatings in medical devices and equipment is expected to further drive sales growth in the hard coatings market.

RESTRAINTS: Huge total cost of ownership

The considerable total cost of ownership serves as a significant restraint on the market for hard coatings. While these coatings offer enhanced durability and performance, the initial investment required for coating application equipment, materials, and maintenance can be substantial. Additionally, the complexity of coating processes and the need for skilled personnel further add to the overall cost. Moreover, periodic reapplication or maintenance of hard coatings may be necessary to maintain optimal performance, adding to the total cost over time. Furthermore, the need for specialized equipment and facilities for coating application may pose logistical challenges and increase operational expenses for businesses. As a result, some companies may be deterred from adopting hard coatings due to the perceived high total cost of ownership, especially in industries with tight budget constraints or uncertain market conditions. Addressing these cost-related concerns through technological advancements, process optimization, and cost-effective solutions could help alleviate this restraint and encourage wider adoption of hard coatings across industries.


OPPORTUNITIES: BRICS countries offer untapped opportunities for geographical expansion for hard coating manufacturers

Expanding into BRICS countries presents significant untapped opportunities for hard coating manufacturers. The BRICS nations (Brazil, Russia, India, China, and South Africa) collectively represent a large and rapidly growing market with diverse industrial sectors, including automotive, aerospace, electronics, and construction. These countries are experiencing rapid industrialization, infrastructure development, and technological advancements, driving increased demand for high-performance coatings to enhance the durability and longevity of machinery, equipment, and infrastructure. Moreover, rising disposable incomes and evolving consumer preferences in BRICS countries create additional demand for premium products with superior quality and longevity, further fueling the market for hard coatings. By strategically entering these markets, hard coating manufacturers can capitalize on the growing demand, expand their customer base, and diversify their revenue streams. Additionally, establishing a presence in BRICS countries allows manufacturers to leverage local partnerships, resources, and distribution networks to maximize market penetration and achieve sustainable growth in the global hard coating market.

CHALLENGES: Developing Cheaper Substitute

Developing a cheaper substitute presents a significant challenge in the hard coating market due to several factors. Hard coatings are engineered to withstand extreme conditions and provide superior protection against wear, corrosion, and friction, requiring advanced materials and precise manufacturing processes. Achieving comparable performance at a lower cost without compromising quality and durability is inherently challenging. The research and development required to innovate and optimize coating materials and processes entail substantial investment and expertise, further adding to the cost. Additionally, cost-effective substitutes may lack the necessary performance characteristics, making them unsuitable for demanding applications in industries such as automotive, aerospace, and manufacturing.

Global Hard Coatings Market Ecosystem Analysis

Prominent companies in this market include well established, financially stable manufacturers of Automotive coatings. These companies have been operating in the market for several years and possess a diversified product portfolio and strong global sales and marketing networks. Prominent companies in the market include OC Oerlikon Management AG (Switzerland), Momentive (US), Cemecon AG (US), Carl Zeiss Meditec AG (Germany), and SDC Technologies, Inc. (US).

Nitrides by material type are expected to register the second highest CAGR during the forecast period.

Optional hardness, wear resistance, and corrosion protection, making them highly sought-after in various industries such as automotive, aerospace, and manufacturing. The robust growth of nitrides can be attributed to their versatile applications across a wide range of substrates and operating conditions. Additionally, advancements in coating technologies and deposition techniques continue to enhance the performance and applicability of nitride coatings, further driving their adoption. Moreover, the increasing demand for durable and high-performance coatings in emerging markets like Asia-Pacific and Latin America contributes to the anticipated growth of nitrides during the forecast period. Overall, nitrides are poised to experience significant growth, presenting lucrative opportunities for players in the hard coatings market.

ASIA PACIFIC (INDIA) Region Holds the Largest Share of the Hard Coatings Market

India emerges as the fastest-growing hard coatings market due to several compelling factors. Firstly, the country's rapid industrialization, fueled by initiatives such as "Make in India," drives demand for hard coatings across diverse sectors, including automotive, aerospace, electronics, and manufacturing. As industries expand and modernize, there is an increasing need for coatings that enhance the durability and performance of critical components, machinery, and infrastructure. Secondly, India's growing middle class and rising disposable incomes fuel demand for high-quality products with longer lifespans, particularly in consumer electronics and automotive sectors, where hard coatings play a crucial role. Additionally, supportive government policies and investments in infrastructure development further bolster market growth. Moreover, advancements in coating technologies, coupled with a skilled workforce and robust research and development activities, contribute to the rapid expansion of the hard coatings market in India. Overall, these factors position India as a key growth driver in the global hard coatings market.


Recent Developments of Hard Coatings Market industry

  • In June 2023, Oerlikon and MTU Aero Engines have forged a partnership to advance the development of engine components, materials, and surface technologies for aero engines jointly. This partnership is formalized through a five-year agreement, during which both entities will leverage their distinct technological knowledge and industry experience to enhance the efficiency and sustainability of engine parts.
  • In December 2023, Carl Zeiss Meditec AG finalized an agreement to purchase all the Dutch Ophthalmic Research Center (International) B.V. (D.O.R.C.) Shares from the investment firm Eurazeo SE are based in Paris, France. This acquisition is set to strengthen and augment Zeiss Medical Technology’s extensive ophthalmic portfolio and its assortment of digitally integrated workflow solutions designed to address diverse eye conditions such as retinal disorder, cataracts, glaucoma, and refractive errors.

Key Market Players

Want to explore hidden markets that can drive new revenue in Hard Coatings Market?

Scope of the Report

Report Attribute Details
Market size available for years 2021-2028
Base year considered 2022
Forecast Period 2023-2028
Forecast Units Value (USD million/billion)
Segments Covered By Material Type, By Deposition Techniques, By Application, By End use industry, By Region
Geographies Covered Asia Pacific, Europe, North America, Middle East & Africa and South America
Companies covered OC Oerlikon Management AG (Switzerland), Momentive (US), Cemecon AG (US), Carl Zeiss Meditec AG (Germany), and SDC Technologies, Inc. (US) A total of 25 players are covered.

Key Questions Addressed by the Report

What is the major material type for hard coatings?
The major material type of hard coatings are Nitrides, Oxides, Carbides, Carbon, Borides, and Multi-Component.
Who are the major manufacturers?
OC Oerlikon Management AG (Switzerland), Momentive (US), Cemecon AG (US), Carl Zeiss Meditec AG (Germany), and SDC Technologies, Inc. (US) are some of the leading players operating in the global automotive coatings market.
What are the reasons behind hard coatings gaining market share?
Hard coatings are gaining market share due to growing manufacturing sector and sales in Asia Pacific region.
Which is the largest region in the hard coatings market?
Asia Pacific is the largest region in hard coatings market. .
What are the latest technological advancements in hard coatings for U.S. manufacturers?
U.S. manufacturers are increasingly adopting advanced hard coating technologies like Physical Vapor Deposition (PVD) and Chemical Vapor Deposition (CVD). These methods enable the development of ultra-thin, highly durable coatings with improved resistance to wear, heat, and corrosion. Recent innovations also include nanocoatings and multifunctional coatings designed for aerospace, medical devices, and industrial tools.
How is the UK hard coatings market addressing sustainability concerns?
The UK hard coatings market is adopting sustainable practices by reducing the use of hazardous materials and focusing on energy-efficient coating processes. The development of water-based and eco-friendly hard coatings is gaining traction, especially in the automotive and construction industries. Additionally, companies are investing in recycling and refurbishing coated tools and components to promote a circular economy.
What are the primary applications of hard coatings in the U.S. market?
In the United States, hard coatings are primarily used in industrial applications such as protective coatings for tools and machinery to enhance wear resistance and extend lifespan. They are also widely utilized in the automotive industry for parts that require durability and scratch resistance. Additionally, hard coatings find applications in electronics, providing protection for components against environmental factors, and in medical devices, where they improve biocompatibility and longevity.
How is the demand for hard coatings evolving in the UK?
In the UK, the demand for hard coatings is increasing due to advancements in manufacturing processes and a growing emphasis on sustainability. Industries such as aerospace and automotive are driving this trend by seeking coatings that offer enhanced performance and reduced environmental impact. Additionally, the rise of smart technologies is creating new opportunities for hard coatings in electronic devices, further shaping market dynamics as companies look for solutions that provide both durability and functionality.


Personalize This Research

  • Triangulate with your Own Data
  • Get Data as per your Format and Definition
  • Gain a Deeper Dive on a Specific Application, Geography, Customer or Competitor
  • Any level of Personalization
Request A Free Customisation

Let Us Help You

  • What are the Known and Unknown Adjacencies Impacting the Hard Coatings Market
  • What will your New Revenue Sources be?
  • Who will be your Top Customer; what will make them switch?
  • Defend your Market Share or Win Competitors
  • Get a Scorecard for Target Partners
Customized Workshop Request

Table of Contents

Exclusive indicates content/data unique to MarketsandMarkets and not available with any competitors.

TITLE
PAGE NO
INTRODUCTION
27
RESEARCH METHODOLOGY
35
EXECUTIVE SUMMARY
46
PREMIUM INSIGHTS
51
MARKET OVERVIEW
54
  • 5.1 INTRODUCTION
  • 5.2 MARKET DYNAMICS
    DRIVERS
    - Growing need for PVD in medical devices and equipment sector
    - Rapid expansion of food processing industry
    - Efficiency of hard coatings
    RESTRAINTS
    - Huge total cost of ownership
    OPPORTUNITIES
    - Untapped markets in BRICS countries
    - Technological developments
    CHALLENGES
    - Developing cheaper substitutes
  • 5.3 PORTER’S FIVE FORCES ANALYSIS
    THREAT OF NEW ENTRANTS
    THREAT OF SUBSTITUTES
    BARGAINING POWER OF SUPPLIERS
    BARGAINING POWER OF BUYERS
    INTENSITY OF COMPETITIVE RIVALRY
  • 5.4 MACROECONOMIC INDICATORS
    INTRODUCTION
    GDP TRENDS AND FORECAST
    TRENDS & FORECAST OF GLOBAL AUTOMOTIVE INDUSTRY
    TRENDS & FORECAST OF GLOBAL AVIATION INDUSTRY
INDUSTRY TRENDS
64
  • 6.1 SUPPLY CHAIN ANALYSIS
  • 6.2 ECOSYSTEM MAP
  • 6.3 GLOBAL ECONOMIC SCENARIO AFFECTING MARKET GROWTH
    RUSSIA-UKRAINE WAR
    CHINA
    - China's debt problem
    - Environmental commitments
    NORTH AMERICA
    - Recession impact on North America
    EUROPE
    - Political instability in Germany
    - Energy crisis in Europe
  • 6.4 TARIFF & REGULATORY LANDSCAPE
    REGULATIONS RELATED TO HARD COATINGS
    REGULATORY BODIES, GOVERNMENT AGENCIES, AND OTHER ORGANIZATIONS
  • 6.5 PATENT ANALYSIS
    LIST OF MAJOR PATENTS
HARD COATINGS MARKET, BY MATERIAL TYPE
73
  • 7.1 INTRODUCTION
  • 7.2 BORIDES
    EXCEPTIONAL HARDNESS AND WEAR RESISTANCE TO DRIVE SEGMENT
  • 7.3 CARBON
    UNPARALLELED HARDNESS AND LOW FRICTION PROPERTIES TO INCREASE DEMAND
    - Diamond coatings
    - Diamond-like carbon (DLC) coatings
  • 7.4 OXIDES
    ROBUST CORROSION PROTECTION FOR ENHANCED COMPONENT LONGEVITY TO DRIVE MARKET
    ALUMINUM OXIDE
    CHROMIUM OXIDE
    ZIRCONIUM OXIDE
    ZINC OXIDE
    SILICON OXIDE
    TITANIUM OXIDE
  • 7.5 MULTI COMPONENTS
    EXTENSIVE USE FOR OPTIMIZED MATERIAL COMBINATIONS TO DRIVE MARKET
  • 7.6 NITRIDES
    UNPARALLELED HARDNESS AND HIGH-TEMPERATURE RESISTANCE TO DRIVE MARKET
    TITANIUM NITRIDE
    SILICON NITRIDE
    CHROMIUM NITRIDE
  • 7.7 CARBIDES
    SUPERIOR HARDNESS AND WEAR RESISTANCE TO DRIVE MARKET
    SILICON CARBIDE
    TUNGSTEN CARBIDE
    VANADIUM CARBIDE
    BORON CARBIDE
    TITANIUM CARBIDE
    CHROMIUM CARBIDE
HARD COATINGS MARKET, BY DEPOSITION TECHNIQUE
89
  • 8.1 INTRODUCTION
  • 8.2 PVD (PHYSICAL VAPOR DEPOSITION)
    HIGH ADOPTED FOR SUPERIOR ADHESION, HARDNESS, AND WEAR RESISTANCE TO DRIVE MARKET
    ADVANTAGES
    DISADVANTAGES
    APPLICATIONS
  • 8.3 CVD (CHEMICAL VAPOR DEPOSITION)
    EXTENSIVE USE FOR PRECISE AND UNIFORM HARD COATINGS WITH SUPERIOR ADHERENCE TO DRIVE MARKET
    ADVANTAGES
    DISADVANTAGES
    APPLICATIONS
HARD COATINGS MARKET, BY APPLICATION
97
  • 9.1 INTRODUCTION
  • 9.2 CUTTING TOOLS
    ENHANCED DURABILITY AND PERFORMANCE TO DRIVE MARKET
  • 9.3 DECORATIVE COATINGS
    DURABILITY, SCRATCH-RESISTANCE, AND LASTING ESTHETICAL APPEAL TO DRIVE MARKET
  • 9.4 OPTICS
    SCRATCH RESISTANCE AND PROLONGED OPTICAL PERFORMANCE TO DRIVE MARKET
  • 9.5 GEARS
    WEAR RESISTANCE AND OPTIMIZED PERFORMANCE TO DRIVE MARKET
  • 9.6 BEARINGS
    REDUCED FRICTION, ENHANCED DURABILITY, AND OPTIMIZED PERFORMANCE TO DRIVE MARKET
  • 9.7 PISTONS
    ENHANCED WEAR RESISTANCE, REDUCED FRICTION, AND IMPROVED ENGINE EFFICIENCY TO DRIVE MARKET
  • 9.8 CAMS
    ENHANCED SURFACE DURABILITY, REDUCED WEAR, AND OPTIMIZED PERFORMANCE TO DRIVE MARKET
  • 9.9 CYLINDERS
    ENHANCED WEAR RESISTANCE AND DURABILITY IN CYLINDER APPLICATIONS TO DRIVE MARKET
  • 9.10 HYDRAULIC/PNEUMATIC COMPONENTS
    WEAR RESISTANCE AND DURABILITY TO DRIVE MARKET
  • 9.11 OTHER APPLICATIONS
HARD COATINGS MARKET, BY END-USE INDUSTRY
118
  • 10.1 INTRODUCTION
  • 10.2 GENERAL MANUFACTURING
    ENHANCED DURABILITY AND WEAR RESISTANCE TO DRIVE ADOPTION
  • 10.3 TRANSPORTATION
    ENHANCED DURABILITY, REDUCED MAINTENANCE, AND IMPROVED PERFORMANCE TO DRIVE MARKET
    AUTOMOTIVE
    MARINE
    AEROSPACE
    RAILROAD
  • 10.4 MEDICAL/DENTAL EQUIPMENT
    WEAR RESISTANCE, LONGEVITY, AND OPTIMAL PERFORMANCE TO DRIVE MARKET
  • 10.5 BUILDING & ARCHITECTURE (INCLUDES HOME FURNISHINGS)
    ELEVATING DURABILITY AND CORROSION RESISTANCE FOR PROLONGED INFRASTRUCTURE INTEGRITY TO DRIVE MARKET
  • 10.6 FOOD MANUFACTURING/PREPARATION EQUIPMENT
    ENHANCED EQUIPMENT LONGEVITY AND COMPLIANCE WITH HYGIENIC PROCESSING STANDARDS TO DRIVE MARKET
  • 10.7 SPORTING EQUIPMENT
    DURABILITY AND ENHANCED PERFORMANCE TO DRIVE MARKET
  • 10.8 OTHER END-USE INDUSTRIES
HARD COATINGS MARKET, BY REGION
136
  • 11.1 INTRODUCTION
  • 11.2 ASIA PACIFIC
    RECESSION IMPACT
    CHINA
    - Rapid industrialization and technology growth to fuel demand
    JAPAN
    - Innovative manufacturing technologies to drive demand
    SOUTH KOREA
    - Technology-driven economy to boost demand
    INDIA
    - Government initiatives to help industries grow
    MALAYSIA
    - Manufacture of superior-quality products to boost market
    TAIWAN
    - Electronics manufacturing sector to drive market
    REST OF ASIA PACIFIC
  • 11.3 NORTH AMERICA
    IMPACT OF RECESSION ON NORTH AMERICA
    US
    - Presence of major manufacturers to drive market
    CANADA
    - Increasing demand from diverse industries to fuel market
    MEXICO
    - Growing export of electronic products to drive market
  • 11.4 EUROPE
    IMPACT OF RECESSION ON EUROPE
    GERMANY
    - Presence of major distribution channels to increase demand for automotive coatings
    FRANCE
    - Adoption of innovative technologies to drive demand
    ITALY
    - Growing demand from end-use industries to drive market
    SPAIN
    - Growing automotive industry to drive demand
    UK
    - Growing automotive industry and rising investment in R&D to boost demand
    TURKEY
    - Rapid urbanization and diversification in consumer goods to drive market
    REST OF EUROPE
  • 11.5 MIDDLE EAST & AFRICA
    IMPACT OF RECESSION ON MIDDLE EAST & AFRICA
    SAUDI ARABIA
    - Significant government investments in infrastructure development to drive market
    UAE
    - Increasing focus on developing regulatory mechanisms and R&D capabilities to drive market
    SOUTH AFRICA
    - Significant demand for automobiles to boost market
    REST OF MIDDLE EAST & AFRICA
  • 11.6 SOUTH AMERICA
    IMPACT OF RECESSION ON SOUTH AMERICA
    BRAZIL
    - Investment partnership program to promote private sector participation in infrastructure development to drive market
    ARGENTINA
    - High vehicle production to boost demand
    REST OF SOUTH AMERICA
COMPETITIVE LANDSCAPE
223
  • 12.1 KEY PLAYER STRATEGIES
    STRATEGIES ADOPTED BY KEY PLAYERS
  • 12.2 COMPANY EVALUATION MATRIX: KEY PLAYERS
    STARS
    EMERGING LEADERS
    PERVASIVE PLAYERS
    PARTICIPANTS
    COMPANY FOOTPRINT
  • 12.3 COMPANY EVALUATION MATRIX: STARTUPS/SMES
    PROGRESSIVE COMPANIES
    RESPONSIVE COMPANIES
    DYNAMIC COMPANIES
    STARTING BLOCKS
    COMPETITIVE BENCHMARKING
  • 12.4 COMPETITIVE SCENARIO AND TRENDS
    HARD COATINGS MARKET: PRODUCT LAUNCHES
    HARD COATINGS MARKET: DEALS
    HARD COATINGS MARKET: OTHER DEVELOPMENTS
COMPANY PROFILES
240
  • 13.1 KEY PLAYERS
    OC OERLIKON MANAGEMENT AG
    - Business overview
    - Products/Solutions/Services offered
    - Recent developments
    - MnM view
    MOMENTIVE
    - Business overview
    - Products/Solutions/Services offered
    - MnM view
    CEMECON AG
    - Business overview
    - Products/Solutions/Services offered
    - MnM view
    CARL ZEISS MEDITEC AG
    - Products/Solutions/Services offered
    - Recent developments
    - MnM view
    KOBE STEEL, LTD.
    - Business overview
    - Products/Solutions/Services offered
    - MnM view
    IHI HAUZER TECHNO COATING B.V.
    - Business overview
    - Products/Solutions/Services offered
    IHI IONBOND AG
    - Business overview
    - Products/Solutions/Services offered
    ASB INDUSTRIES, INC.
    - Business overview
    - Products/Solutions/Services offered
    SDC TECHNOLOGIES, INC.
    - Business overview
    - Products/Solutions/Services offered
    DURALAR TECHNOLOGIES
    - Business overview
    - Products/Solutions/Services offered
  • 13.2 OTHER PLAYERS
    ULTRA OPTICS
    - Products/Solutions/Services offered
    MBI COATINGS
    - Products/Solutions/Services offered
    DHAKE INDUSTRIES INC.
    - Products/Solutions/Services offered
    PLATIT AG
    - Products/Solutions/Services offered
    VOESTALPINE EIFELER GROUP
    - Products/Solutions/Services offered
    HARDCOATINGS, INC.
    - Products/Solutions/Services offered
    GENCOA LTD.
    - Products/Solutions/Services offered
    EXXENE CORPORATION
    - Products/Solutions/Services offered
    INDUSTRIAL HARD CARBON
    - Products/Solutions/Services offered
    PAXCON
    - Products/Solutions/Services offered
    ARTIENCE CO., LTD.
    - Products/Solutions/Services offered
    KYOCERA HARDCOATING TECHNOLOGIES
    - Products/Solutions/Services offered
    PHOTON EXPORT
    - Products/Solutions/Services offered
    Z TECH
    - Products/Solutions/Services offered
    PEERLESS PLASTICS & COATINGS
    - Products/Solutions/Services offered
APPENDIX
282
  • 14.1 DISCUSSION GUIDE
  • 14.2 KNOWLEDGESTORE: MARKETSANDMARKETS’ SUBSCRIPTION PORTAL
  • 14.3 CUSTOMIZATION OPTIONS
  • 14.4 RELATED REPORTS
  • 14.5 AUTHOR DETAILS
LIST OF TABLES
 
  • TABLE 1 HARD COATINGS MARKET: RISK ASSESSMENT
  • TABLE 2 HARD COATINGS MARKET SNAPSHOT, 2023 VS. 2028
  • TABLE 3 HARD COATINGS MARKET: PORTER'S FIVE FORCES ANALYSIS
  • TABLE 4 GDP TRENDS AND FORECAST, BY COUNTRY (PERCENTAGE CHANGE)
  • TABLE 5 AUTOMOTIVE INDUSTRY PRODUCTION (2021–2022)
  • TABLE 6 NORTH AMERICA: REGULATORY BODIES, GOVERNMENT AGENCIES, AND OTHER ORGANIZATIONS
  • TABLE 7 EUROPE: REGULATORY BODIES, GOVERNMENT AGENCIES, AND OTHER ORGANIZATIONS
  • TABLE 8 ASIA PACIFIC: REGULATORY BODIES, GOVERNMENT AGENCIES, AND OTHER ORGANIZATIONS
  • TABLE 9 REST OF THE WORLD: REGULATORY BODIES, GOVERNMENT AGENCIES, AND OTHER ORGANIZATIONS
  • TABLE 10 HARD COATINGS MARKET, BY MATERIAL TYPE, 2021–2022 (USD MILLION)
  • TABLE 11 HARD COATINGS MARKET, BY MATERIAL TYPE, 2023–2028 (USD MILLION)
  • TABLE 12 HARD COATINGS MARKET, BY MATERIAL TYPE, 2021–2022 (KILOTON)
  • TABLE 13 HARD COATINGS MARKET, BY MATERIAL TYPE, 2023–2028 (KILOTON)
  • TABLE 14 BORIDES: HARD COATINGS MARKET, BY REGION, 2021–2022 (USD MILLION)
  • TABLE 15 BORIDES: HARD COATINGS MARKET, BY REGION, 2023–2028 (USD MILLION)
  • TABLE 16 BORIDES: HARD COATINGS MARKET, BY REGION, 2021–2022 (KILOTON)
  • TABLE 17 BORIDES: HARD COATINGS MARKET, BY REGION, 2023–2028 (KILOTON)
  • TABLE 18 CARBON: HARD COATINGS MARKET, BY REGION, 2021–2022 (USD MILLION)
  • TABLE 19 CARBON: HARD COATINGS MARKET, BY REGION, 2023–2028 (USD MILLION)
  • TABLE 20 CARBON: HARD COATINGS MARKET, BY REGION, 2021–2022 (KILOTON)
  • TABLE 21 CARBON: HARD COATINGS MARKET, BY REGION, 2023–2028 (KILOTON)
  • TABLE 22 OXIDES: HARD COATINGS MARKET, BY REGION, 2021–2022 (USD MILLION)
  • TABLE 23 OXIDES: HARD COATINGS MARKET, BY REGION, 2023–2028 (USD MILLION)
  • TABLE 24 OXIDES: HARD COATINGS MARKET, BY REGION, 2021–2022 (KILOTON)
  • TABLE 25 OXIDES: HARD COATINGS MARKET, BY REGION, 2023–2028 (KILOTON)
  • TABLE 26 MULTI COMPONENTS: HARD COATINGS MARKET, BY REGION, 2021–2022 (USD MILLION)
  • TABLE 27 MULTI COMPONENTS: HARD COATINGS MARKET, BY REGION, 2023–2028 (USD MILLION)
  • TABLE 28 MULTI COMPONENTS: HARD COATINGS MARKET, BY REGION, 2021–2022 (KILOTON)
  • TABLE 29 MULTI COMPONENTS: HARD COATINGS MARKET, BY REGION, 2023–2028 (KILOTON)
  • TABLE 30 NITRIDES: HARD COATINGS MARKET, BY REGION, 2021–2022 (USD MILLION)
  • TABLE 31 NITRIDES: HARD COATINGS MARKET, BY REGION, 2023–2028 (USD MILLION)
  • TABLE 32 NITRIDES: HARD COATINGS MARKET, BY REGION, 2021–2022 (KILOTON)
  • TABLE 33 NITRIDES: HARD COATINGS MARKET, BY REGION, 2023–2028 (KILOTON)
  • TABLE 34 CARBIDES: HARD COATINGS MARKET, BY REGION, 2021–2022 (USD MILLION)
  • TABLE 35 CARBIDES: HARD COATINGS MARKET, BY REGION, 2023–2028 (USD MILLION)
  • TABLE 36 CARBIDES: HARD COATINGS MARKET, BY REGION, 2021–2022 (KILOTON)
  • TABLE 37 CARBIDES: HARD COATINGS MARKET, BY REGION, 2023–2028 (KILOTON)
  • TABLE 38 HARD COATINGS MARKET, BY DEPOSITION TECHNIQUE, 2021–2022 (USD MILLION)
  • TABLE 39 HARD COATINGS MARKET, BY DEPOSITION TECHNIQUE, 2023–2028 (USD MILLION)
  • TABLE 40 HARD COATINGS MARKET, BY DEPOSITION TECHNIQUE, 2021–2022 (KILOTON)
  • TABLE 41 HARD COATINGS MARKET, BY DEPOSITION TECHNIQUE,2023–2028 (KILOTON)
  • TABLE 42 PVD HARD COATINGS MARKET, BY REGION, 2021–2022 (USD MILLION)
  • TABLE 43 PVD HARD COATINGS MARKET, BY REGION, 2023–2028 (USD MILLION)
  • TABLE 44 PVD HARD COATINGS MARKET, BY REGION, 2021–2022 (KILOTON)
  • TABLE 45 PVD HARD COATINGS MARKET, BY REGION, 2023–2028 (KILOTON)
  • TABLE 46 CVD HARD COATINGS MARKET, BY REGION, 2021–2022 (USD MILLION)
  • TABLE 47 CVD HARD COATINGS MARKET, BY REGION, 2023–2028 (USD MILLION)
  • TABLE 48 CVD HARD COATINGS MARKET, BY REGION, 2021–2022 (KILOTON)
  • TABLE 49 CVD HARD COATINGS MARKET, BY REGION, 2023–2028 (KILOTON)
  • TABLE 50 HARD COATINGS MARKET, BY APPLICATION, 2021–2022 (USD MILLION)
  • TABLE 51 HARD COATINGS MARKET, BY APPLICATION, 2023–2028 (USD MILLION)
  • TABLE 52 HARD COATINGS MARKET, BY APPLICATION, 2021–2022 (KILOTON)
  • TABLE 53 HARD COATINGS MARKET, BY APPLICATION, 2023–2028 (KILOTON)
  • TABLE 54 CUTTING TOOLS: HARD COATINGS MARKET, BY REGION, 2021–2022 (USD MILLION)
  • TABLE 55 CUTTING TOOLS: HARD COATINGS MARKET, BY REGION, 2023–2028 (USD MILLION)
  • TABLE 56 CUTTING TOOLS: HARD COATINGS MARKET, BY REGION, 2021–2022 (KILOTON)
  • TABLE 57 CUTTING TOOLS: HARD COATINGS MARKET, BY REGION, 2023–2028 (KILOTON)
  • TABLE 58 DECORATIVE COATINGS: HARD COATINGS MARKET, BY REGION, 2021–2022 (USD MILLION)
  • TABLE 59 DECORATIVE COATINGS: HARD COATINGS MARKET, BY REGION, 2023–2028 (USD MILLION)
  • TABLE 60 DECORATIVE COATINGS: HARD COATINGS MARKET, BY REGION, 2021–2022 (KILOTON)
  • TABLE 61 DECORATIVE COATINGS: HARD COATINGS MARKET, BY REGION, 2023–2028 (KILOTON)
  • TABLE 62 OPTICS: HARD COATINGS MARKET, BY REGION, 2021–2022 (USD MILLION)
  • TABLE 63 OPTICS: HARD COATINGS MARKET, BY REGION, 2023–2028 (USD MILLION)
  • TABLE 64 OPTICS: HARD COATINGS MARKET, BY REGION, 2021–2022 (KILOTON)
  • TABLE 65 OPTICS: HARD COATINGS MARKET, BY REGION, 2023–2028 (KILOTON)
  • TABLE 66 GEARS: HARD COATINGS MARKET, BY REGION, 2021–2022 (USD MILLION)
  • TABLE 67 GEARS: HARD COATINGS MARKET, BY REGION, 2023–2028 (USD MILLION)
  • TABLE 68 GEARS: HARD COATINGS MARKET, BY REGION, 2021–2022 (KILOTON)
  • TABLE 69 GEARS: HARD COATINGS MARKET, BY REGION, 2023–2028 (KILOTON)
  • TABLE 70 BEARINGS: HARD COATINGS MARKET, BY REGION, 2021–2022 (USD MILLION)
  • TABLE 71 BEARINGS: HARD COATINGS MARKET, BY REGION, 2023–2028 (USD MILLION)
  • TABLE 72 BEARINGS: HARD COATINGS MARKET, BY REGION, 2021–2022 (KILOTON)
  • TABLE 73 BEARINGS: HARD COATINGS MARKET, BY REGION, 2023–2028 (KILOTON)
  • TABLE 74 PISTON: HARD COATINGS MARKET, BY REGION, 2021–2022 (USD MILLION)
  • TABLE 75 PISTON: HARD COATINGS MARKET, BY REGION, 2023–2028 (USD MILLION)
  • TABLE 76 PISTON: HARD COATINGS MARKET, BY REGION, 2021–2022 (KILOTON)
  • TABLE 77 PISTON: HARD COATINGS MARKET, BY REGION, 2023–2028 (KILOTON)
  • TABLE 78 CAMS: HARD COATINGS MARKET, BY REGION, 2021–2022 (USD MILLION)
  • TABLE 79 CAMS: HARD COATINGS MARKET, BY REGION, 2023–2028 (USD MILLION)
  • TABLE 80 CAMS: HARD COATINGS MARKET, BY REGION, 2021–2022 (KILOTON)
  • TABLE 81 CAMS: HARD COATINGS MARKET, BY REGION, 2023–2028 (KILOTON)
  • TABLE 82 CYLINDERS: HARD COATINGS MARKET, BY REGION, 2021–2022 (USD MILLION)
  • TABLE 83 CYLINDERS: HARD COATINGS MARKET, BY REGION, 2023–2028 (USD MILLION)
  • TABLE 84 CYLINDERS: HARD COATINGS MARKET, BY REGION, 2021–2022 (KILOTON)
  • TABLE 85 CYLINDERS: HARD COATINGS MARKET, BY REGION, 2023–2028 (KILOTON)
  • TABLE 86 HYDRAULIC/PNEUMATIC COMPONENT: HARD COATINGS MARKET, BY REGION, 2021–2022 (USD MILLION)
  • TABLE 87 HYDRAULIC/PNEUMATIC COMPONENT: HARD COATINGS MARKET, BY REGION, 2023–2028 (USD MILLION)
  • TABLE 88 HYDRAULIC/PNEUMATIC COMPONENT: HARD COATINGS MARKET, BY REGION, 2021–2022 (KILOTON)
  • TABLE 89 HYDRAULIC/PNEUMATIC COMPONENT: HARD COATINGS MARKET, BY REGION, 2023–2028 (KILOTON)
  • TABLE 90 OTHER APPLICATIONS: HARD COATINGS MARKET, BY REGION, 2021–2022 (USD MILLION)
  • TABLE 91 OTHER APPLICATIONS: HARD COATINGS MARKET, BY REGION, 2023–2028 (USD MILLION)
  • TABLE 92 OTHER APPLICATIONS: HARD COATINGS MARKET, BY REGION, 2021–2022 (KILOTON)
  • TABLE 93 OTHER APPLICATIONS: HARD COATINGS MARKET, BY REGION, 2023–2028 (KILOTON)
  • TABLE 94 HARD COATINGS MARKET, BY END-USE INDUSTRY, 2021–2022 (USD MILLION)
  • TABLE 95 HARD COATINGS MARKET, BY END-USE INDUSTRY, 2023–2028 (USD MILLION)
  • TABLE 96 HARD COATINGS MARKET, BY END-USE INDUSTRY, 2021–2022 (KILOTON)
  • TABLE 97 HARD COATINGS MARKET, BY END-USE INDUSTRY, 2023–2028 (KILOTON)
  • TABLE 98 GENERAL MANUFACTURING: HARD COATINGS MARKET, BY REGION, 2021–2022 (USD MILLION)
  • TABLE 99 GENERAL MANUFACTURING: HARD COATINGS MARKET, BY REGION, 2023–2028 (USD MILLION)
  • TABLE 100 GENERAL MANUFACTURING: HARD COATINGS MARKET, BY REGION, 2021–2022 (KILOTON)
  • TABLE 101 GENERAL MANUFACTURING: HARD COATINGS MARKET, BY REGION, 2023–2028 (KILOTON)
  • TABLE 102 TRANSPORTATION: HARD COATINGS MARKET, BY REGION, 2021–2022 (USD MILLION)
  • TABLE 103 TRANSPORTATION: HARD COATINGS MARKET, BY REGION, 2023–2028 (USD MILLION)
  • TABLE 104 TRANSPORTATION: HARD COATINGS MARKET, BY REGION, 2021–2022 (KILOTON)
  • TABLE 105 TRANSPORTATION: HARD COATINGS MARKET, BY REGION, 2023–2028 (KILOTON)
  • TABLE 106 MEDICAL/DENTAL EQUIPMENT: HARD COATINGS MARKET, BY REGION, 2021–2022 (USD MILLION)
  • TABLE 107 MEDICAL/DENTAL EQUIPMENT: HARD COATINGS MARKET, BY REGION, 2023–2028 (USD MILLION)
  • TABLE 108 MEDICAL/DENTAL EQUIPMENT: HARD COATINGS MARKET, BY REGION, 2021–2022 (KILOTON)
  • TABLE 109 MEDICAL/DENTAL EQUIPMENT: HARD COATINGS MARKET, BY REGION, 2023–2028 (KILOTON)
  • TABLE 110 BUILDING & ARCHITECTURE: HARD COATINGS MARKET, BY REGION, 2021–2022 (USD MILLION)
  • TABLE 111 BUILDING & ARCHITECTURE: HARD COATINGS MARKET, BY REGION, 2023–2028 (USD MILLION)
  • TABLE 112 BUILDING & ARCHITECTURE: HARD COATINGS MARKET, BY REGION, 2021–2022 (KILOTON)
  • TABLE 113 BUILDING & ARCHITECTURE: HARD COATINGS MARKET, BY REGION, 2023–2028 (KILOTON)
  • TABLE 114 FOOD MANUFACTURING/PREPARATION EQUIPMENT: HARD COATINGS MARKET, BY REGION, 2021–2022 (USD MILLION)
  • TABLE 115 FOOD MANUFACTURING/PREPARATION EQUIPMENT: HARD COATINGS MARKET, BY REGION, 2023–2028 (USD MILLION)
  • TABLE 116 FOOD MANUFACTURING/PREPARATION EQUIPMENT: HARD COATINGS MARKET, BY REGION, 2021–2022 (KILOTON)
  • TABLE 117 FOOD MANUFACTURING/PREPARATION EQUIPMENT: HARD COATINGS MARKET, BY REGION, 2023–2028 (KILOTON)
  • TABLE 118 SPORTING EQUIPMENT: HARD COATINGS MARKET, BY REGION, 2021–2022 (USD MILLION)
  • TABLE 119 SPORTING EQUIPMENT: HARD COATINGS MARKET, BY REGION, 2023–2028 (USD MILLION)
  • TABLE 120 SPORTING EQUIPMENT: HARD COATINGS MARKET, BY REGION, 2021–2022 (KILOTON)
  • TABLE 121 SPORTING EQUIPMENT: HARD COATINGS MARKET, BY REGION, 2023–2028 (KILOTON)
  • TABLE 122 OTHER END-USE INDUSTRIES: HARD COATINGS MARKET, BY REGION, 2021–2022 (USD MILLION)
  • TABLE 123 OTHER END-USE INDUSTRIES: HARD COATINGS MARKET, BY REGION, 2023–2028 (USD MILLION)
  • TABLE 124 OTHER END-USE INDUSTRIES: HARD COATINGS MARKET, BY REGION, 2021–2022 (KILOTON)
  • TABLE 125 OTHER END-USE INDUSTRIES: HARD COATINGS MARKET, BY REGION, 2023–2028 (KILOTON)
  • TABLE 126 HARD COATINGS MARKET, BY REGION, 2021–2022 (USD MILLION)
  • TABLE 127 HARD COATINGS MARKET, BY REGION, 2023–2028 (USD MILLION)
  • TABLE 128 HARD COATINGS MARKET, BY REGION, 2021–2022 (KILOTON)
  • TABLE 129 HARD COATINGS MARKET, BY REGION, 2023–2028 (KILOTON)
  • TABLE 130 ASIA PACIFIC: HARD COATINGS MARKET, BY COUNTRY, 2021–2022 (USD MILLION)
  • TABLE 131 ASIA PACIFIC: HARD COATINGS MARKET, BY COUNTRY, 2023–2028 (USD MILLION)
  • TABLE 132 ASIA PACIFIC: HARD COATINGS MARKET, BY COUNTRY, 2021–2022 (KILOTON)
  • TABLE 133 ASIA PACIFIC: HARD COATINGS MARKET, BY COUNTRY, 2023–2028 (KILOTON)
  • TABLE 134 ASIA PACIFIC: HARD COATINGS MARKET, BY MATERIAL TYPE, 2021–2022 (USD MILLION)
  • TABLE 135 ASIA PACIFIC: HARD COATINGS MARKET, BY MATERIAL TYPE, 2023–2028 (USD MILLION)
  • TABLE 136 ASIA PACIFIC: HARD COATINGS MARKET, BY MATERIAL TYPE, 2021–2022 (KILOTON)
  • TABLE 137 ASIA PACIFIC: HARD COATINGS MARKET, BY MATERIAL TYPE, 2023–2028 (KILOTON)
  • TABLE 138 ASIA PACIFIC: HARD COATINGS MARKET, BY APPLICATION, 2021–2022 (USD MILLION)
  • TABLE 139 ASIA PACIFIC: HARD COATINGS MARKET, BY APPLICATION, 2023–2028 (USD MILLION)
  • TABLE 140 ASIA PACIFIC: HARD COATINGS MARKET, BY APPLICATION, 2021–2022 (KILOTON)
  • TABLE 141 ASIA PACIFIC: HARD COATINGS MARKET, BY APPLICATION, 2023–2028 (KILOTON)
  • TABLE 142 ASIA PACIFIC: HARD COATINGS MARKET, BY END-USE INDUSTRY, 2021–2022 (USD MILLION)
  • TABLE 143 ASIA PACIFIC: HARD COATINGS MARKET, BY END-USE INDUSTRY, 2023–2028 (USD MILLION)
  • TABLE 144 ASIA PACIFIC: HARD COATINGS MARKET, BY END-USE INDUSTRY, 2021–2022 (KILOTON)
  • TABLE 145 ASIA PACIFIC: HARD COATINGS MARKET, BY END-USE INDUSTRY, 2023–2028 (KILOTON)
  • TABLE 146 CHINA: HARD COATINGS MARKET, BY END-USE INDUSTRY, 2021–2022 (USD MILLION)
  • TABLE 147 CHINA: HARD COATINGS MARKET, BY END-USE INDUSTRY, 2023–2028 (USD MILLION)
  • TABLE 148 CHINA: HARD COATINGS MARKET, BY END-USE INDUSTRY, 2021–2022 (KILOTON)
  • TABLE 149 CHINA: HARD COATINGS MARKET, BY END-USE INDUSTRY, 2023–2028 (KILOTON)
  • TABLE 150 JAPAN: HARD COATINGS MARKET, BY END-USE INDUSTRY, 2021–2022 (USD MILLION)
  • TABLE 151 JAPAN: HARD COATINGS MARKET, BY END-USE INDUSTRY, 2023–2028 (USD MILLION)
  • TABLE 152 JAPAN: HARD COATINGS MARKET, BY END-USE INDUSTRY, 2021–2022 (KILOTON)
  • TABLE 153 JAPAN: HARD COATINGS MARKET, BY END-USE INDUSTRY, 2023–2028 (KILOTON)
  • TABLE 154 SOUTH KOREA: HARD COATINGS MARKET, BY END-USE INDUSTRY, 2021–2022 (USD MILLION)
  • TABLE 155 SOUTH KOREA: HARD COATINGS MARKET, BY END-USE INDUSTRY, 2023–2028 (USD MILLION)
  • TABLE 156 SOUTH KOREA: HARD COATINGS MARKET, BY END-USE INDUSTRY, 2021–2022 (KILOTON)
  • TABLE 157 SOUTH KOREA: HARD COATINGS MARKET, BY END-USE INDUSTRY, 2023–2028 (KILOTON)
  • TABLE 158 INDIA: HARD COATINGS MARKET, BY END-USE INDUSTRY, 2021–2022 (USD MILLION)
  • TABLE 159 INDIA: HARD COATINGS MARKET, BY END-USE INDUSTRY, 2023–2028 (USD MILLION)
  • TABLE 160 INDIA: HARD COATINGS MARKET, BY END-USE INDUSTRY, 2021–2022 (KILOTON)
  • TABLE 161 INDIA: HARD COATINGS MARKET, BY END-USE INDUSTRY, 2023–2028 (KILOTON)
  • TABLE 162 MALAYSIA: HARD COATINGS MARKET, BY END-USE INDUSTRY, 2021–2022 (USD MILLION)
  • TABLE 163 MALAYSIA: HARD COATINGS MARKET, BY END-USE INDUSTRY, 2023–2028 (USD MILLION)
  • TABLE 164 MALAYSIA: HARD COATINGS MARKET, BY END-USE INDUSTRY, 2021–2022 (KILOTON)
  • TABLE 165 MALAYSIA: HARD COATINGS MARKET, BY END-USE INDUSTRY, 2023–2028 (KILOTON)
  • TABLE 166 TAIWAN: HARD COATINGS MARKET, BY END-USE INDUSTRY, 2021–2022 (USD MILLION)
  • TABLE 167 TAIWAN: HARD COATINGS MARKET, BY END-USE INDUSTRY, 2023–2028 (USD MILLION)
  • TABLE 168 TAIWAN: HARD COATINGS MARKET, BY END-USE INDUSTRY, 2021–2022 (KILOTON)
  • TABLE 169 TAIWAN: HARD COATINGS MARKET, BY END-USE INDUSTRY, 2023–2028 (KILOTON)
  • TABLE 170 REST OF ASIA PACIFIC: HARD COATINGS MARKET, BY END-USE INDUSTRY, 2021–2022 (USD MILLION)
  • TABLE 171 REST OF ASIA PACIFIC: HARD COATINGS MARKET, BY END-USE INDUSTRY, 2023–2028 (USD MILLION)
  • TABLE 172 REST OF ASIA PACIFIC: HARD COATINGS MARKET, BY END-USE INDUSTRY, 2021–2022 (KILOTON)
  • TABLE 173 REST OF ASIA PACIFIC: HARD COATINGS MARKET, BY END-USE INDUSTRY, 2023–2028 (KILOTON)
  • TABLE 174 NORTH AMERICA: HARD COATINGS MARKET, BY COUNTRY, 2021–2022 (USD MILLION)
  • TABLE 175 NORTH AMERICA: HARD COATINGS MARKET, BY COUNTRY, 2023–2028 (USD MILLION)
  • TABLE 176 NORTH AMERICA: HARD COATINGS MARKET, BY COUNTRY, 2021–2022 (KILOTON)
  • TABLE 177 NORTH AMERICA: HARD COATINGS MARKET, BY COUNTRY, 2023–2028 (KILOTON)
  • TABLE 178 NORTH AMERICA: HARD COATINGS MARKET, BY MATERIAL TYPE, 2021–2022 (USD MILLION)
  • TABLE 179 NORTH AMERICA: HARD COATINGS MARKET, BY MATERIAL TYPE, 2023–2028 (USD MILLION)
  • TABLE 180 NORTH AMERICA: HARD COATINGS MARKET, BY MATERIAL TYPE, 2021–2022 (KILOTON)
  • TABLE 181 NORTH AMERICA: HARD COATINGS MARKET, BY MATERIAL TYPE, 2023–2028 (KILOTON)
  • TABLE 182 NORTH AMERICA: HARD COATINGS MARKET, BY APPLICATION, 2021–2022 (USD MILLION)
  • TABLE 183 NORTH AMERICA: HARD COATINGS MARKET, BY APPLICATION, 2023–2028 (USD MILLION)
  • TABLE 184 NORTH AMERICA: HARD COATINGS MARKET, BY APPLICATION, 2021–2022 (KILOTON)
  • TABLE 185 NORTH AMERICA: HARD COATINGS MARKET, BY APPLICATION, 2023–2028 (KILOTON)
  • TABLE 186 NORTH AMERICA: HARD COATINGS MARKET, BY END-USE INDUSTRY, 2021–2022 (USD MILLION)
  • TABLE 187 NORTH AMERICA: HARD COATINGS MARKET, BY END-USE INDUSTRY, 2023–2028 (KILOTON)
  • TABLE 188 US: HARD COATINGS MARKET, BY END-USE INDUSTRY, 2021–2022 (USD MILLION)
  • TABLE 189 US: HARD COATINGS MARKET, BY END-USE INDUSTRY, 2023–2028 (USD MILLION)
  • TABLE 190 US: HARD COATINGS MARKET, BY END-USE INDUSTRY, 2021–2022 (KILOTON)
  • TABLE 191 US: HARD COATINGS MARKET, BY END-USE INDUSTRY, 2023–2028 (KILOTON)
  • TABLE 192 CANADA: HARD COATINGS MARKET, BY END-USE INDUSTRY, 2021–2022 (USD MILLION)
  • TABLE 193 CANADA: HARD COATINGS MARKET, BY END-USE INDUSTRY, 2023–2028 (USD MILLION)
  • TABLE 194 CANADA: HARD COATINGS MARKET, BY END-USE INDUSTRY, 2021–2022 (KILOTON)
  • TABLE 195 CANADA: HARD COATINGS MARKET, BY END-USE INDUSTRY, 2023–2028 (KILOTON)
  • TABLE 196 MEXICO: HARD COATINGS MARKET, BY END-USE INDUSTRY, 2021–2022 (USD MILLION)
  • TABLE 197 MEXICO: HARD COATINGS MARKET, BY END-USE INDUSTRY, 2023–2028 (USD MILLION)
  • TABLE 198 MEXICO: HARD COATINGS MARKET, BY END-USE INDUSTRY, 2021–2022 (KILOTON)
  • TABLE 199 MEXICO: HARD COATINGS MARKET, BY END-USE INDUSTRY, 2023–2028 (KILOTON)
  • TABLE 200 EUROPE: HARD COATINGS MARKET, BY COUNTRY, 2021–2022 (USD MILLION)
  • TABLE 201 EUROPE: HARD COATINGS MARKET, BY COUNTRY, 2023–2028 (USD MILLION)
  • TABLE 202 EUROPE: HARD COATINGS MARKET, BY COUNTRY, 2021–2022 (KILOTON)
  • TABLE 203 EUROPE: HARD COATINGS MARKET, BY COUNTRY, 2023–2028 (KILOTON)
  • TABLE 204 EUROPE: HARD COATINGS MARKET, BY MATERIAL TYPE, 2021–2022 (USD MILLION)
  • TABLE 205 EUROPE: HARD COATINGS MARKET, BY MATERIAL TYPE, 2023–2028 (USD MILLION)
  • TABLE 206 EUROPE: HARD COATINGS MARKET, BY MATERIAL TYPE, 2021–2022 (KILOTON)
  • TABLE 207 EUROPE: HARD COATINGS MARKET, BY MATERIAL TYPE, 2023–2028 (KILOTON)
  • TABLE 208 EUROPE: HARD COATINGS MARKET, BY APPLICATION, 2021–2022 (USD MILLION)
  • TABLE 209 EUROPE: HARD COATINGS MARKET, BY APPLICATION, 2023–2028 (USD MILLION)
  • TABLE 210 EUROPE: HARD COATINGS MARKET, BY APPLICATION, 2021–2022 (KILOTON)
  • TABLE 211 EUROPE: HARD COATINGS MARKET, BY APPLICATION, 2023–2028 (KILOTON)
  • TABLE 212 EUROPE: HARD COATINGS MARKET, BY END-USE INDUSTRY, 2021–2022 (USD MILLION)
  • TABLE 213 EUROPE: HARD COATINGS MARKET, BY END-USE INDUSTRY, 2023–2028 (USD MILLION)
  • TABLE 214 EUROPE: HARD COATINGS MARKET, BY END-USE INDUSTRY, 2021–2022 (KILOTON)
  • TABLE 215 EUROPE: HARD COATINGS MARKET, BY END-USE INDUSTRY, 2023–2028 (KILOTON)
  • TABLE 216 GERMANY: HARD COATINGS MARKET, BY END-USE INDUSTRY, 2021–2022 (USD MILLION)
  • TABLE 217 GERMANY: HARD COATINGS MARKET, BY END-USE INDUSTRY, 2023–2028 (USD MILLION)
  • TABLE 218 GERMANY: HARD COATINGS MARKET, BY END-USE INDUSTRY, 2021–2022 (KILOTON)
  • TABLE 219 GERMANY: HARD COATINGS MARKET, BY END-USE INDUSTRY, 2023–2028 (KILOTON)
  • TABLE 220 FRANCE: HARD COATINGS MARKET, BY END-USE INDUSTRY, 2021–2022 (USD MILLION)
  • TABLE 221 FRANCE: HARD COATINGS MARKET, BY END-USE INDUSTRY, 2023–2028 (USD MILLION)
  • TABLE 222 FRANCE: HARD COATINGS MARKET, BY END-USE INDUSTRY, 2021–2022 (KILOTON)
  • TABLE 223 FRANCE: HARD COATINGS MARKET, BY END-USE INDUSTRY, 2023–2028 (KILOTON)
  • TABLE 224 ITALY: HARD COATINGS MARKET, BY END-USE INDUSTRY, 2021–2022 (USD MILLION)
  • TABLE 225 ITALY: HARD COATINGS MARKET, BY END-USE INDUSTRY, 2023–2028 (USD MILLION)
  • TABLE 226 ITALY: HARD COATINGS MARKET, BY END-USE INDUSTRY, 2021–2022 (KILOTON)
  • TABLE 227 ITALY: HARD COATINGS MARKET, BY END-USE INDUSTRY, 2023–2028 (KILOTON)
  • TABLE 228 SPAIN: HARD COATINGS MARKET, BY END-USE INDUSTRY, 2021–2022 (USD MILLION)
  • TABLE 229 SPAIN: HARD COATINGS MARKET, BY END-USE INDUSTRY, 2023–2028 (USD MILLION)
  • TABLE 230 SPAIN: HARD COATINGS MARKET, BY END-USE INDUSTRY, 2021–2022 (KILOTON)
  • TABLE 231 SPAIN: HARD COATINGS MARKET, BY END-USE INDUSTRY, 2023–2028 (KILOTON)
  • TABLE 232 UK: HARD COATINGS MARKET, BY END-USE INDUSTRY, 2021–2022 (USD MILLION)
  • TABLE 233 UK: HARD COATINGS MARKET, BY END-USE INDUSTRY, 2023–2028 (USD MILLION)
  • TABLE 234 UK: HARD COATINGS MARKET, BY END-USE INDUSTRY, 2021–2022 (KILOTON)
  • TABLE 235 UK: HARD COATINGS MARKET, BY END-USE INDUSTRY, 2023–2028 (KILOTON)
  • TABLE 236 TURKEY: HARD COATINGS MARKET, BY END-USE INDUSTRY, 2021–2022 (USD MILLION)
  • TABLE 237 TURKEY: HARD COATINGS MARKET, BY END-USE INDUSTRY, 2023–2028 (USD MILLION)
  • TABLE 238 TURKEY: HARD COATINGS MARKET, BY END-USE INDUSTRY, 2021–2022 (KILOTON)
  • TABLE 239 TURKEY: HARD COATINGS MARKET, BY END-USE INDUSTRY, 2023–2028 (KILOTON)
  • TABLE 240 REST OF EUROPE: HARD COATINGS MARKET, BY END-USE INDUSTRY, 2021–2022 (USD MILLION)
  • TABLE 241 REST OF EUROPE: HARD COATINGS MARKET, BY END-USE INDUSTRY, 2023–2028 (USD MILLION)
  • TABLE 242 REST OF EUROPE: HARD COATINGS MARKET, BY END-USE INDUSTRY, 2021–2022 (KILOTON)
  • TABLE 243 REST OF EUROPE: HARD COATINGS MARKET, BY END-USE INDUSTRY, 2023–2028 (KILOTON)
  • TABLE 244 MIDDLE EAST & AFRICA: HARD COATINGS MARKET, BY COUNTRY, 2021–2022 (USD MILLION)
  • TABLE 245 MIDDLE EAST & AFRICA: HARD COATINGS MARKET, BY COUNTRY, 2023–2028 (USD MILLION)
  • TABLE 246 MIDDLE EAST & AFRICA: HARD COATINGS MARKET, BY COUNTRY, 2021–2022 (KILOTON)
  • TABLE 247 MIDDLE EAST & AFRICA: HARD COATINGS MARKET, BY COUNTRY, 2023–2028 (KILOTON)
  • TABLE 248 MIDDLE EAST & AFRICA: HARD COATINGS MARKET, BY MATERIAL TYPE, 2021–2022 (USD MILLION)
  • TABLE 249 MIDDLE EAST & AFRICA: HARD COATINGS MARKET, BY MATERIAL TYPE, 2023–2028 (USD MILLION)
  • TABLE 250 MIDDLE EAST & AFRICA: HARD COATINGS MARKET, BY MATERIAL TYPE, 2021–2022 (KILOTON)
  • TABLE 251 MIDDLE EAST & AFRICA: HARD COATINGS MARKET, BY MATERIAL TYPE, 2023–2028 (KILOTON)
  • TABLE 252 MIDDLE EAST & AFRICA: HARD COATINGS MARKET, BY APPLICATION, 2021–2022 (USD MILLION)
  • TABLE 253 MIDDLE EAST & AFRICA: HARD COATINGS MARKET, BY APPLICATION, 2023–2028 (USD MILLION)
  • TABLE 254 MIDDLE EAST & AFRICA: HARD COATINGS MARKET, BY APPLICATION, 2021–2022 (KILOTON)
  • TABLE 255 MIDDLE EAST & AFRICA: HARD COATINGS MARKET, BY APPLICATION, 2023–2028 (KILOTON)
  • TABLE 256 MIDDLE EAST & AFRICA: HARD COATINGS MARKET, BY END-USE INDUSTRY, 2021–2022 (USD MILLION)
  • TABLE 257 MIDDLE EAST & AFRICA: HARD COATINGS MARKET, BY END-USE INDUSTRY, 2023–2028 (USD MILLION)
  • TABLE 258 MIDDLE EAST & AFRICA: HARD COATINGS MARKET, BY END-USE INDUSTRY, 2021–2022 (KILOTON)
  • TABLE 259 MIDDLE EAST & AFRICA: HARD COATINGS MARKET, BY END-USE INDUSTRY, 2023–2028 (KILOTON)
  • TABLE 260 SAUDI ARABIA: HARD COATINGS MARKET, BY END-USE INDUSTRY, 2021–2022 (USD MILLION)
  • TABLE 261 SAUDI ARABIA: HARD COATINGS MARKET, BY END-USE INDUSTRY, 2023–2028 (USD MILLION)
  • TABLE 262 SAUDI ARABIA: HARD COATINGS MARKET, BY END-USE INDUSTRY, 2021–2022 (KILOTON)
  • TABLE 263 SAUDI ARABIA: HARD COATINGS MARKET, BY END-USE INDUSTRY, 2023–2028 (KILOTON)
  • TABLE 264 UAE: HARD COATINGS MARKET, BY END-USE INDUSTRY, 2021–2022 (USD MILLION)
  • TABLE 265 UAE: HARD COATINGS MARKET, BY END-USE INDUSTRY, 2023–2028 (USD MILLION)
  • TABLE 266 UAE: HARD COATINGS MARKET, BY END-USE INDUSTRY, 2021–2022 (KILOTON)
  • TABLE 267 UAE: HARD COATINGS MARKET, BY END-USE INDUSTRY, 2023–2028 (KILOTON)
  • TABLE 268 SOUTH AFRICA: HARD COATINGS MARKET, BY END-USE INDUSTRY, 2021–2022 (USD MILLION)
  • TABLE 269 SOUTH AFRICA: HARD COATINGS MARKET, BY END-USE INDUSTRY, 2023–2028 (USD MILLION)
  • TABLE 270 SOUTH AFRICA: HARD COATINGS MARKET, BY END-USE INDUSTRY, 2021–2022 (KILOTON)
  • TABLE 271 SOUTH AFRICA: HARD COATINGS MARKET, BY END-USE INDUSTRY, 2023–2028 (KILOTON)
  • TABLE 272 REST OF MIDDLE EAST & AFRICA: HARD COATINGS MARKET, BY END-USE INDUSTRY, 2021–2022 (USD MILLION)
  • TABLE 273 REST OF MIDDLE EAST & AFRICA: HARD COATINGS MARKET, BY END-USE INDUSTRY, 2023–2028 (USD MILLION)
  • TABLE 274 REST OF MIDDLE EAST & AFRICA: HARD COATINGS MARKET, BY END-USE INDUSTRY, 2021–2022 (KILOTON)
  • TABLE 275 REST OF MIDDLE EAST & AFRICA: HARD COATINGS MARKET, BY END-USE INDUSTRY, 2023–2028 (KILOTON)
  • TABLE 276 SOUTH AMERICA: HARD COATINGS MARKET, BY COUNTRY, 2021–2022 (USD MILLION)
  • TABLE 277 SOUTH AMERICA: HARD COATINGS MARKET, BY COUNTRY, 2023–2028 (USD MILLION)
  • TABLE 278 SOUTH AMERICA: HARD COATINGS MARKET, BY COUNTRY, 2021–2022 (KILOTON)
  • TABLE 279 SOUTH AMERICA: HARD COATINGS MARKET, BY COUNTRY, 2023–2028 (KILOTON)
  • TABLE 280 SOUTH AMERICA: HARD COATINGS MARKET, BY MATERIAL TYPE, 2021–2022 (USD MILLION)
  • TABLE 281 SOUTH AMERICA: HARD COATINGS MARKET, BY MATERIAL TYPE, 2023–2028 (USD MILLION)
  • TABLE 282 SOUTH AMERICA: HARD COATINGS MARKET, BY MATERIAL TYPE, 2021–2022 (KILOTON)
  • TABLE 283 SOUTH AMERICA: HARD COATINGS MARKET, BY MATERIAL TYPE, 2023–2028 (KILOTON)
  • TABLE 284 SOUTH AMERICA: HARD COATINGS MARKET, BY APPLICATION, 2021–2022 (USD MILLION)
  • TABLE 285 SOUTH AMERICA: HARD COATINGS MARKET, BY APPLICATION, 2023–2028 (USD MILLION)
  • TABLE 286 SOUTH AMERICA: HARD COATINGS MARKET, BY APPLICATION, 2021–2022 (KILOTON)
  • TABLE 287 SOUTH AMERICA: HARD COATINGS MARKET, BY APPLICATION, 2023–2028 (KILOTON)
  • TABLE 288 SOUTH AMERICA: HARD COATINGS MARKET, BY END-USE INDUSTRY, 2021–2022 (USD MILLION)
  • TABLE 289 SOUTH AMERICA: HARD COATINGS MARKET, BY END-USE INDUSTRY, 2023–2028 (USD MILLION)
  • TABLE 290 SOUTH AMERICA: HARD COATINGS MARKET, BY END-USE INDUSTRY, 2021–2022 (KILOTON)
  • TABLE 291 SOUTH AMERICA: HARD COATINGS MARKET, BY END-USE INDUSTRY, 2023–2028 (KILOTON)
  • TABLE 292 BRAZIL: HARD COATINGS MARKET, BY END-USE INDUSTRY, 2021–2022 (USD MILLION)
  • TABLE 293 BRAZIL: HARD COATINGS MARKET, BY END-USE INDUSTRY, 2023–2028 (USD MILLION)
  • TABLE 294 BRAZIL: HARD COATINGS MARKET, BY END-USE INDUSTRY, 2021–2022 (KILOTON)
  • TABLE 295 BRAZIL: HARD COATINGS MARKET, BY END-USE INDUSTRY, 2023–2028 (KILOTON)
  • TABLE 296 ARGENTINA: HARD COATINGS MARKET, BY END-USE INDUSTRY, 2021–2022 (USD MILLION)
  • TABLE 297 ARGENTINA: HARD COATINGS MARKET, BY END-USE INDUSTRY, 2023–2028 (USD MILLION)
  • TABLE 298 ARGENTINA: HARD COATINGS MARKET, BY END-USE INDUSTRY, 2021–2022 (KILOTON)
  • TABLE 299 ARGENTINA: HARD COATINGS MARKET, BY END-USE INDUSTRY, 2023–2028 (KILOTON)
  • TABLE 300 REST OF SOUTH AMERICA: HARD COATINGS MARKET, BY END-USE INDUSTRY, 2021–2022 (USD MILLION)
  • TABLE 301 REST OF SOUTH AMERICA: HARD COATINGS MARKET, BY END-USE INDUSTRY, 2023–2028 (USD MILLION)
  • TABLE 302 REST OF SOUTH AMERICA: HARD COATINGS MARKET, BY END-USE INDUSTRY, 2021–2022 (KILOTON)
  • TABLE 303 REST OF SOUTH AMERICA: HARD COATINGS MARKET, BY END-USE INDUSTRY, 2023–2028 (KILOTON)
  • TABLE 304 OVERVIEW OF STRATEGIES ADOPTED BY KEY HARD COATING PLAYERS (2018–2023)
  • TABLE 305 APPLICATION FOOTPRINT (25 COMPANIES)
  • TABLE 306 REGION FOOTPRINT (25 COMPANIES)
  • TABLE 307 END-USE INDUSTRY FOOTPRINT (25 COMPANIES)
  • TABLE 308 MATERIAL TYPE INDUSTRY FOOTPRINT (25 COMPANIES)
  • TABLE 309 COMPANY OVERALL FOOTPRINT
  • TABLE 310 HARD COATINGS MARKET: KEY STARTUPS/SMES
  • TABLE 311 HARD COATINGS MARKET: COMPETITIVE BENCHMARKING OF STARTUPS/SMES BY APPLICATION
  • TABLE 312 HARD COATINGS MARKET: COMPETITIVE BENCHMARKING OF STARTUPS/SMES BY REGION
  • TABLE 313 HARD COATINGS MARKET: PRODUCT LAUNCHES, 2018–2023
  • TABLE 314 HARD COATINGS MARKET: DEALS, 2018–2023
  • TABLE 315 HARD COATINGS MARKET: OTHER DEVELOPMENTS, 2018–2023
  • TABLE 316 OC OERLIKON MANAGEMENT AG: COMPANY OVERVIEW
  • TABLE 317 OC OERLIKON MANAGEMENT AG: PRODUCTS/SOLUTIONS/SERVICE OFFERED
  • TABLE 318 OC OERLIKON MANAGEMENT AG: PRODUCT LAUNCHES
  • TABLE 319 OC OERLIKON MANAGEMENT AG: DEALS
  • TABLE 320 OC OERLIKON MANAGEMENT AG: EXPANSIONS
  • TABLE 321 MOMENTIVE: COMPANY OVERVIEW
  • TABLE 322 MOMENTIVE: PRODUCTS/SOLUTIONS/SERVICE OFFERED
  • TABLE 323 CEMECON AG: COMPANY OVERVIEW
  • TABLE 324 CEMECON AG: PRODUCTS/SOLUTIONS/SERVICES OFFERED
  • TABLE 325 CARL ZEISS MEDITEC AG: COMPANY OVERVIEW
  • TABLE 326 CARL ZEISS MEDITEC AG: PRODUCTS/SOLUTIONS/SERVICE OFFERED
  • TABLE 327 CARL ZEISS MEDITEC AG: DEALS
  • TABLE 328 KOBE STEEL, LTD.: COMPANY OVERVIEW
  • TABLE 329 KOBE STEEL, LTD.: PRODUCTS/SOLUTIONS/SERVICES OFFERED
  • TABLE 330 IHI HAUZER TECHNO COATING B.V.: COMPANY OVERVIEW
  • TABLE 331 IHI HAUZER TECHNO COATING B.V.: PRODUCTS/SOLUTIONS/SERVICES OFFERED
  • TABLE 332 IHI IONBOND AG: COMPANY OVERVIEW
  • TABLE 333 IHI IONBOND AG: PRODUCTS/SOLUTIONS/SERVICES OFFERED
  • TABLE 334 ASB INDUSTRIES, INC.: COMPANY OVERVIEW
  • TABLE 335 ASB INDUSTRIES, INC.: PRODUCTS/SOLUTIONS/SERVICES OFFERED
  • TABLE 336 SDC TECHNOLOGIES, INC.: COMPANY OVERVIEW
  • TABLE 337 SDC TECHNOLOGIES, INC.: PRODUCTS/SOLUTIONS/SERVICES OFFERED
  • TABLE 338 DURALAR TECHNOLOGIES: COMPANY OVERVIEW
  • TABLE 339 DURALAR TECHNOLOGIES: PRODUCTS/SOLUTIONS/SERVICES OFFERED
  • TABLE 340 ULTRA OPTICS: COMPANY OVERVIEW
  • TABLE 341 ULTRA OPTICS: PRODUCTS/SOLUTIONS/SERVICES OFFERED
  • TABLE 342 MBI COATINGS: COMPANY OVERVIEW
  • TABLE 343 MBI COATINGS: PRODUCTS/SOLUTIONS/SERVICES OFFERED
  • TABLE 344 DHAKE INDUSTRIES INC.: COMPANY OVERVIEW
  • TABLE 345 DHAKE INDUSTRIES INC.: PRODUCTS/SOLUTIONS/SERVICES OFFERED
  • TABLE 346 PLATIT AG: COMPANY OVERVIEW
  • TABLE 347 PLATIT AG: PRODUCTS/SOLUTIONS/SERVICES OFFERED
  • TABLE 348 VOESTALPINE EIFELER GROUP: COMPANY OVERVIEW
  • TABLE 349 VOESTALPINE EIFELER GROUP: PRODUCTS/SOLUTIONS/SERVICES OFFERED
  • TABLE 350 HARDCOATINGS, INC.: COMPANY OVERVIEW
  • TABLE 351 HARDCOATINGS, INC.: PRODUCTS/SOLUTIONS/SERVICES OFFERED
  • TABLE 352 GENCOA LTD.: COMPANY OVERVIEW
  • TABLE 353 GENCOA LTD.: PRODUCTS/SOLUTIONS/SERVICES OFFERED
  • TABLE 354 EXXENE CORPORATION: COMPANY OVERVIEW
  • TABLE 355 EXXENE CORPORATION: PRODUCTS/SOLUTIONS/SERVICES OFFERED
  • TABLE 356 INDUSTRIAL HARD CARBON: COMPANY OVERVIEW
  • TABLE 357 INDUSTRIAL HARD CARBON: PRODUCTS/SOLUTIONS/SERVICES OFFERED
  • TABLE 358 PAXCON: COMPANY OVERVIEW
  • TABLE 359 PAXCON: PRODUCTS/SOLUTIONS/SERVICES OFFERED
  • TABLE 360 ARTIENCW CO., LTD.: COMPANY OVERVIEW
  • TABLE 361 ARTIENCW CO., LTD.: PRODUCTS/SERVICES/SOLUTIONS OFFERED
  • TABLE 362 KYOCERA HARDCOATING TECHNOLOGIES: COMPANY OVERVIEW
  • TABLE 363 KYOCERA HARDCOATING TECHNOLOGIES: PRODUCTS/SOLUTIONS/ SERVICES OFFERED
  • TABLE 364 PHOTON EXPORT: COMPANY OVERVIEW
  • TABLE 365 PHOTON EXPORT: PRODUCTS/SOLUTIONS/SERVICES OFFERED
  • TABLE 366 Z TECH: COMPANY OVERVIEW
  • TABLE 367 Z TECH: PRODUCTS/SOLUTIONS/SERVICES OFFERED
  • TABLE 368 PEERLESS PLASTICS & COATINGS: COMPANY OVERVIEW
  • TABLE 369 PEERLESS PLASTICS & COATINGS: PRODUCTS/SOLUTIONS/SERVICES OFFERED
LIST OF FIGURES
 
  • FIGURE 1 HARD COATINGS MARKET SEGMENTATION
  • FIGURE 2 HARD COATINGS MARKET: RESEARCH DESIGN
  • FIGURE 3 HARD COATINGS MARKET SIZE ESTIMATION, BY REGION
  • FIGURE 4 HARD COATINGS MARKET, BY DEPOSITION TECHNIQUE
  • FIGURE 5 HARD COATINGS MARKET: SUPPLY-SIDE FORECAST
  • FIGURE 6 METHODOLOGY FOR SUPPLY-SIDE SIZING OF HARD COATINGS MARKET
  • FIGURE 7 FACTOR ANALYSIS OF HARD COATINGS MARKET
  • FIGURE 8 RESEARCH METHODOLOGY: DATA TRIANGULATION
  • FIGURE 9 PVD DEPOSITION TECHNIQUE SEGMENT TO DOMINATE HARD COATINGS MARKET
  • FIGURE 10 NITRIDES MATERIAL TYPE TO ACCOUNT FOR LARGEST MARKET SHARE DURING FORECAST PERIOD
  • FIGURE 11 CUTTING TOOLS TO REMAIN LARGEST SEGMENT THROUGH FORECAST PERIOD
  • FIGURE 12 HARD COATINGS MARKET FOR GENERAL MANUFACTURING TO REGISTER HIGHEST GROWTH
  • FIGURE 13 ASIA PACIFIC TO RECORD FASTEST GROWTH DURING FORECAST PERIOD
  • FIGURE 14 GROWTH OF TRANSPORTATION AND AUTOMOTIVE COMPONENT SECTORS TO DRIVE MARKET IN ASIA PACIFIC
  • FIGURE 15 MULTI COMPONENTS SEGMENT TO REGISTER FASTEST GROWTH DURING FORECAST PERIOD
  • FIGURE 16 EMERGING ECONOMIES TO WITNESS HIGHER GROWTH RATE DURING FORECAST PERIOD
  • FIGURE 17 CHINA AND CUTTING TOOLS SEGMENTS ACCOUNTED FOR LARGEST MARKET SHARE IN ASIA PACIFIC
  • FIGURE 18 INDIA TO REGISTER HIGHEST CAGR DURING FORECAST PERIOD
  • FIGURE 19 DRIVERS, RESTRAINTS, OPPORTUNITIES, AND CHALLENGES IN HARD COATINGS MARKET
  • FIGURE 20 PORTER'S FIVE FORCES ANALYSIS: HARD COATINGS MARKET
  • FIGURE 21 GLOBAL FLEET SIZE, JUNE 2022
  • FIGURE 22 HARD COATINGS: SUPPLY CHAIN ANALYSIS
  • FIGURE 23 HARD COATINGS MARKET: ECOSYSTEM
  • FIGURE 24 LIST OF MAJOR PATENTS FOR HARD COATINGS
  • FIGURE 25 NITRIDE-BASED HARD COATINGS TO CONTINUE DOMINATING MARKET DURING FORECAST PERIOD
  • FIGURE 26 PVD HARD COATINGS TO CONTINUE DOMINATING MARKET TILL 2028
  • FIGURE 27 CUTTING TOOLS SEGMENT TO DOMINATE MARKET DURING FORECAST PERIOD
  • FIGURE 28 GENERAL MANUFACTURING TO DOMINATE HARD COATINGS MARKET DURING FORECAST PERIOD
  • FIGURE 29 ASIA PACIFIC TO BE FASTEST-GROWING MARKET DURING FORECAST PERIOD
  • FIGURE 30 ASIA PACIFIC: HARD COATINGS MARKET SNAPSHOT
  • FIGURE 31 NORTH AMERICA: HARD COATINGS MARKET SNAPSHOT
  • FIGURE 32 EUROPE: HARD COATINGS MARKET SNAPSHOT
  • FIGURE 33 MIDDLE EAST & AFRICA: HARD COATINGS MARKET SNAPSHOT
  • FIGURE 34 SOUTH AMERICA: HARD COATINGS MARKET SNAPSHOT
  • FIGURE 35 HARD COATINGS MARKET: COMPANY EVALUATION MATRIX, 2022
  • FIGURE 36 PRODUCT FOOTPRINT (25 COMPANIES)
  • FIGURE 37 HARD COATINGS MARKET: START-UP/SME EVALUATION MATRIX, 2022
  • FIGURE 38 OC OERLIKON MANAGEMENT AG: COMPANY SNAPSHOT
  • FIGURE 39 CARL ZEISS MEDITEC AG: COMPANY SNAPSHOT
  • FIGURE 40 KOBE STEEL, LTD.: COMPANY SNAPSHOT

The study involved four major activities in order to estimate the current size of the hard coatings market. Exhaustive secondary research was conducted to gather information on the market. The next step was to conduct primary research to validate these findings, assumptions, and sizing with the industry experts across the value chain. Both top-down and bottom-up approaches were used to estimate the total market size. The market size of segments and subsegments was then estimated using market breakdown and data triangulation.

Secondary Research

Secondary sources include annual reports of companies, press releases, investor presentations, white papers, articles by recognized authors, and databases, such as D&B, Bloomberg, Chemical Weekly, and Factiva; and publications and databases from associations, including International Organization of Motor Vehicle Manufacturers (OICA), Bureau of Transportation Statistics, European Automobile Manufacturers’ Association, World Bank, and American Coating Association.

Primary Research

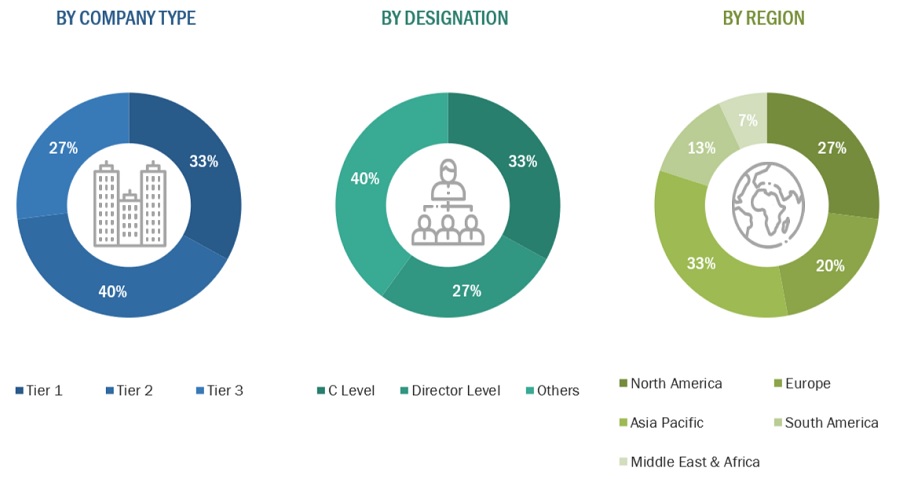
Extensive primary research was carried out after gathering information about hard coatings market through secondary research. In the primary research process, experts from the supply and demand sides have been interviewed to obtain qualitative and quantitative information and validate the data for this report. Questionnaires, emails, and telephonic interviews were used to collect primary data. Primary sources from the supply side include industry experts, such as chief executive officers (CEOs), vice presidents (VPs), marketing directors, technology and innovation directors, and related key executives from various key companies and organizations operating in the hard coatings market. Primary interviews were conducted to elicit information such as market statistics, revenue data collected from the products and services, market breakdowns, market size estimations, market forecasting, and data triangulation. Primary research also assisted in comprehending the various trends associated with resin type, vehicle type, coat type, technology, and region.

The Breakup of Primary Research:
Hard Coatings Market Size, and Share

To know about the assumptions considered for the study, download the pdf brochure

COMPANY NAME

DESIGNATION

Carl Zeiss Meditec AG

Sales Manager

SDC Technologies, Inc.

Project Manager

Ultra Optics

Individual Industry Expert

Cemecon AG

Manager

Market Size Estimation

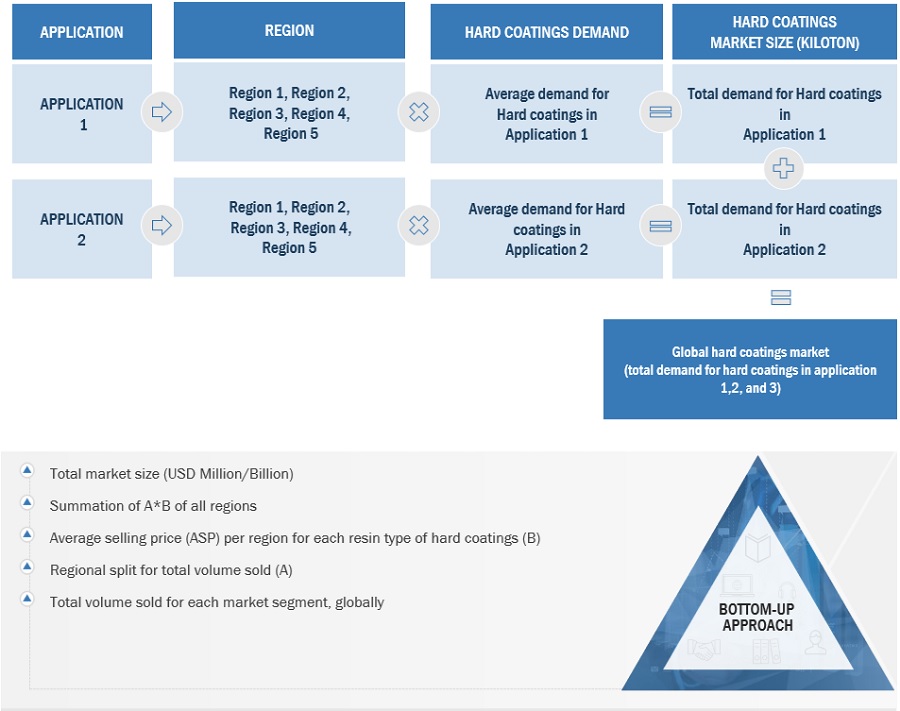
The following information is part of the research methodology used to estimate the size of the hard coatings market. The market sizing of the hard coatings market was undertaken from the demand side. The market size was estimated based on the market size for hard coatings in various applications.

Global Hard Coatings Market Size: Bottom Up Approach
Hard Coatings Market Size, and Share

To know about the assumptions considered for the study, Request for Free Sample Report

Global Hard Coatings Market Size: Top-Down Approach

Hard Coatings Market Size, and Share

Data Triangulation

After arriving at the overall market size, the market has been split into several segments. To complete the overall market engineering process and arrive at the exact statistics for all segments, the data triangulation and market breakdown procedures have been employed, wherever applicable. The data was triangulated by studying various factors and trends from the demand and supply sides. Along with this, the market size was validated using both the top-down and bottom-up approaches.

Market Definition

Hard coating refers to a thin protective layer applied to surfaces, typically metals or ceramics, to enhance their resistance to wear, abrasion, corrosion, and friction. These coatings are composed of hard materials such as carbides, nitrides, or diamond-like carbon, which significantly increase the surface hardness of the substrate. Hard coatings find extensive applications in various industries, including automotive, aerospace, manufacturing, and electronics, where durability and performance optimization are critical.

Key Stakeholders

  • End User
  • Raw Material Suppliers
  • Senior Management
  • Procurement Department

Report Objectives

  • To define, describe, segment, and forecast the size of the hard coatings market based on material type, deposition techniques, application, end-use industry, and region.
  • To forecast the market size of segments with respect to various regions, including North America, Europe, Asia Pacific, Middle East & Africa and South America along with major countries in each region
  • To identify and analyze key drivers, restraints, opportunities, and challenges influencing the growth of the hard coatings market
  • To analyze technological advancements and product launches in the market
  • To strategically analyze micro markets, with respect to their growth trends, prospects, and their contribution to the market
  • To identify financial positions, key products, and key developments of leading companies in the market
  • To provide a detailed competitive landscape of the market, along with market share analysis
  • To provide a comprehensive analysis of business and corporate strategies adopted by the key players in the market
  • To strategically profile key players in the market and comprehensively analyze their core competencies

Available Customizations

MarketsandMarkets offers the following customizations for this market report:

  • Additional country-level analysis of the hard coatings market
  • Profiling of additional market players (up to 5)

Product Analysis

  • Product matrix, which provides a detailed comparison of the product portfolio of each company in the automotive coatings Market

Previous Versions of this Report

Hard Coatings Market by Material Type (Nitrides, Oxides), Application (Cutting Tools, Decorative Coatings), Deposition Technique (PVD and CVD), End-Use Industry (General Manufacturing, Transportation), and by Region - Global Forecast to 2026

Report Code CH 4717
Published in Nov, 2016, By MarketsandMarkets™
"Our USP is "providing game-changing business opportunities reports with free customization" - so please feel free to provide us with your specific areas of interest / business challenges in much greater detail !!"

We appreciate your interest in this report. Once you fill out the form, you'll be immediately directed to an exclusive solution tailored to your needs. This high-value offering can help boost your revenue by 30% - a must-see opportunity for anyone looking to maximize growth.


By clicking the "Submit" button, you are agreeing to the Terms of Use and Privacy Policy.

Custom Market Research Services

We Will Customise The Research For You, In Case The Report Listed Above Does Not Meet With Your Requirements

Get 10% Free Customisation

Growth opportunities and latent adjacency in Hard Coatings Market

DMCA.com Protection Status