
Geospatial Imagery Analytics Market
Geospatial Imagery Analytics Market by Offering (Image Processing, Object Tracking, Change Detection), Data Source (Satellite Imagery, SAR, UAV/Drones), Application (Disaster Management, Precision Farming, Urban Planning) - Global Forecast to 2030


OVERVIEW
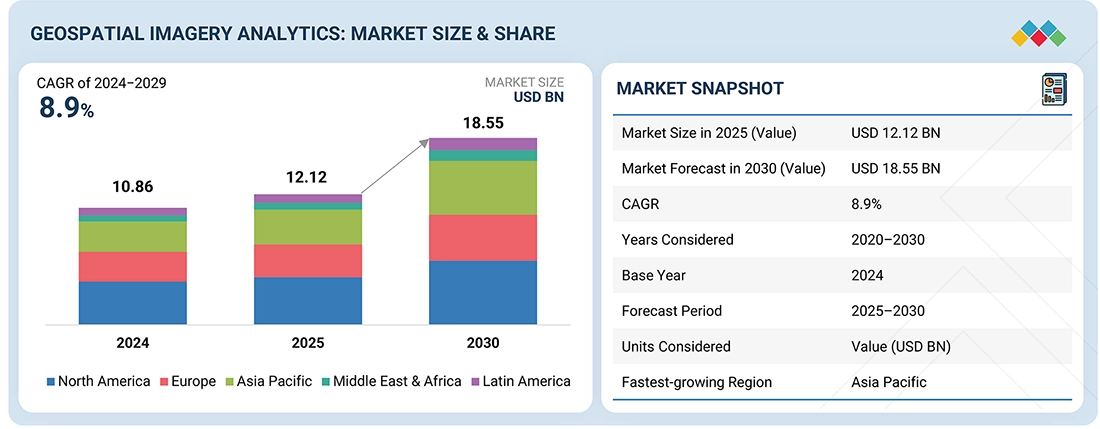
Source: Secondary Research, Interviews with Experts, MarketsandMarkets Analysis
The global geospatial imagery analytics market is projected to grow from USD 12.12 billion in 2025 to USD 18.55 billion by 2030, at a CAGR of 8.9%. This growth is driven by the increasing demand for real-time, location-based intelligence across sectors such as urban planning, agriculture, defense, and disaster response. Geospatial imagery analytics is enabling organizations to extract actionable insights from satellite, drone, and aerial imagery. Key applications include Urban planning: Infrastructure development, land use optimization, and smart city initiatives, Environmental monitoring: Deforestation tracking, climate impact analysis, and pollution mapping, Defense and intelligence: Border surveillance, threat detection, and mission planning, Disaster response: Damage assessment, resource allocation, and emergency logistics. The integration of AI and machine learning with geospatial data is transforming how imagery is processed and interpreted. AI models enable Automated object detection and classification, Change detection over time, Predictive analytics for risk and impact assessment. The increasing availability of high-resolution satellite imagery and hyperspectral data is further enhancing the precision and utility of geospatial analytics. Recent initiatives underscore the tangible value of geospatial analyticsPixxel–Agri MoU (India): Leveraging hyperspectral imaging for crop mapping and soil carbon monitoring, supporting sustainable agriculture, World Bank’s Project360 (2023): Integrated satellite and drone imagery to reduce monitoring and evaluation (M&E) costs by USD 2 million over three years in fragile regions. These examples highlight the role of geospatial analytics in cost optimization, data-driven governance, and climate resilience. Technology buyers are prioritizing platforms that offer AI-powered geospatial analytics, cloud-native scalability, and interoperability with GIS systems. Vendors are focusing on vertical-specific solutions, real-time data pipelines, and API-first architectures to support integration with enterprise workflows.
KEY TAKEAWAYS
- By Region, North America accounted for largest market share of 36.47% in 2025.
- Within software by functionality, image processing & enhancement segment dominates the market share in 2025
- By Data Source, the UAV/Drones segment is expected to grow at the highest CAGR of 10.6%.
- By Data Modality, the Image-based Analytics segment is projected to hold largest market share during the forecast period
- Insurance risk assessment & claims validation is projected to witness the fastest growth among applications, at a CAGR of 10.9% from 2025 to 2030
- The insurance vertical is expected to grow at the highest CAGR during the forecast period.
- Leading players such as Google, Hexagon AB, and Esri are pursuing both organic growth and strategic collaborations to expand their product ecosystems. The competitive landscape is shaped by innovation in AI-powered analytics, cloud-based geospatial platforms, and real-time visualization tools.
- Companies like Capella Space, EOS Data Analytics, and EarthDaily Analytics among others, have distinguished themselves among startups and SMEs by securing strong footholds in specialized niche areas, underscoring their potential as emerging market leaders.
The Geospatial Imagery Analytics market is undergoing rapid transformation, fueled by the convergence of AI, remote sensing advancements, and cloud computing. With applications spanning agriculture, defense, urban planning, and disaster management, the market is poised for sustained growth. Proliferation of small satellites and reduced launch costs, High-resolution, real-time imagery availability. AI-powered feature detection and predictive modeling, Government initiatives in smart infrastructure and climate monitoring, Cloud-native geospatial platforms enabling scalable data processing is driving the adoption.
TRENDS & DISRUPTIONS IMPACTING CUSTOMERS' CUSTOMERS
The rapid evolution of AI/ML, satellite and drone technology, and 3D geospatial modeling is transforming how industries leverage geospatial imagery analytics. Traditional sources such as static aerial photographs and manual terrain interpretation are being replaced by real-time, multi-layered geospatial datasets. In agriculture, climate change and precision farming demand dynamic crop monitoring. Insurers now require granular risk assessments and post-disaster damage evaluation using drone imagery. Governments and defence departments face mounting pressures for real-time surveillance, disaster response, and border security. Meanwhile, the construction and real estate sectors demand high-accuracy terrain and infrastructure modeling to accelerate planning and reduce project risk. Regulatory push for smart city development, the surge in extreme climate events, and increasing urbanization are expected to create new revenue pockets across these sectors, driving the adoption of next-gen geospatial analytics platforms.
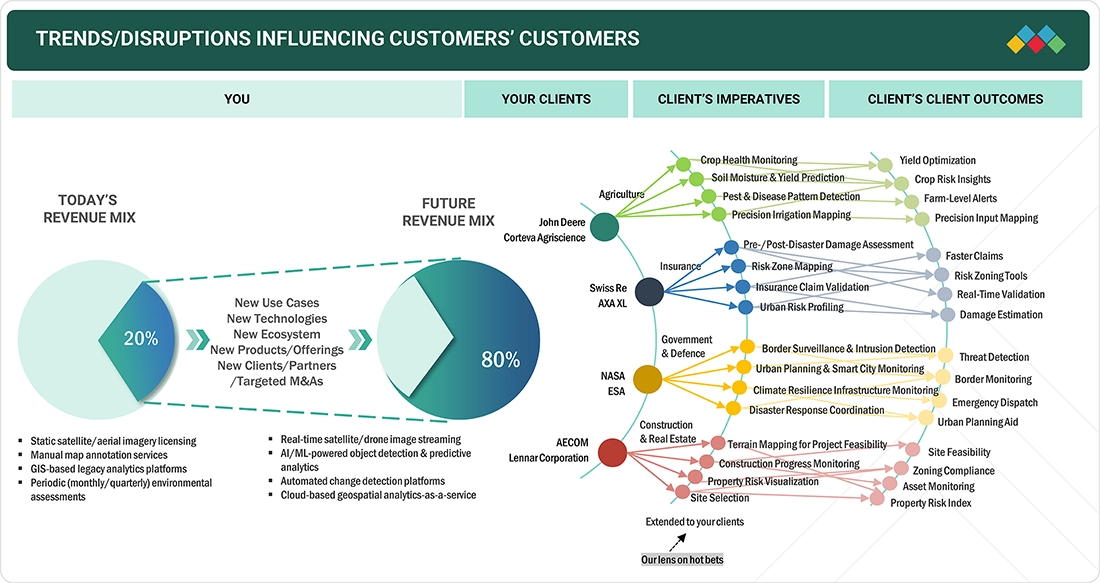
Source: Secondary Research, Interviews with Experts, MarketsandMarkets Analysis
MARKET DYNAMICS
Level
-
Rising Demand for Real-Time Environmental Intelligence

-
Growing use of geospatial imagery in smart city and infrastructure projects
Level
-
High Cost and Data Fragmentation
-
Complexities in integration and standardization of geospatial data
Level
-
AI and Cloud Enabling Scalable Spatial Intelligence
-
Expansion of Commercial Satellite Constellations
Level
-
Data Accuracy and Ethical Governance
-
Temporal and Spatial Resolution Tradeoffs
Source: Secondary Research, Interviews with Experts, MarketsandMarkets Analysis
Rising Demand for Real-Time Environmental Intelligence
The need for real-time environmental intelligence is a key driver of market growth. Governments, NGOs, and enterprises are leveraging satellite and aerial imagery to monitor Deforestation and land degradation, Urban sprawl and infrastructure development, Natural disasters and emergency response. The integration of AI and machine learning enhances image interpretation, enabling Faster decision-making, Predictive modeling, Sustainability planning. These capabilities are critical for climate resilience, resource optimization, and disaster preparedness.
High Cost and Data Fragmentation
Despite growing demand, the market faces challenges related to High costs of data storage, processing, and licensing, Fragmented data sources from satellites, drones, and IoT sensors, Integration complexity and scalability limitations. These barriers disproportionately affect SMEs and public-sector agencies, limiting their ability to fully leverage geospatial intelligence. Addressing these issues requires Standardized data formats, Interoperable platforms, Cost-effective cloud-based solutions.
AI and Cloud Enabling Scalable Spatial Intelligence
The convergence of AI, cloud computing, and next-gen satellite imaging is creating new opportunities for scalable geospatial analytics. Organizations can now Automate image classification and object detection, Integrate geospatial insights into business workflows, Collaborate across ecosystems via cloud-native platforms. Use cases span Insurance risk modeling, Precision agriculture, Urban infrastructure planning, Climate adaptation strategies. Cloud-based geospatial ecosystems are enabling global accessibility, cross-sector collaboration, and faster innovation.
Data Accuracy and Ethical Governance
As high-resolution imagery becomes more accessible, ensuring data accuracy, privacy, and ethical use is increasingly critical. Key challenges include Inconsistent image quality and resolution, AI model bias and lack of explainability, Data ownership and usage rights disputes. To maintain trust and reliability, especially in sensitive domains like defense, insurance, and disaster management, organizations must implement Transparent AI models, Explainable geospatial analytics, Robust data governance frameworks.
Geospatial Imagery Analytics Market: COMMERCIAL USE CASES ACROSS INDUSTRIES
| COMPANY | USE CASE DESCRIPTION | BENEFITS |
|---|---|---|
 |
Ship detection is vital for maritime surveillance including monitoring traffic, illegal fishing, and sea border activities. AIS cannot detect ships without transponders or those with disconnected transponders. Geocento used SAR imagery to track ships and supplement conventional AIS data with satellite imagery. | Geocento introduced a supplement to conventional AIS data, demonstrating that SAR could track and monitor ships that may not want to be tracked. The solution provided comprehensive monitoring of uncooperative ships using radio waves imaging. |
 |
The insurance sector in India is vital for the nation's financial health. Bajaj Finserv faced challenges with high NPAs, delinquency, and needed spatial capability to look at risk locations. Esri's ArcGIS platform was integrated with the CRM system for identifying areas based on risk propensity. | Bajaj Finserv benefited from Esri's solutions significantly. It reduced delinquency within the customer base, helped filter bad customers at entry level through real-time integration, improved field agent allocation, and enabled proximity-based product offerings using geospatial solutions. |
 |
Madhya Pradesh has 33% forest cover serving as primary resource for multiple industries. The state government needed to track planning changes and land use efficiently. Madhya Pradesh Forestry Department used ERDAS IMAGINE professional and ERDAS APOLLO solutions from Hexagon to conduct time series analysis. | The Madhya Pradesh Forestry Department can effectively detect forest changes over years. The project helps organize a file-based repository, enables geospatial and business data in a human-readable library, and supports vegetation surveillance by identifying forest land encroachment. |
Logos and trademarks shown above are the property of their respective owners. Their use here is for informational and illustrative purposes only.
MARKET ECOSYSTEM
The geospatial imagery analytics market ecosystem, comprises of image processing & enhancement, object tracking & feature detection, change detection & time-series analysis, predictive modeling & pattern recognition, AI/ML-based geospatial analytics, and others (anomaly detection and stream analytics). This segmented ecosystem works collaboratively to drive the transition toward more efficient workflows and output generation, leveraging technology and data to achieve goals.
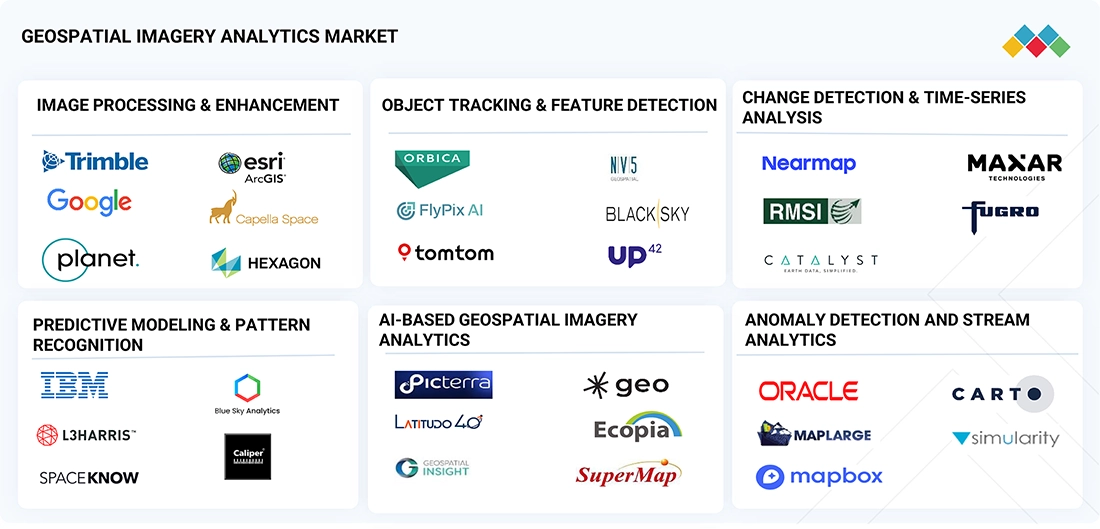
Logos and trademarks shown above are the property of their respective owners. Their use here is for informational and illustrative purposes only.
MARKET SEGMENTS
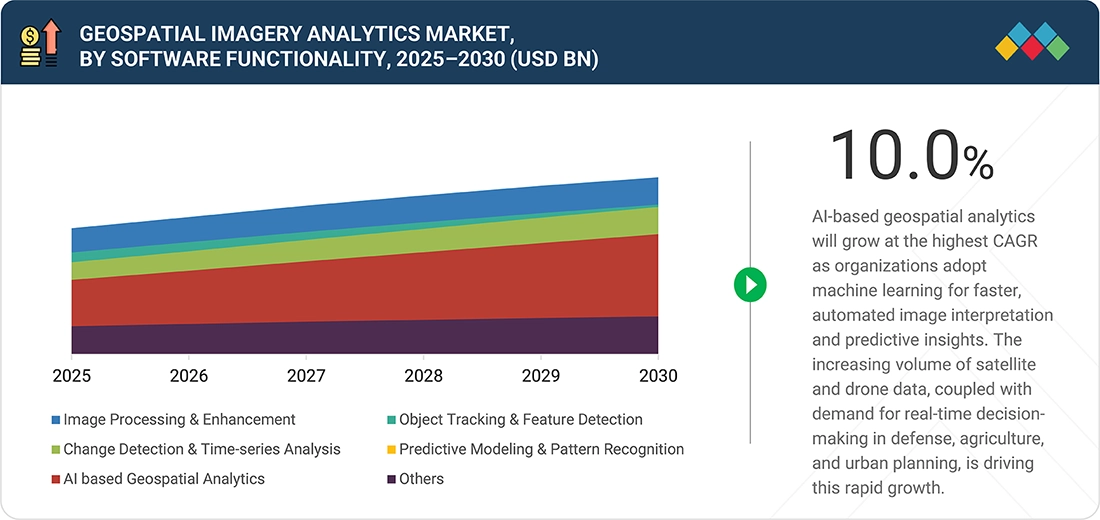
Source: Secondary Research, Interviews with Experts, MarketsandMarkets Analysis
Geospatial Imagery Analytics Market, By Offering
AI-powered geospatial analytics platforms are transforming how organizations interpret and act on imagery data. These solutions leverage machine learning to Detect anomalies and classify land cover, Predict environmental and structural changes, Automate image analysis workflows. By reducing manual processing time and increasing accuracy, AI-driven platforms enable Faster response cycles, Scalable deployment across cloud environments, Smarter insights for real-time decision-making.
Geospatial Imagery Analytics Market, By Data Modality
Multimodal geospatial analytics—integrating imagery, LiDAR, radar, and sensor data—is reshaping how organizations perceive and manage physical environments. This approach enables Comprehensive environmental modeling, Enhanced infrastructure inspection, Improved disaster response and recovery planning. By fusing diverse data types, enterprises gain a 360-degree view of assets and terrain, improving decision accuracy in complex, high-stakes scenarios.
Geospatial Imagery Analytics Market, By Data Source
Unmanned Aerial Vehicles (UAVs) and drones are becoming critical data sources for localized, high-resolution geospatial imagery. Their advantages include Agility and cost-efficiency, Rapid deployment for real-time data capture, Enhanced situational awareness in dynamic environments. Key use cases include Disaster assessment and emergency response, Infrastructure and asset monitoring, Precision agriculture and environmental surveys.
Geospatial Imagery Analytics Market, By Application
Geospatial imagery analytics is transforming insurance operations, particularly in Risk assessment and underwriting: AI-powered image analysis helps insurers evaluate property conditions, assess exposure, and model disaster risk. Claims validation: Satellite and drone imagery enables remote damage assessment, fraud detection, and faster claims processing. Portfolio optimization: Geospatial insights support pricing accuracy and improve overall risk management. These capabilities reduce operational costs, enhance customer trust, and enable data-driven decision-making in insurance workflows.
Geospatial Imagery Analytics Market, By Verticals
The insurance industry is emerging as a key vertical in geospatial imagery analytics due to its need for Accurate risk quantification, Disaster resilience modeling, Regulatory compliance and transparency. Insurers are integrating satellite, drone, and ground-level data to Improve underwriting precision, Enhance claims efficiency, Strengthen portfolio resilience.
REGION
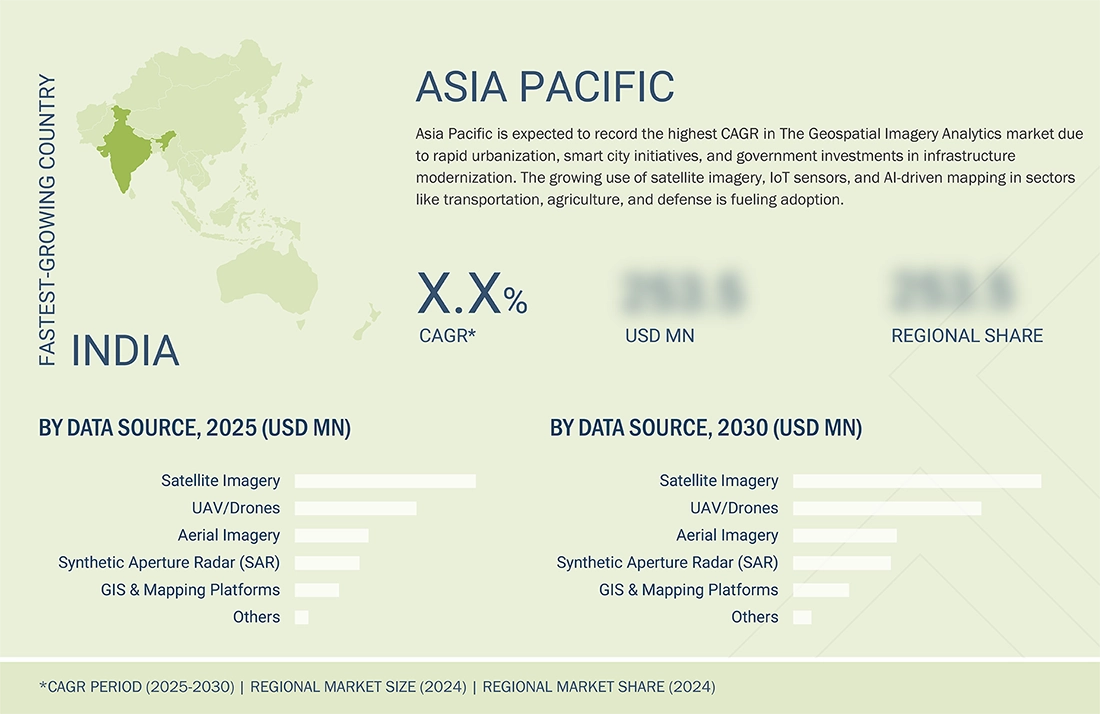
Asia Pacific to be fastest-growing region in global Geospatial Imagery Analytics Market during the forecast period
Asia Pacific is projected to grow at the highest CAGR in the geospatial imagery analytics market due to rapid infrastructure development, smart city initiatives, and rising defense modernization programs. The region’s increasing adoption of AI, satellite imagery, and remote sensing technologies is enhancing capabilities in environmental monitoring, disaster management, and urban planning. Expanding investments in space programs and collaborations with global geospatial firms further accelerate market growth. Additionally, the booming construction, agriculture, and logistics sectors are driving demand for high-resolution, real-time imagery analytics across the region.
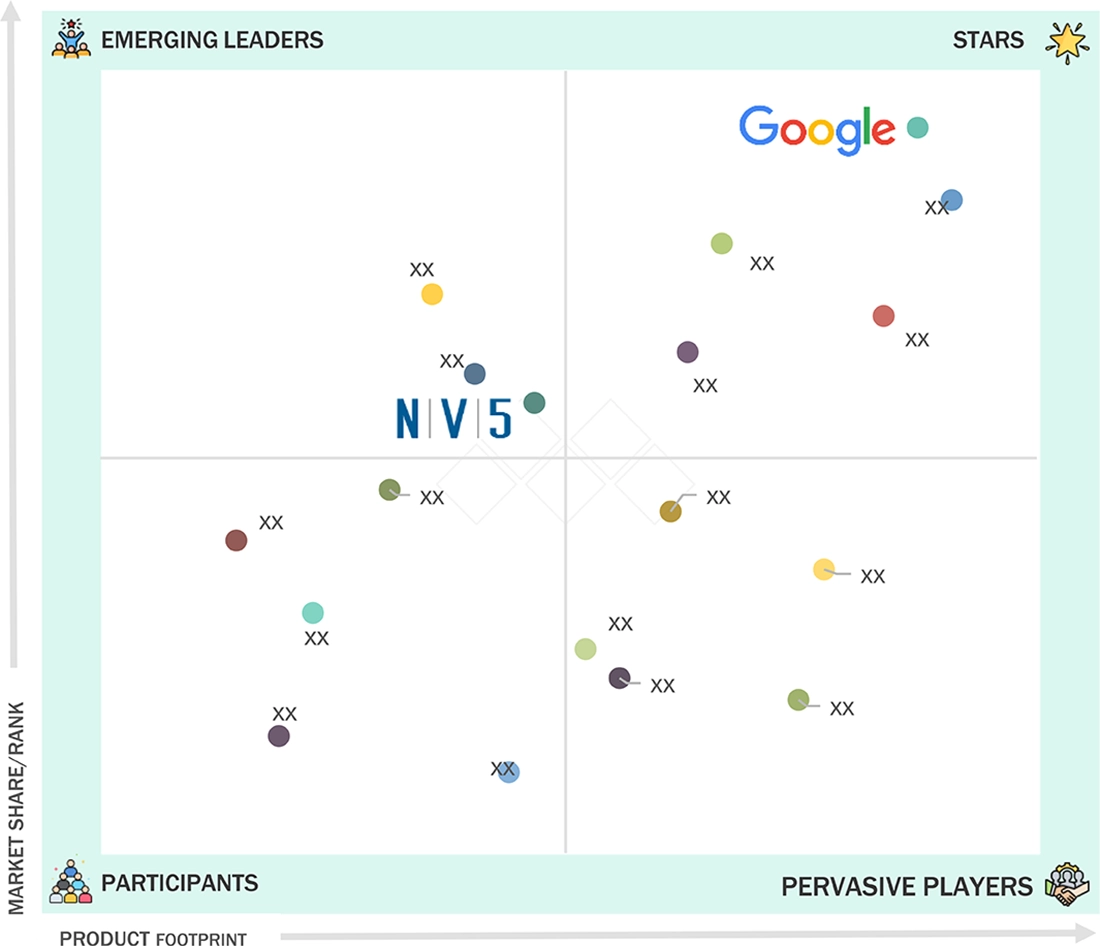
Geospatial Imagery Analytics Market: COMPANY EVALUATION MATRIX
In the Geospatial Imagery Analytics market matrix, Google (Star) leads with its advanced imaging and AI-powered analytics capabilities that transform satellite and aerial imagery into actionable insights for industries ranging from urban planning to environmental monitoring. Its vast data ecosystem, cloud infrastructure, and integration with machine learning tools strengthen its leadership in delivering scalable, real-time geospatial intelligence. NV5 Geospatial (Emerging Leader) is rapidly advancing with its expertise in high-resolution imagery, LiDAR, and remote sensing technologies that provide precise, data-rich analytics for infrastructure, energy, and environmental applications. Its focus on technical excellence and customized geospatial solutions positions it as a fast-growing contender in the geospatial imagery analytics landscape.
Source: Secondary Research, Interviews with Experts, MarketsandMarkets Analysis
KEY MARKET PLAYERS
MARKET SCOPE
| REPORT METRIC | DETAILS |
|---|---|
| Market Size in 2024 (Value) | USD 12.12 BN |
| Market Forecast in 2029 (value) | USD 18.55 BN |
| Growth Rate | 8.90% |
| Years Considered | 2020–2030 |
| Base Year | 2024 |
| Forecast Period | 2025–2030 |
| Units Considered | USD Million |
| Report Coverage | Revenue forecast, company ranking, competitive landscape, growth factors, and trends |
| Segments Covered |
|
| Regions Covered | North America, Asia Pacific, Europe, the Middle East & Africa, and Latin America |
WHAT IS IN IT FOR YOU: Geospatial Imagery Analytics Market REPORT CONTENT GUIDE
DELIVERED CUSTOMIZATIONS
We have successfully delivered the following deep-dive customizations:
| CLIENT REQUEST | CUSTOMIZATION DELIVERED | VALUE ADDS |
|---|---|---|
| Leading Geospatial Imagery Analytics Vendor |
|
|
| Leading Geospatial Imagery Analytics Vendor |
|
|
RECENT DEVELOPMENTS
- May 2025 : Maxar partnered with Reveal Technology to enhance the Farsight platform by integrating Maxar’s high-resolution satellite imagery and 3D data. This partnership boosts situational awareness by enabling users to visualize complex geospatial environments with greater detail and accuracy.
- April 2025 : The latest update to TomTom's Satellite imagery introduced enhancements to the Map Display API's satellite imagery capabilities. The service now offers high-resolution satellite tiles sourced from Maxar, with imagery captured in or after 2021, providing detailed views of urban areas.
- January 2025 : Google expanded its collaboration with EPAM to deliver scalable AI solutions, including advanced geospatial data visualization. This collaboration enhances analysis and decision-making in geospatial imagery, especially for industries like energy and environmental management.
- April 2025 : Maxar partnered with UP42 to integrate its high-resolution satellite imagery and tasking capabilities into the UP42 geospatial platform. This partnership enables UP42 customers to directly task Maxar’s advanced satellite constellation, including the WorldView Legion satellites, providing near real-time access to imagery with revisit rates of up to fifteen times per day over key locations.
- March 2025 : Maptitude 2025 introduced advanced territory management, including auto-filling gaps and detecting non-contiguous areas. It also enhanced routing capabilities with cost-per-mile/hour analysis and side-of-street constraints while supporting large-scale databases and offering improved online mapping tools.
Table of Contents

Methodology
This research study for the geospatial imagery analytics market involved extensive secondary sources, directories, journals, and paid databases. Primary sources were mainly industry experts from the core and related industries, preferred geospatial imagery analytics providers, third-party service providers, consulting service providers, end users, and other commercial enterprises. In-depth interviews with primary respondents, including key industry participants and subject matter experts, were conducted to obtain and verify critical qualitative and quantitative information and assess the market’s prospects.
Secondary Research
In the secondary research process, various sources were referred to to identify and collect information for the study. The secondary sources included annual reports, press releases, investor presentations of companies, white papers, journals, certified publications, and articles from recognized authors, directories, and databases. The data was also collected from other secondary sources, such as AI conferences and related magazines. Additionally, the geospatial imagery analytics spending of various countries was extracted from respective sources. Secondary research was used to obtain key information about the industry’s value chain and supply chain to identify key players by solution, service, market classification, and segmentation according to the offerings of major players and industry trends related to solutions, applications, verticals, and regions, and key developments from both market and technology-oriented perspectives.
Primary Research
In the primary research process, various primary sources from both the supply and demand sides were interviewed to obtain qualitative and quantitative information on the market. The primary sources from the supply side included various industry experts, including Chief Experience Officers (CXOs); Vice Presidents (VPs); directors from business development, marketing, and geospatial imagery analytics expertise; related key executives from geospatial imagery analytics solution vendors, SIs, managed service providers, and industry associations; and key opinion leaders.
Primary interviews were conducted to gather insights, such as market statistics, revenue data collected from solutions and services, market breakups, market size estimations, market forecasts, and data triangulation. Primary research also helped understand various trends related to technologies, applications, data types, service types, software types, verticals, and regions. Stakeholders from the demand side, such as Chief Information Officers (CIOs), Chief Technology Officers (CTOs), Chief Strategy Officers (CSOs), and end users using Geospatial imagery analytics solutions, were interviewed to understand the buyer’s perspective on suppliers, products, service providers, and their current usage of Geospatial imagery analytics, which would impact the overall geospatial imagery analytics market.

Note: Tier 1 companies account for annual revenue of >USD 10 billion; tier 2 companies’ revenue
ranges between USD 1 and 10 billion; and tier 3 companies’ revenue ranges between USD 500 million–USD 1
billion
Source: MarketsandMarkets Analysis
To know about the assumptions considered for the study, download the pdf brochure
Market Size Estimation
Multiple approaches were adopted to estimate and forecast the geospatial imagery analytics market. The first approach involves estimating the market size by summating companies’ revenue generated by selling solutions and services.
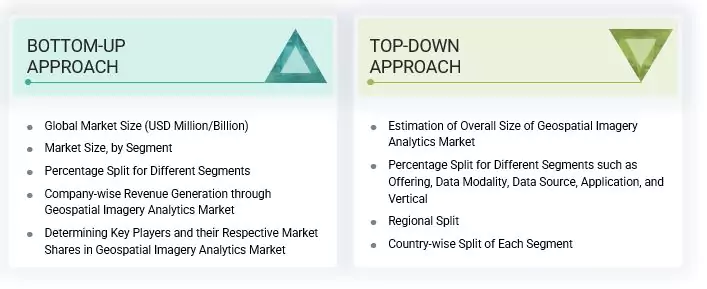
Market Size Estimation Methodology- Top-down approach
In the top-down approach, an exhaustive list of all the vendors offering solutions and services in the geospatial imagery analytics market was prepared. The revenue contribution of the market vendors was estimated through annual reports, press releases, funding, investor presentations, paid databases, and primary interviews. Each vendor's offerings were evaluated based on the breadth of solutions according to software type, service type, technology, data type, and vertical. The aggregate of all the companies’ revenue was extrapolated to reach the overall market size. Each subsegment was studied and analyzed for its global market size and regional penetration. The markets were triangulated through both primary and secondary research. The primary procedure included extensive interviews for key insights from industry leaders, such as CIOs, CEOs, VPs, directors, and marketing executives. The market numbers were further triangulated with the existing MarketsandMarkets repository for validation.
Market Size Estimation Methodology-Bottom-up approach
In the bottom-up approach, the adoption rate of geospatial imagery analytics solutions and services among different end users in key countries with respect to their regions contributing the most to the market share was identified. For cross-validation, the adoption of geospatial imagery analytics solutions among industries, along with different use cases with respect to their regions, was identified and extrapolated. Use cases identified in different regions were given weightage for the market size calculation.
Based on the market numbers, the regional split was determined by primary and secondary sources. The procedure included the analysis of the geospatial imagery analytics market’s regional penetration. Based on secondary research, the regional spending on Information and Communications Technology (ICT), socio-economic analysis of each country, strategic vendor analysis of major geospatial imagery analytics providers, and organic and inorganic business development activities of regional and global players were estimated. With the data triangulation procedure and data validation through primary interviews, the exact values of the overall geospatial imagery analytics market size and segments’ size were determined and confirmed using the study.
Geospatial Imagery Analytics Market : Top-Down and Bottom-Up Approach
Data Triangulation
The market was split into several segments and subsegments after arriving at the overall market size using the market size estimation processes as explained above. To complete the overall market engineering process and arrive at the exact statistics of each market segment and subsegment, data triangulation and market breakup procedures were employed, wherever applicable. The overall market size was then used in the top-down procedure to estimate the size of other individual markets via percentage splits of the market segmentation.
Market Definition
The geospatial imagery analytics market comprises digital solutions that enable insurers to manage core processes such as policy administration, underwriting, claims management, and customer engagement. These platforms leverage cloud computing, automation, and data analytics to enhance operational efficiency, improve customer experiences, and support product innovation. They cater to insurers, brokers, and third-party service providers, facilitating seamless integration with ecosystems and regulatory compliance.
Stakeholders
- Geospatial imagery analytics software providers
- Geospatial imagery analytics service providers
- Third-party administrators
- Business analysts
- Cloud service providers
- Consulting service providers
- Enterprise end-users
- Distributors and value-added resellers (VARs)
- Government agencies
- Independent software vendors (ISV)
- Managed service providers
- Support & maintenance service providers
- System integrators (SIs)/migration service providers
- Technology providers
Report Objectives
- To define, describe, and forecast the geospatial imagery analytics market by offering, data modality, data source, application, and vertical
- To provide detailed information related to major factors (drivers, restraints, opportunities, and industry-specific challenges) influencing the market growth
- To analyze the micro markets with respect to individual growth trends, prospects, and their contribution to the total market
- To analyze the opportunities in the market for stakeholders by identifying the high-growth segments of the market
- To analyze opportunities in the market and provide details of the competitive landscape for stakeholders and market leaders
- To forecast the market size of segments for the five main regions: North America, Europe, Asia Pacific, the Middle East & Africa, and Latin America
- To profile the key players and comprehensively analyze their market ranking and core competencies
- To analyze competitive developments, such as partnerships, product launches, and mergers & acquisitions, in the geospatial imagery analytics market
Available Customizations
With the given market data, MarketsandMarkets offers customizations as per your company’s specific needs. The following customization options are available for the report:
Product Analysis
- Product quadrant, which gives a detailed comparison of the product portfolio of each company.
Geographic Analysis as per Feasibility
- Further breakup of the North American geospatial imagery analytics market
- Further breakup of the European market
- Further breakup of the Asia Pacific market
- Further breakup of the Middle Eastern & African market
- Further breakup of the Latin American market
Company Information
- Detailed analysis and profiling of additional market players (up to five)
Key Questions Addressed by the Report
What is geospatial imagery analytics?
Geospatial imagery analytics involves examining satellite or aerial imagery to derive valuable insights about the Earth's surface. It leverages remote sensing, Geographic Information Systems (GIS), and advanced computational methods to detect spatial patterns, changes, and physical features. Geospatial imagery analytics is widely applied in fields such as land use management, disaster monitoring, environmental assessment, and urban development. It enables organizations to conduct accurate spatial analysis and support strategic planning through data-driven insights.
What are the key benefits of using geospatial imagery analytics?
Geospatial imagery analytics provides organizations with deep situational awareness and strategic intelligence that supports faster and more accurate decision-making. One of its most valuable benefits is the ability to detect potential risks or anomalies—such as environmental hazards, infrastructure damage, or unauthorized activities—before they escalate. For instance, by continuously monitoring changes in land cover, weather patterns, or construction progress, businesses and governments can take preventive action and avoid costly delays or damage.
Which industries benefit most from geospatial imagery analytics software and services?
Geospatial imagery analytics benefits a wide range of industries, especially those with distributed assets or operations. In agriculture, it enhances productivity by monitoring crop health and managing resources precisely. Insurance firms use it to assess disaster damage, detect fraud, and refine risk models. Energy and utility companies rely on it for infrastructure inspection and maintenance. Governments and urban planners apply it in zoning, smart city development, and transport planning. Environmental agencies track deforestation and climate impacts, while defense and security sectors use it for surveillance and threat assessment.
What is the difference between geospatial analytics and geospatial imagery analytics?
While both terms are related, geospatial analytics refers broadly to analyzing any geographically referenced data, such as location coordinates, addresses, or movement patterns. Geospatial imagery analytics is a subfield that specifically deals with the analysis of visual image data from satellites, drones, and other imaging systems to derive insights about the Earth’s surface and changes over time.
Are there data privacy or regulatory concerns with geospatial imagery analytics?
Yes, depending on the region and use case, organizations may need to comply with privacy regulations, especially when imagery captures private properties or sensitive sites. Additionally, international regulations like ITAR (International Traffic in Arms Regulations) or GDPR (General Data Protection Regulation) may apply, particularly when sharing or storing data across borders.
Need a Tailored Report?
Customize this report to your needs
Get 10% FREE Customization
Customize This ReportPersonalize This Research
- Triangulate with your Own Data
- Get Data as per your Format and Definition
- Gain a Deeper Dive on a Specific Application, Geography, Customer or Competitor
- Any level of Personalization
Let Us Help You
- What are the Known and Unknown Adjacencies Impacting the Geospatial Imagery Analytics Market
- What will your New Revenue Sources be?
- Who will be your Top Customer; what will make them switch?
- Defend your Market Share or Win Competitors
- Get a Scorecard for Target Partners
Custom Market Research Services
We Will Customise The Research For You, In Case The Report Listed Above Does Not Meet With Your Requirements
Get 10% Free Customisation


Growth opportunities and latent adjacency in Geospatial Imagery Analytics Market