Functional Food Ingredients Market

Functional Food Ingredients Market by Type (Probiotics, Protein & Amino Acids, Phytochemicals & Plant Extracts, Prebiotics, Omega-3 Fatty Acids, Carotenoids, Vitamins), Application, Source, Form, Health Benefits and Region - Global Forecast to 2029

Report Code: FB 3559 Apr, 2024, by marketsandmarkets.com

The functional food ingredients market is projected to reach USD 165.8 billion by 2029 from USD 119.2 billion by 2024, at a CAGR of 6.8% during the forecast period in terms of value. The demand for functional food enriched with nutritious ingredients originates from evolving consumer desires for healthier eating habits and lifestyles. Increasing awareness of nutrition and overall well-being motivates individuals to seek out products offering specific health benefits, such as improved digestion or enhanced immune function.

The rising prevalence of lifestyle diseases such as obesity and diabetes has underscored the importance of preventive healthcare. In 2022, the World Health Organization (WHO) reported 2.5 billion adults over 18 were overweight, with over 890 million living with obesity. WHO also mentioned that the obesity rates more than doubled globally from 1990 to 2022. Consumers are increasingly seeking food and beverages fortified with functional ingredients known to promote health and wellness, such as probiotics, omega-3 fatty acids, and vitamins.

Moreover, increased consumer awareness regarding the correlation between diet and health has led to a shift in consumption patterns. Healthy food and beverages are now prioritized, with consumers willing to pay premium prices for products perceived to offer functional benefits. This trend is particularly pronounced among urban populations with rising disposable incomes. For instance, in October 2022, Kerry Group plc (Ireland) conducted research surveying 10,000 consumers from 18 countries across North America, South America Europe, Asia Pacific, South Africa, and Australia, revealing shifting priorities in functional beverages. The research found that immune support remains paramount globally, with 53% expressing interest in science-backed ingredients such as vitamins, omega-3, and probiotics. Customized solutions for different age groups are sought, emphasizing holistic wellness encompassing inner and outer health. Beauty concerns, including skin and hair, are rising, alongside a growing demand for products aiding weight management, heart health, and sports performance. This trend fuels increased demand for functional food ingredients catering to diverse consumer needs.

Additionally, the aging population worldwide has contributed to the demand for functional food ingredients targeting age-related health concerns, including cognitive decline and bone health. However, despite the growing demand, stringent regulations and approval processes pose challenges for market players. Compliance with regulatory standards and obtaining necessary approvals for new ingredients can be time-consuming and costly, inhibiting market growth.

Functional Food Ingredients Market Overview

To know about the assumptions considered for the study, Request for Free Sample Report

Functional Food Ingredients Market Opportunities

To know about the assumptions considered for the study, download the pdf brochure

Functional Food Ingredients Market Dynamics

Drivers: Increase in consumption of nutritive convenience and fortified food products

Busy schedules, rising health consciousness, and awareness about nutritional deficiencies drive consumers to seek out products that offer both convenience and health benefits. Nutritive convenience foods, such as pre-packaged salads, smoothies, and meal replacement bars, provide quick and easy solutions for individuals on the go, while fortified food products, including fortified cereals, milk, and beverages, address specific nutrient deficiencies and offer added health benefits.

In response to this growing demand, various manufacturers have capitalized on the trend by launching a plethora of functional food and beverage products. These products are formulated with specific ingredients, such as vitamins, minerals, probiotics, and omega-3 fatty acids, to provide additional health benefits beyond basic nutrition. From energy-boosting snacks to immunity-boosting drinks, the functional food and beverage market has witnessed a surge in innovative product offerings catering to diverse consumer needs. For instance, in May 2021, The US Food and Drug Administration (FDA) granted Cargill a letter of no objection for its GRAS notification regarding the incorporation of EpiCor postbiotic into certain food and beverage applications. This dried yeast fermentate, demonstrated in clinical trials for dietary supplements, effectively regulates gut microbiota and offers beneficial support to the immune system. This opens up new avenues for creating innovative products that cater to consumers' growing interest in functional foods and beverages that support gut health and immune function.

This surge in functional food and beverage products, in turn, has fueled the demand for functional food ingredients. Manufacturers are increasingly seeking high-quality, scientifically-backed ingredients that not only enhance the nutritional profile of their products but also offer functional properties, such as improved digestion, enhanced immunity, and better cognitive function.

Restraints: High production costs and requirement for significant R&D investments

High production costs and the necessity for significant R&D investments pose primary constraints within the functional food ingredients market. Production costs soar due to factors such as raw material scarcity and the sourcing complexities of naturally derived ingredients. Extracting bioactive compounds from rare plants or marine organisms, for instance, amplifies expenses owing to cultivation challenges and environmental regulations.

Furthermore, stringent quality and safety standards inflate costs as manufacturers must invest in extensive testing and compliance measures to ensure product consistency and regulatory adherence. Simultaneously, substantial R&D investments are imperative for continuous innovation and product differentiation in this competitive landscape. Research efforts are essential for discovering new bioactive compounds, refining extraction techniques, and enhancing ingredient efficacy.

These high production costs and R&D investments pose barriers for both manufacturers and consumers. Manufacturers face challenges in maintaining competitive pricing while ensuring product quality and innovation. Consequently, consumers may encounter higher prices for functional food products, potentially deterring widespread adoption. Moreover, limited R&D investment may hinder the development of new, more affordable functional ingredients, further constraining market growth.

Opportunities: Use of encapsulation technology

Encapsulation technology involves the process of enclosing active ingredients within a carrier material, forming microscopic capsules. These capsules can protect the active ingredients from degradation, improve their stability, control release rates, and enable targeted delivery. In the functional food ingredients market, encapsulation technology presents significant opportunities. Firstly, encapsulation enhances the efficacy of functional food ingredients by shielding them from environmental factors such as light, heat, moisture, and oxidation. This ensures that the active components remain intact until consumed, maximizing their health benefits. Secondly, encapsulation allows for the controlled release of functional ingredients within the body, optimizing their absorption and utilization. This controlled release mechanism ensures a sustained delivery of nutrients, prolonging their effects and enhancing their bioavailability.

Furthermore, encapsulation enables the incorporation of sensitive or unstable bioactive compounds into various food matrices without affecting taste or texture. This expands the scope of functional food product development, leading to a broader range of fortified foods and beverages appealing to health-conscious consumers.

As a result, the demand for functional food ingredients is expected to surge with the adoption of encapsulation technology. Food manufacturers can create innovative products with enhanced nutritional profiles and targeted health benefits, catering to the growing consumer interest in functional foods. Encapsulation technology thus represents a lucrative opportunity for stakeholders in the functional food ingredients market, driving innovation, and fueling market growth.

Challenges: Complexities related to the integration and adulteration of functional food products

The integration and adulteration of functional food products introduce significant complexities to the functional food ingredients market, posing challenges at various stages of production, distribution, and consumption. Integration involves combining functional ingredients into food products, requiring precise formulation to maintain efficacy and safety. Any deviation from the intended composition can compromise the product's functionality and consumer trust.

Adulteration exacerbates these challenges by introducing unauthorized or inferior ingredients into functional foods, often driven by economic motives. Adulterants can include cheaper substitutes or undisclosed additives, leading to inconsistencies in product quality and potential health risks for consumers. Detecting adulteration requires sophisticated analytical techniques, adding to production costs and regulatory burdens.

These complexities hinder market growth by eroding consumer confidence and regulatory compliance. Consumers demand transparency and authenticity in functional foods, necessitating stringent quality control measures throughout the supply chain. Regulatory bodies impose strict guidelines to ensure product safety and efficacy, increasing compliance costs for manufacturers. Moreover, the global nature of the functional food ingredients market amplifies these challenges, as ingredients may originate from diverse geographic regions with varying regulatory standards and supply chain complexities. Harmonizing regulations and implementing robust traceability systems become imperative to mitigate risks associated with integration and adulteration.

Market Ecosystem

Functional Food Ingredients Market Ecosystem

Probiotics, By Type, Accounted For The Highest Market Share Among Type Segment In 2023.

Probiotics play a pivotal role in maintaining human health, particularly by fostering a balanced gut microbiome. The gut microbiome influences various bodily functions, from digestion and nutrient absorption to immune response and even mental health. Its impact extends far beyond the digestive system, affecting systemic inflammation, metabolism, and overall well-being. Gut health is intricately linked to the body's immune system, with about 70% of the immune system residing in the gut-associated lymphoid tissue (GALT). Probiotics help modulate this immune response, enhancing the body's ability to defend against pathogens while reducing the risk of inflammatory diseases.

Given the profound influence of gut health on overall wellness, probiotics emerge as a crucial functional food ingredient. Probiotics, by type segment, are estimated to dominate the functional food ingredients market due to their multifaceted benefits and the impact they have on overall health. While vitamins, minerals, and proteins are essential, probiotics offer unique advantages, they not only support digestion and nutrient absorption but also bolster immune function, regulate inflammation, and promote mental well-being through the gut-brain axis.

Additionally, probiotics have demonstrated efficacy in addressing specific health concerns such as irritable bowel syndrome, inflammatory bowel disease, and antibiotic-associated diarrhea, further fueling their market dominance. Their versatility and demonstrated health benefits position probiotics as indispensable functional food ingredients for maintaining holistic health and vitality. Some of the key players that offer probiotics include Cargill, Incorporated (US), Chr. Hansen A/S (Denmark), and A&B Ingredients, Inc. (US).

Companies involved in offering and utilizing strategic developments in probiotics ingredients are poised to meet the evolving demands of health-conscious consumers, capitalize on the growing interest in gut health, and drive innovation in the development of functional foods. For instance, in October 2022, TEIJIN LIMITED (Japan) took a significant step forward in its dedication to developing and producing probiotics for functional foods with the establishment of Teijin Japan Limited, marking a significant milestone for the company. This new subsidiary is committed to addressing the evolving needs of health-conscious consumers by leveraging expertise in probiotics, which are essential for improving intestinal health, in addition to prebiotics that promote their growth.

Food, By Application, Accounted For The Highest Market Share Among Form Segment In 2023.

With the largest market share of all the segments, the food segment emerged as the dominant segment in the market for functional food ingredients. The market for functional food ingredients is experiencing growth fueled by a rising preference for convenient, nutritious food options and an increasing demand for fortified food and beverage products. This expansion is driven by a rapidly growing health-conscious population, especially evident in emerging markets, which seek out fortified food products incorporating functional food ingredients.

Functional foods are becoming increasingly popular among consumers who are looking for specific health benefits like better digestion, immune system support, or increased energy levels in addition to nutritional value.

To satisfy the many demands and inclinations of health-conscious consumers, food manufacturers are actively introducing functional ingredients into a broad variety of food products, from snacks and beverages to dairy products and baked goods by meeting sustainability demands. For instance, in March 2023, ADM introduced the Knwble Grwn brand of functional food ingredients, aimed at offering consumers sustainably sourced, plant-based food ingredients that prioritize wholesomeness. These products are cultivated by small or underrepresented farmers utilizing regenerative agricultural practices, contributing to environmental conservation efforts. This new brand aligns with ADM's existing sustainability initiatives, further reinforcing the company's commitment to environmental stewardship and responsible sourcing practices.

Asia Pacific Is The Fastest-Growing Market For Functional Food Ingredients Among The Regions.

Shifting dietary preferences and rising health consciousness among consumers drive the demand for functional foods fortified with specific ingredients targeting various health benefits in the Asia Pacific region. This trend is particularly pronounced in countries such as China, India, and Japan, where there is a growing awareness of the importance of preventive healthcare. Additionally, the rich and diverse food culture in Asia Pacific countries, coupled with the prevalence of traditional medicine systems such as Ayurveda and Traditional Chinese Medicine, creates opportunities for the incorporation of functional ingredients derived from natural sources. Moreover, the Asia Pacific region boasts a burgeoning population, rapid urbanization, and increasing disposable incomes, all of which contribute to increased consumer spending on health-enhancing products.

The Asia Pacific market benefits from a larger consumer base, a cultural inclination towards holistic health practices, untapped market potential, and a more receptive attitude towards incorporating functional foods into daily diets unlike other regions, such as North America and Europe. In addition, the relatively lower penetration of functional food products in the Asia Pacific region presents ample opportunities for market expansion and growth, making it a focal point for industry players seeking to capitalize on emerging trends and preferences.

Functional Food Ingredients Market by Region

Top Functional Food Ingredients Companies

The key players in this market include Cargill, Incorporated (US), BASF SE (Germany), ADM (US), International Flavors & Fragrances Inc. (US), Arla Foods amba (Denmark), Kerry Group plc (Ireland), Ajinomoto Co., Inc. (Japan), DSM (Netherlands), Ingredion (US), and Tate & Lyle (UK).

Want to explore hidden markets that can drive new revenue in Functional Food Ingredients Market?

Scope of the Report
:

Report Metric

Details

Market size estimation

2024–2029

Base year considered

2023

Forecast period considered

2024–2029

Units considered

Value (USD), Volume (Ton)

Segments Covered

By Source, Type, Form, Application, Health Benefits (Qualitative), and Region

Regions covered

North America, Europe, Asia Pacific, South America, and RoW

Key Companies Profiled

  • Cargill, Incorporated (US)
  • BASF SE (Germany)
  • ADM (US)
  • International Flavors & Fragrances Inc. (US)
  • Arla Foods amba (Denmark)
  • Kerry Group plc. (Ireland)
  • Ajinomoto Co., Inc. (Japan)
  • DSM (Netherlands)
  • Ingredion (US)
  • Tate & Lyle (UK)
  • TEIJIN LIMITED (Japan)
  • Chr. Hansen A/S (Denmark)
  • Glanbia PLC (Ireland)
  • Kemin Industries, Inc. (US)
  • BENEO (Germany)
  • Cosun (Netherlands)
  • Roquette Freres (France)
  • Soylent (US)
  • A&B Ingredients, Inc. (US)
  • Golden Grain Group Limited (China)
  • Aminola (Netherlands)
  • Stratum Nutrition (US)
  • Foodchem International Corporation (China)

Functional Food Ingredients Market Segmentation:

This research report categorizes the functional food ingredients market, based on source, source, type, application, health benefits, and region.

By Technology (Qualitative)
  • Digestive Health
  • Immune Support
  • Energy & Metabolism
  • Heart Health
  • Bone and Joint Health
  • Weight Management
  • Others
By Type
  • Probiotics
  • Protein & Amino Acids
  • Phytochemicals & Plant Extracts
  • Prebiotics
  • Fibers & Specialty Carbohydrates
  • Omega Fatty Acids
  • Carotenoids
  • Vitamins
  • Minerals
    • Macrominerals
    • Microminerals
By Form
  • Powders
  • Liquids
  • Capsules & Tablets
  • Others
By Source
  • Natural Functional Food Ingredients
    • Plant-based sources
    • Animal-based Sources
    • Mineral Sources
    • Microbial and Fermentation Sources
    • Dairy-derived Ingredients
  • Synthetic Functional Food Ingredients
    • Synthetic Vitamins and Minerals
    • Functional Lipids
    • Phytochemicals
    • Amino Acids
    • Others
  • Hybrid or Blended Sources
    • Fortified or Enriched Ingredients
    • Bio-based Synthesis
By Application
  • Food
    • Infant Food
    • Dairy Products
    • Bakery Products
    • Confectionery Products
    • Snacks
    • Meat & Meat Products
    • Other Types
  • Beverages
    • Energy Drinks
    • Juices
    • Health Drinks
  • Nutraceuticals and Dietary Supplements
By Region
  • North America
  • Europe
  • Asia-Pacific
  • South America
  • Rest of the World (RoW)

Target Audience

  • Functional food ingredients manufacturers
  • Functional food ingredients Equipment Manufacturers
  • Government Agencies (related to food safety and pharmaceutical regulations such as FDA, EFSA, and FSSAI)

Functional Food Ingredients Industry News:

  • In February 2024, Cargill, Incorporated (US) and ENOUGH (UK) expanded their partnership to innovate sustainable protein options using ENOUGH's fermented mycoprotein technology. Cargill, Incorporated's investment, and commercial agreement will boost ABUNDA mycoprotein production, known for its meat-like texture and sustainability. This partnership allows Cargill, Incorporated to tap into the growing demand for alternative protein sources, enhancing its position in the functional food ingredients market and leveraging its global footprint to scale up production efficiently.
  • In September 2023, BASF SE (Germany) unveiled Product Carbon Footprints (PCFs) for selected human nutrition ingredients including Vitamin AP 1,7 TOC and Vitamin E Acetate 98%. Certified methodology reveals at least 20% lower emissions compared to the global market average. This initiative, under ISO 14067:2018, aids BASF SE in offering a competitive advantage while supporting customer emission reduction goals. By showcasing superior PCFs for functional food ingredients, this initiative not only strengthens BASF's competitive edge but also enhances its reputation as a sustainable leader in the functional food ingredients market, fostering trust and loyalty among consumers and partners.
  • In June 2023, ADM (US) and Brightseed (US) formed a global partnership to develop evidence-based functional synbiotic products targeting microbiome optimization, utilizing Brightseed's AI platform, Forager. By decoding molecular interactions between dietary plants and gut microbes, ADM aims to lead in precision health solutions, meeting rising consumer demand for natural, plant-based products promoting immune function, metabolic health, and mental well-being. This collaboration positions ADM as an innovator in the functional food ingredients market, leveraging an advanced understanding of bioactive and microbiome science to create impactful health solutions.

Frequently Asked Questions (FAQ):

To speak to our analyst for a discussion on the above findings, click Speak to Analyst

Exclusive indicates content/data unique to MarketsandMarkets and not available with any competitors.

TABLE OF CONTENTS
 
1 INTRODUCTION (Page No. - 56)
    1.1 STUDY OBJECTIVES 
    1.2 MARKET DEFINITION 
    1.3 STUDY SCOPE 
           1.3.1 INCLUSIONS AND EXCLUSIONS
                    TABLE 1 INCLUSIONS AND EXCLUSIONS
    1.4 REGIONS COVERED 
    1.5 YEARS CONSIDERED 
    1.6 UNITS CONSIDERED 
           1.6.1 CURRENCY/VALUE UNIT
                    TABLE 2 USD EXCHANGE RATES, 2019–2023
           1.6.2 VOLUME UNIT
    1.7 STAKEHOLDERS 
    1.8 SUMMARY OF CHANGES 
           1.8.1 RECESSION IMPACT
 
2 RESEARCH METHODOLOGY (Page No. - 63)
    2.1 RESEARCH DATA 
           2.1.1 SECONDARY DATA
                    2.1.1.1 Key data from secondary sources
           2.1.2 PRIMARY DATA
                    2.1.2.1 Key data from primary sources
                    2.1.2.2 Key primary insights
                    2.1.2.3 Breakdown of primary interviews
    2.2 MARKET SIZE ESTIMATION 
           2.2.1 BOTTOM-UP APPROACH
           2.2.2 TOP-DOWN APPROACH
    2.3 DATA TRIANGULATION 
    2.4 ASSUMPTIONS 
    2.5 LIMITATIONS 
    2.6 RECESSION IMPACT ANALYSIS 
           2.6.1 RECESSION MACROINDICATORS
 
3 EXECUTIVE SUMMARY (Page No. - 77)
    TABLE 3 FUNCTIONAL FOOD INGREDIENTS MARKET SNAPSHOT, 2024 VS. 2029 
 
4 PREMIUM INSIGHTS (Page No. - 82)
    4.1 ATTRACTIVE MARKET OPPORTUNITIES FOR FUNCTIONAL FOOD INGREDIENTS MARKET PLAYERS 
    4.2 ASIA PACIFIC: FUNCTIONAL FOOD INGREDIENTS MARKET,  BY TYPE & COUNTRY 
    4.3 FUNCTIONAL FOOD INGREDIENTS MARKET: SHARE OF MAJOR REGIONAL SUBMARKETS 
    4.4 MARKET, BY TYPE & REGION 
    4.5 MARKET, BY SOURCE & REGION 
    4.6 MARKET,  BY APPLICATION & REGION 
 
5 FUNCTIONAL FOOD INGREDIENTS MARKET OVERVIEW (Page No. - 87)
    5.1 INTRODUCTION 
    5.2 MACROECONOMIC INDICATORS 
           5.2.1 DEVELOPMENT IN RETAIL INDUSTRY
           5.2.2 RISE IN NUMBER OF DUAL-INCOME HOUSEHOLDS
    5.3 MARKET DYNAMICS 
           5.3.1 DRIVERS
                    5.3.1.1 Increase in consumption of nutritive, convenience, and fortified food products
                    5.3.1.2 Growth in health awareness among consumers leading to increased consumption of healthier diets
                    5.3.1.3 Rise in incidences of chronic diseases
                    5.3.1.4 Research & development and expansion of production capacity to enhance applicability & accelerate growth
                    5.3.1.5 Mandates on food fortification by government organizations
                               TABLE 4 GLOBAL PREVALENCE OF ANEMIA ACROSS DIFFERENT POPULATION GROUPS, 2019
                               TABLE 5 WIDELY USED FORTIFIED FOODS
           5.3.2 RESTRAINTS
                    5.3.2.1 Higher cost for functional food products due to inclusion of healthier or naturally sourced ingredients
                    5.3.2.2 Increase in instances of allergies and intolerances related to few ingredients
           5.3.3 OPPORTUNITIES
                    5.3.3.1 Development of different techniques to create high-value natural carotenoids
                    5.3.3.2 Alternative sources to obtain omega-3
                               TABLE 6 UPCOMING ALTERNATIVE SOURCES FOR OMEGA-3 FATTY ACIDS
                    5.3.3.3 Adoption of new technologies in functional food industry
                               5.3.3.3.1 Use of encapsulation technology
                               5.3.3.3.2 3D printing and novel ingredients
           5.3.4 CHALLENGES
                    5.3.4.1 Complexities related to integration and adulteration of functional food products
                    5.3.4.2 Lack of consistency in regulations pertaining to various ingredients
 
6 FUNCTIONAL FOOD INGREDIENTS INDUSTRY TRENDS (Page No. - 104)
    6.1 INTRODUCTION 
    6.2 SUPPLY CHAIN ANALYSIS 
    6.3 VALUE CHAIN ANALYSIS 
           6.3.1 SOURCING OF RAW MATERIALS
           6.3.2 PRODUCTION & PROCESSING
           6.3.3 DISTRIBUTION, MARKETING, AND SALES
    6.4 TRADE ANALYSIS 
           TABLE 7 TOP 10 EXPORTERS AND IMPORTERS OF PROVITAMINS AND VITAMINS (HS CODE 2936), 2022 (USD THOUSAND)
           TABLE 8 TOP 10 EXPORTERS AND IMPORTERS OF PROVITAMINS AND VITAMINS (HS CODE 2936), 2022 (TON)
    6.5 TECHNOLOGY ANALYSIS 
           6.5.1 KEY TECHNOLOGIES
                    6.5.1.1 Extraction and purification technologies
                    6.5.1.2 Functional food ingredients and microencapsulation technology
                    6.5.1.3 Encapsulation of omega-3 to mask odor
           6.5.2 COMPLEMENTARY TECHNOLOGIES
                    6.5.2.1 Analytical techniques for quality control
                    6.5.2.2 Nanotechnology for enhanced delivery
           6.5.3 ADJACENT TECHNOLOGY
                    6.5.3.1 Functional food ingredients and robots
    6.6 PRICING ANALYSIS 
           6.6.1 AVERAGE SELLING PRICE TREND OF KEY PLAYERS, BY TYPE
                    TABLE 9 FUNCTIONAL FOOD INGREDIENTS MARKET: AVERAGE SELLING PRICE (ASP), BY TYPE, 2019–2023 (USD/TON)
           6.6.2 AVERAGE SELLING PRICE TREND OF FUNCTIONAL FOOD INGREDIENTS, BY REGION
                    TABLE 10 FUNCTIONAL FOOD INGREDIENTS MARKET: AVERAGE SELLING PRICE (ASP), BY REGION, 2019–2023 (USD/TON)
    6.7 ECOSYSTEM ANALYSIS/MARKET MAP 
           6.7.1 DEMAND SIDE
           6.7.2 SUPPLY SIDE
                    TABLE 11 FUNCTIONAL FOOD INGREDIENTS MARKET: SUPPLY CHAIN (ECOSYSTEM)
    6.8 TRENDS/DISRUPTIONS IMPACTING CUSTOMERS’ BUSINESSES 
    6.9 PATENT ANALYSIS 
           TABLE 12 LIST OF MAJOR PATENTS PERTAINING TO FUNCTIONAL FOOD INGREDIENTS  MARKET, 2021–2023
    6.10 KEY CONFERENCES & EVENTS 
           TABLE 13 KEY CONFERENCES & EVENTS, 2024–2025
    6.11 REGULATORY LANDSCAPE 
           6.11.1 REGULATORY BODIES, GOVERNMENT AGENCIES, AND OTHER ORGANIZATIONS
                    TABLE 14 NORTH AMERICA: LIST OF REGULATORY BODIES, GOVERNMENT AGENCIES,  AND OTHER ORGANIZATIONS
                    TABLE 15 EUROPE: LIST OF REGULATORY BODIES, GOVERNMENT AGENCIES, AND OTHER ORGANIZATIONS
                    TABLE 16 ASIA PACIFIC: LIST OF REGULATORY BODIES, GOVERNMENT AGENCIES, AND OTHER ORGANIZATIONS
                    TABLE 17 AFRICA: LIST OF REGULATORY BODIES, GOVERNMENT AGENCIES, AND OTHER ORGANIZATIONS
                    TABLE 18 MIDDLE EAST: LIST OF REGULATORY BODIES, GOVERNMENT AGENCIES, AND OTHER ORGANIZATIONS
           6.11.2 FUNCTIONAL FOOD INGREDIENTS: REGULATORY FRAMEWORK
                    6.11.2.1 North America
                               6.11.2.1.1 Canada
                               6.11.2.1.2 US
                               6.11.2.1.3 Mexico
                    6.11.2.2 European Union (EU)
                    6.11.2.3 Asia Pacific
                               6.11.2.3.1 Japan
                               6.11.2.3.2 China
                               6.11.2.3.3 India
                               6.11.2.3.4 Australia & New Zealand
                    6.11.2.4 South America
                               6.11.2.4.1 Brazil
                               6.11.2.4.2 Argentina
                    6.11.2.5 Rest of the World (RoW)
                               6.11.2.5.1 Middle East
           6.11.3 PROBIOTICS: REGULATORY FRAMEWORK
                    6.11.3.1 Introduction
                               TABLE 19 NATIONAL/INTERNATIONAL BODIES FOR SAFETY STANDARDS AND REGULATIONS
                    6.11.3.2 North America
                               6.11.3.2.1 US
                               6.11.3.2.2 Canada
                    6.11.3.3 Europe
                    6.11.3.4 Asia Pacific
                               6.11.3.4.1 Japan
                               6.11.3.4.2 India
                    6.11.3.5 South America
                               6.11.3.5.1 Brazil
           6.11.4 PREBIOTICS: REGULATORY FRAMEWORK
                    6.11.4.1 Introduction
                    6.11.4.2 Asia Pacific
                               6.11.4.2.1 Japan
                               6.11.4.2.2 Australia & New Zealand
                               6.11.4.2.3 South Korea
                               6.11.4.2.4 India
                               TABLE 20 SCHEDULE XI OF FOOD SAFETY AND STANDARDS REGULATIONS  FOR APPROVED PREBIOTIC INGREDIENTS, 2015
                    6.11.4.3 North America
                               6.11.4.3.1 US
                               6.11.4.3.2 Canada
                               TABLE 21 LIST OF ACCEPTED DIETARY FIBERS BY CANADIAN REGULATORY AUTHORITIES &  THEIR SOURCES
                    6.11.4.4 European Union
    6.12 PORTER’S FIVE FORCES ANALYSIS 
                    TABLE 22 IMPACT OF PORTER’S FIVE FORCES ON FUNCTIONAL FOOD INGREDIENTS MARKET
           6.12.1 INTENSITY OF COMPETITIVE RIVALRY
           6.12.2 BARGAINING POWER OF SUPPLIERS
           6.12.3 BARGAINING POWER OF BUYERS
           6.12.4 THREAT OF NEW ENTRANTS
           6.12.5 THREAT OF SUBSTITUTES
    6.13 KEY STAKEHOLDERS AND BUYING CRITERIA 
           6.13.1 KEY STAKEHOLDERS IN BUYING PROCESS
                    TABLE 23 INFLUENCE OF STAKEHOLDERS ON BUYING PROCESS FOR KEY TYPES
           6.13.2 BUYING CRITERIA
                    TABLE 24 KEY BUYING CRITERIA FOR FUNCTIONAL FOOD INGREDIENT TYPES
    6.14 CASE STUDY ANALYSIS 
           6.14.1 MIND RIGHT’S PLANT-BASED BARS WAS FORMULATED TO FOCUS ON MENTAL HEALTH ISSUES
           6.14.2 UNDERSTANDING CONSUMER MOTIVATIONS AND ATTITUDES TOWARD FUNCTIONAL FOOD
    6.15 INVESTMENT AND FUNDING SCENARIO 
 
7 FUNCTIONAL FOOD INGREDIENTS MARKET, BY SOURCE (Page No. - 145)
    7.1 INTRODUCTION 
           TABLE 25 FUNCTIONAL FOOD INGREDIENTS MARKET, BY SOURCE, 2019–2023 (USD MILLION)
           TABLE 26 MARKET, BY SOURCE, 2024–2029 (USD MILLION)
    7.2 NATURAL SOURCES 
           7.2.1 CONSUMER EMPHASIS ON FOODS AND HEALTH-PROMOTING PRODUCTS DERIVED FROM NATURAL SOURCES
                    TABLE 27 ADULTS OBESITY PREVALENCE, BY GEOGRAPHIC GROUP/RACE/ETHNICITY
                    TABLE 28 NATURAL FUNCTIONAL FOOD INGREDIENTS MARKET, BY TYPE,  2019–2023 (USD MILLION)
                    TABLE 29 NATURAL FUNCTIONAL FOOD INGREDIENTS MARKET, BY TYPE,  2024–2029 (USD MILLION)
                    TABLE 30 NATURAL FUNCTIONAL FOOD INGREDIENTS MARKET, BY REGION,  2019–2023 (USD MILLION)
                    TABLE 31 NATURAL FUNCTIONAL FOOD INGREDIENTS MARKET, BY REGION,  2024–2029 (USD MILLION)
           7.2.2 PLANT SOURCES
                    TABLE 32 PLANT-BASED FUNCTIONAL FOOD INGREDIENTS MARKET, BY REGION,  2019–2023 (USD MILLION)
                    TABLE 33 PLANT-BASED FUNCTIONAL FOOD INGREDIENTS MARKET, BY REGION,  2024–2029 (USD MILLION)
           7.2.3 ANIMAL SOURCES
                    TABLE 34 ANIMAL-BASED FUNCTIONAL FOOD INGREDIENTS MARKET, BY REGION,  2019–2023 (USD MILLION)
                    TABLE 35 ANIMAL-BASED FUNCTIONAL FOOD INGREDIENTS MARKET, BY REGION,  2024–2029 (USD MILLION)
           7.2.4 MICROBIAL & FERMENTATION SOURCES
                    TABLE 36 MICROBIAL/FERMENTATION-BASED FUNCTIONAL FOOD INGREDIENTS MARKET,  BY REGION, 2019–2023 (USD MILLION)
                    TABLE 37 MICROBIAL/FERMENTATION-BASED FUNCTIONAL FOOD INGREDIENTS MARKET,  BY REGION, 2024–2029 (USD MILLION)
    7.3 SYNTHETIC SOURCES 
           7.3.1 RISE IN CONCERNS ON GUT HEALTH TO DRIVE DEMAND FOR BIOTECHNOLOGICALLY PRODUCED PREBIOTICS AND PROBIOTICS
                    TABLE 38 SYNTHETIC FUNCTIONAL FOOD INGREDIENTS MARKET, BY REGION,  2019–2023 (USD MILLION)
                    TABLE 39 SYNTHETIC FUNCTIONAL FOOD INGREDIENTS MARKET, BY REGION,  2024–2029 (USD MILLION)
    7.4 HYBRID OR BLENDED SOURCES 
           7.4.1 CONSUMER PREFERENCES FOR MULTIPURPOSE PRODUCTS AND GROWING INTEREST IN PERSONALIZED NUTRITION SOLUTIONS
                    TABLE 40 HYBRID OR BLENDED FUNCTIONAL FOOD INGREDIENTS MARKET, BY REGION,  2019–2023 (USD MILLION)
                    TABLE 41 HYBRID OR BLENDED FUNCTIONAL FOOD INGREDIENTS MARKET, BY REGION,  2024–2029 (USD MILLION)
 
8 FUNCTIONAL FOOD INGREDIENTS MARKET, BY TYPE (Page No. - 159)
    8.1 INTRODUCTION 
           TABLE 42 FUNCTIONAL FOOD INGREDIENTS MARKET, BY TYPE, 2019–2023 (USD MILLION)
           TABLE 43 MARKET, BY TYPE, 2024–2029 (USD MILLION)
           TABLE 44 FUNCTIONAL FOOD INGREDIENTS MARKET, BY TYPE, 2019–2023 (TON)
           TABLE 45 MARKET, BY TYPE, 2024–2029 (TON)
    8.2 PROBIOTICS 
           8.2.1 HIGH CONSUMER DEMAND FOR SCIENTIFICALLY PROVEN HEALTH FOOD AND SUPPLEMENTS, PARTICULARLY IN DEVELOPED ECONOMIES
                    TABLE 46 PROBIOTIC COMPONENTS & THEIR BENEFITS
                    TABLE 47 PROBIOTIC INGREDIENTS MARKET, BY REGION, 2019–2023 (USD MILLION)
                    TABLE 48 PROBIOTIC INGREDIENTS MARKET, BY REGION, 2024–2029 (USD MILLION)
                    TABLE 49 PROBIOTIC INGREDIENTS MARKET, BY REGION, 2019–2023 (TON)
                    TABLE 50 PROBIOTIC INGREDIENTS MARKET, BY REGION, 2024–2029 (TON)
    8.3 PROTEINS & AMINO ACIDS 
           8.3.1 RISE IN AWARENESS ABOUT HEALTH BENEFITS OF AMINO ACIDS
                    TABLE 51 RECOMMENDED DIETARY ALLOWANCES (RDA) FOR PROTEINS IN DIFFERENT  AGE GROUPS (GRAMS/DAY)
                    TABLE 52 FUNCTIONS OF PROTEIN
                    TABLE 53 PROTEIN & AMINO ACID INGREDIENTS MARKET, BY REGION, 2019–2023 (USD MILLION)
                    TABLE 54 PROTEIN & AMINO ACID INGREDIENTS MARKET, BY REGION, 2024–2029 (USD MILLION)
                    TABLE 55 PROTEIN & AMINO ACID INGREDIENTS MARKET, BY REGION, 2019–2023 (TON)
                    TABLE 56 PROTEIN & AMINO ACID INGREDIENTS MARKET, BY REGION, 2024–2029 (TON)
    8.4 PHYTOCHEMICALS & PLANT EXTRACTS 
           8.4.1 INCREASE IN USE IN NUTRACEUTICALS DUE TO SIDE EFFECTS  OF CHEMICAL INGREDIENTS
                    TABLE 57 PHYTOCHEMICAL & PLANT EXTRACT INGREDIENTS MARKET, BY REGION,  2019–2023 (USD MILLION)
                    TABLE 58 PHYTOCHEMICAL & PLANT EXTRACT INGREDIENTS MARKET, BY REGION,  2024–2029 (USD MILLION)
                    TABLE 59 PHYTOCHEMICAL & PLANT EXTRACT INGREDIENTS MARKET, BY REGION,  2019–2023 (TON)
                    TABLE 60 PHYTOCHEMICAL & PLANT EXTRACT INGREDIENTS MARKET, BY REGION,  2024–2029 (TON)
    8.5 PREBIOTICS 
           8.5.1 RAPID GROWTH IN PREBIOTICS DUE TO BENEFITS IN WEIGHT MANAGEMENT AND INFANT HEALTH IMPROVEMENT
                    TABLE 61 PREBIOTIC COMPONENTS & THEIR BENEFITS
                    TABLE 62 PREBIOTIC INGREDIENTS MARKET, BY REGION, 2019–2023 (USD MILLION)
                    TABLE 63 PREBIOTIC INGREDIENTS MARKET, BY REGION, 2024–2029 (USD MILLION)
                    TABLE 64 PREBIOTIC INGREDIENTS MARKET, BY REGION, 2019–2023 (TON)
                    TABLE 65 PREBIOTIC INGREDIENTS MARKET, BY REGION, 2024–2029 (TON)
    8.6 FIBERS & SPECIALTY CARBOHYDRATES 
           8.6.1 FIBERS HELP PROMOTE HEALTH AND REDUCE RISK OF CHRONIC DISEASES
                    TABLE 66 FIBER & SPECIALTY CARBOHYDRATE INGREDIENTS MARKET, BY REGION,  2019–2023 (USD MILLION)
                    TABLE 67 FIBER & SPECIALTY CARBOHYDRATE INGREDIENTS MARKET, BY REGION,  2024–2029 (USD MILLION)
                    TABLE 68 FIBER & SPECIALTY CARBOHYDRATE INGREDIENTS MARKET, BY REGION,  2019–2023 (TON)
                    TABLE 69 FIBER & SPECIALTY CARBOHYDRATE INGREDIENTS MARKET, BY REGION,  2024–2029 (TON)
    8.7 OMEGA-3 FATTY ACIDS 
           8.7.1 OMEGA FATTY ACIDS AID IN REDUCING RISK OF SEVERAL CHRONIC MENTAL AND PHYSICAL DISEASES
                    TABLE 70 OMEGA-3 FATTY ACID INGREDIENTS MARKET, BY REGION, 2019–2023 (USD MILLION)
                    TABLE 71 OMEGA-3 FATTY ACID INGREDIENTS MARKET, BY REGION, 2024–2029 (USD MILLION)
                    TABLE 72 OMEGA-3 FATTY ACID INGREDIENTS MARKET, BY REGION, 2019–2023 (TON)
                    TABLE 73 OMEGA-3 FATTY ACID INGREDIENTS MARKET, BY REGION, 2024–2029 (TON)
    8.8 CAROTENOIDS 
           8.8.1 ROLE OF CAROTENOIDS SUCH AS LUTEIN AND ZEAXANTHIN IN REDUCING RISK OF EYE DISEASES
                    TABLE 74 COMMON DIETARY SOURCES OF CAROTENOIDS IN VEGETABLE FOODS  (ΜG/100 FRESH WEIGHT)
                    TABLE 75 CAROTENOID INGREDIENTS MARKET, BY REGION, 2019–2023 (USD MILLION)
                    TABLE 76 CAROTENOID INGREDIENTS MARKET, BY REGION, 2024–2029 (USD MILLION)
                    TABLE 77 CAROTENOID INGREDIENTS MARKET, BY REGION, 2019–2023 (TON)
                    TABLE 78 CAROTENOID INGREDIENTS MARKET, BY REGION, 2024–2029 (TON)
    8.9 VITAMINS 
           8.9.1 AWARENESS, WIDE ACCEPTANCE, AND EASY AVAILABILITY OF DIFFERENT TYPES OF VITAMINS
                    TABLE 79 VITAMINS CLASSIFIED AS MICRONUTRIENTS
                    TABLE 80 VITAMIN INGREDIENTS MARKET, BY REGION, 2019–2023 (USD MILLION)
                    TABLE 81 VITAMIN INGREDIENTS MARKET, BY REGION, 2024–2029 (USD MILLION)
                    TABLE 82 VITAMIN INGREDIENTS MARKET, BY REGION, 2019–2023 (TON)
                    TABLE 83 VITAMIN INGREDIENTS MARKET, BY REGION, 2024–2029 (TON)
    8.1 MINERALS 
           8.10.1 CONSUMER AWARENESS REGARDING CONSEQUENCES OF MINERAL DEFICIENCIES
                    TABLE 84 MINERAL INGREDIENTS MARKET, BY TYPE, 2019–2023 (USD MILLION)
                    TABLE 85 MINERAL INGREDIENTS MARKET, BY TYPE, 2024–2029 (USD MILLION)
                    TABLE 86 MINERAL INGREDIENTS MARKET, BY REGION, 2019–2023 (USD MILLION)
                    TABLE 87 MINERAL INGREDIENTS MARKET, BY REGION, 2024–2029 (USD MILLION)
                    TABLE 88 MINERAL INGREDIENTS MARKET, BY REGION, 2019–2023 (TON)
                    TABLE 89 MINERAL INGREDIENTS MARKET, BY REGION, 2024–2029 (TON)
           8.10.2 MACROMINERALS
                    TABLE 90 MACROMINERAL INGREDIENTS MARKET, BY REGION, 2019–2023 (USD MILLION)
                    TABLE 91 MACROMINERAL INGREDIENTS MARKET, BY REGION, 2024–2029 (USD MILLION)
           8.10.3 MICROMINERALS
                    TABLE 92 MACROMINERALS & THEIR FUNCTIONS
                    TABLE 93 MICRO MINERALS & THEIR FUNCTIONS
                    TABLE 94 MICROMINERAL INGREDIENTS MARKET, BY REGION, 2019–2023 (USD MILLION)
                    TABLE 95 MICROMINERAL INGREDIENTS MARKET, BY REGION, 2024–2029 (USD MILLION)
 
9 FUNCTIONAL FOOD INGREDIENTS MARKET, BY FORM (Page No. - 193)
    9.1 INTRODUCTION 
           TABLE 96 FUNCTIONAL FOOD INGREDIENTS MARKET, BY FORM, 2019–2023 (USD MILLION)
           TABLE 97 MARKET, BY FORM, 2024–2029 (USD MILLION)
    9.2 POWDERS 
           9.2.1 SUSTAINED GROWTH EXPECTED DUE TO CONVENIENCE AND DIVERSE APPLICATIONS IN HEALTH FOODS/BEVERAGES MARKET
                    TABLE 98 FUNCTIONAL FOOD INGREDIENT POWDERS MARKET, BY REGION,  2019–2023 (USD MILLION)
                    TABLE 99 FUNCTIONAL FOOD INGREDIENT POWDERS MARKET, BY REGION,  2024–2029 (USD MILLION)
    9.3 LIQUID 
           9.3.1 CONTINUED GROWTH PROJECTED DUE TO SUPERIOR BIOAVAILABILITY, CONVENIENCE, AND CUSTOMIZATION OPTIONS
                    TABLE 100 FUNCTIONAL FOOD INGREDIENT LIQUIDS MARKET, BY REGION,  2019–2023 (USD MILLION)
                    TABLE 101 FUNCTIONAL FOOD INGREDIENT LIQUIDS MARKET, BY REGION,  2024–2029 (USD MILLION)
    9.4 CAPSULES/TABLETS 
           9.4.1 CONVENIENCE, PORTABILITY, AND TARGETED FORMULATION OPTIONS TO BE KEY DRIVERS
                    TABLE 102 FUNCTIONAL FOOD INGREDIENT CAPSULES/TABLETS MARKET, BY REGION,  2019–2023 (USD MILLION)
                    TABLE 103 FUNCTIONAL FOOD INGREDIENT CAPSULES/TABLETS MARKET, BY REGION,  2024–2029 (USD MILLION)
    9.5 OTHER FORMS 
           TABLE 104 OTHER FUNCTIONAL FOOD INGREDIENT FORMS MARKET, BY REGION,  2019–2023 (USD MILLION)
           TABLE 105 OTHER FUNCTIONAL FOOD INGREDIENT FORMS MARKET, BY REGION,  2024–2029 (USD MILLION)
 
10 FUNCTIONAL FOOD INGREDIENTS MARKET, BY APPLICATION (Page No. - 200)
     10.1 INTRODUCTION 
               TABLE 106 FUNCTIONAL FOOD INGREDIENTS MARKET, BY APPLICATION, 2019–2023 (USD MILLION)
               TABLE 107 MARKET, BY APPLICATION, 2024–2029 (USD MILLION)
     10.2 FOOD 
             10.2.1 DEMAND FOR COST-EFFECTIVE FOOD PRODUCTS WITH HIGH NUTRITIONAL BENEFITS
                       TABLE 108 FUNCTIONAL FOOD INGREDIENTS MARKET IN FOOD, BY SUBAPPLICATION,  2019–2023 (USD MILLION)
                       TABLE 109 MARKET IN FOOD, BY SUBAPPLICATION,  2024–2029 (USD MILLION)
                       TABLE 110 MARKET IN FOOD, BY REGION,  2019–2023 (USD MILLION)
                       TABLE 111 MARKET IN FOOD, BY REGION,  2024–2029 (USD MILLION)
             10.2.2 INFANT FOOD
                       10.2.2.1 Leading segment in market driven by imperative of promoting healthy growth and development
                                   TABLE 112 RECOMMENDED DIETARY REFERENCE INTAKES (DRIS) FOR MACRONUTRIENTS
                                   TABLE 113 RECOMMENDED DIETARY REFERENCE INTAKES (DRIS) FOR MICRONUTRIENTS
                                   TABLE 114 FUNCTIONAL FOOD INGREDIENTS MARKET IN INFANT FOOD, BY REGION,  2019–2023 (USD MILLION)
                                   TABLE 115 MARKET IN INFANT FOOD, BY REGION,  2024–2029 (USD MILLION)
             10.2.3 DAIRY PRODUCTS
                       10.2.3.1 Surge in demand for dairy alternatives and probiotic options
                                   TABLE 116 FUNCTIONAL FOOD INGREDIENTS MARKET IN DAIRY PRODUCTS, BY REGION,  2019–2023 (USD MILLION)
                                   TABLE 117 MARKET IN DAIRY PRODUCTS, BY REGION,  2024–2029 (USD MILLION)
             10.2.4 BAKERY PRODUCTS
                       10.2.4.1 Shift to healthier alternatives driven by innovation in functional ingredients as well as nutrient fortification
                                   TABLE 118 FUNCTIONAL FOOD INGREDIENTS MARKET IN BAKERY PRODUCTS, BY REGION,  2019–2023 (USD MILLION)
                                   TABLE 119 MARKET IN BAKERY PRODUCTS, BY REGION,  2024–2029 (USD MILLION)
             10.2.5 CONFECTIONERY PRODUCTS
                       10.2.5.1 Convergence of consumer preferences for both indulgent and health-conscious choices
                                   TABLE 120 FUNCTIONAL FOOD INGREDIENTS MARKET IN CONFECTIONERY PRODUCTS, BY REGION, 2019–2023 (USD MILLION)
                                   TABLE 121 MARKET IN CONFECTIONERY PRODUCTS, BY REGION, 2024–2029 (USD MILLION)
             10.2.6 SNACKS
                       10.2.6.1 Evolving preferences toward healthier, functional snack options
                                   TABLE 122 FUNCTIONAL FOOD INGREDIENTS MARKET IN SNACKS, BY REGION,  2019–2023 (USD MILLION)
                                   TABLE 123 MARKET IN SNACKS, BY REGION,  2024–2029 (USD MILLION)
             10.2.7 MEAT & MEAT PRODUCTS
                       10.2.7.1 Growth in demand for nutritious and healthy meat products
                                   TABLE 124 FUNCTIONAL FOOD INGREDIENTS MARKET IN MEAT & MEAT PRODUCTS, BY REGION, 2019–2023 (USD MILLION)
                                   TABLE 125 MARKET IN MEAT & MEAT PRODUCTS, BY REGION, 2024–2029 (USD MILLION)
             10.2.8 OTHER FOOD APPLICATIONS
                       TABLE 126 FUNCTIONAL FOOD INGREDIENTS MARKET IN OTHER FOOD APPLICATIONS, BY REGION, 2019–2023 (USD MILLION)
                       TABLE 127 MARKET IN OTHER FOOD APPLICATIONS, BY REGION, 2024–2029 (USD MILLION)
     10.3 BEVERAGES 
             10.3.1 DEMAND FOR HEALTH BEVERAGES AND DRINKS TO DRIVE FUNCTIONAL JUICES AND BEVERAGES
                       TABLE 128 FUNCTIONAL FOOD INGREDIENTS MARKET IN BEVERAGES, BY SUBAPPLICATION,  2019–2023 (USD MILLION)
                       TABLE 129 MARKET IN BEVERAGES, BY SUBAPPLICATION,  2024–2029 (USD MILLION)
                       TABLE 130 MARKET IN BEVERAGES, BY REGION,  2019–2023 (USD MILLION)
                       TABLE 131 MARKET IN BEVERAGES, BY REGION,  2024–2029 (USD MILLION)
             10.3.2 ENERGY DRINKS
                       10.3.2.1 Evolving preferences for functional benefits in energy and  sports drinks
                                   TABLE 132 FUNCTIONAL FOOD INGREDIENTS MARKET IN ENERGY DRINKS, BY REGION,  2019–2023 (USD MILLION)
                                   TABLE 133 MARKET IN ENERGY DRINKS, BY REGION,  2024–2029 (USD MILLION)
             10.3.3 JUICES
                       10.3.3.1 On-the-go solutions, natural, and healthy options in juices to remain poised for continued growth
                                   TABLE 134 FUNCTIONAL FOOD INGREDIENTS MARKET IN JUICES, BY REGION,  2019–2023 (USD MILLION)
                                   TABLE 135 MARKET IN JUICES, BY REGION,  2024–2029 (USD MILLION)
             10.3.4 HEALTH DRINKS
                       10.3.4.1 Increase in consumer emphasis on holistic wellness and pursuit of convenient solutions to support their health goal
                                   TABLE 136 FUNCTIONAL FOOD INGREDIENTS MARKET IN HEALTH DRINKS, BY REGION,  2019–2023 (USD MILLION)
                                   TABLE 137 MARKET IN HEALTH DRINKS, BY REGION,  2024–2029 (USD MILLION)
     10.4 NUTRACEUTICALS & DIETARY SUPPLEMENTS 
             10.4.1 CONSUMER AWARENESS AND IMPERATIVE FOR PROACTIVE HEALTH MANAGEMENT, PARTICULARLY AMONG AGING POPULATION
                       TABLE 138 FUNCTIONAL FOOD INGREDIENTS MARKET IN NUTRACEUTICALS & DIETARY SUPPLEMENTS, BY REGION, 2019–2023 (USD MILLION)
                       TABLE 139 MARKET IN NUTRACEUTICALS & DIETARY SUPPLEMENTS, BY REGION, 2024–2029 (USD MILLION)
 
11 FUNCTIONAL FOOD INGREDIENTS MARKET, BY HEALTH BENEFITS (Page No. - 222)
     11.1 INTRODUCTION 
     11.2 DIGESTIVE HEALTH 
     11.3 IMMUNE SUPPORT 
     11.4 ENERGY & METABOLISM 
     11.5 HEART HEALTH 
     11.6 BONE & JOINT HEALTH 
               TABLE 140 BONE-BUILDING NUTRIENTS & THEIR THERAPEUTIC RANGE
     11.7 WEIGHT MANAGEMENT 
     11.8 OTHER HEALTH BENEFITS 
 
12 FUNCTIONAL FOOD INGREDIENTS MARKET, BY REGION (Page No. - 227)
     12.1 INTRODUCTION 
               TABLE 141 FUNCTIONAL FOOD INGREDIENTS MARKET, BY REGION, 2019–2023 (USD MILLION)
               TABLE 142 MARKET, BY REGION, 2024–2029 (USD MILLION)
               TABLE 143 MARKET, BY REGION, 2019–2023 (TON)
               TABLE 144 MARKET, BY REGION, 2024–2029 (TON)
     12.2 NORTH AMERICA 
               TABLE 145 NORTH AMERICA: FUNCTIONAL FOOD INGREDIENTS MARKET, BY COUNTRY,  2019–2023 (USD MILLION)
               TABLE 146 NORTH AMERICA: MARKET, BY COUNTRY,  2024–2029 (USD MILLION)
               TABLE 147 NORTH AMERICA: MARKET, BY COUNTRY,  2019–2023 (TON)
               TABLE 148 NORTH AMERICA: MARKET, BY COUNTRY,  2024–2029 (TON)
               TABLE 149 NORTH AMERICA: MARKET, BY TYPE,  2019–2023 (USD MILLION)
               TABLE 150 NORTH AMERICA: MARKET, BY TYPE,  2024–2029 (USD MILLION)
               TABLE 151 NORTH AMERICA: MARKET, BY TYPE,  2019–2023 (TON)
               TABLE 152 NORTH AMERICA: MARKET, BY TYPE,  2024–2029 (TON)
               TABLE 153 NORTH AMERICA: MINERAL-BASED FUNCTIONAL FOOD INGREDIENTS MARKET, BY TYPE, 2019–2023 (USD MILLION)
               TABLE 154 NORTH AMERICA: MINERAL-BASED MARKET, BY TYPE, 2024–2029 (USD MILLION)
               TABLE 155 NORTH AMERICA: FUNCTIONAL FOOD INGREDIENTS MARKET, BY APPLICATION, 2019–2023 (USD MILLION)
               TABLE 156 NORTH AMERICA: MARKET, BY APPLICATION,  2024–2029 (USD MILLION)
               TABLE 157 NORTH AMERICA: MARKET IN FOOD,  BY SUBAPPLICATION, 2019–2023 (USD MILLION)
               TABLE 158 NORTH AMERICA: MARKET IN FOOD,  BY SUBAPPLICATION, 2024–2029 (USD MILLION)
               TABLE 159 NORTH AMERICA: MARKET IN BEVERAGES,  BY SUBAPPLICATION, 2019–2023 (USD MILLION)
               TABLE 160 NORTH AMERICA: MARKET IN BEVERAGES,  BY SUBAPPLICATION, 2024–2029 (USD MILLION)
               TABLE 161 NORTH AMERICA: MARKET, BY SOURCE,  2019–2023 (USD MILLION)
               TABLE 162 NORTH AMERICA: MARKET, BY SOURCE,  2024–2029 (USD MILLION)
               TABLE 163 NORTH AMERICA: NATURAL FUNCTIONAL FOOD INGREDIENTS MARKET, BY TYPE,  2019–2023 (USD MILLION)
               TABLE 164 NORTH AMERICA: NATURAL FUNCTIONAL FOOD INGREDIENTS MARKET, BY TYPE,  2024–2029 (USD MILLION)
               TABLE 165 NORTH AMERICA: MARKET, BY FORM,  2019–2023 (USD MILLION)
               TABLE 166 NORTH AMERICA: MARKET, BY FORM,  2024–2029 (USD MILLION)
             12.2.1 NORTH AMERICA: RECESSION IMPACT ANALYSIS
             12.2.2 US
                       12.2.2.1 Presence of key players and increase in health conditions among people
                                   TABLE 167 US: FUNCTIONAL FOOD INGREDIENTS MARKET, BY TYPE,  2019–2023 (USD MILLION)
                                   TABLE 168 US: MARKET, BY TYPE,  2024–2029 (USD MILLION)
                                   TABLE 169 US: MARKET, BY TYPE, 2019–2023 (TON)
                                   TABLE 170 US: MARKET, BY TYPE, 2024–2029 (TON)
                                   TABLE 171 US: MARKET, BY APPLICATION,  2019–2023 (USD MILLION)
                                   TABLE 172 US: MARKET, BY APPLICATION,  2024–2029 (USD MILLION)
             12.2.3 CANADA
                       12.2.3.1 Supportive government policies and rise in consumer health awareness
                                   TABLE 173 CANADA: APPROVED INFANT FORMULAS, 2019
                                   TABLE 174 CANADA: FUNCTIONAL FOOD INGREDIENTS MARKET, BY TYPE,  2019–2023 (USD MILLION)
                                   TABLE 175 CANADA: MARKET, BY TYPE,  2024–2029 (USD MILLION)
                                   TABLE 176 CANADA: MARKET, BY TYPE,  2019–2023 (TON)
                                   TABLE 177 CANADA: MARKET, BY TYPE, 2024–2029 (TON)
                                   TABLE 178 CANADA: MARKET, BY APPLICATION,  2019–2023 (USD MILLION)
                                   TABLE 179 CANADA: MARKET, BY APPLICATION,  2024–2029 (USD MILLION)
             12.2.4 MEXICO
                       12.2.4.1 Rise in per capita expenditure on nutritious and healthy foods
                                   TABLE 180 MEXICO: FUNCTIONAL FOOD INGREDIENTS MARKET, BY TYPE,  2019–2023 (USD MILLION)
                                   TABLE 181 MEXICO: MARKET, BY TYPE,  2024–2029 (USD MILLION)
                                   TABLE 182 MEXICO: MARKET, BY TYPE, 2019–2023 (TON)
                                   TABLE 183 MEXICO: MARKET, BY TYPE, 2024–2029 (TON)
                                   TABLE 184 MEXICO: MARKET, BY APPLICATION,  2019–2023 (USD MILLION)
                                   TABLE 185 MEXICO: MARKET, BY APPLICATION,  2024–2029 (USD MILLION)
     12.3 EUROPE 
               TABLE 186 EUROPE: FUNCTIONAL FOOD INGREDIENTS MARKET, BY COUNTRY,  2019–2023 (USD MILLION)
               TABLE 187 EUROPE: MARKET, BY COUNTRY,  2024–2029 (USD MILLION)
               TABLE 188 EUROPE: MARKET, BY COUNTRY, 2019–2023 (TON)
               TABLE 189 EUROPE: MARKET, BY COUNTRY, 2024–2029 (TON)
               TABLE 190 EUROPE: MARKET, BY TYPE,  2019–2023 (USD MILLION)
               TABLE 191 EUROPE: MARKET, BY TYPE,  2024–2029 (USD MILLION)
               TABLE 192 EUROPE: MARKET, BY TYPE, 2019–2023 (TON)
               TABLE 193 EUROPE: MARKET, BY TYPE, 2024–2029 (TON)
               TABLE 194 EUROPE: MINERAL-BASED FUNCTIONAL FOOD INGREDIENTS MARKET, BY TYPE,  2019–2023 (USD MILLION)
               TABLE 195 EUROPE: MINERAL-BASED FUNCTIONAL FOOD INGREDIENTS MARKET, BY TYPE,  2024–2029 (USD MILLION)
               TABLE 196 EUROPE: FUNCTIONAL FOOD INGREDIENTS MARKET, BY APPLICATION,  2019–2023 (USD MILLION)
               TABLE 197 EUROPE: MARKET, BY APPLICATION,  2024–2029 (USD MILLION)
               TABLE 198 EUROPE: MARKET IN FOOD, BY SUBAPPLICATION, 2019–2023 (USD MILLION)
               TABLE 199 EUROPE: MARKET IN FOOD, BY SUBAPPLICATION, 2024–2029 (USD MILLION)
               TABLE 200 EUROPE: MARKET IN BEVERAGES,  BY SUBAPPLICATION, 2019–2023 (USD MILLION)
               TABLE 201 EUROPE: MARKET IN BEVERAGES,  BY SUBAPPLICATION, 2024–2029 (USD MILLION)
               TABLE 202 EUROPE: MARKET, BY SOURCE,  2019–2023 (USD MILLION)
               TABLE 203 EUROPE: MARKET, BY SOURCE,  2024–2029 (USD MILLION)
               TABLE 204 EUROPE: NATURAL FUNCTIONAL FOOD INGREDIENTS MARKET, BY TYPE,  2019–2023 (USD MILLION)
               TABLE 205 EUROPE: NATURAL FUNCTIONAL FOOD INGREDIENTS MARKET, BY TYPE,  2024–2029 (USD MILLION)
               TABLE 206 EUROPE: MARKET, BY FORM,  2019–2023 (USD MILLION)
               TABLE 207 EUROPE: MARKET, BY FORM,  2024–2029 (USD MILLION)
             12.3.1 EUROPE: RECESSION IMPACT ANALYSIS
             12.3.2 UK
                       12.3.2.1 Consumers’ high awareness of various functional ingredients and other wellness ingredients
                                   TABLE 208 UK: FUNCTIONAL FOOD INGREDIENTS MARKET, BY TYPE,  2019–2023 (USD MILLION)
                                   TABLE 209 UK: MARKET, BY TYPE,  2024–2029 (USD MILLION)
                                   TABLE 210 UK: MARKET, BY TYPE, 2019–2023 (TON)
                                   TABLE 211 UK: MARKET, BY TYPE, 2024–2029 (TON)
                                   TABLE 212 UK: MARKET, BY APPLICATION,  2019–2023 (USD MILLION)
                                   TABLE 213 UK: MARKET, BY APPLICATION,  2024–2029 (USD MILLION)
             12.3.3 FRANCE
                       12.3.3.1 Preference for better eating habits resulted in adoption of alternatives, especially among women
                                   TABLE 214 FRANCE: FUNCTIONAL FOOD INGREDIENTS MARKET, BY TYPE,  2019–2023 (USD MILLION)
                                   TABLE 215 FRANCE: MARKET, BY TYPE,  2024–2029 (USD MILLION)
                                   TABLE 216 FRANCE: MARKET, BY TYPE,  2019–2023 (TON)
                                   TABLE 217 FRANCE: MARKET, BY TYPE,  2024–2029 (TON)
                                   TABLE 218 FRANCE: MARKET, BY APPLICATION,  2019–2023 (USD MILLION)
                                   TABLE 219 FRANCE: MARKET, BY APPLICATION,  2024–2029 (USD MILLION)
             12.3.4 GERMANY
                       12.3.4.1 Manufacturers constantly improve their products with newer technology and innovations
                                   TABLE 220 GERMANY: FUNCTIONAL FOOD INGREDIENTS MARKET, BY TYPE,  2019–2023 (USD MILLION)
                                   TABLE 221 GERMANY: MARKET, BY TYPE,  2024–2029 (USD MILLION)
                                   TABLE 222 GERMANY: MARKET, BY TYPE, 2019–2023 (TON)
                                   TABLE 223 GERMANY: MARKET, BY TYPE, 2024–2029 (TON)
                                   TABLE 224 GERMANY: MARKET, BY APPLICATION,  2019–2023 (USD MILLION)
                                   TABLE 225 GERMANY: MARKET, BY APPLICATION,  2024–2029 (USD MILLION)
             12.3.5 ITALY
                       12.3.5.1 Stringent quality control mandates for functional food ingredients such as omega-3 and folic acid
                                   TABLE 226 ITALY: FUNCTIONAL FOOD INGREDIENTS MARKET, BY TYPE, 2019–2023 (USD MILLION)
                                   TABLE 227 ITALY: MARKET, BY TYPE, 2024–2029 (USD MILLION)
                                   TABLE 228 ITALY: MARKET, BY TYPE, 2019–2023 (TON)
                                   TABLE 229 ITALY: MARKET, BY TYPE, 2024–2029 (TON)
                                   TABLE 230 ITALY: MARKET, BY APPLICATION,  2019–2023 (USD MILLION)
                                   TABLE 231 ITALY: MARKET, BY APPLICATION,  2024–2029 (USD MILLION)
             12.3.6 SPAIN
                       12.3.6.1 Interest in supplement consumption and food fortified with fiber, probiotics, omega-3 acids, folic acids, and vitamins A and D
                                   TABLE 232 SPAIN: FUNCTIONAL FOOD INGREDIENTS MARKET, BY TYPE, 2019–2023 (USD MILLION)
                                   TABLE 233 SPAIN: MARKET, BY TYPE, 2024–2029 (USD MILLION)
                                   TABLE 234 SPAIN: MARKET, BY TYPE, 2019–2023 (TON)
                                   TABLE 235 SPAIN: MARKET, BY TYPE, 2024–2029 (TON)
                                   TABLE 236 SPAIN: MARKET, BY APPLICATION,  2019–2023 (USD MILLION)
                                   TABLE 237 SPAIN: MARKET, BY APPLICATION,  2024–2029 (USD MILLION)
             12.3.7 RUSSIA
                       12.3.7.1 Need for government initiatives to promote consumption of functional food
                                   TABLE 238 RUSSIA: FUNCTIONAL FOOD INGREDIENTS MARKET, BY TYPE, 2019–2023 (USD MILLION)
                                   TABLE 239 RUSSIA: MARKET, BY TYPE, 2024–2029 (USD MILLION)
                                   TABLE 240 RUSSIA: MARKET, BY TYPE, 2019–2023 (TON)
                                   TABLE 241 RUSSIA: MARKET, BY TYPE, 2024–2029 (TON)
                                   TABLE 242 RUSSIA: MARKET, BY APPLICATION,  2019–2023 (USD MILLION)
                                   TABLE 243 RUSSIA: MARKET, BY APPLICATION,  2024–2029 (USD MILLION)
             12.3.8 REST OF EUROPE
                       TABLE 244 REST OF EUROPE: FUNCTIONAL FOOD INGREDIENTS MARKET, BY TYPE,  2019–2023 (USD MILLION)
                       TABLE 245 REST OF EUROPE: MARKET, BY TYPE,  2024–2029 (USD MILLION)
                       TABLE 246 REST OF EUROPE: MARKET, BY TYPE, 2019–2023 (TON)
                       TABLE 247 REST OF EUROPE: MARKET, BY TYPE, 2024–2029 (TON)
                       TABLE 248 REST OF EUROPE: MARKET, BY APPLICATION,  2019–2023 (USD MILLION)
                       TABLE 249 REST OF EUROPE: MARKET, BY APPLICATION,  2024–2029 (USD MILLION)
     12.4 ASIA PACIFIC 
               TABLE 250 ASIA PACIFIC: FUNCTIONAL FOOD INGREDIENTS MARKET, BY COUNTRY,  2019–2023 (USD MILLION)
               TABLE 251 ASIA PACIFIC: MARKET, BY COUNTRY,  2024–2029 (USD MILLION)
               TABLE 252 ASIA PACIFIC: MARKET, BY COUNTRY,  2019–2023 (TON)
               TABLE 253 ASIA PACIFIC: MARKET, BY COUNTRY,  2024–2029 (TON)
               TABLE 254 ASIA PACIFIC: MARKET, BY TYPE,  2019–2023 (USD MILLION)
               TABLE 255 ASIA PACIFIC: MARKET, BY TYPE,  2024–2029 (USD MILLION)
               TABLE 256 ASIA PACIFIC: FUNCTIONAL FOOD INGREDIENTS MARKET, BY TYPE, 2019–2023 (TON)
               TABLE 257 ASIA PACIFIC: MARKET, BY TYPE, 2024–2029 (TON)
               TABLE 258 ASIA PACIFIC: MINERAL-BASED FUNCTIONAL FOOD INGREDIENTS MARKET, BY TYPE, 2019–2023 (USD MILLION)
               TABLE 259 ASIA PACIFIC: MINERAL-BASED FUNCTIONAL FOOD INGREDIENTS MARKET, BY TYPE, 2024–2029 (USD MILLION)
               TABLE 260 ASIA PACIFIC: FUNCTIONAL FOOD INGREDIENTS MARKET, BY APPLICATION,  2019–2023 (USD MILLION)
               TABLE 261 ASIA PACIFIC: MARKET, BY APPLICATION,  2024–2029 (USD MILLION)
               TABLE 262 ASIA PACIFIC: MARKET IN FOOD, BY SUBAPPLICATION, 2019–2023 (USD MILLION)
               TABLE 263 ASIA PACIFIC: FUNCTIONAL FOOD INGREDIENTS MARKET IN FOOD, BY SUBAPPLICATION, 2024–2029 (USD MILLION)
               TABLE 264 ASIA PACIFIC: MARKET IN BEVERAGES,  BY SUBAPPLICATION, 2019–2023 (USD MILLION)
               TABLE 265 ASIA PACIFIC: MARKET IN BEVERAGES,  BY SUBAPPLICATION, 2024–2029 (USD MILLION)
               TABLE 266 ASIA PACIFIC: MARKET, BY SOURCE,  2019–2023 (USD MILLION)
               TABLE 267 ASIA PACIFIC: MARKET, BY SOURCE,  2024–2029 (USD MILLION)
               TABLE 268 ASIA PACIFIC: NATURAL FUNCTIONAL FOOD INGREDIENTS MARKET, BY TYPE,  2019–2023 (USD MILLION)
               TABLE 269 ASIA PACIFIC: NATURAL FUNCTIONAL FOOD INGREDIENTS MARKET, BY TYPE,  2024–2029 (USD MILLION)
               TABLE 270 ASIA PACIFIC: FUNCTIONAL FOOD INGREDIENTS MARKET, BY FORM,  2019–2023 (USD MILLION)
               TABLE 271 ASIA PACIFIC: MARKET, BY FORM,  2024–2029 (USD MILLION)
             12.4.1 ASIA PACIFIC: RECESSION IMPACT ANALYSIS
             12.4.2 CHINA
                       12.4.2.1 Increase in “punk nutrition” trend with changing lifestyles of consumers
                       TABLE 272 CHINA: FUNCTIONAL FOOD INGREDIENTS MARKET, BY TYPE,  2019–2023 (USD MILLION)
                       TABLE 273 CHINA: MARKET, BY TYPE, 2024–2029 (USD MILLION)
                       TABLE 274 CHINA: MARKET, BY TYPE, 2019–2023 (TON)
                       TABLE 275 CHINA: MARKET, BY TYPE, 2024–2029 (TON)
                       TABLE 276 CHINA: MARKET, BY APPLICATION,  2019–2023 (USD MILLION)
                       TABLE 277 CHINA: MARKET, BY APPLICATION,  2024–2029 (USD MILLION)
             12.4.3 JAPAN
                       12.4.3.1 Demand for clean, natural ingredients and establishment of institutes for overseeing probiotic manufacturing
                                   TABLE 278 JAPAN: FUNCTIONAL FOOD INGREDIENTS MARKET, BY TYPE,  2019–2023 (USD MILLION)
                                   TABLE 279 JAPAN: MARKET, BY TYPE, 2024–2029 (USD MILLION)
                                   TABLE 280 JAPAN: MARKET, BY TYPE, 2019–2023 (TON)
                                   TABLE 281 JAPAN: MARKET, BY TYPE, 2024–2029 (TON)
                                   TABLE 282 JAPAN: MARKET, BY APPLICATION,  2019–2023 (USD MILLION)
                                   TABLE 283 JAPAN: MARKET, BY APPLICATION,  2024–2029 (USD MILLION)
             12.4.4 INDIA
                       12.4.4.1 Increase in disposable income with concerns about obtaining regulatory approval
                                   TABLE 284 INDIA: FUNCTIONAL FOOD INGREDIENTS MARKET, BY TYPE, 2019–2023 (USD MILLION)
                                   TABLE 285 INDIA: MARKET, BY TYPE, 2024–2029 (USD MILLION)
                                   TABLE 286 INDIA: MARKET, BY TYPE, 2019–2023 (TON)
                                   TABLE 287 INDIA: MARKET, BY TYPE, 2024–2029 (TON)
                                   TABLE 288 INDIA: MARKET, BY APPLICATION,  2019–2023 (USD MILLION)
                                   TABLE 289 INDIA: MARKET, BY APPLICATION,  2024–2029 (USD MILLION)
             12.4.5 AUSTRALIA & NEW ZEALAND
                       12.4.5.1 Aging population and regulatory ease in launching newer functional food & beverage products
                                   TABLE 290 AUSTRALIA & NEW ZEALAND: FUNCTIONAL FOOD INGREDIENTS MARKET, BY TYPE,  2019–2023 (USD MILLION)
                                   TABLE 291 AUSTRALIA & NEW ZEALAND: MARKET, BY TYPE,  2024–2029 (USD MILLION)
                                   TABLE 292 AUSTRALIA & NEW ZEALAND: MARKET, BY TYPE,  2019–2023 (TON)
                                   TABLE 293 AUSTRALIA & NEW ZEALAND: MARKET, BY TYPE,  2024–2029 (TON)
                                   TABLE 294 AUSTRALIA & NEW ZEALAND: MARKET,  BY APPLICATION, 2019–2023 (USD MILLION)
                                   TABLE 295 AUSTRALIA & NEW ZEALAND: MARKET,  BY APPLICATION, 2024–2029 (USD MILLION)
             12.4.6 REST OF ASIA PACIFIC
                       TABLE 296 REST OF ASIA PACIFIC: FUNCTIONAL FOOD INGREDIENTS MARKET, BY TYPE,  2019–2023 (USD MILLION)
                       TABLE 297 REST OF ASIA PACIFIC: MARKET, BY TYPE,  2024–2029 (USD MILLION)
                       TABLE 298 REST OF ASIA PACIFIC: MARKET, BY TYPE,  2019–2023 (TON)
                       TABLE 299 REST OF ASIA PACIFIC: MARKET, BY TYPE,  2024–2029 (TON)
                       TABLE 300 REST OF ASIA PACIFIC: MARKET, BY APPLICATION, 2019–2023 (USD MILLION)
                       TABLE 301 REST OF ASIA PACIFIC: MARKET, BY APPLICATION, 2024–2029 (USD MILLION)
     12.5 SOUTH AMERICA 
               TABLE 302 SOUTH AMERICA: FUNCTIONAL FOOD INGREDIENTS MARKET, BY COUNTRY,  2019–2023 (USD MILLION)
               TABLE 303 SOUTH AMERICA: MARKET, BY COUNTRY,  2024–2029 (USD MILLION)
               TABLE 304 SOUTH AMERICA: MARKET, BY COUNTRY,  2019–2023 (TON)
               TABLE 305 SOUTH AMERICA: MARKET, BY COUNTRY,  2024–2029 (TON)
               TABLE 306 SOUTH AMERICA: MARKET, BY TYPE,  2019–2023 (USD MILLION)
               TABLE 307 SOUTH AMERICA: MARKET, BY TYPE,  2024–2029 (USD MILLION)
               TABLE 308 SOUTH AMERICA: MARKET, BY TYPE, 2019–2023 (TON)
               TABLE 309 SOUTH AMERICA: FUNCTIONAL FOOD INGREDIENTS MARKET, BY TYPE, 2024–2029 (TON)
               TABLE 310 SOUTH AMERICA: MINERAL-BASED FUNCTIONAL FOOD INGREDIENTS MARKET, BY TYPE, 2019–2023 (USD MILLION)
               TABLE 311 SOUTH AMERICA: MINERAL-BASED FUNCTIONAL FOOD INGREDIENTS MARKET, BY TYPE, 2024–2029 (USD MILLION)
               TABLE 312 SOUTH AMERICA: FUNCTIONAL FOOD INGREDIENTS MARKET, BY APPLICATION,  2019–2023 (USD MILLION)
               TABLE 313 SOUTH AMERICA: MARKET, BY APPLICATION,  2024–2029 (USD MILLION)
               TABLE 314 SOUTH AMERICA: MARKET IN FOOD,  BY SUBAPPLICATION, 2019–2023 (USD MILLION)
               TABLE 315 SOUTH AMERICA: MARKET IN FOOD,  BY SUBAPPLICATION, 2024–2029 (USD MILLION)
               TABLE 316 SOUTH AMERICA: MARKET IN BEVERAGES,  BY SUBAPPLICATION, 2019–2023 (USD MILLION)
               TABLE 317 SOUTH AMERICA: MARKET IN BEVERAGES,  BY SUBAPPLICATION, 2024–2029 (USD MILLION)
               TABLE 318 SOUTH AMERICA: FUNCTIONAL FOOD INGREDIENTS MARKET, BY SOURCE,  2019–2023 (USD MILLION)
               TABLE 319 SOUTH AMERICA: MARKET, BY SOURCE,  2024–2029 (USD MILLION)
               TABLE 320 SOUTH AMERICA: NATURAL FUNCTIONAL FOOD INGREDIENTS MARKET, BY TYPE,  2019–2023 (USD MILLION)
               TABLE 321 SOUTH AMERICA: NATURAL FUNCTIONAL FOOD INGREDIENTS MARKET, BY TYPE,  2024–2029 (USD MILLION)
               TABLE 322 SOUTH AMERICA: FUNCTIONAL FOOD INGREDIENTS MARKET, BY FORM,  2019–2023 (USD MILLION)
               TABLE 323 SOUTH AMERICA: MARKET, BY FORM,  2024–2029 (USD MILLION)
             12.5.1 SOUTH AMERICA: RECESSION IMPACT ANALYSIS
             12.5.2 BRAZIL
                       12.5.2.1 Availability of rich natural sources and demand for plant-based alternatives
                                   TABLE 324 BRAZIL: FUNCTIONAL FOOD INGREDIENTS MARKET, BY TYPE, 2019–2023 (USD MILLION)
                                   TABLE 325 BRAZIL: MARKET, BY TYPE, 2024–2029 (USD MILLION)
                                   TABLE 326 BRAZIL: MARKET, BY TYPE, 2019–2023 (TON)
                                   TABLE 327 BRAZIL: MARKET, BY TYPE, 2024–2029 (TON)
                                   TABLE 328 BRAZIL: MARKET, BY APPLICATION,  2019–2023 (USD MILLION)
                                   TABLE 329 BRAZIL: MARKET, BY APPLICATION,  2024–2029 (USD MILLION)
             12.5.3 ARGENTINA
                       12.5.3.1 Steady rise of undernourishment and gradual shift toward embracing health food
                                   TABLE 330 ARGENTINA: FUNCTIONAL FOOD INGREDIENTS MARKET, BY TYPE,  2019–2023 (USD MILLION)
                                   TABLE 331 ARGENTINA: MARKET, BY TYPE,  2024–2029 (USD MILLION)
                                   TABLE 332 ARGENTINA: MARKET, BY TYPE, 2019–2023 (TON)
                                   TABLE 333 ARGENTINA: MARKET, BY TYPE, 2024–2029 (TON)
                                   TABLE 334 ARGENTINA: MARKET, BY APPLICATION,  2019–2023 (USD MILLION)
                                   TABLE 335 ARGENTINA: MARKET, BY APPLICATION,  2024–2029 (USD MILLION)
             12.5.4 REST OF SOUTH AMERICA
                       TABLE 336 REST OF SOUTH AMERICA: FUNCTIONAL FOOD INGREDIENTS MARKET, BY TYPE,  2019–2023 (USD MILLION)
                       TABLE 337 REST OF SOUTH AMERICA: MARKET, BY TYPE,  2024–2029 (USD MILLION)
                       TABLE 338 REST OF SOUTH AMERICA: MARKET, BY TYPE,  2019–2023 (TON)
                       TABLE 339 REST OF SOUTH AMERICA: MARKET, BY TYPE,  2024–2029 (TON)
                       TABLE 340 REST OF SOUTH AMERICA: MARKET, BY APPLICATION, 2019–2023 (USD MILLION)
                       TABLE 341 REST OF SOUTH AMERICA: MARKET, BY APPLICATION, 2024–2029 (USD MILLION)
     12.6 REST OF THE WORLD (ROW) 
               TABLE 342 ROW: FUNCTIONAL FOOD INGREDIENTS MARKET, BY REGION,  2019–2023 (USD MILLION)
               TABLE 343 ROW: MARKET, BY REGION,  2024–2029 (USD MILLION)
               TABLE 344 ROW: MARKET, BY REGION, 2019–2023 (TON)
               TABLE 345 ROW: MARKET, BY REGION, 2024–2029 (TON)
               TABLE 346 ROW: MARKET, BY TYPE, 2019–2023 (USD MILLION)
               TABLE 347 ROW: MARKET, BY TYPE, 2024–2029 (USD MILLION)
               TABLE 348 ROW: MARKET, BY TYPE, 2019–2023 (TON)
               TABLE 349 ROW: MARKET, BY TYPE, 2024–2029 (TON)
               TABLE 350 ROW: MINERAL-BASED FUNCTIONAL FOOD INGREDIENTS MARKET, BY TYPE,  2019–2023 (USD MILLION)
               TABLE 351 ROW: MINERAL-BASED FUNCTIONAL FOOD INGREDIENTS MARKET, BY TYPE,  2024–2029 (USD MILLION)
               TABLE 352 ROW: FUNCTIONAL FOOD INGREDIENTS MARKET, BY APPLICATION,  2019–2023 (USD MILLION)
               TABLE 353 ROW: MARKET, BY APPLICATION,  2024–2029 (USD MILLION)
               TABLE 354 ROW: MARKET IN FOOD, BY SUBAPPLICATION,  2019–2023 (USD MILLION)
               TABLE 355 ROW: MARKET IN FOOD, BY SUBAPPLICATION,  2024–2029 (USD MILLION)
               TABLE 356 ROW: MARKET IN BEVERAGES, BY SUBAPPLICATION,  2019–2023 (USD MILLION)
               TABLE 357 ROW: MARKET IN BEVERAGES, BY SUBAPPLICATION,  2024–2029 (USD MILLION)
               TABLE 358 ROW: MARKET, BY SOURCE,  2019–2023 (USD MILLION)
               TABLE 359 ROW: MARKET, BY SOURCE,  2024–2029 (USD MILLION)
               TABLE 360 ROW: NATURAL FUNCTIONAL FOOD INGREDIENTS MARKET, BY TYPE,  2019–2023 (USD MILLION)
               TABLE 361 ROW: NATURAL FUNCTIONAL FOOD INGREDIENTS MARKET, BY TYPE,  2024–2029 (USD MILLION)
               TABLE 362 ROW: FUNCTIONAL FOOD INGREDIENTS MARKET, BY FORM, 2019–2023 (USD MILLION)
               TABLE 363 ROW: MARKET, BY FORM, 2024–2029 (USD MILLION)
             12.6.1 ROW: RECESSION IMPACT ANALYSIS
             12.6.2 AFRICA
                       12.6.2.1 Rise in disease burden due to micronutrient deficiencies but increase in intra-African trade
                       12.6.2.2 South Africa
                       12.6.2.3 Nigeria
                       12.6.2.4 Rest of Africa
                                   TABLE 364 AFRICA: FUNCTIONAL FOOD INGREDIENTS MARKET, BY TYPE, 2019–2023 (USD MILLION)
                                   TABLE 365 AFRICA: MARKET, BY TYPE, 2024–2029 (USD MILLION)
                                   TABLE 366 AFRICA: MARKET, BY TYPE, 2019–2023 (TON)
                                   TABLE 367 AFRICA: MARKET, BY TYPE, 2024–2029 (TON)
                                   TABLE 368 AFRICA: MARKET, BY APPLICATION,  2019–2023 (USD MILLION)
                                   TABLE 369 AFRICA: MARKET, BY APPLICATION,  2024–2029 (USD MILLION)
             12.6.3 MIDDLE EAST
                       12.6.3.1 Increase in influence of Western culture and unhealthy lifestyles
                       12.6.3.2 UAE
                       12.6.3.3 Saudi Arabia
                       12.6.3.4 Rest of Middle East
                                   TABLE 370 MIDDLE EAST: FUNCTIONAL FOOD INGREDIENTS MARKET, BY TYPE,  2019–2023 (USD MILLION)
                                   TABLE 371 MIDDLE EAST: MARKET, BY TYPE,  2024–2029 (USD MILLION)
                                   TABLE 372 MIDDLE EAST: MARKET, BY TYPE, 2019–2023 (TON)
                                   TABLE 373 MIDDLE EAST: MARKET, BY TYPE, 2024–2029 (TON)
                                   TABLE 374 MIDDLE EAST: MARKET, BY APPLICATION,  2019–2023 (USD MILLION)
                                   TABLE 375 MIDDLE EAST: MARKET, BY APPLICATION,  2024–2029 (USD MILLION)
 
13 COMPETITIVE LANDSCAPE (Page No. - 345)
     13.1 OVERVIEW 
     13.2 REVENUE ANALYSIS 
     13.3 MARKET SHARE ANALYSIS 
               TABLE 376 FUNCTIONAL FOOD INGREDIENTS MARKET: DEGREE OF COMPETITION (COMPETITIVE)
     13.4 KEY PLAYERS’ STRATEGIES/RIGHT TO WIN 
               TABLE 377 STRATEGIES ADOPTED BY KEY PLAYERS IN FUNCTIONAL FOOD INGREDIENTS MARKET
     13.5 VALUATION AND FINANCIAL METRICS OF FEW MAJOR PLAYERS 
     13.6 BRAND/PRODUCT COMPARATIVE ANALYSIS 
             13.6.1 BRAND/PRODUCT COMPARATIVE ANALYSIS, BY TYPE
     13.7 COMPANY EVALUATION MATRIX: KEY PLAYERS 
             13.7.1 STARS
             13.7.2 EMERGING LEADERS
             13.7.3 PERVASIVE PLAYERS
             13.7.4 PARTICIPANTS
             13.7.5 COMPANY FOOTPRINT FOR KEY PLAYERS
                       13.7.5.1 Overall company footprint
                       13.7.5.2 Type footprint
                                   TABLE 378 COMPANY TYPE FOOTPRINT, 2023
                       13.7.5.3 Application footprint
                                   TABLE 379 COMPANY APPLICATION FOOTPRINT, 2023
                       13.7.5.4 Form footprint
                                   TABLE 380 COMPANY FORM FOOTPRINT, 2023
                       13.7.5.5 Source footprint
                                   TABLE 381 COMPANY SOURCE FOOTPRINT, 2023
                       13.7.5.6 Regional footprint
                                   TABLE 382 COMPANY REGIONAL FOOTPRINT, 2023
     13.8 COMPANY EVALUATION MATRIX: STARTUP/SMES 
             13.8.1 PROGRESSIVE COMPANIES
             13.8.2 RESPONSIVE COMPANIES
             13.8.3 DYNAMIC COMPANIES
             13.8.4 STARTING BLOCKS
             13.8.5 COMPETITIVE BENCHMARKING, STARTUPS/SMES
                       13.8.5.1 Detailed list of key startups/SMEs
            TABLE 383 FUNCTIONAL FOOD INGREDIENTS MARKET: DETAILED LIST OF KEY  STARTUPS/SMES, 2023
                       13.8.5.2 Competitive Benchmarking of Key Startups/SMEs
            TABLE 384 FUNCTIONAL FOOD INGREDIENTS MARKET: COMPETITIVE BENCHMARKING OF KEY STARTUP/SMES
     13.9 COMPETITIVE SCENARIO AND TRENDS 
             13.9.1 PRODUCT LAUNCHES/DEVELOPMENTS/APPROVALS
                       TABLE 385 FUNCTIONAL FOOD INGREDIENTS MARKET: PRODUCT LAUNCHES/DEVELOPMENTS/ APPROVALS, JANUARY 2019–FEBRUARY 2024
             13.9.2 DEALS
                       TABLE 386 FUNCTIONAL FOOD INGREDIENTS MARKET: DEALS, JANUARY 2019–FEBRUARY 2024
             13.9.3 OTHER DEALS/DEVELOPMENTS
                       TABLE 387 FUNCTIONAL FOOD INGREDIENTS MARKET: EXPANSIONS,  JANUARY 2019–FEBRUARY 2024
                       TABLE 388 FUNCTIONAL FOOD INGREDIENTS MARKET: OTHER DEALS/DEVELOPMENTS, JANUARY 2019–FEBRUARY 2024
 
14 COMPANY PROFILES (Page No. - 382)
(Business overview, Products/ Solutions/ Services offered, Recent Developments, Product launches/ developments/ approvals, Deals, MnM view, Right to win, Strategic choices, Weaknesses and competitive threats) *
     14.1 KEY PLAYERS 
             14.1.1 CARGILL, INCORPORATED
                       TABLE 389 CARGILL, INCORPORATED: BUSINESS OVERVIEW
                       TABLE 390 CARGILL, INCORPORATED: PRODUCTS/SOLUTIONS/SERVICES OFFERED
                       TABLE 391 CARGILL, INCORPORATED: PRODUCT LAUNCHES/DEVELOPMENTS/APPROVALS
                       TABLE 392 CARGILL, INCORPORATED: DEALS
                       TABLE 393 CARGILL, INCORPORATED: EXPANSIONS
                       TABLE 394 CARGILL, INCORPORATED: OTHER DEVELOPMENTS
             14.1.2 BASF SE
                       TABLE 395 BASF SE: BUSINESS OVERVIEW
                       TABLE 396 BASF SE: PRODUCTS/SOLUTIONS/SERVICES OFFERED
                       TABLE 397 BASF SE: PRODUCT LAUNCHES/DEVELOPMENTS/APPROVALS
                       TABLE 398 BASF SE: DEALS
                       TABLE 399 BASF SE: OTHER DEVELOPMENTS
             14.1.3 ADM
                       TABLE 400 ADM: BUSINESS OVERVIEW
                       TABLE 401 ADM: PRODUCTS/SOLUTIONS/SERVICES OFFERED
                       TABLE 402 ADM: PRODUCT LAUNCHES/DEVELOPMENTS/APPROVALS
                       TABLE 403 ADM: DEALS
                       TABLE 404 ADM: EXPANSIONS
                       TABLE 405 ADM: OTHER DEVELOPMENTS
             14.1.4 INTERNATIONAL FLAVORS & FRAGRANCES INC.
                       TABLE 406 INTERNATIONAL FLAVORS & FRAGRANCES INC.: BUSINESS OVERVIEW
                       TABLE 407 INTERNATIONAL FLAVORS & FRAGRANCES INC.: PRODUCTS/SOLUTIONS/ SERVICES OFFERED
                       TABLE 408 INTERNATIONAL FLAVORS & FRAGRANCES INC.: PRODUCT LAUNCHES/DEVELOPMENTS/APPROVALS
                       TABLE 409 INTERNATIONAL FLAVORS & FRAGRANCES INC.: DEALS
                       TABLE 410 INTERNATIONAL FLAVORS & FRAGRANCES INC.: EXPANSIONS
             14.1.5 ARLA FOODS AMBA
                       TABLE 411 ARLA FOODS AMBA: BUSINESS OVERVIEW
                       TABLE 412 ARLA FOODS AMBA: PRODUCTS/SOLUTIONS/SERVICES OFFERED
                       TABLE 413 ARLA FOODS AMBA: DEALS
                       TABLE 414 ARLA FOODS AMBA: EXPANSIONS
             14.1.6 KERRY GROUP PLC
                       TABLE 415 KERRY GROUP PLC: BUSINESS OVERVIEW
                       TABLE 416 KERRY GROUP PLC: PRODUCTS/SOLUTIONS/SERVICES OFFERED
                       TABLE 417 KERRY GROUP PLC: PRODUCT LAUNCHES/DEVELOPMENTS/APPROVALS
                       TABLE 418 KERRY GROUP PLC: EXPANSIONS
             14.1.7 AJINOMOTO CO., INC.
                       TABLE 419 AJINOMOTO CO., INC.: BUSINESS OVERVIEW
                       TABLE 420 AJINOMOTO CO., INC.: PRODUCTS/SOLUTIONS/SERVICES OFFERED
                       TABLE 421 AJINOMOTO CO., INC.: DEALS
                       TABLE 422 AJINOMOTO CO., INC.: EXPANSIONS
             14.1.8 DSM
                       TABLE 423 DSM: BUSINESS OVERVIEW
                       TABLE 424 DSM: PRODUCTS/SOLUTIONS/SERVICES OFFERED
                       TABLE 425 DSM: DEALS
             14.1.9 INGREDION
                       TABLE 426 INGREDION: BUSINESS OVERVIEW
                       TABLE 427 INGREDION: PRODUCTS/SOLUTIONS/SERVICES OFFERED
                       TABLE 428 INGREDION: DEALS
             14.1.10 TATE & LYLE
                                   TABLE 429 TATE & LYLE: BUSINESS OVERVIEW
                                   TABLE 430 TATE & LYLE: PRODUCTS/SOLUTIONS/SERVICES OFFERED
                                   TABLE 431 TATE & LYLE: PRODUCT LAUNCHES/DEVELOPMENTS/APPROVALS
                                   TABLE 432 TATE & LYLE: DEALS
             14.1.11 TEIJIN LIMITED
                                   TABLE 433 TEIJIN LIMITED: BUSINESS OVERVIEW
                                   TABLE 434 TEIJIN LIMITED: PRODUCTS/SOLUTIONS/SERVICES OFFERED
                                   TABLE 435 TEIJIN LIMITED: PRODUCT LAUNCHES/DEVELOPMENTS/APPROVALS
                                   TABLE 436 TEIJIN LIMITED: EXPANSIONS
                                   TABLE 437 TEIJIN LIMITED: OTHER DEVELOPMENTS
             14.1.12 CHR. HANSEN A/S
                                   TABLE 438 CHR. HANSEN A/S: BUSINESS OVERVIEW
                                   TABLE 439 CHR. HANSEN A/S: PRODUCTS/SOLUTIONS/SERVICES OFFERED
                                   TABLE 440 CHR. HANSEN A/S: DEALS
                                   TABLE 441 CHR. HANSEN A/S: EXPANSIONS
             14.1.13 GLANBIA PLC
                                   TABLE 442 GLANBIA PLC: BUSINESS OVERVIEW
                                   TABLE 443 GLANBIA PLC: PRODUCTS/SOLUTIONS/SERVICES OFFERED
             14.1.14 KEMIN INDUSTRIES, INC.
                                   TABLE 444 KEMIN INDUSTRIES, INC.: BUSINESS OVERVIEW
                                   TABLE 445 KEMIN INDUSTRIES, INC.: PRODUCTS/SOLUTIONS/SERVICES OFFERED
                                   TABLE 446 KEMIN INDUSTRIES, INC.: PRODUCT LAUNCHES/DEVELOPMENTS/APPROVALS
                                   TABLE 447 KEMIN INDUSTRIES, INC.: DEALS
                                   TABLE 448 KEMIN INDUSTRIES, INC.: EXPANSIONS
                                   TABLE 449 KEMIN INDUSTRIES, INC.: OTHER DEVELOPMENTS
             14.1.15 BENEO
                                   TABLE 450 BENEO: BUSINESS OVERVIEW
                                   TABLE 451 BENEO: PRODUCTS/SOLUTIONS/SERVICES OFFERED
                                   TABLE 452 BENEO: EXPANSIONS
             14.1.16 COSUN
                                   TABLE 453 COSUN: BUSINESS OVERVIEW
                                   TABLE 454 COSUN: PRODUCTS/SOLUTIONS/SERVICES OFFERED
             14.1.17 ROQUETTE FRÈRES
                                   TABLE 455 ROQUETTE FRÈRES: BUSINESS OVERVIEW
                                   TABLE 456 ROQUETTE FRÈRES: PRODUCTS/SOLUTIONS/SERVICES OFFERED
                                   TABLE 457 ROQUETTE FRÈRES: PRODUCT LAUNCHES/DEVELOPMENTS/APPROVALS
                                   TABLE 458 ROQUETTE FRÈRES: EXPANSIONS
*Details on Business overview, Products/ Solutions/ Services offered, Recent Developments, Product launches/ developments/ approvals, Deals, MnM view, Right to win, Strategic choices, Weaknesses and competitive threats might not be captured in case of unlisted companies.
     14.2 OTHER PLAYERS 
             14.2.1 SOYLENT
                       TABLE 459 SOYLENT: COMPANY OVERVIEW
             14.2.2 A&B INGREDIENTS, INC.
                       TABLE 460 A&B INGREDIENTS, INC.: COMPANY OVERVIEW
             14.2.3 GOLDEN GRAIN GROUP LIMITED
                       TABLE 461 GOLDEN GRAIN GROUP LIMITED: COMPANY OVERVIEW
             14.2.4 AMINOLA
                       TABLE 462 AMINOLA: COMPANY OVERVIEW
             14.2.5 STRATUM NUTRITION
                       TABLE 463 STRATUM NUTRITION: COMPANY OVERVIEW
             14.2.6 FOODCHEM INTERNATIONAL CORPORATION
                       TABLE 464 FOODCHEM INTERNATIONAL CORPORATION: COMPANY OVERVIEW
 
15 ADJACENT AND RELATED MARKETS (Page No. - 462)
     15.1 INTRODUCTION 
               TABLE 465 ADJACENT MARKETS TO FUNCTIONAL FOOD INGREDIENTS MARKET
     15.2 LIMITATIONS 
     15.3 VITAMINS MARKET 
             15.3.1 MARKET DEFINITION
             15.3.2 MARKET OVERVIEW
                       TABLE 466 VITAMINS MARKET, BY REGION, 2017–2022 (USD MILLION)
                       TABLE 467 VITAMINS MARKET, BY REGION, 2023–2028 (USD MILLION)
     15.4 NUTRACEUTICAL INGREDIENTS MARKET 
             15.4.1 MARKET DEFINITION
             15.4.2 MARKET OVERVIEW
                       TABLE 468 NUTRACEUTICAL INGREDIENTS MARKET, BY REGION, 2017–2021 (USD MILLION)
                       TABLE 469 NUTRACEUTICAL INGREDIENTS MARKET, BY REGION, 2022–2027 (USD MILLION)
 
16 APPENDIX (Page No. - 465)
     16.1 DISCUSSION GUIDE 
     16.2 KNOWLEDGESTORE: MARKETSANDMARKETS’  SUBSCRIPTION PORTAL 
     16.3 CUSTOMIZATION OPTIONS 
     16.4 RELATED REPORTS 
     16.5 AUTHOR DETAILS 
 

The study involved two major segments in estimating the current size of the functional food ingredients market. Exhaustive secondary research was done to collect information on the market, peer, and parent markets. The next step was to validate these findings, assumptions, and sizing with industry experts across the value chain through primary research. Both top-down and bottom-up approaches were employed to estimate the complete market size. After that, market breakdown and data triangulation were used to estimate the market size of segments and subsegments.

Secondary Research

This research study involved the extensive use of secondary sources—directories and databases such as Bloomberg Businessweek and Factiva—to identify and collect information useful for a technical, market-oriented, and commercial study of the functional food ingredients market.

In the secondary research process, various sources such as annual reports, press releases & investor presentations of companies, white papers, food journals, certified publications, articles from recognized authors, directories, and databases, were referred to identify and collect information.

Secondary research was mainly used to obtain key information about the industry’s supply chain, the total pool of key players, and market classification and segmentation as per the industry trends to the bottom-most level, regional markets, and key developments from both market- and technology-oriented perspectives.

Primary Research

Extensive primary research was conducted after obtaining information regarding the functional food ingredients market scenario through secondary research. Several primary interviews were conducted with market experts from both the demand and supply sides across major countries of North America, Europe, Asia Pacific, South America, and the Rest of the World. Primary data was collected through questionnaires, emails, and telephonic interviews. The primary sources from the supply side included various industry experts, such as Chief X Officers (CXOs), Vice Presidents (VPs), Directors, from business development, marketing, research, and development teams, and related key executives from distributors, and key opinion leaders. Primary interviews were conducted to gather insights such as market statistics, data on revenue collected from the services, market breakdowns, market size estimations, market forecasting, and data triangulation. Primary research also helped in understanding the various trends related to functional food ingredients type, source, form,  application, and region. Stakeholders from the demand side, such as prebiotics, probiotics, proteins & amino acids, fibers & specialty carbohydrates, vitamins, minerals, etc products manufacturers who avail the functional food ingredients services were interviewed to understand the buyer’s perspective on the suppliers, services, and their current usage of functional food ingredients and the outlook of their business which will affect the overall market.
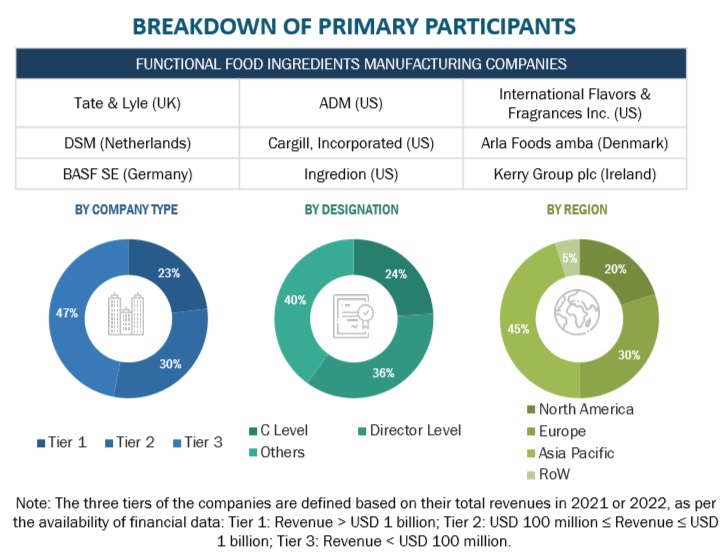
Functional Food Ingredients Market Primary Participants

To know about the assumptions considered for the study, download the pdf brochure

COMPANY NAME

Designation

Cargill, Incorporated (US)

Territory Manager

ADM (US)

Sales Manager

Tate & Lyle (UK) 

General Manager

BASF SE (Germany)

Head of logistics department

Ingredion (US)

Marketing Manager

DSM (Netherlands)

Sales Executive

Functional food ingredients Market Size Estimation

Both the top-down and bottom-up approaches were used to estimate and validate the total size of the functional food ingredients market. These approaches were also used extensively to determine the size of various subsegments in the market. The research methodology used to estimate the market size includes the following details:

  • The key players in the industry and the overall markets were identified through extensive secondary research.
  • All shares, splits, and breakdowns were determined using secondary sources and verified through primary sources.
  • All possible parameters that affect the market covered in this research study were accounted for, viewed in extensive detail, verified through primary research, and analyzed to obtain final quantitative and qualitative data.
  • The research included the study of reports, reviews, and newsletters of top market players, along with extensive interviews for opinions from leaders, such as CEOs, directors, and marketing executives.

Global Functional food ingredients Market: Bottom-Up Approach.
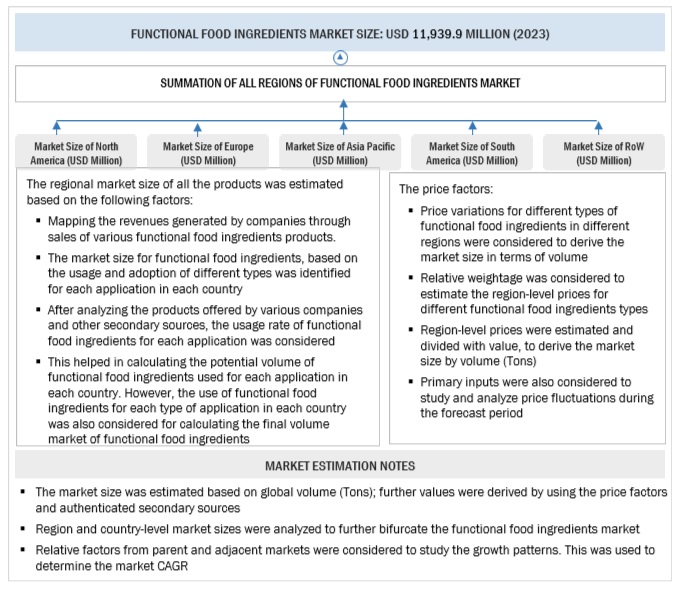
Functional Food Ingredients Market Bottom Up Approach

To know about the assumptions considered for the study, Request for Free Sample Report

Global Functional Food Ingredients Market: Top-Down Approach.
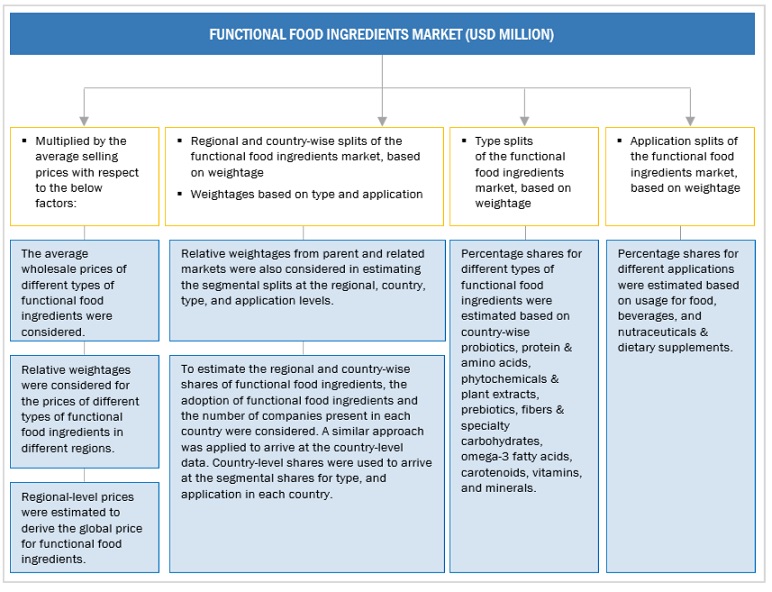
Functional Food Ingredients Market Top Down Approach

Data Triangulation

After arriving at the overall market size from the estimation process explained above, the total market was split into several segments and subsegments. Data triangulation and market breakdown procedures were employed to estimate the functional food ingredients market and arrive at the exact statistics for all segments and subsegments. The data was triangulated by studying numerous factors and trends from the demand and supply sides. The market size was also validated using both the top-down and bottom-up approaches.

Market Definition

Functional food ingredients are largely defined as those ingredients that have been demonstrated to have specific physiological benefits, apart from the main nutritional benefits that are derived from food and beverages. The use of functional food ingredients in the manufacturing of functional food & beverage products is expected to provide nutritive health benefits, prevent/resist chronic diseases, or act as energy boosters.

According to the British Nutrition Foundation, “Functional food ingredients deliver additional or enhanced benefits over and above their basic nutritional value. Some functional foods are generated around a particular functional ingredient, such as probiotics, prebiotics, or plant stanols and sterols. Other functional foods or drinks can be foods fortified with a nutrient that would not usually be present to any great extent (e.g., vitamin D in milk).”

Key Stakeholders

  • Raw material suppliers
  • Functional Food Ingredients manufacturers and suppliers
  • Functional Food ingredient processors
  • Food & beverage manufacturers/suppliers
  • Commercial research & development (R&D) institutions and financial institutions
  • Importers and exporters of functional food ingredient
  • Food & beverage traders, distributors, and suppliers
  • Associations and government agencies:
    • European Communities
    • World Health Organization (WHO)
    • OECD-FAO Agricultural Outlook
    • Organizations such as the Food and Drug Administration (FDA)
    • United States Department of Agriculture (USDA)
    • European Food Safety Agency (EFSA)
    • Ministry of Food and Drug Safety (MFDS)
    • China Dood and Drug Administration (CFDA)
    • Codex Alimentarius Commission
    • Food Safety Australia and New Zealand (FSANZ)

Report Objectives

  • Determining and projecting the size of the functional food ingredients market based on source, type, form, application, and region over a five-year period ranging from 2024 to 2029.
  • Identifying the attractive opportunities in the market by determining the largest and fastest-growing segments across the key regions
  • Analyzing the demand-side factors based on the following:
    • Impact of macro- and micro-economic factors on the market
    • Shifts in demand patterns across different subsegments and regions
  • Providing detailed information about the key factors influencing the growth of the market (drivers, restraints, opportunities, and industry-specific challenges)

Available Customizations

With the given market data, MarketsandMarkets offers customizations according to company-specific scientific needs.

The following customization options are available for the report:

Service Analysis

  • Service Matrix, which gives a detailed comparison of the service portfolio of each company.

Geographic Analysis

With the given market data, MarketsandMarkets offers customizations according to company-specific scientific needs.

  • Further breakdown of the Rest of the European market for functional food ingredients into Poland, the Netherlands, Belgium, Finland, Norway, Greece, Denmark, Switzerland, and Ireland.
  • Further breakdown of the Rest of Asia Pacific market for functional food ingredients into New Zealand, Vietnam, Indonesia, Malaysia, Taiwan, and South Korea.
  • Further breakdown of the Rest of South American market for functional food ingredients into Colombia, Peru, Chile, and Venezuela.
  • Further breakdown of the Rest of the World into the Middle East (Saudi Arabia, UAE, and the Rest of the Middle East) and Africa (South Africa, Nigeria, and the Rest of Africa).

Company Information

  • Detailed analyses and profiling of additional market players (up to five)
Custom Market Research Services

We will customize the research for you, in case the report listed above does not meet with your exact requirements. Our custom research will comprehensively cover the business information you require to help you arrive at strategic and profitable business decisions.

Request Customization

Instant Answers with GPT - Ask Now!

Ask real questions. Get complete answers !
Report Code
FB 3559
Published ON
Apr, 2024
Choose License Type
BUY NOW
  • SHARE
X
Request Customization
Speak to Analyst
Speak to Analyst
OR FACE-TO-FACE MEETING
PERSONALIZE THIS RESEARCH
  • Triangulate with your Own Data
  • Get Data as per your Format and Definition
  • Gain a Deeper Dive on a Specific Application, Geography, Customer or Competitor
  • Any level of Personalization
REQUEST A FREE CUSTOMIZATION
LET US HELP YOU!
  • What are the Known and Unknown Adjacencies Impacting the Functional Food Ingredients Market
  • What will your New Revenue Sources be?
  • Who will be your Top Customer; what will make them switch?
  • Defend your Market Share or Win Competitors
  • Get a Scorecard for Target Partners
CUSTOMIZED WORKSHOP REQUEST
knowledgestore logo

Hold On!

Want to explore hidden markets that can drive new revenue in Functional Food Ingredients Market?

Find Hidden Markets
  • Call Us
  • +1-888-600-6441 (Corporate office hours)
  • +1-888-600-6441 (US/Can toll free)
  • +44-800-368-9399 (UK office hours)
CONNECT WITH US
ABOUT TRUST ONLINE
©2024 MarketsandMarkets Research Private Ltd. All rights reserved
DMCA.com Protection Status
Website Feedback