Fiber Laser Market Size, Share, Trends

Fiber Laser Market Size, Share, Trends by Type (Infrared, Ultrafast, Ultraviolet, Visible), Operation Mode (Continuous wave, Pulsed), Output Power (Low Power, Medium Power, High Power), Industry (Telecommunications, Automotive, Medical) and Region - Global Forecast to 2029

Report Code: SE 9103 Jul, 2024, by marketsandmarkets.com

Updated on : September 12, 2024

Fiber Laser Market Size & Share

[246 Pages Report] The fiber laser market size to grow from USD 7.7 billion in 2024 and is expected to reach USD 12.8 billion by 2029, growing at a CAGR of 10.8% from 2024 to 2029. The need for increased manufacturing efficiency, precision, and reliability is driving the growth of fiber laser market. Due to their high energy efficiency and cost-effectiveness, fiber lasers are used in industries such as manufacturing, medicine, telecommunications, and consumer electronics. Fiber lasers are rapidly being adopted as diagnostic and surgical instruments in the medical industry. Moreover, the consumer electronics sector, which requires high precision, uses fiber lasers for developing smaller devices. Due to its high accuracy fiber lasers are essential to additive manufacturing and 3D printing for working with a variety of materials. Companies such as IPG Photonics Corporation are offering collaborative robots with integrated fiber lasers, which enhance workflow efficiency, safety, and automation in production processes.

Artificial intelligence (AI) in fiber lasers optimizes laser parameters which ensures high power and stable output. AI enables predictive maintenance, which reduces downtime by identifying potential issues before they arise. Furthermore, advanced data analysis provides valuable insights that can result in process improvements and new developments in manufacturing, medicine, and communications.  AI-driven fiber laser systems provide accurate cutting and welding with low error rates, enhancing quality control and decreasing downtime. They also improve safety by keeping an eye on working conditions and recognizing possible risks, automating repetitive tasks, and streamlining procedures.

Fiber Laser Market

Attractive Opportunities in Fiber laser Market

Fiber Laser Market

Fiber Laser Market

Fiber Laser Market Forecast to 2029

To know about the assumptions considered for the study, Request for Free Sample Report

Fiber laser Market Trends & Dynamics

Driver: Industrial automation boosts fiber laser adoption for their precision, efficiency, and reliability

The adoption of fiber lasers has gained strong traction in several manufacturing and material processing industries owing to the various benefits that these are associated with, which makes them a top choice among manufacturers. Fiber lasers are known for their precision work which is essential in any automated manufacturing processes. This can minimize waste, produce cleaner cutting and welding with pinpoint accuracy due to their ability of concentrating high-intensity beam. High level of precision and greater accuracy is crucial in sectors like automotive and aerospace where component quality & integrity are vital.

Restraint: High deployment cost

Fiber laser systems are in high demand for being cost-effective, accurate and providing versatile solutions across various industrial sectors. However, the substantial cost of acquisition and installation for these systems are a significant restraint especially to small and medium-sized enterprises (SMEs) or businesses with limited budgets.
High-quality fiber laser machines are expensive since they use sophisticated technology and materials with high prices. Price also ranges with power output, wavelength and what the user wants it to be capable for specific applications. Fiber lasers with high power or other specialist capabilities needed for more challenging industrial processes are particularly expensive.

Opportunity: Advanced UV Fiber Lasers

Ultraviolet (UV) fiber laser are increasing utilized in manufacturing, healthcare and telecommunications. Ultraviolet wavelengths to provide enhanced performance for uses including high-precision material processing, medical treatment and next-generation communication technologies.

UV fiber lasers are favored in the manufacturing industry because of their preciseness and minimal thermal damage characteristic when it comes to processing materials. UV light is able to focus to a smaller spot than IR or visible wavelengths, making it possible for small features and patterns on various polymers/metal/acting materials at higher resolutions The result is that UV fiber lasers have excellent application potential, for instances micro- machining and drilling of small sized holes sensitive cuts.

Challenge: Shortage of skilled professionals

Fiber laser systems require a high level of technical expertise to install and maintained which can be challenging. Fiber lasers are high-tech tools and skilled professionals  with a complete comprehension of laser physics, optics, electronics mentoring services, technical communities who can perform troubleshooting or routine maintenance pertinence to the system are required. They need to understand the laser, need to gain comprehensive knowledge of beam characteristics and how light interacts with various material as well as integration into longer processes after installation. Given the complexity of these tasks, it requires intensive training for operators and technicians often provided by laser manufactures.

Fiber laser Market Ecosystem

Fiber laser is a large ecosystem that comprises input suppliers, OEMs, distributors, verticals, and post sales service providers. The fiber laser designers and manufacturers develop and innovate lasers and laser systems with certain specifications to be distributed and supplied to different verticals. Major companies offering fiber laser include Coherent Corp. (US), IPG Photonics Corporation (US), Han's Laser Technology Co., Ltd. (China), JENOPTIK (Germany), and TRUMPF (Germany). Manufacturers or specialized fiber laser suppliers manufacture the products.

Fiber Laser Market by Ecosystem

Fiber Laser Market Segmentation

High power fiber lasers dominates the market during the forecast period.

In 2023 high power fiber lasers held the largest market share of the fiber laser since these lasers can effectively handle rigorous industrial applications which require high energy output with precision for cutting and welding of thick metals and complex materials.

They are used extensively in high energy output tasks in industries like automotive, oil & gas and even iron steel production to enhance productivity and increase operational efficiency. High power fiber lasers are widely used in the heavy industry due to large scale and high speed processing ability, versatility for heavy-duty manufacturing processes are driving the growth of high power fiber laser market.

Telecommunication segment held the largest market share in 2023.

The telecommunication segment is expected to lead the market throughout the forecast period. The exponential increase in amount of data consumed around the globe, increasing internet usage, streaming services, cloud utilization and growth in number for lot devices requires robust communication network for handling massive data transmission. The expansion of telecommunications infrastructure, including fiber-optic networks and data centers, further drives the demand for fiber laser industry .

Infrared fiber laser to dominate market during forecast period.

Infrared (IR) Fiber Laser is a laser technology emitting light in the infrared spectrum. They typically generate the laser light by using optical fibers doped with rare-earth elements such as ytterbium, erbium or neodymium. Higher beam quality, intrinsic stability and a capability of power efficient high output make IR fiber lasers highly versatile sources. There are numerous advantages to using this type of industrial laser in applications such as materials processing, telecommunications and medical procedures due to their  deep penetration coupled with a high degree of precision

Fiber Laser Market Regional Analysis

Asia Pacific to hold larger share of the market during the forecast period.

Asia Pacific dominates the fiber laser market share due to surging industrialization and technological developments, and booming manufacturing sector in  countries such as China, India, Japan making Asia Pacific the largest market for fiber lasers. Demand for fiber lasers in this region has gained traction with robust focus on embracing cutting-edge manufacturing technologies and automation, such as welding, marking & others. Moreover, the growing electronics, automotive and telecommunication sectors in this region also fuel the demand for fiber lasers. As these industries continue to grow and evolve further, the Asia Pacific market for fiber laser is expected to boom during the forecast period.

Fiber Laser Market by Region

Fiber Laser Market by Region

To know about the assumptions considered for the study, download the pdf brochure

Top Fiber Laser Companies - Key Market Players:

The fiber laser companies is dominated by globally established players such

Fiber Laser Report Scope :

Report Metric

Details

Estimated Market Size USD 7.7 billion in 2024 
Projected Market Size USD 12.8 billion by 2029
Growth Rate  CAGR of 10.8%

Fiber Laser Market size available for years

2020–2029

Base year considered

2023

Forecast period

2024–2029

Forecast units

Value (USD Million) & Volume (Thousand)

Segments Covered

  • By Type,
  • By Industry,
  • By Output Power,
  • By Operation Mode,
  • By Region.

Region covered

  • North America,
  • Europe,
  • Asia Pacific,
  • RoW (Middle East, Africa, and South America)

Companies covered

The key players in the fiber laser market are IPG Photonics Corporation (US), Wuhan Raycus Fiber Laser Technologies Co., Ltd. (China), Coherent Corp. (US), TRUMPF (Germany), and Han’s Laser Technology Industry Group Co., Ltd (China)

Fiber Laser Market Highlights

In this report, the overall fiber laser market has been segmented based on By Type, By Industry, By Output Power, By Operation Mode, By Region.

Segment

Subsegment

Fiber Laser Market Size , By Type:

  • Infrared
  • Ultrafast
  • Ultraviolet
  • Visible

By Output Power:

  • Low
  • Medium
  • High

By Operation Mode:

  • Continuous Wave
  • Pulsed

Fiber Laser Market Share, By Region:

  • North America
    • US
    • Canada
    • Mexico
  • Europe
    • UK
    • Germany
    • France
    • Rest of Europe
  • Asia Pacific
    • China
    • Japan
    • South Korea
    • India
    • Rest of Asia Pacific
  • RoW
    • South America
    • Middle East
    • Africa

Recent Developments in  Fiber Laser Industry

  • In May 2024, IPG Photonics Corporation (US) launched the LightWELD 2000 XR, a 2 kW handheld laser welding and cleaning system that increases processing speeds and handles thicker materials. It enhances fabrication productivity and efficiency with improved presets and compatibility with the LightWELD Cobot System.
  • In June 2023, Coherent Corp. (US) launched the HighLight FL-ARM fiber lasers, which features adjustable ring mode beams for improved welding process stability over large areas, which is ideal for electric vehicle battery manufacturing.
  • In October 2022, Wuhan Raycus Fiber Laser Technologies Co., Ltd. (China) launched R- series for industrial applications such as automobile manufacturing, shipbuilding, aerospace, and new energy battery welding.

Frequently Asked Questions:

To speak to our analyst for a discussion on the above findings, click Speak to Analyst

TABLE OF CONTENTS
 
1 INTRODUCTION (Page No. - 21)
    1.1 STUDY OBJECTIVES 
    1.2 MARKET DEFINITION 
    1.3 STUDY SCOPE 
           1.3.1 INCLUSIONS AND EXCLUSIONS
           1.3.2 MARKETS COVERED
           1.3.3 YEARS CONSIDERED
    1.4 CURRENCY CONSIDERED 
    1.5 UNITS CONSIDERED 
    1.6 STAKEHOLDERS 
 
2 RESEARCH METHODOLOGY (Page No. - 24)
    2.1 RESEARCH DATA 
           2.1.1 SECONDARY DATA
                    2.1.1.1 List of major secondary sources
                    2.1.1.2 Key data from secondary sources
           2.1.2 PRIMARY DATA
                    2.1.2.1 Breakdown of primaries
                    2.1.2.2 List of primary interview participants
                    2.1.2.3 Key industry insights
                    2.1.2.4 Key data from primary sources
           2.1.3 SECONDARY AND PRIMARY RESEARCH
    2.2 MARKET SIZE ESTIMATION METHODOLOGY 
           2.2.1 BOTTOM-UP APPROACH
                    2.2.1.1 Approach to estimate market size using bottom-up analysis (demand side)
           2.2.2 TOP-DOWN APPROACH
                    2.2.2.1 Approach to estimate market size using top-down analysis (supply side)
    2.3 DATA TRIANGULATION 
    2.4 RESEARCH ASSUMPTIONS 
    2.5 RESEARCH LIMITATIONS 
    2.6 RISK ASSESSMENT 
 
3 EXECUTIVE SUMMARY (Page No. - 34)
 
4 PREMIUM INSIGHTS (Page No. - 38)
    4.1 ATTRACTIVE OPPORTUNITIES FOR PLAYERS IN FIBER LASER MARKET 
    4.2 FIBER LASER MARKET, BY OUTPUT POWER 
    4.3 MARKET, BY TYPE 
    4.4 FMARKET, BY END-USE INDUSTRY 
    4.5 FMARKET, BY REGION 
 
5 MARKET OVERVIEW (Page No. - 41)
    5.1 INTRODUCTION 
    5.2 MARKET DYNAMICS 
           5.2.1 DRIVERS
                    5.2.1.1 Increasing automation in manufacturing and material processing industries
                    5.2.1.2 High energy efficiency, low maintenance, and long lifespan of fiber lasers
                    5.2.1.3 Growing demand in medical & healthcare industry
                    5.2.1.4 Rising adoption of fiber lasers in consumer electronics
                    5.2.1.5 Expansion of 3D printing and additive manufacturing
           5.2.2 RESTRAINTS
                    5.2.2.1 High deployment cost
                    5.2.2.2 Reduced cutting speed for thicker materials
           5.2.3 OPPORTUNITIES
                    5.2.3.1 Growing use of advanced ultraviolet fiber lasers
                    5.2.3.2 Increasing use in thin sheet cutting and micro machining
                    5.2.3.3 High demand in micro drilling and surface cleaning applications
           5.2.4 CHALLENGES
                    5.2.4.1 Competition from alternative technologies
                    5.2.4.2 Safety concerns and compliance issues
                    5.2.4.3 Shortage of skilled professionals
    5.3 SUPPLY CHAIN ANALYSIS 
    5.4 ECOSYSTEM ANALYSIS 
    5.5 INVESTMENT AND FUNDING SCENARIO 
    5.6 TRENDS/DISRUPTIONS IMPACTING CUSTOMERS' BUSINESSES 
    5.7 TECHNOLOGY ANALYSIS 
           5.7.1 KEY TECHNOLOGIES
                    5.7.1.1 Adjustable mode beam lasers
                    5.7.1.2 Additive manufacturing locus beam control
           5.7.2 COMPLEMENTARY TECHNOLOGIES
                    5.7.2.1 LiDAR
           5.7.3 ADJACENT TECHNOLOGIES
                    5.7.3.1 Quantum cascade lasers
    5.8 PORTER'S FIVE FORCES ANALYSIS 
           5.8.1 THREAT OF NEW ENTRANTS
           5.8.2 THREAT OF SUBSTITUTES
           5.8.3 BARGAINING POWER OF SUPPLIERS
           5.8.4 BARGAINING POWER OF BUYERS
           5.8.5 INTENSITY OF COMPETITIVE RIVALRY
    5.9 KEY STAKEHOLDERS AND BUYING CRITERIA 
           5.9.1 KEY STAKEHOLDERS IN BUYING PROCESS
           5.9.2 BUYING CRITERIA
    5.10 CASE STUDY ANALYSIS 
           5.10.1 SHIM SHACK TRANSFORMED ITS SHOP WITH LASERCUBE FLATBED LASER CUTTING SYSTEM
           5.10.2 MµSHIELD IMPROVED EFFICIENCY AND COST WITH LASERCUBE
           5.10.3 LASER INDONESIA PIONEERS LASER CLADDING IN INDONESIA WITH COHERENT'S SUPPORT
           5.10.4 TEAMTECHNIK ENHANCED WELDING PRECISION WITH COHERENT FIBER LASER
           5.10.5 EUROSTEEL ENHANCED MANUFACTURING PRECISION WITH CY-LASER'S FIBER LASER TECHNOLOGY
    5.11 TRADE ANALYSIS 
           5.11.1 IMPORT DATA
           5.11.2 EXPORT DATA
    5.12 PATENT ANALYSIS 
    5.13 KEY CONFERENCES AND EVENTS 
    5.14 REGULATORY LANDSCAPE AND STANDARDS 
           5.14.1 REGULATORY BODIES, GOVERNMENT AGENCIES, AND OTHER ORGANIZATIONS
           5.14.2 STANDARDS
                    5.14.2.1 IEC 60825-1:2014
                    5.14.2.2 ANSI Z136.1
                    5.14.2.3 Federal Laser Product Performance Standard (FLPPS)
                    5.14.2.4 International Commission on Non-Ionizing Radiation Protection (ICNIRP)
                    5.14.2.5 EN 60825 – Safety of Laser Products
                    5.14.2.6 FDA Standards
    5.15 IMPACT OF AI: FIBER LASER MARKET 
           5.15.1 AI USE CASES IN FIBER LASER MARKET
           5.15.2 BEST PRACTICES: WHO IS IMPLEMENTING ABOVE USE CASES
           5.15.3 INTERCONNECT ADJACENT ECOSYSTEM
                    5.15.3.1 Impact on laser processing market
    5.16 PRICING ANALYSIS 
           5.16.1 AVERAGE SELLING PRICE OF FIBER LASERS
           5.16.2 AVERAGE SELLING PRICE OF LASERS OFFERED BY KEY PLAYERS, BY OUTPUT POWER
           5.16.3 AVERAGE SELLING PRICE OF FIBER LASERS, BY REGION
 
6 APPLICATIONS OF FIBER LASER (Page No. - 81)
    6.1 INTRODUCTION 
    6.2 LASER PROCESSING 
           6.2.1 MACRO PROCESSING
                    6.2.1.1 Cutting
                    6.2.1.2 Drilling
                    6.2.1.3 Welding
                    6.2.1.4 Marking and engraving
           6.2.2 MICRO PROCESSING
           6.2.3 ADVANCED APPLICATIONS
    6.3 OPTICAL COMMUNICATION 
    6.4 OPTOELECTRONICS 
    6.5 OTHER APPLICATIONS 
 
7 FIBER LASER MARKET, BY TYPE (Page No. - 87)
    7.1 INTRODUCTION 
    7.2 INFRARED 
    7.3 ULTRAFAST 
    7.4 ULTRAVIOLET 
    7.5 VISIBLE 
 
8 FIBER LASER MARKET, BY OUTPUT POWER (Page No. - 96)
    8.1 INTRODUCTION 
    8.2 LOW 
           8.2.1 OFFERS HIGH PRECISION AND VERSATILITY IN MARKING, ENGRAVING, AND MICRO-MACHINING ACROSS ELECTRONICS
    8.3 MEDIUM 
           8.3.1 DELIVER HIGH PRECISION AND PERFORMANCE ACROSS VARIOUS INDUSTRIES
    8.4 HIGH 
           8.4.1 ENHANCES PRODUCTIVITY AND EFFICIENCY BY ENABLING PRECISE CUTTING, WELDING, AND DRILLING OF THICK AND TOUGH MATERIALS
 
9 FIBER LASER MARKET, BY OPERATION MODE (Page No. - 101)
    9.1 INTRODUCTION 
    9.2 CONTINUOUS WAVE 
    9.3 PULSED 
 
10 FIBER LASER MARKET, BY END-USE INDUSTRY (Page No. - 107)
     10.1 INTRODUCTION 
     10.2 TELECOMMUNICATIONS 
             10.2.1 GROWING ADOPTION IN FIBER OPTIC COMMUNICATION TO BOOST DEMAND
     10.3 INDUSTRIAL 
             10.3.1 INTEGRATION OF LASER SYSTEMS IN MANUFACTURING TO OFFER LUCRATIVE GROWTH OPPORTUNITIES
     10.4 SEMICONDUCTOR & ELECTRONICS 
             10.4.1 INCREASING USE IN MANUFACTURING MINIATURIZED SEMICONDUCTOR COMPONENTS TO BOOST DEMAND
     10.5 COMMERCIAL 
             10.5.1 OFFERS ENHANCE PRODUCTIVITY AND QUALITY ACROSS MULTIPLE APPLICATIONS
     10.6 AEROSPACE 
             10.6.1 INCREASED ADOPTION FOR MACHINING AIRCRAFT PARTS TO ACCELERATE MARKET GROWTH
     10.7 AUTOMOTIVE 
             10.7.1 RISING DEMAND FOR SEAM WELDING AND HIGH-STRENGTH STEEL CUTTING IN AUTOMOTIVE INDUSTRY TO DRIVE GROWTH
     10.8 MEDICAL 
             10.8.1 INCREASING APPLICATION IN SURGICAL PROCEDURES TO DRIVE DEMAND
     10.9 RESEARCH 
             10.9.1 GROWING APPLICATION IN SPECTROSCOPY TO DRIVE MARKET
     10.10 OTHER END-USE INDUSTRIES 
 
11 FIBER LASER MARKET, BY REGION (Page No. - 122)
     11.1 INTRODUCTION 
     11.2 NORTH AMERICA 
             11.2.1 MACROECONOMIC OUTLOOK IN NORTH AMERICA
             11.2.2 US
                        11.2.2.1 Growing demand for miniature laser processing devices in healthcare sector to drive market
             11.2.3 CANADA
                        11.2.3.1 Government-led initiatives to develop, produce, and sell EVs to boost demand
             11.2.4 MEXICO
                        11.2.4.1 Rising adoption in automobile, aerospace, and electronics to accelerate demand
     11.3 EUROPE 
             11.3.1 MACROECONOMIC OUTLOOK IN EUROPE
             11.3.2 GERMANY
                        11.3.2.1 Rising use in minimally invasive surgical procedures to drive market
             11.3.3 FRANCE
                        11.3.3.1 Increasing demand in automotive, telecommunications, and healthcare industries to fuel growth
             11.3.4 UK
                        11.3.4.1 Rising emphasis on reducing greenhouse gas emissions to fuel market growth
             11.3.5 REST OF EUROPE
     11.4 ASIA PACIFIC 
             11.4.1 MACROECONOMIC OUTLOOK IN ASIA PACIFIC
             11.4.2 CHINA
                        11.4.2.1 Growing use in semiconductor chip manufacturing processes to propel market growth
             11.4.3 JAPAN
                        11.4.3.1 Presence of prominent automobile and electronic companies to drive market
             11.4.4 INDIA
                        11.4.4.1 Government-led projects to boost domestic manufacturing to fuel market growth
             11.4.5 SOUTH KOREA
                        11.4.5.1 Consumer electronics and automotive industries to offer lucrative growth opportunities for market players
             11.4.6 REST OF ASIA PACIFIC
     11.5 ROW 
             11.5.1 MACROECONOMIC OUTLOOK IN ROW
             11.5.2 SOUTH AMERICA
                        11.5.2.1 Investments in laser technology and infrastructure to drive market
             11.5.3 MIDDLE EAST
                        11.5.3.1 Growing demand for electric vehicles to drive market
             11.5.4 AFRICA
                        11.5.4.1 Increasing use of EVs to offer lucrative growth opportunities for market players
 
12 COMPETITIVE LANDSCAPE (Page No. - 149)
     12.1 OVERVIEW 
     12.2 KEY PLAYER STRATEGIES/RIGHT TO WIN 
     12.3 REVENUE ANALYSIS 
     12.4 MARKET SHARE ANALYSIS 
     12.5 COMPANY VALUATION AND FINANCIAL METRICS 
     12.6 BRAND/PRODUCT COMPARISON 
     12.7 COMPANY EVALUATION MATRIX: KEY PLAYERS 
             12.7.1 STARS
             12.7.2 EMERGING LEADERS
             12.7.3 PERVASIVE PLAYERS
             12.7.4 PARTICIPANTS
             12.7.5 COMPANY FOOTPRINT: KEY PLAYERS, 2023
                        12.7.5.1 Overall company footprint
                        12.7.5.2 Output power footprint
                        12.7.5.3 Operation mode footprint
                        12.7.5.4 End-use industry footprint
                        12.7.5.5 Region footprint
     12.8 COMPANY EVALUATION MATRIX: STARTUPS/SMES 
             12.8.1 PROGRESSIVE COMPANIES
             12.8.2 RESPONSIVE COMPANIES
             12.8.3 DYNAMIC COMPANIES
             12.8.4 STARTING BLOCKS
             12.8.5 COMPETITIVE BENCHMARKING: STARTUPS/SMES, 2023
                        12.8.5.1 List of key startups/SMEs
                        12.8.5.2 Competitive benchmarking of key startups/SMEs
     12.9 COMPETITIVE SCENARIO AND TRENDS 
             12.9.1 PRODUCT LAUNCHES
             12.9.2 DEALS
             12.9.3 EXPANSIONS
             12.9.4 OTHERS
 
13 COMPANY PROFILES (Page No. - 173)
     13.1 KEY PLAYERS 
             13.1.1 IPG PHOTONICS CORPORATION
                        13.1.1.1 Business overview
                        13.1.1.2 Products/Solutions/Services offered
                        13.1.1.3 Recent developments
                                     13.1.1.3.1 Product launches
                                     13.1.1.3.2 Deals
                        13.1.1.4 MnM view
                                     13.1.1.4.1 Right to win
                                     13.1.1.4.2 Strategic choices
                                     13.1.1.4.3 Weaknesses and competitive threats
             13.1.2 TRUMPF
                        13.1.2.1 Business overview
                        13.1.2.2 Products/Solutions/Services offered
                        13.1.2.3 Recent developments
                                     13.1.2.3.1 Product launches
                        13.1.2.4 MnM view
                                     13.1.2.4.1 Right to win
                                     13.1.2.4.2 Strategic choices
                                     13.1.2.4.3 Weaknesses and competitive threats
             13.1.3 HAN'S LASER TECHNOLOGY INDUSTRY GROUP CO., LTD.
                        13.1.3.1 Business overview
                        13.1.3.2 Products/Solutions/Services offered
                        13.1.3.3 Recent developments
                                     13.1.3.3.1 Product launches
                                     13.1.3.3.2 Deals
 
                        13.1.3.4 MnM view
                                     13.1.3.4.1 Right to win
                                     13.1.3.4.2 Strategic choices
                                     13.1.3.4.3 Weaknesses and competitive threats
             13.1.4 COHERENT CORP.
                        13.1.4.1 Business overview
                        13.1.4.2 Products/Solutions/Services offered
                        13.1.4.3 Recent developments
                                     13.1.4.3.1 Product launches
                        13.1.4.4 MnM view
                                     13.1.4.4.1 Right to win
                                     13.1.4.4.2 Strategic choices
                                     13.1.4.4.3 Weaknesses and competitive threats
             13.1.5 WUHAN RAYCUS FIBER LASER TECHNOLOGIES CO., LTD.
                        13.1.5.1 Business overview
                        13.1.5.2 Products/Solutions/Services offered
                        13.1.5.3 Recent developments
                                     13.1.5.3.1 Product launches
                                     13.1.5.3.2 Deals
                        13.1.5.4 MnM View
                                     13.1.5.4.1 Right to win
                                     13.1.5.4.2 Strategic choices
                                     13.1.5.4.3 Weaknesses and competitive threats
             13.1.6 FUJIKURA LTD.
                        13.1.6.1 Business overview
                        13.1.6.2 Products/Solutions/Services offered
             13.1.7 600 GROUP PLC
                        13.1.7.1 Business overview
                        13.1.7.2 Products/Solutions/Services offered
             13.1.8 BYSTRONIC GROUP
                        13.1.8.1 Business overview
                        13.1.8.2 Products/Solutions/Services offered
                        13.1.8.3 Recent developments
                                     13.1.8.3.1 Product launches
                                     13.1.8.3.2 Expansions
             13.1.9 EPILOG LASER
                        13.1.9.1 Business overview
                        13.1.9.2 Products/Solutions/Services offered
                        13.1.9.3 Recent developments
                                     13.1.9.3.1 Product launches
                                     13.1.9.3.2 Expansions
             13.1.10 FANUC CORPORATION
                        13.1.10.1 Business overview
                        13.1.10.2 Products/Solutions/Services offered
             13.1.11 FURUKAWA ELECTRIC CO., LTD.
                        13.1.11.1 Business overview
                        13.1.11.2 Products/Solutions/Services offered
             13.1.12 JENOPTIK AG
                        13.1.12.1 Business overview
                        13.1.12.2 Products/Solutions/Services offered
                        13.1.12.3 Recent developments
                                     13.1.12.3.1 Product launches
                                     13.1.12.3.2 Deals
                                     13.1.12.3.3 Expansions
             13.1.13 LUMENTUM OPERATIONS LLC
                        13.1.13.1 Business overview
                        13.1.13.2 Products/Solutions/Services offered
                        13.1.13.3 Recent developments
                                     13.1.13.3.1 Expansions
             13.1.14 LUMIBIRD
                        13.1.14.1 Business overview
                        13.1.14.2 Products/Solutions/Services offered
                        13.1.14.3 Recent developments
                                     13.1.14.3.1 Product launches
                                     13.1.14.3.2 Deals
             13.1.15 NEWPORT CORPORATION
                        13.1.15.1 Business overview
                        13.1.15.2 Products/Solutions/Services offered
                        13.1.15.3 Recent developments
                                     13.1.15.3.1 Product launches
             13.1.16 NLIGHT, INC.
                        13.1.16.1 Business overview
                        13.1.16.2 Products/Solutions/Services offered
                        13.1.16.3 Recent developments
                                     13.1.16.3.1 Product launches
                                     13.1.16.3.2 Deals
                                     13.1.16.3.3 Others
     13.2 OTHER PLAYERS 
             13.2.1 AMONICS LTD.
             13.2.2 APOLLO INSTRUMENTS INC.
             13.2.3 CY-LASER SRL
             13.2.4 EKSPLA
             13.2.5 LAGUNA TOOLS
             13.2.6 LASERSTAR TECHNOLOGIES CORPORATION
             13.2.7 MAXPHOTONICS CO., LTD.
             13.2.8 NKT PHOTONICS A/S
             13.2.9 TOPTICA PHOTONICS AG
 
14 ADJACENT & RELATED MARKETS (Page No. - 231)
     14.1 INTRODUCTION 
     14.2 LASER TECHNOLOGY MARKET, BY LASER TYPE 
             14.2.1 INTRODUCTION
             14.2.2 SOLID LASERS
             14.2.3 LIQUID LASERS
             14.2.4 GAS LASERS
             14.2.5 OTHER LASER TYPES
 
15 APPENDIX (Page No. - 240)
     15.1 DISCUSSION GUIDE 
     15.2 KNOWLEDGESTORE: MARKETSANDMARKETS’ SUBSCRIPTION PORTAL 
     15.3 CUSTOMIZATION OPTIONS 
     15.4 RELATED REPORTS 
     15.5 AUTHOR DETAILS 
 
LIST OF TABLES (176 TABLES)
 
TABLE 1 FIBER LASER MARKET: ROLE OF PLAYERS IN ECOSYSTEM
TABLE 2 MARKET: PORTER'S FIVE FORCES ANALYSIS
TABLE 3 INFLUENCE OF STAKEHOLDERS ON BUYING PROCESS, BY END-USE INDUSTRY (%)
TABLE 4 KEY BUYING CRITERIA FOR TOP THREE END-USE INDUSTRIES
TABLE 5 LIST OF MAJOR PATENTS APPLIED/GRANTED, 2021–2024
TABLE 6 MARKET: LIST OF KEY CONFERENCES AND EVENTS, 2024–2025
TABLE 7 NORTH AMERICA: LIST OF REGULATORY BODIES, GOVERNMENT AGENCIES, AND OTHER ORGANIZATIONS
TABLE 8 EUROPE: LIST OF REGULATORY BODIES, GOVERNMENT AGENCIES, AND OTHER ORGANIZATIONS
TABLE 9 ASIA PACIFIC: LIST OF REGULATORY BODIES, GOVERNMENT AGENCIES, AND OTHER ORGANIZATIONS
TABLE 10 ROW: LIST OF REGULATORY BODIES, GOVERNMENT AGENCIES, AND OTHER ORGANIZATIONS
TABLE 11 FIBER LASER MARKET, BY TYPE, 2020–2023 (USD MILLION)
TABLE 12 MARKET, BY TYPE, 2024–2029 (USD MILLION)
TABLE 13 INFRARED: MARKET, BY OPERATION MODE, 2020–2023 (USD MILLION)
TABLE 14 INFRARED: MARKET, BY OPERATION MODE, 2024–2029 (USD MILLION)
TABLE 15 INFRARED: MARKET, BY REGION, 2020–2023 (USD MILLION)
TABLE 16 INFRARED: MARKET, BY REGION, 2024–2029 (USD MILLION)
TABLE 17 ULTRAFAST: MARKET, BY OPERATION MODE, 2020–2023 (USD MILLION)
TABLE 18 ULTRAFAST: MARKET, BY OPERATION MODE, 2024–2029 (USD MILLION)
TABLE 19 ULTRAFAST: MARKET, BY REGION, 2020–2023 (USD MILLION)
TABLE 20 ULTRAFAST: MARKET, BY REGION, 2024–2029 (USD MILLION)
TABLE 21 ULTRAVIOLET: MARKET, BY OPERATION MODE, 2020–2023 (USD MILLION)
TABLE 22 ULTRAVIOLET: MARKET, BY OPERATION MODE, 2024–2029 (USD MILLION)
TABLE 23 ULTRAVIOLET: MARKET, BY REGION, 2020–2023 (USD MILLION)
TABLE 24 ULTRAVIOLET: MARKET, BY REGION, 2024–2029 (USD MILLION)
TABLE 25 VISIBLE:  MARKET, BY OPERATION MODE, 2020–2023 (USD MILLION)
TABLE 26 VISIBLE: MARKET, BY OPERATION MODE, 2024–2029 (USD MILLION)
TABLE 27 VISIBLE: MARKET, BY REGION, 2020–2023 (USD MILLION)
TABLE 28 VISIBLE: MARKET, BY REGION, 2024–2029 (USD MILLION)
TABLE 29 FIBER LASER MARKET, BY OUTPUT POWER, 2020–2023 (USD MILLION)
TABLE 30 MARKET, BY OUTPUT POWER, 2024–2029 (USD MILLION)
TABLE 31 MARKET, BY OPERATION MODE, 2020–2023 (USD MILLION)
TABLE 32 MARKET, BY OPERATION MODE, 2024–2029 (USD MILLION)
TABLE 33 CONTINUOUS WAVE: FIBER LASER MARKET, BY TYPE, 2020–2023 (USD MILLION)
TABLE 34 CONTINUOUS WAVE: MARKET, BY TYPE, 2024–2029 (USD MILLION)
TABLE 35 CONTINUOUS WAVE: MARKET, BY REGION, 2020–2023 (USD MILLION)
TABLE 36 CONTINUOUS WAVE: MARKET, BY REGION, 2024–2029 (USD MILLION)
TABLE 37 PULSED: FIBER LASER MARKET, BY TYPE, 2020–2023 (USD MILLION)
TABLE 38 PULSED: MARKET, BY TYPE, 2024–2029 (USD MILLION)
TABLE 39 PULSED: MARKET, BY REGION, 2020–2023 (USD MILLION)
TABLE 40 PULSED: MARKET, BY REGION, 2024–2029 (USD MILLION)
TABLE 41 MARKET, BY END-USE INDUSTRY, 2020–2023 (USD MILLION)
TABLE 42 MARKET, BY END-USE INDUSTRY, 2024–2029 (USD MILLION)
TABLE 43 TELECOMMUNICATIONS: MARKET, BY REGION, 2020–2023 (USD MILLION)
TABLE 44 TELECOMMUNICATIONS: ARKET, BY REGION, 2024–2029 (USD MILLION)
TABLE 45 INDUSTRIAL: MARKET, BY REGION, 2020–2023 (USD MILLION)
TABLE 46 INDUSTRIAL: MARKET, BY REGION, 2024–2029 (USD MILLION)
TABLE 47 SEMICONDUCTOR & ELECTRONICS: MARKET, BY REGION, 2020–2023 (USD MILLION)
TABLE 48 SEMICONDUCTOR & ELECTRONICS:MARKET, BY REGION, 2024–2029 (USD MILLION)
TABLE 49 COMMERCIAL: MARKET, BY REGION, 2020–2023 (USD MILLION)
TABLE 50 COMMERCIAL: MARKET, BY REGION, 2024–2029 (USD MILLION)
TABLE 51 AEROSPACE: MARKET, BY REGION, 2020–2023 (USD MILLION)
TABLE 52 AEROSPACE: MARKET, BY REGION, 2024–2029 (USD MILLION)
TABLE 53 AUTOMOTIVE: MARKET, BY REGION, 2020–2023 (USD MILLION)
TABLE 54 AUTOMOTIVE:MARKET, BY REGION, 2024–2029 (USD MILLION)
TABLE 55 MEDICAL: MARKET, BY REGION, 2020–2023 (USD MILLION)
TABLE 56 MEDICAL: MARKET, BY REGION, 2024–2029 (USD MILLION)
TABLE 57 RESEARCH: MARKET, BY REGION, 2020–2023 (USD MILLION)
TABLE 58 RESEARCH: MARKET, BY REGION, 2024–2029 (USD MILLION)
TABLE 59 OTHER END-USE INDUSTRIES: MARKET, BY REGION, 2020–2023 (USD MILLION)
TABLE 60 OTHER END-USE INDUSTRIES: MARKET, BY REGION, 2024–2029 (USD MILLION)
TABLE 61 MARKET, BY REGION, 2020–2023 (USD MILLION)
TABLE 62 MARKET, BY REGION, 2024–2029 (USD MILLION)
TABLE 63 MARKET, BY REGION, 2020–2023 (THOUSAND UNITS)
TABLE 64 MARKET, BY REGION, 2024–2029 (THOUSAND UNITS)
TABLE 65 NORTH AMERICA: MARKET, BY COUNTRY, 2020–2023 (USD MILLION)
TABLE 66 NORTH AMERICA: FIBER LASER MARKET, BY COUNTRY, 2024–2029 (USD MILLION)
TABLE 67 NORTH AMERICA: MARKET, BY TYPE, 2020–2023 (USD MILLION)
TABLE 68 NORTH AMERICA: MARKET, BY TYPE, 2024–2029 (USD MILLION)
TABLE 69 NORTH AMERICA: MARKET, BY OPERATION MODE, 2020–2023 (USD MILLION)
TABLE 70 NORTH AMERICA: MARKET, BY OPERATION MODE, 2024–2029 (USD MILLION)
TABLE 71 NORTH AMERICA: FIBER LASER MARKET, BY END-USE INDUSTRY, 2020–2023 (USD MILLION)
TABLE 72 NORTH AMERICA:  MARKET, BY END-USE INDUSTRY, 2024–2029 (USD MILLION)
TABLE 73 EUROPE:  MARKET, BY COUNTRY, 2020–2023 (USD MILLION)
TABLE 74 EUROPE: MARKET, BY COUNTRY, 2024–2029 (USD MILLION)
TABLE 75 EUROPE: MARKET, BY TYPE, 2020–2023 (USD MILLION)
TABLE 76 EUROPE: MARKET, BY TYPE, 2024–2029 (USD MILLION)
TABLE 77 EUROPE:  MARKET, BY OPERATION MODE, 2020–2023 (USD MILLION)
TABLE 78 EUROPE: FIBER LASERMARKET, BY OPERATION MODE, 2024–2029 (USD MILLION)
TABLE 79 EUROPE:  MARKET, BY END-USE INDUSTRY, 2020–2023 (USD MILLION)
TABLE 80 EUROPE: FIBER LASER MARKET, BY END-USE INDUSTRY, 2024–2029 (USD MILLION)
TABLE 81 ASIA PACIFIC:MARKET, BY COUNTRY, 2020–2023 (USD MILLION)
TABLE 82 ASIA PACIFIC: MARKET, BY COUNTRY, 2024–2029 (USD MILLION)
TABLE 83 ASIA PACIFIC: MARKET, BY TYPE, 2020–2023 (USD MILLION)
TABLE 84 ASIA PACIFIC: MARKET, BY TYPE, 2024–2029 (USD MILLION)
TABLE 85 ASIA PACIFIC: FMARKET, BY OPERATION MODE, 2020–2023 (USD MILLION)
TABLE 86 ASIA PACIFIC: MARKET, BY OPERATION MODE, 2024–2029 (USD MILLION)
TABLE 87 ASIA PACIFIC: MARKET, BY END-USE INDUSTRY, 2020–2023 (USD MILLION)
TABLE 88 ASIA PACIFIC:  MARKET, BY END-USE INDUSTRY, 2024–2029 (USD MILLION)
TABLE 89 ROW: MARKET, BY REGION, 2020–2023 (USD MILLION)
TABLE 90 ROW: MARKET, BY REGION, 2024–2029 (USD MILLION)
TABLE 91 ROW: MARKET, BY TYPE, 2020–2023 (USD MILLION)
TABLE 92 ROW: MARKET, BY TYPE, 2024–2029 (USD MILLION)
TABLE 93 ROW: MARKET, BY OPERATION MODE, 2020–2023 (USD MILLION)
TABLE 94 ROW: MARKET, BY OPERATION MODE, 2024–2029 (USD MILLION)
TABLE 95 ROW: MARKET, BY END-USE INDUSTRY, 2020–2023 (USD MILLION)
TABLE 96 ROW: MARKET, BY END-USE INDUSTRY, 2024–2029 (USD MILLION)
TABLE 97 MIDDLE EAST: MARKET, BY REGION, 2020–2023 (USD MILLION)
TABLE 98 MIDDLE EAST:  MARKET, BY REGION, 2024–2029 (USD MILLION)
TABLE 99 OVERVIEW OF STRATEGIES ADOPTED BY KEY PLAYERS, 2020–2024
TABLE 100 FIBER LASER MARKET: DEGREE OF COMPETITION, 2023
TABLE 101 MARKET: OUTPUT POWER FOOTPRINT
TABLE 102 MARKET: OPERATION MODE FOOTPRINT
TABLE 103 MARKET: END-USE INDUSTRY FOOTPRINT
TABLE 104 MARKET: REGION FOOTPRINT
TABLE 105 FIBER LASER MARKET: LIST OF KEY STARTUPS/SMES
TABLE 106 MARKET: COMPETITIVE BENCHMARKING OF KEY STARTUPS/SMES
TABLE 107 MARKET: PRODUCT LAUNCHES, JANUARY 2020–JUNE 2024
TABLE 108 MARKET: DEALS, JANUARY 2020–JUNE 2024
TABLE 109 MARKET: EXPANSIONS, JANUARY 2020–JUNE 2024
TABLE 110 MARKET: OTHERS, JANUARY 2020–JUNE 2024
TABLE 111 IPG PHOTONICS CORPORATION: COMPANY OVERVIEW
TABLE 112 IPG PHOTONICS CORPORATION: PRODUCTS/SOLUTIONS/SERVICES OFFERED
TABLE 113 IPG PHOTONICS CORPORATION: PRODUCT LAUNCHES
TABLE 114 IPG PHOTONICS CORPORATION: DEALS
TABLE 115 TRUMPF: COMPANY OVERVIEW
TABLE 116 TRUMPF: PRODUCTS/SOLUTIONS/SERVICES OFFERED
TABLE 117 TRUMPF: PRODUCT LAUNCHES
TABLE 118 HAN'S LASER TECHNOLOGY INDUSTRY GROUP CO., LTD.: COMPANY OVERVIEW
TABLE 119 HAN'S LASER TECHNOLOGY INDUSTRY GROUP CO., LTD.: PRODUCTS/SOLUTIONS/SERVICES OFFERED
TABLE 120 HAN'S LASER TECHNOLOGY INDUSTRY GROUP CO., LTD.: PRODUCT LAUNCHES
TABLE 121 HAN'S LASER TECHNOLOGY INDUSTRY GROUP CO., LTD.: DEALS
TABLE 122 COHERENT CORP.: COMPANY OVERVIEW
TABLE 123 COHERENT CORP.: PRODUCTS/SOLUTIONS/SERVICES OFFERED
TABLE 124 COHERENT CORP.: PRODUCT LAUNCHES
TABLE 125 WUHAN RAYCUS FIBER LASER TECHNOLOGIES CO., LTD.: COMPANY OVERVIEW
TABLE 126 WUHAN RAYCUS FIBER LASER TECHNOLOGIES CO., LTD.: PRODUCTS/SOLUTIONS/SERVICES OFFERED
TABLE 127 WUHAN RAYCUS FIBER LASER TECHNOLOGIES CO., LTD.: PRODUCT LAUNCHES
TABLE 128 WUHAN RAYCUS FIBER LASER TECHNOLOGIES CO., LTD.: DEALS
TABLE 129 FUJIKURA LTD.: COMPANY OVERVIEW
TABLE 130 FUJIKURA LTD.: PRODUCTS/SOLUTIONS/SERVICES OFFERED
TABLE 131 600 GROUP PLC: COMPANY OVERVIEW
TABLE 132 600 GROUP PLC: PRODUCTS/SOLUTIONS/SERVICES OFFERED
TABLE 133 BYSTRONIC GROUP: COMPANY OVERVIEW
TABLE 134 BYSTRONIC GROUP: PRODUCT/SOLUTIONS/SERVICES OFFERED
TABLE 135 BYSTRONIC GROUP: PRODUCT LAUNCHES
TABLE 136 BYSTRONIC GROUP: EXPANSIONS
TABLE 137 EPILOG LASER: COMPANY OVERVIEW
TABLE 138 EPILOG LASER: PRODUCTS/SOLUTIONS/SERVICES OFFERED
TABLE 139 EPILOG LASER: PRODUCT LAUNCHES
TABLE 140 EPILOG LASER: EXPANSIONS
TABLE 141 FANUC CORPORATION: COMPANY OVERVIEW
TABLE 142 FANUC CORPORATION: PRODUCTS/SOLUTIONS/SERVICES OFFERED
TABLE 143 FURUKAWA ELECTRIC CO., LTD.: COMPANY OVERVIEW
TABLE 144 FURUKAWA ELECTRIC CO., LTD.: PRODUCTS/SOLUTIONS/SERVICES OFFERED
TABLE 145 JENOPTIK AG: COMPANY OVERVIEW
TABLE 146 JENOPTIK AG: PRODUCTS/SOLUTIONS/SERVICES OFFERED
TABLE 147 JENOPTIK AG: PRODUCT LAUNCHES
TABLE 148 JENOPTIK AG: DEALS
TABLE 149 JENOPTIK AG: EXPANSIONS
TABLE 150 LUMENTUM OPERATIONS LLC: COMPANY OVERVIEW
TABLE 151 LUMENTUM OPERATIONS LLC: PRODUCTS/SOLUTIONS/SERVICES OFFERED
TABLE 152 LUMENTUM OPERATION LLC: EXPANSIONS
TABLE 153 LUMIBIRD: COMPANY OVERVIEW
TABLE 154 LUMIBIRD: PRODUCTS/SOLUTIONS/SERVICES OFFERED
TABLE 155 LUMIBIRD: PRODUCT LAUNCHES
TABLE 156 LUMIBIRD: DEALS
TABLE 157 NEWPORT CORPORATION: COMPANY OVERVIEW
TABLE 158 NEWPORT CORPORATION: PRODUCTS/SOLUTIONS/SERVICES OFFERED
TABLE 159 NEWPORT CORPORATION: PRODUCT LAUNCHES
TABLE 160 NLIGHT, INC.: COMPANY OVERVIEW
TABLE 161 NLIGHT, INC.: PRODUCTS/SOLUTIONS/SERVICES OFFERED
TABLE 162 NLIGHT, INC.: PRODUCT LAUNCHES
TABLE 163 NLIGHT, INC.: DEALS
TABLE 164 NLIGHT, INC.: OTHERS
TABLE 165 LASER TECHNOLOGY MARKET, BY LASER TYPE, 2020–2023 (USD MILLION)
TABLE 166 LASER TECHNOLOGY MARKET, BY LASER TYPE, 2024–2029 (USD MILLION)
TABLE 167 SOLID LASERS: LASER TECHNOLOGY MARKET, BY REGION, 2020–2023 (USD MILLION)
TABLE 168 SOLID LASERS: LASER TECHNOLOGY MARKET, BY REGION, 2024–2029 (USD MILLION)
TABLE 169 LIQUID LASERS: LASER TECHNOLOGY MARKET, BY REGION, 2020–2023 (USD MILLION)
TABLE 170 LIQUID LASERS: LASER TECHNOLOGY MARKET, BY REGION, 2024–2029 (USD MILLION)
TABLE 171 GAS LASERS: LASER TECHNOLOGY MARKET, BY REGION, 2020–2023 (USD MILLION)
TABLE 172 GAS LASERS: LASER TECHNOLOGY MARKET, BY REGION, 2024–2029 (USD MILLION)
TABLE 173 GAS LASERS: LASER TECHNOLOGY MARKET, BY TYPE, 2020–2023 (USD MILLION)
TABLE 174 GAS LASERS: LASER TECHNOLOGY MARKET, BY TYPE, 2024–2029 (USD MILLION)
TABLE 175 OTHER LASER TYPES: LASER TECHNOLOGY MARKET, BY REGION, 2020–2023 (USD MILLION)
TABLE 176 OTHER LASER TYPES: LASER TECHNOLOGY MARKET, BY REGION, 2024–2029 (USD MILLION)
 
 
LIST OF FIGURES (72 FIGURES)
 
FIGURE 1 FIBER LASER MARKET SEGMENTATION
FIGURE 2 MARKET: RESEARCH DESIGN
FIGURE 3 MARKET: RESEARCH APPROACH
FIGURE 4 MARKET SIZE ESTIMATION METHODOLOGY: BOTTOM-UP APPROACH
FIGURE 5 MARKET SIZE ESTIMATION METHODOLOGY: TOP-DOWN APPROACH
FIGURE 6 MARKET SIZE ESTIMATION METHODOLOGY
FIGURE 7 DATA TRIANGULATION: MARKET
FIGURE 8 MARKET GROWTH, 2020−2029
FIGURE 9 HIGH POWER SEGMENT TO ACCOUNT FOR LARGEST MARKET SHARE IN 2024
FIGURE 10 CONTINUOUS WAVE SEGMENT DOMINATED OVERALL MARKET IN 2023
FIGURE 11 INFRARED SEGMENT TO RECORD HIGHEST CAGR DURING FORECAST PERIOD
FIGURE 12 TELECOMMUNICATIONS SEGMENT TO ACCOUNT FOR LARGEST MARKET SHARE FROM 2024 TO 2029
FIGURE 13 ASIA PACIFIC ACCOUNTED FOR LARGEST MARKET SHARE IN 2023
FIGURE 14 RISING PREFERENCE FOR FIBER LASER-BASED MATERIAL PROCESSING OVER TRADITIONAL PROCESSING METHODS TO DRIVE MARKET
FIGURE 15 HIGH POWER SEGMENT TO ACCOUNT FOR LARGEST MARKET SHARE
FIGURE 16 INFRARED SEGMENT TO DOMINATE MARKET DURING FORECAST PERIOD
FIGURE 17 TELECOMMUNICATIONS SEGMENT TO BE LARGEST END USER OF FIBER LASER DURING FORECAST PERIOD
FIGURE 18 CHINA TO RECORD HIGHEST CAGR IN FIBER LASER MARKET DURING FORECAST PERIOD
FIGURE 19 FIBER LASER MARKET: DRIVERS, RESTRAINTS, OPPORTUNITIES, AND CHALLENGES
FIGURE 20 MARKET: IMPACT ANALYSIS OF DRIVERS
FIGURE 21 MARKET: IMPACT ANALYSIS OF RESTRAINTS
FIGURE 22 MARKET: IMPACT ANALYSIS OF OPPORTUNITIES
FIGURE 23 MARKET: IMPACT ANALYSIS OF CHALLENGES
FIGURE 24 MARKET: SUPPLY CHAIN ANALYSIS
FIGURE 25 MARKET: ECOSYSTEM ANALYSIS
FIGURE 26 INVESTMENT AND FUNDING SCENARIO, 2019–2023
FIGURE 27 TRENDS/DISRUPTIONS IMPACTING CUSTOMERS' BUSINESSES
FIGURE 28 MARKET: PORTER'S FIVE FORCES ANALYSIS
FIGURE 29 INFLUENCE OF STAKEHOLDERS ON BUYING PROCESS, BY END-USE INDUSTRY
FIGURE 30 KEY BUYING CRITERIA, BY END-USE INDUSTRY
FIGURE 31 IMPORT DATA FOR HS CODE 901320-COMPLIANT PRODUCTS, BY COUNTRY, 2018–2022 (USD MILLION)
FIGURE 32 EXPORT DATA FOR HS CODE 901320-COMPLIANT PRODUCTS, BY COUNTRY, 2018–2022 (USD MILLION)
FIGURE 33 NUMBER OF PATENTS APPLIED AND GRANTED, 2014–2023
FIGURE 34 SNAPSHOT: KEY AI USE CASES IN FIBER LASER
FIGURE 35 AVERAGE SELLING PRICE OF FIBER LASERS, 2020−2023
FIGURE 36 AVERAGE SELLING PRICE OF LASERS OFFERED BY KEY PLAYERS, BY OUTPUT POWER, 2023
FIGURE 37 AVERAGE SELLING PRICE OF FIBER LASERS, BY REGION, 2020−2023
FIGURE 38 MAJOR APPLICATIONS OF FIBER LASER
FIGURE 39 MARKET, BY TYPE
FIGURE 40 INFRARED FIBER LASER SEGMENT TO REGISTER HIGHEST CAGR DURING FORECAST PERIOD
FIGURE 41 MARKET, BY OUTPUT POWER
FIGURE 42 LOW FIBER LASER SEGMENT TO REGISTER HIGHEST CAGR DURING FORECAST PERIOD
FIGURE 43 MARKET, BY OPERATION MODE
FIGURE 44 CONTINOUS WAVE FIBER LASER SEGMENT TO REGISTER HIGHER CAGR DURING FORECAST PERIOD
FIGURE 45 FIBER LASER MARKET, BY END-USE INDUSTRY
FIGURE 46 TELECOMMUNICATIONS SEGMENT TO ACCOUNT FOR LARGEST MARKET SHARE DURING FORECAST PERIOD
FIGURE 47 CHINA TO EXHIBIT HIGHEST CAGR IN GLOBAL FIBER LASER MARKET DURING FORECAST PERIOD
FIGURE 48 NORTH AMERICA: MARKET SNAPSHOT
FIGURE 49 EUROPE: MARKET SNAPSHOT
FIGURE 50 ASIA PACIFIC:MARKET SNAPSHOT
FIGURE 51 REVENUE ANALYSIS OF KEY PLAYERS, 2020–2022
FIGURE 52 MARKET SHARE ANALYSIS, 2023
FIGURE 53 MARKET: COMPANY VALUATION
FIGURE 54 MARKET: FINANCIAL METRICS
FIGURE 55 BRAND/PRODUCT COMPARISON OF MAJOR COMPANIES
FIGURE 56 MARKET: COMPANY EVALUATION MATRIX (KEY PLAYERS), 2023
FIGURE 57 FIBER LASER MARKET: COMPANY OVERALL FOOTPRINT
FIGURE 58 MARKET: COMPANY EVALUATION MATRIX (STARTUPS/SMES), 2023
FIGURE 59 IPG PHOTONICS CORPORATION: COMPANY SNAPSHOT
FIGURE 60 TRUMPF: COMPANY SNAPSHOT
FIGURE 61 HAN'S LASER TECHNOLOGY INDUSTRY GROUP CO., LTD.: COMPANY SNAPSHOT
FIGURE 62 COHERENT CORP.: COMPANY SNAPSHOT
FIGURE 63 FUJIKURA LTD.: COMPANY SNAPSHOT
FIGURE 64 600 GROUP PLC: COMPANY SNAPSHOT
FIGURE 65 BYSTRONIC GROUP: COMPANY SNAPSHOT
FIGURE 66 FANUC CORPORATION: COMPANY SNAPSHOT
FIGURE 67 FURUKAWA ELECTRIC CO., LTD.: COMPANY SNAPSHOT
FIGURE 68 JENOPTIK AG: COMPANY SNAPSHOT
FIGURE 69 LUMENTUM OPERATIONS LLC: COMPANY SNAPSHOT
FIGURE 70 LUMIBIRD: COMPANY SNAPSHOT
FIGURE 71 NLIGHT, INC.: COMPANY SNAPSHOT
FIGURE 72 LASER TECHNOLOGY MARKET, BY LASER TYPE


The study involved four major activities in estimating the size of the Fiber laser market . Exhaustive secondary research has been done to collect information on the market, peer market, and parent market. Validation of these findings, assumptions, and sizing with industry experts across the value chain through primary research has been the next step. Both top-down and bottom-up approaches have been employed to estimate the global market size. After that, market breakdown and data triangulation have been used to estimate the market sizes of segments and subsegments.

Secondary Research

Various secondary sources were referred to in the secondary research process to identify and collect information pertinent to this study. The secondary sources include annual reports, press releases, and investor presentations of companies; white papers, certified publications, and articles by recognized authors; directories; and databases. Secondary research has been mainly carried out to obtain key information about the supply chain of the fiber laser industry, the value chain of the market, the total pool of the key players, market classification, and segmentation according to the industry trends to the bottom-most level, geographic markets, and key developments from both market- and technology oriented perspectives.

Primary Research

In the primary research process, various primary sources, from both supply and demand sides, were interviewed to obtain qualitative and quantitative information for this report. Primary sources from the supply side included experts such as chief executive officers (CEOs), vice presidents, marketing directors, technology and innovation directors, SMEs, consultants, and related key executives from the major companies and organizations operating in the fiber laser market share .

After the complete market engineering process (which includes market statistics calculations, market breakdown, market size estimations, market forecasting, and data triangulation), extensive primary research was conducted to gather information and verify and validate the critical market numbers.

Several primary interviews were conducted with experts from both the demand and supply sides across four major regions—North America, Europe, Asia Pacific, and RoW. This primary data was collected through questionnaires, emails, and telephonic interviews.

Fiber Laser Market
 Size, and Share

To know about the assumptions considered for the study, download the pdf brochure

Market Size Estimation

Both top-down and bottom-up approaches have been used to estimate and validate the total size of the fiber laser market. These methods have also been extensively used to estimate the sizes of various market subsegments. The research methodology used to estimate the market sizes includes the following:

  • Information related to the revenue of key manufacturers and providers of fiber laser type was studied and analyzed to estimate the global size of the fiber laser market
  • Multiple discussions were conducted with key opinion leaders to understand the demand for fiber laser products and analyze the break-up of the scope of work carried out by each major company
  • Revenue, geographic presence, key industries served, and the diverse offerings of all identified players in the fiber laser market size were studied to estimate and arrive at the percentage split of different market segments
  • All major players in the fiber laser market size were identified through secondary research and verified through brief discussions with industry experts
  • Multiple discussions were conducted with key opinion leaders of all major companies involved in developing fiber laser solutions to validate the market split based on operation mode, type, output power, industry, and region
  • Geographic splits were estimated using secondary sources on the basis of factors such as the number of players offering fiber laser in a specific country or region and the industries for which these players offer the solutions.

Market Size Estimation Methodology-Bottom-up Approach

Fiber Laser Market
 Size, and Bottom-up Approach

Market Size Estimation Methodology-Top-Down Approach

Fiber Laser Market
 Size, and Top-Down Approach

Data Triangulation

The total market was split into several segments after arriving at the overall market size from the market size estimation process explained in the sections above. Market breakdown and data triangulation procedures were employed to complete the overall market engineering process and arrive at the exact statistics for all segments, wherever applicable. The data was triangulated by studying several factors and trends from both the demand and supply sides. The market size was also validated using both the top-down and bottom-up approaches.

Market Definition

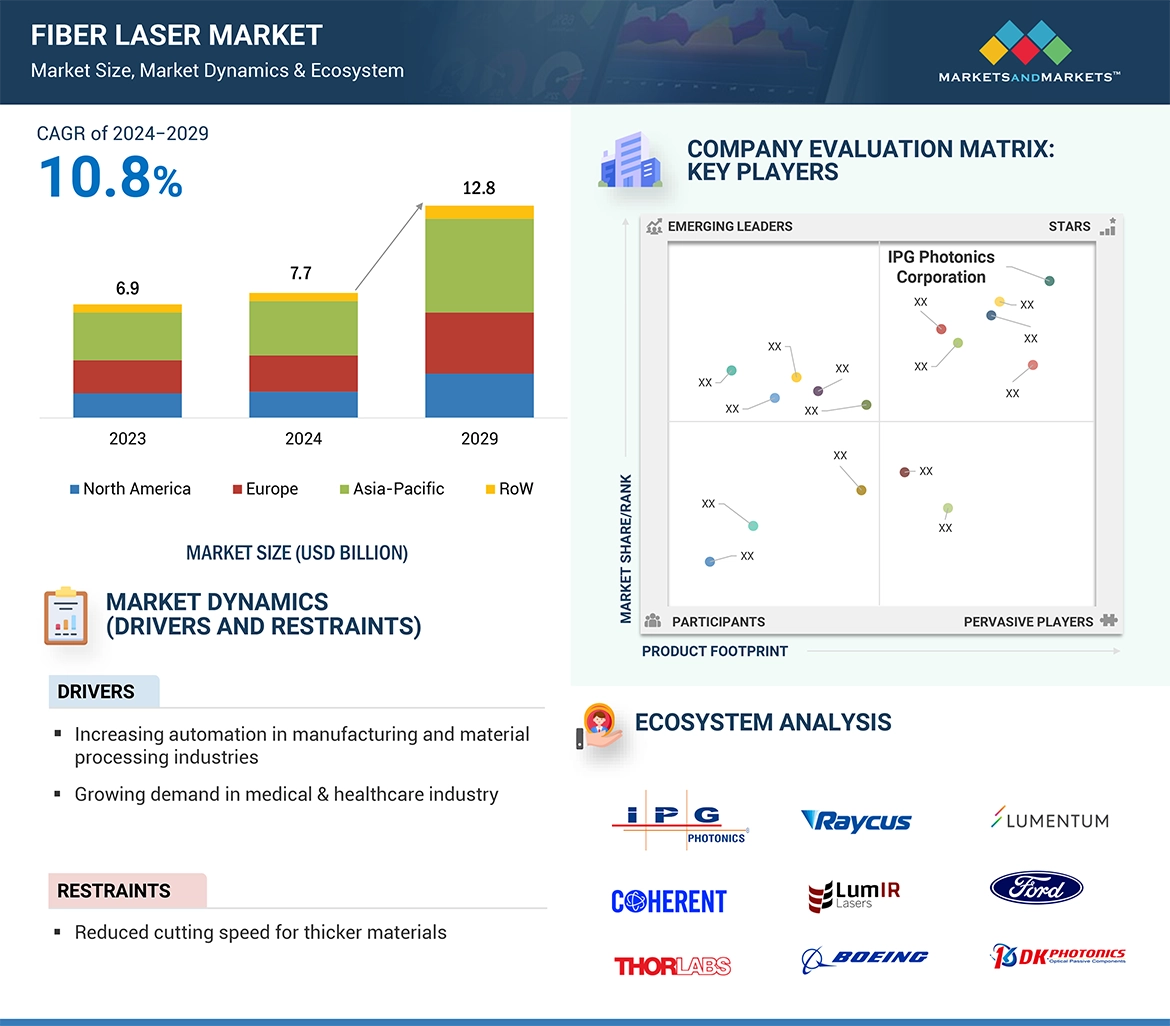
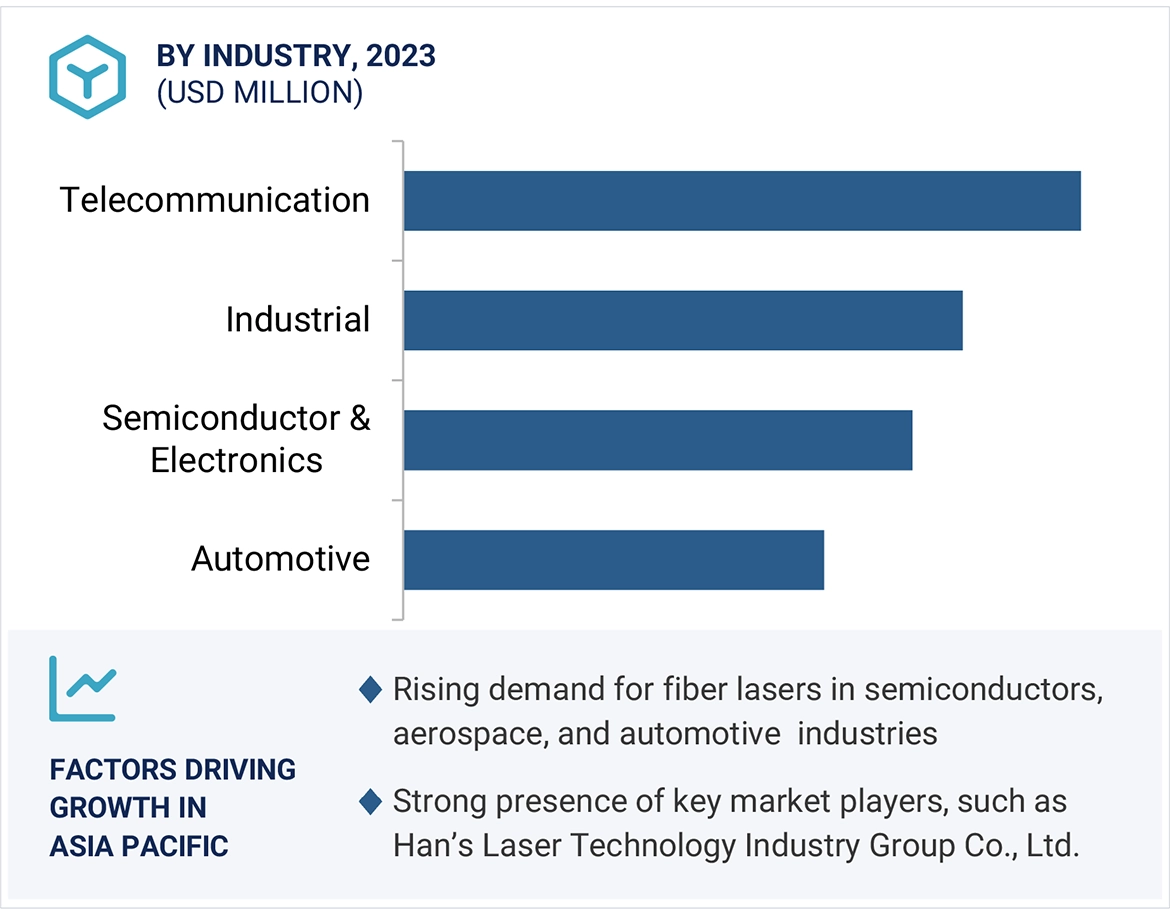
Fiber lasers are a type of solid-state laser which uses optical fiber, doped with rare earth elements which acts as the active gain medium. Optical fiber converts light from pump laser diodes into a laser beam with specific wavelengths.  Neodymium, ytterbium, praseodymium, erbium, thulium, holmium, and dysprosium are used as doping elements. Due to this wide range of produced wavelengths, fiber lasers are ideal for a variety of applications such as laser cutting, texturing, cleaning, engraving, drilling, marking, and welding. The industries that use fiber laser technology include commercial, telecommunications, research, aerospace, healthcare, automotive, semiconductor & electronics, industrial, and others (oil & gas, iron & steel, tobacco, glass, wood, retail, and plastics).
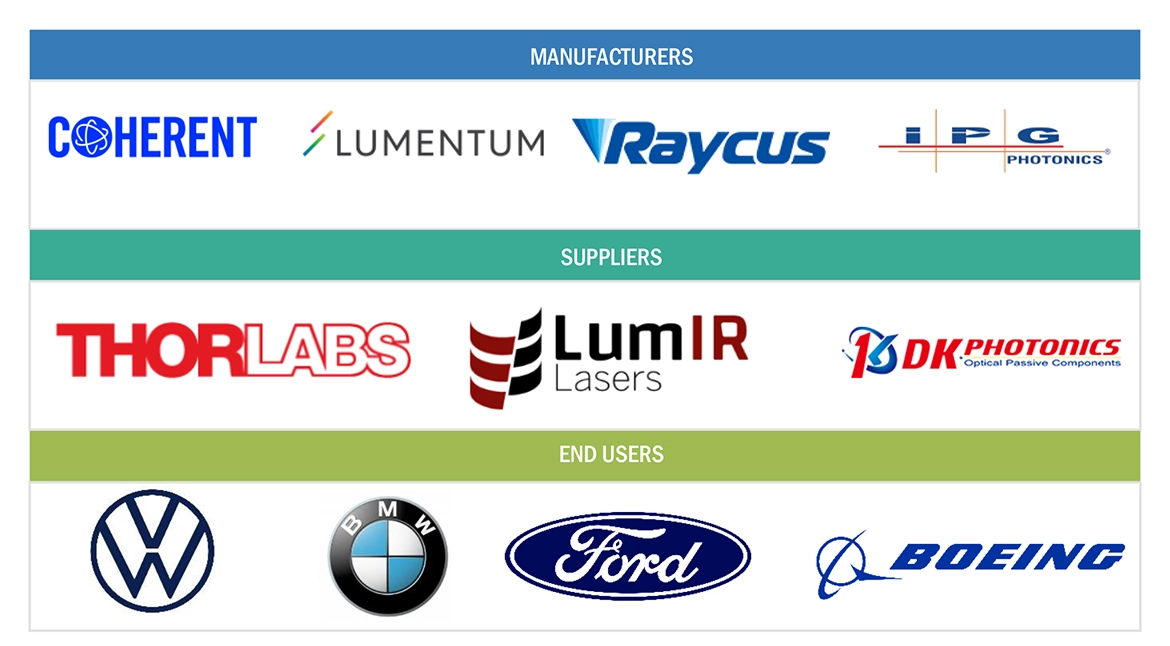
Stakeholders

  • End users
  • Government bodies, venture capitalists, and private equity firms
  • Fiber laser manufacturers
  • Fiber laser distributors
  • Fiber laser industry associations
  • Professional service/solution providers
  • Research institutions and organizations
  • Standards organizations and regulatory authorities related to the fiber Laser market
  • System integrators
  • Technology consultants

Research Objectives

  • To define, describe, and project the size of the global fiber laser market, in terms of value, segmented based on type, industry, operation mode, output power and region
  • To project the market size of fiber lasers in terms of volume
  • To forecast the market size for various segments with respect to four main regions—North America, Europe, Asia Pacific, and RoW
  • To provide detailed information regarding the major factors (drivers, restraints, opportunities, and industry-specific challenges) influencing the growth of the market
  • To analyze the micro markets with respect to individual growth trends, prospects, and contributions to the total market
  • To profile the key market players and comprehensively analyze their market ranking and core competencies.
  • To analyze competitive developments, such as joint ventures, mergers & acquisitions, product launches, and research & development (R&D) activities, in the fiber laser market
  • To provide leadership mapping based on company profiles and key player strategies such as product launches and development, collaborations, expansions, and acquisitions
  • To analyze the opportunities in the market for stakeholders and provide a detailed competitive landscape of the market
  • To provide ecosystem analysis, case study analysis, patent analysis, pricing analysis, Porter’s five forces analysis, key stakeholders & buying criteria, key conferences and events, and regulatory bodies, government agencies, and regulations pertaining to the market under study

Available Customizations:

MarketsandMarkets offers the following customizations for this market report:

  • Further breakdown of the market in different regions to the country level
  • Detailed analysis and profiling of additional market players (up to 5)
Custom Market Research Services

We will customize the research for you, in case the report listed above does not meet with your exact requirements. Our custom research will comprehensively cover the business information you require to help you arrive at strategic and profitable business decisions.

Request Customization
Report Code
SE 9103
Published ON
Jul, 2024
Choose License Type
BUY NOW
  • SHARE
X
Request Customization
Speak to Analyst
Speak to Analyst
OR FACE-TO-FACE MEETING
PERSONALIZE THIS RESEARCH
  • Triangulate with your Own Data
  • Get Data as per your Format and Definition
  • Gain a Deeper Dive on a Specific Application, Geography, Customer or Competitor
  • Any level of Personalization
REQUEST A FREE CUSTOMIZATION
LET US HELP YOU!
  • What are the Known and Unknown Adjacencies Impacting the Fiber Laser Market
  • What will your New Revenue Sources be?
  • Who will be your Top Customer; what will make them switch?
  • Defend your Market Share or Win Competitors
  • Get a Scorecard for Target Partners
CUSTOMIZED WORKSHOP REQUEST
  • Call Us
  • +1-888-600-6441 (Corporate office hours)
  • +1-888-600-6441 (US/Can toll free)
  • +44-800-368-9399 (UK office hours)
CONNECT WITH US
ABOUT TRUST ONLINE
©2024 MarketsandMarkets Research Private Ltd. All rights reserved
DMCA.com Protection Status Website Feedback