The study involved two major approaches in estimating the current size of the feed robot market. Exhaustive secondary research was done to collect information on the market, peer, and parent markets. The next step was to validate these findings, assumptions, and sizing with industry experts across the value chain through primary research. Both top-down and bottom-up approaches were employed to estimate the complete market size. After that, market breakdown and data triangulation were used to estimate the market size of segments and subsegments.
Secondary Research
This research study involved the extensive use of secondary sources—directories and databases such as Bloomberg Businessweek and Factiva—to identify and collect information useful for a technical, market-oriented, and commercial study of the market.
In the secondary research process, various sources such as annual reports, press releases & investor presentations of companies, white papers, food journals, certified publications, articles from recognized authors, directories, and databases were referred to identify and collect information.
Secondary research was mainly used to obtain key information about the industry’s supply chain, the total pool of key players, and market classification and segmentation as per the industry trends to the bottom-most level, regional markets, and key developments from both market- and technology-oriented perspectives.
Primary Research
Extensive primary research was conducted after obtaining information regarding the feed robotics market scenario through secondary research. Several primary interviews were conducted with market experts from both the demand and supply sides across major countries of North America, Europe, Asia Pacific, South America, and the Rest of the World. Primary data was collected through questionnaires, emails, and telephonic interviews. The primary sources from the supply side included various industry experts, such as Chief X Officers (CXOs), Vice Presidents (VPs), Directors from business development, marketing, research, and development teams, and related key executives from distributors and key opinion leaders. Primary interviews were conducted to gather insights such as market statistics, data on revenue collected from the products and services, market breakdowns, market size estimations, market forecasting, and data triangulation. Primary research also helped in understanding the various trends related to feed robotics product types, farm size, functionality, end user application, and region. Stakeholders from the demand side, such as farmers, dairy farm, poultry farm, swine farms, & aquaculture owners were interviewed to understand the buyer’s perspective on the suppliers, products, and their current usage of feed robotics and the outlook of their business, which will affect the overall feed robotics market.

To know about the assumptions considered for the study, download the pdf brochure
|
COMPANY NAME
|
designation
|
|
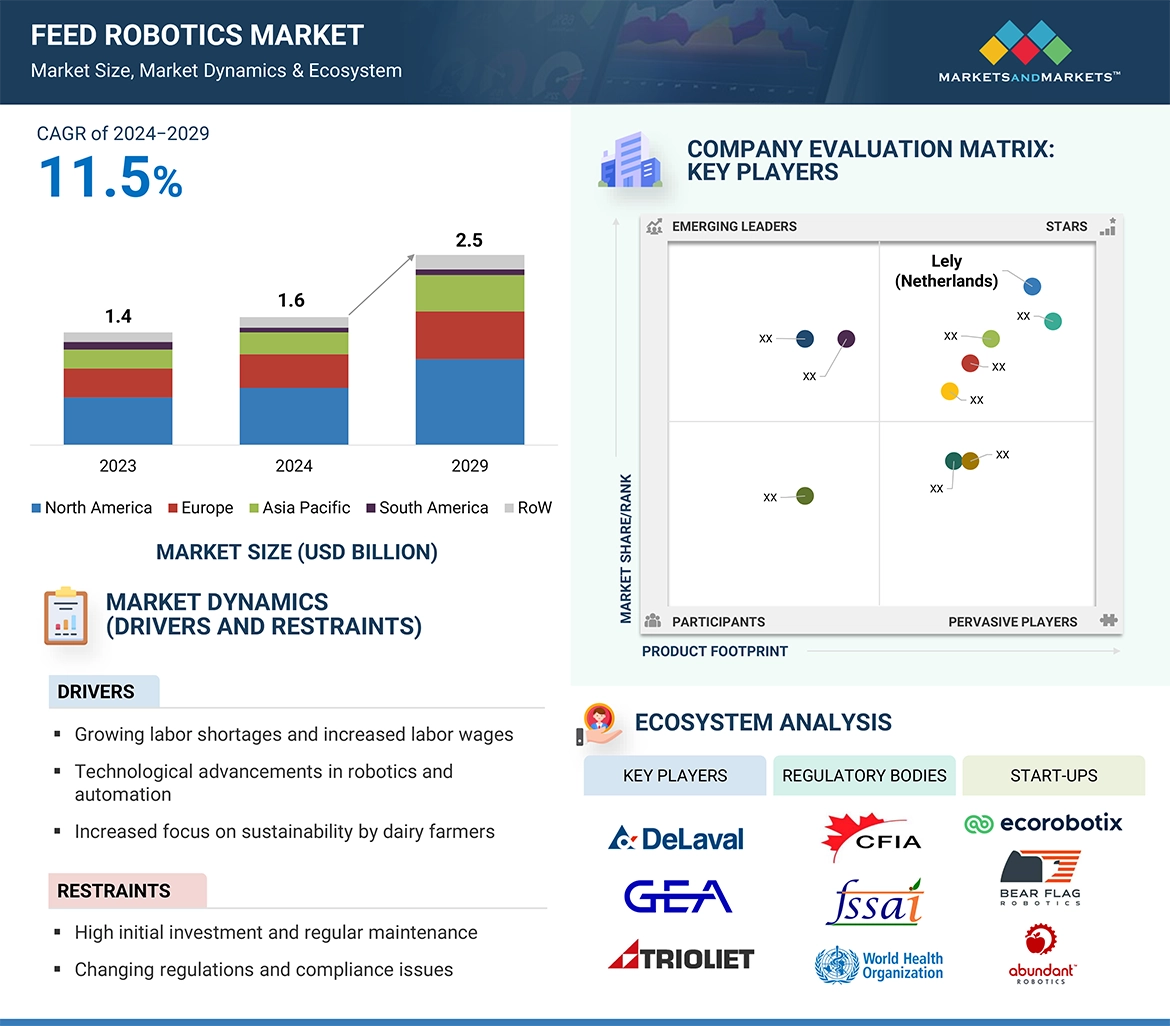
Lely ( Netherlands)
|
Research
|
|
DeLaval (Europe)
|
Sales Manager
|
|
GEA Group AG (Germany)
|
Product Sales Manager
|
|
Triolet BV (Netherlands)
|
Product Developer
|
|
Hetwin (Austria)
|
Managing Director
|
|
Rovibec Agrisolutions (Quebec)
|
Senior Software Engineer
|
Market Size Estimation
Both the top-down and bottom-up approaches were used to estimate and validate the total size of the feed robotics market. These approaches were also used extensively to determine the size of various subsegments in the market. The research methodology used to estimate the market size includes the following details:
-
The key players in the industry and the overall markets were identified through extensive secondary research.
-
All shares, splits, and breakdowns were determined using secondary sources and verified through primary sources.
-
All possible parameters that affect the market covered in this research study were accounted for, viewed in extensive detail, verified through primary research, and analyzed to obtain final quantitative and qualitative data.
-
The research included the study of reports, reviews, and newsletters of top market players, along with extensive interviews for opinions from leaders, such as CEOs, directors, and marketing executives.
Global feed robotics market: Supply-side analysis.

To know about the assumptions considered for the study, Request for Free Sample Report
Global feed robotics market: Top-Down Approach.

Data Triangulation
After arriving at the overall market size from the estimation process explained above, the total market was split into several segments and subsegments. The data triangulation and market breakdown procedures were employed, wherever applicable, to estimate the overall feed robotics market and arrive at the exact statistics for all segments and subsegments. The data was triangulated by studying various factors and trends from the demand and supply sides. The market size was also validated using both the top-down and bottom-up approaches.
Market Definition
The feed robotics refers to the specialized application of robotic technology designed to automate the process of feeding in various context such as enhance efficiency, precision, and consistency in the feed management, therefore optimizing productivity and reducing labor costs. The feed robotics market offers a range of robotic feeders, feed pushers, and feed mixers that are designed to increase feeding operations' accuracy and management. These technologies contribute to improved animal health and productivity by ensuring that animals receive the proper amount of feed at the right time. The market is expanding as a result of developments in automation and robotics, the demand for more productive agricultural methods, and the desire to lower labor costs without sacrificing animal welfare.
Key Stakeholders
-
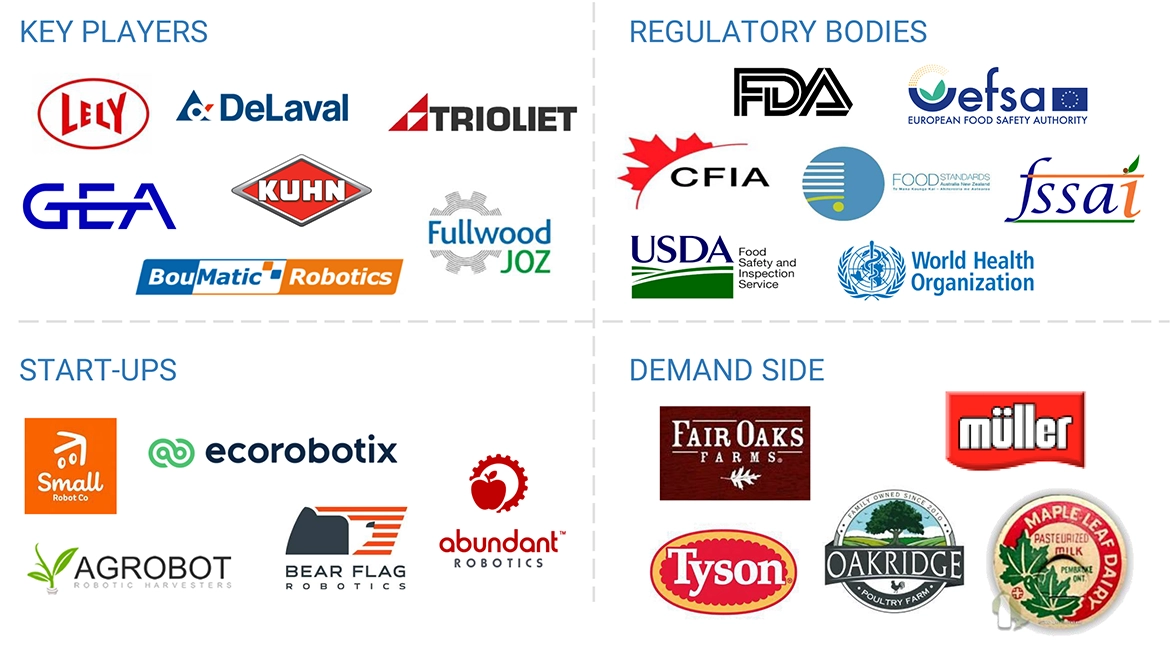
Feed Robotics manufacturers, suppliers, and processors
-
Research & development institutions
-
Traders & retailers
-
Distributors, importers, and exporters
-
Regulatory bodies
-
Organizations such as the Food and Drug Administration (FDA), United States Department of Agriculture (USDA), European Food Safety Agency (EFSA), European Union (EU) Directorate-General for Agriculture and Rural Development, World Organisation for Animal Health (OIE), Animal Feed Industry Association (AFIA), Animal Feed Manufacturers Association (AFMA)
-
Government agencies
-
Intermediary suppliers
-
Universities and industry bodies
-
End users
Report Objectives
MARKET INTELLIGENCE
-
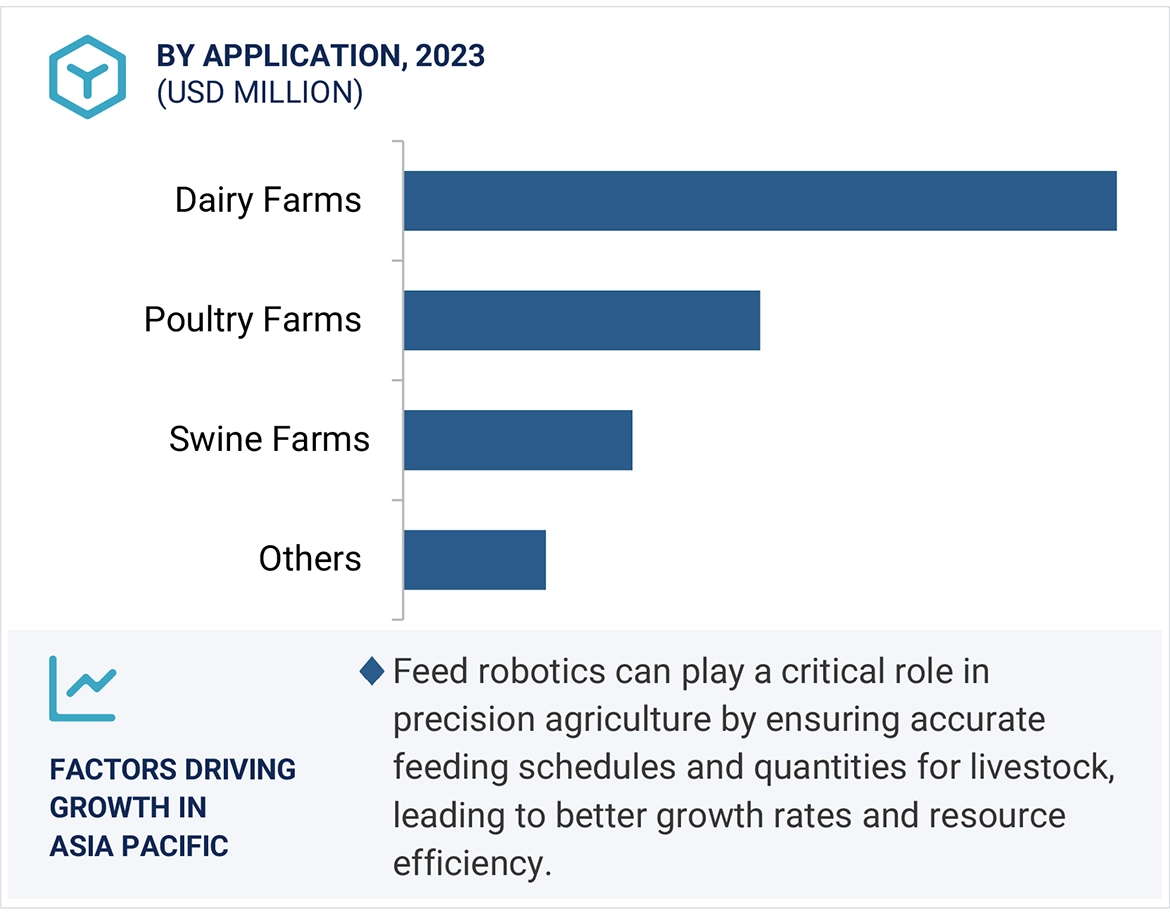
To determine and project the size of the feed robotics market with respect to the product type, end use application, farm size, functionality, and regions in terms of value over five years, ranging from 2024 to 2029.
-
To identify the attractive opportunities in the market by determining the largest and fastest-growing segments across regions
-
To provide detailed information about the key factors influencing market growth (drivers, restraints, opportunities, and challenges)
-
To analyze the opportunities in the market for stakeholders and provide details of the competitive landscape for market leaders.
-
To analyze the micro-markets with respect to individual growth trends, prospects, and their contribution to the total market.
-
To identify and profile the key players in the feed robotics market.
-
To understand the competitive landscape and identify the major growth strategies adopted by players across the key regions.
Available Customizations:
With the given market data, MarketsandMarkets offers customizations according to company-specific scientific needs.
The following customization options are available for the report:
Product Analysis
-
Product Matrix, which gives a detailed comparison of the product portfolio of each company.
Geographic Analysis
With the given market data, MarketsandMarkets offers customizations according to company-specific scientific needs.
-
Further breakdown of the European feed robotics market into key countries.
-
Further breakdown of the Rest of Asia Pacific feed robotics market into key countries.
Company Information
-
Detailed analyses and profiling of additional market players (up to five)


Growth opportunities and latent adjacency in Feed Robotics Market