The study involved four major activities in estimating the current size of the ethyleneamines market. Exhaustive secondary research was done to collect information on the market, peer market, and parent market. The next step was to validate these findings, assumptions, and sizing with industry experts across the value chain through primary research. Both top-down and bottom-up approaches were employed to estimate the complete market size. After that, market breakdown and data triangulation were used to estimate the market size of segments and subsegments.
Secondary Research
Secondary sources referred to for this research study include financial statements of companies offering ethyleneamines information from various trade, business, and professional associations. The secondary data was collected and analyzed to arrive at the overall size of the ethyleneamines market, which was validated by primary respondents.
Primary Research
Extensive primary research was conducted after obtaining information regarding the ethyleneamines market scenario through secondary research. Several primary interviews were conducted with market experts from both, the demand and supply sides across major countries of North America, Europe, Asia Pacific, the Middle East & Africa, and South America. Primary data was collected through questionnaires, emails, and telephonic interview. The primary sources from the supply side included various industry experts, such as Chief X Officers (CXOs), Vice Presidents (VPs), Directors, from business development, marketing, product development/innovation teams, and related key executives from ethyleneamines vendors; raw material suppliers; distributors; and key opinion leaders. Primary interviews were conducted to gather insights such as market statistics, data of revenue collected from the products and services, market breakdowns, market size estimations, market forecasting, and data triangulation. Primary research also helped in understanding the various trends related to type, application, end use, and region. Stakeholders from the demand side, such as CIOs, CTOs, and CSOs, and installation teams of the customer/end users who are using ethyleneamines were interviewed to understand the buyer’s perspective on the suppliers, products, component providers, and their current usage of ethyleneamines and future outlook of their business which will affect the overall market.
The Breakup of Primary Research:

To know about the assumptions considered for the study, download the pdf brochure
|
CoMPANY NAME
|
DESIGNATION |
|
Huntsman Corporation
|
Director
|
|
BASF SE
|
Project Manager
|
|
Dow Inc
|
Individual Industry Expert
|
|
Tosoh Corporation
|
Director
|
Market Size Estimation
The research methodology used to estimate the size of the ethyleneamines market includes the following details. The market sizing of the market was undertaken from the demand side. The market was upsized based on procurements and modernizations in the end-use industries at a regional level. Such procurements provide information on the demand aspects of ethyleneamines.
Global Ethyleneamines Market Size: Bottom-Up Approach

To know about the assumptions considered for the study, Request for Free Sample Report
Global Ethyleneamines Market Size: Top-Down Approach

Data Triangulation
After arriving at the overall size from the market size estimation process explained above, the total market was split into several segments and subsegments. The data triangulation and market breakdown procedures explained below were implemented, wherever applicable, to complete the overall market engineering process and arrive at the exact statistics for various market segments and subsegments. The data was triangulated by studying various factors and trends from the demand and supply sides. Along with this, the market size was validated using both the top-down and bottom-up approaches.
Market Definition
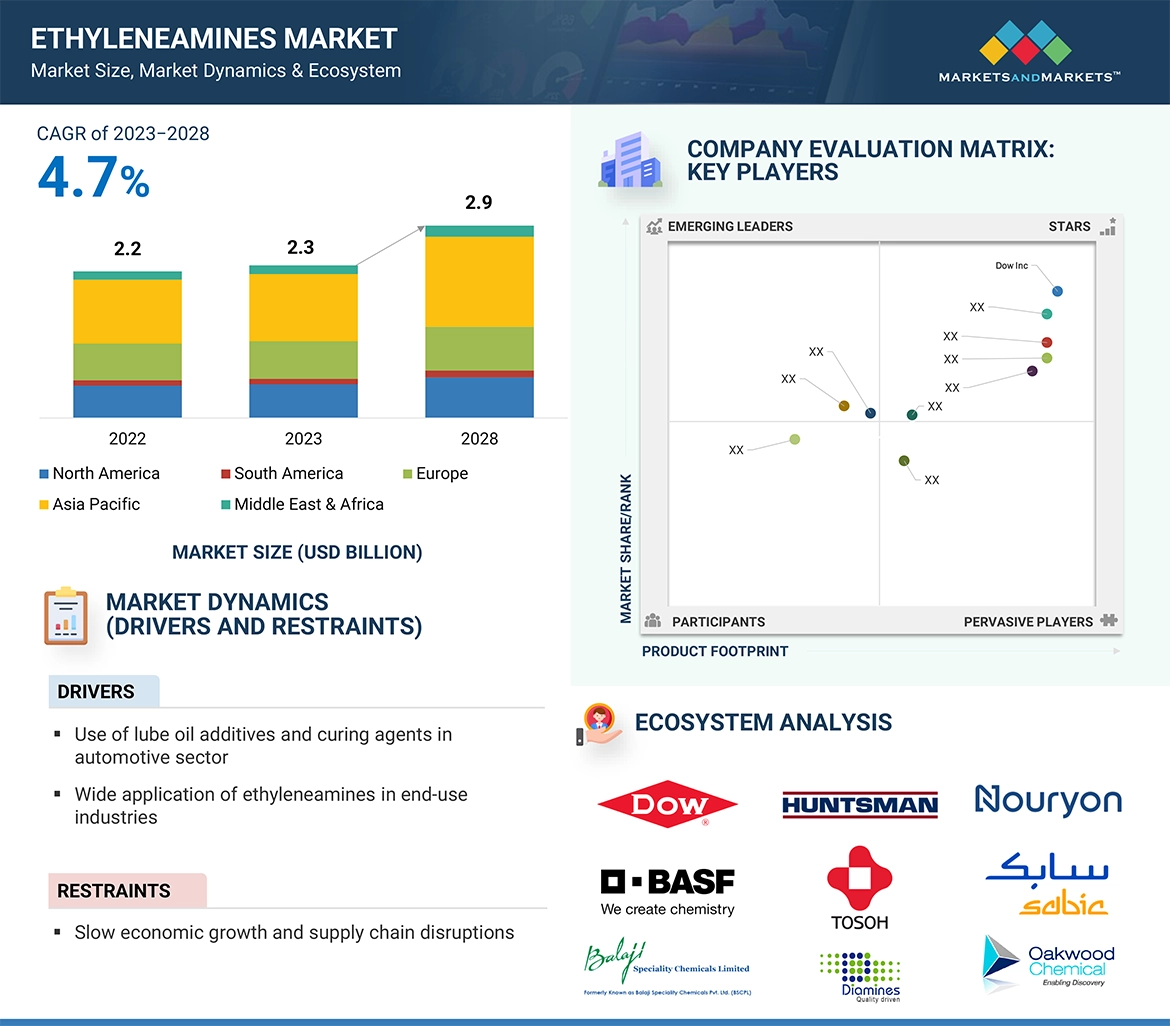
Ethyleneamines are a class of amine compounds containing ethylene (-CH2CH2-) linkages between amine groups. These compounds are generally colorless, low-viscosity liquids with a fishy amine odor. Ethyleneamines are organic compounds with a wide range of commercial and industrial applications. Ethyleneamines are used primarily as reactive intermediates (i.e., building blocks) to produce other useful chemical products due to their unique combination of reactivity and basicity.
Key Stakeholders
-
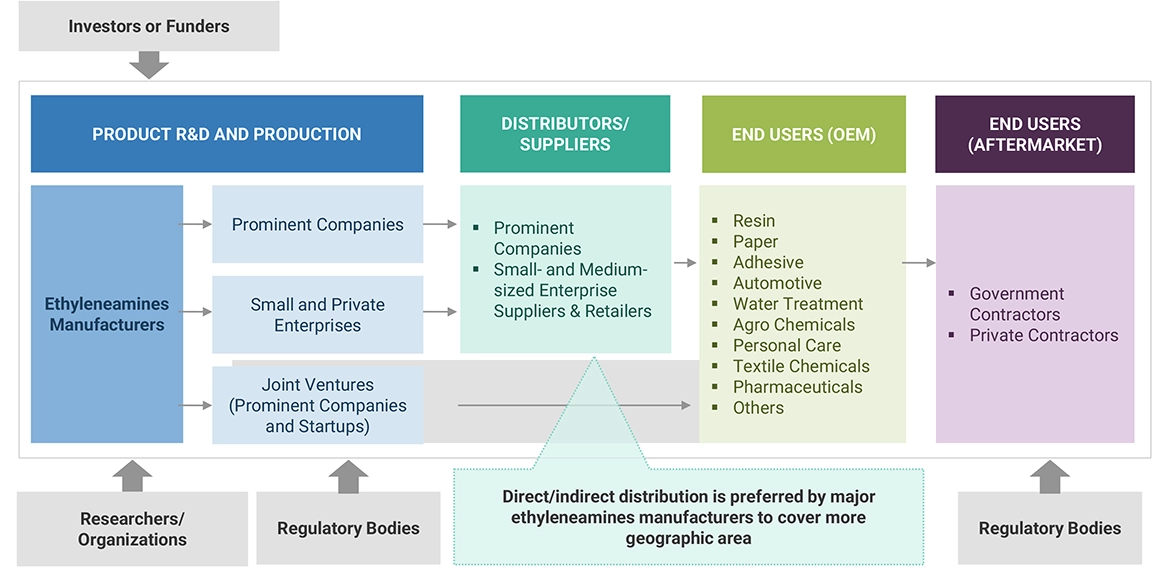
End User
-
Raw Material Suppliers
-
Senior Management
-
Procurement Department
Report Objectives
-
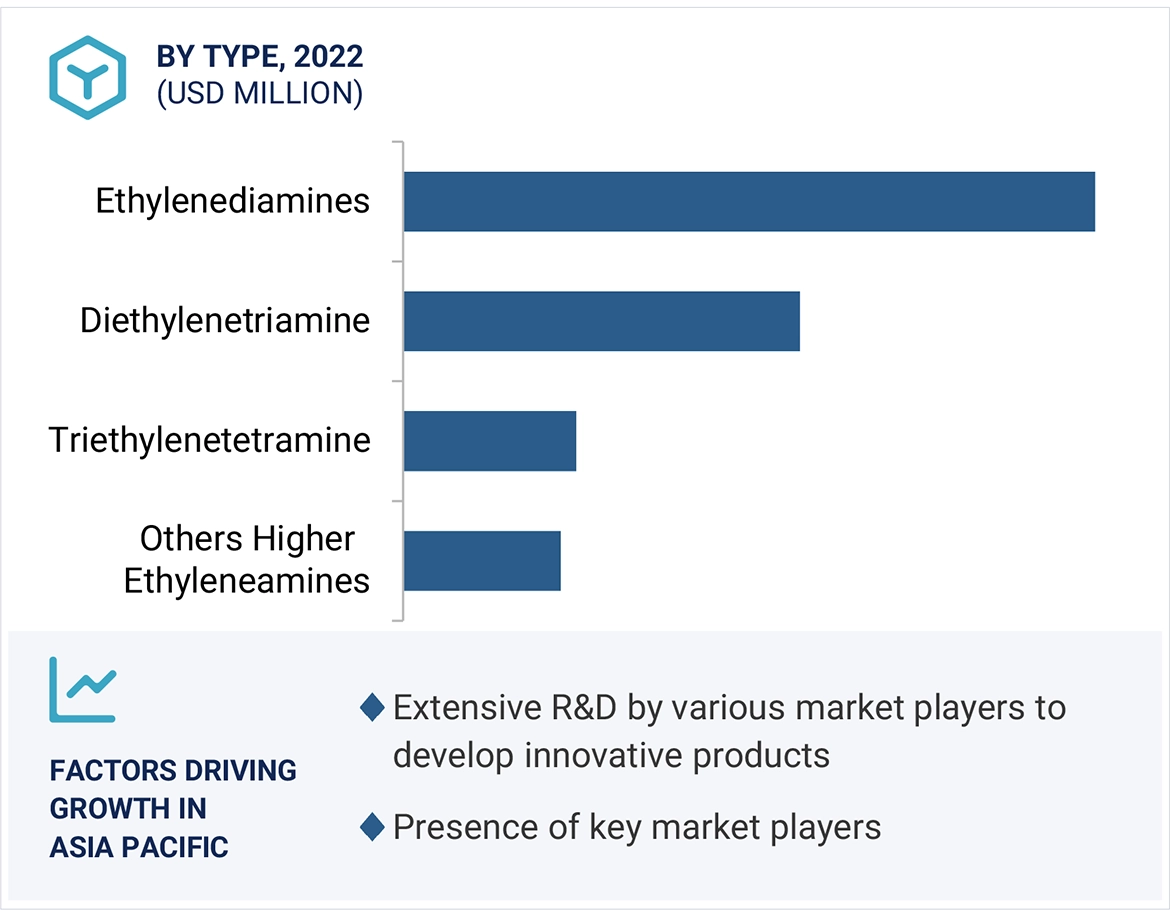
To define, describe, segment, and forecast the size of the ethyleneamines market based on type, application, end use, and region.
-
To forecast the market size of segments with respect to various regions, including North America, Europe, Asia Pacific, South America, Middle East & Africa, along with major countries in each region
-
To identify and analyze key drivers, restraints, opportunities, and challenges influencing the growth of the ethyleneamines market
-
To analyze technological advancements and product launches in the market
-
To strategically analyze micro markets, with respect to their growth trends, prospects, and their contribution to the market
-
To identify financial positions, key products, and key developments of leading companies in the market
-
To provide a detailed competitive landscape of the market, along with market share analysis
-
To provide a comprehensive analysis of business and corporate strategies adopted by the key players in the market
-
To strategically profile key players in the market and comprehensively analyze their core competencies
Available Customizations
MarketsandMarkets offers the following customizations for this market report:
-
Additional country-level analysis of the ethyleneamines market
-
Profiling of additional market players (up to 5)
Product Analysis
-
Product matrix, which provides a detailed comparison of the product portfolio of each company in the ethyleneamines Market


Growth opportunities and latent adjacency in Ethyleneamines Market