Ethyl Cyanoacetate Market

Ethyl Cyanoacetate Market by Grade (Pharmaceutical Grade, Industrial Grade), Function (Chemical Intermediates, Polymerization, Cross-linking Agents, Catalysts), Application Pharmaceutical, Agrochemicals, Adhesives, Dyes) - Global Forecast 2029

Report Code: CH 9040 Jun, 2024, by marketsandmarkets.com

Updated on : June 20, 2024

Ethyl Cyanoacetate Market

The global ethyl cyanoacetate market is valued at USD 145 million in 2024 and is projected to reach USD 184 million by 2029, growing at 4.9% cagr from 2024 to 2029. The Ethyl Cyanoacetate market experiences robust growth driven by a multitude of influential factors. These Ethyl Cyanoacetate, with exceptional properties, find applications across a diverse range of high-tech industries such as agrochemicals and pharmaceuticals.

Attractive Opportunities in the Ethyl Cyanoacetate Market

Ethyl Cyanoacetate Market

To know about the assumptions considered for the study, Request for Free Sample Report

Ethyl Cyanoacetate Market

Ethyl Cyanoacetate Market Dynamics

Driver: Growing demand from pharmaceutical and agrochemical sectors

Ethyl cyanoacetate, a versatile chemical compound, plays a pivotal role as an intermediate in the synthesis of numerous pharmaceuticals and agrochemicals. In the pharmaceutical sector, it serves as a fundamental building block to produce a wide array of drugs, including anticonvulsants, antibiotics, and cardiovascular medications. Similarly, in the agrochemical industry, ethyl cyanoacetate is a crucial ingredient for manufacturing pesticides, herbicides, and fungicides. It is used as a building block to create active ingredients that are effective in controlling pests, weeds, and diseases. By enabling the development of these agricultural solutions, ethyl cyanoacetate helps increase crop yields and contributes to global food security. Therefore, as the pharmaceutical and agrochemical sectors continue to expand globally to meet the rising demands of growing populations and evolving healthcare and agricultural needs, the demand for ethyl cyanoacetate is set to rise accordingly.

Restraint: Stringent regulatory compliances

Stringent regulatory compliance presents a significant restraint for the ethyl cyanoacetate industry due to the complex and rigorous standards imposed on chemical production and usage. Regulatory bodies enforce stringent regulations to ensure the safety of workers, consumers, and the environment throughout the chemical's lifecycle, from manufacturing to disposal. Compliance with these regulations necessitates substantial investments in research, development, and infrastructure to meet the required standards. Moreover, regulatory scrutiny regarding the environmental impact of ethyl cyanoacetate production and usage can lead to restrictions on its use or even bans in certain regions. Failure to meet regulatory standards can result in severe consequences, including fines, legal liabilities, reputational damage, and even production shutdowns. Additionally, stringent regulations may increase production costs, as manufacturers invest in measures to mitigate environmental impact, enhance workplace safety, and ensure product quality and consistency.

Opportunities: Research and development for new applications and formulations

Investing in research and development (R&D) to explore new applications and formulations for ethyl cyanoacetate offers a strong opportunity for driving future growth and expanding the market. R&D efforts focus on harnessing the unique properties of ethyl cyanoacetate to develop innovative solutions that address emerging needs and challenges across various industries. In the pharmaceutical sector, ongoing R&D aims to leverage ethyl cyanoacetate's versatile chemistry to synthesize new drug candidates with enhanced efficacy. Similarly, in the dyes industry, R&D in ethyl cyanoacetate can lead to the discovery of new dye molecules and colorants with enhanced stability, color vibrancy, and application properties. Ethyl cyanoacetate serves as a versatile building block for synthesizing organic dyes and pigments through various chemical reactions, offering opportunities to create custom color solutions for diverse applications, including textiles, coatings, and printing inks. By continuously investing in R&D to drive innovation, manufacturers can establish themselves as market leaders, make their products stand out, and tap into new growth opportunities to achieve long-term success and profitability.

Challenges: Disruptions in supply chain

Supply chain disruptions pose a significant risk to the ethyl cyanoacetate market, as it relies heavily on a global network for sourcing raw materials and intermediates. Ethyl cyanoacetate is synthesized through multi-step chemical reactions, often requiring specialized reagents and precursors that may be sourced from various suppliers across different regions. Any disruption in this complex supply chain can influence the production process, resulting in shortages, delays, and price fluctuations. Geopolitical tensions can impact the availability of raw materials by restricting trade routes, imposing tariffs, or sanctions, or disrupting diplomatic relations with key suppliers. For example, political instability in regions rich in chemical feedstocks can disrupt production and distribution, affecting the supply of critical raw materials for ethyl cyanoacetate synthesis. To mitigate the impact of supply chain disruptions, companies may employ strategies such as diversifying sourcing locations, maintaining safety stock, establishing alternative supply routes, or developing contingency plans in collaboration with suppliers and logistics partners.

Ethyl Cyanoacetate Market Ecosystem

Prominent companies in this market include well-established, financially stable manufacturers of wet room waterproofing solutions. These companies have been operating in the market for several years and possess a diversified product portfolio and strong global sales and marketing networks. Prominent companies in this market include Merck KGaA (Germany), Shandong Xinhua Pharmaceutical Co., Ltd. (China), Tiande Chemical Holdings Limited (China), Tokyo Chemical Industry Co., Ltd. (TCI) (Japan), HeBei ChengXin (China), TATEYAMA KASEI Co., Ltd (Japan), Triveni Chemicals (India), EMCO Dyestuff (India), Loba Chemie Pvt. Ltd. (India), and Sisco Research Laboratories Pvt. Ltd. (India).

Ethyl Cyanoacetate Market Ecosystem

Based on grade, industrial grade is projected to account for the second largest share of the Ethyl Cyanoacetate market.

Industrial-grade ethyl cyanoacetate finds extensive application across diverse industries, including pharmaceuticals, agrochemicals, and coatings. Its versatility makes it a preferred choice for various manufacturing processes, contributing to its substantial market share. It boasts higher purity levels compared to lower grades, ensuring consistency and reliability in various applications which is crucial for industries where precision and quality are of utmost importance, such as pharmaceuticals and agrochemicals. Additionally, the relatively lower cost compared to pharmaceutical-grade ethyl cyanoacetate makes it economically viable for large-scale industrial production, thereby driving its market share.

Based on application, pharmaceutical is projected to account for the second largest share of the Ethyl Cyanoacetate market.

Ethyl cyanoacetate serves as a crucial intermediate in the synthesis of various pharmaceutical compounds, including drugs used for treating diverse medical conditions. It can be incorporated into various pharmaceutical products, ranging from medications for cardiovascular diseases to treatments for neurological disorders. The continual research and development efforts in pharmaceuticals, coupled with the growing global healthcare needs, contribute to the sustained demand for ethyl cyanoacetate in this sector. Therefore, the pharmaceutical industry's constant demand for innovative drugs and formulations continuously drives the need for ethyl cyanoacetate as a foundational chemical component.

Based on function, cross-linking agents are projected to account for the second largest share of the Ethyl Cyanoacetate market.

Cross-linking agents are crucial in various industries, especially in coatings, adhesives, and polymers. Ethyl cyanoacetate serves as a vital precursor in the synthesis of cross-linking agents. These agents play a significant role in enhancing the performance characteristics of coatings, adhesives, and polymers by forming strong bonds between molecular chains. Moreover, in the pharmaceutical sector, they are utilized in drug formulations where controlled release, stability, and bioavailability are critical factors. Additionally, in the agrochemical industry, cross-linking agents help in enhancing the efficacy and longevity of pesticides and fertilizers.

North America is expected to be the fastest growing market during the forecast period.

North America is the fastest-growing area in the Ethyl Cyanoacetate market due to numerous factors such as its diverse economy, technological advancements, and favorable business environment. The region attracts significant investments in research and development, fostering a culture of entrepreneurship and technological advancement, to generate new and innovative Ethyl Cyanoacetate products. The growing need for Ethyl Cyanoacetate in a variety of applications, such as pharmaceuticals, adhesives, and agrochemicals, is also driving the North American Ethyl Cyanoacetate market. Moreover, the region's large consumer base and robust infrastructure further contribute to its growth prospects, making it an attractive destination for businesses seeking expansion.

Ethyl Cyanoacetate Market by Region

To know about the assumptions considered for the study, download the pdf brochure

Ethyl Cyanoacetate Market Players

The Ethyl Cyanoacetate market is dominated by a few major players that have a wide regional presence. The key players in the Ethyl Cyanoacetate market include Merck KGaA (Germany), Shandong Xinhua Pharmaceutical Co., Ltd. (China), Tiande Chemical Holdings Limited (China), Tokyo Chemical Industry Co., Ltd. (TCI) (Japan), HeBei ChengXin (China), TATEYAMA KASEI Co.,Ltd (Japan), Triveni Chemicals (India), EMCO Dyestuff (India), Loba Chemie Pvt. Ltd. (India), and Sisco Research Laboratories Pvt. Ltd. (India). In the last few years, the companies have adopted growth strategies such as expansions to capture a larger share of the Ethyl Cyanoacetate market.

Ethyl Cyanoacetate Market Report Scope

Report Metric

Details

Years considered for the study

2020-2029

Base Year

2023

Forecast period

2024–2029

Units considered

Value (USD Million/Billion)

Segments

 Grade, Function, Application, and Region

Regions

Asia Pacific, North America, Europe, Middle East & Africa, and South America

Companies

Merck KGaA (Germany), Shandong Xinhua Pharmaceutical Co., Ltd. (China), Tiande Chemical Holdings Limited (China), Tokyo Chemical Industry Co., Ltd. (TCI) (Japan), HeBei ChengXin (China), TATEYAMA KASEI Co.,Ltd (Japan), Triveni Chemicals (India), EMCO Dyestuff (India), Loba Chemie Pvt. Ltd. (India), and Sisco Research Laboratories Pvt. Ltd. (India)

This report categorizes the global Ethyl Cyanoacetate market based on Grade, Function, End-uses, and Region.

On the basis of Grade, the ethyl cyanoacetate market has been segmented as follows:
  • Pharmaceutical Grade
  • Industrial Grade
  • Others
On the basis of Function, the ethyl cyanoacetate market has been segmented as follows:
  • Chemical Intermediates
  • Polymerization
  • Cross-linking Agents
  • Catalysts
  • Stabilizer or Additives
  • Others
On the basis of Application, the ethyl cyanoacetate market has been segmented as follows:
  • Pharmaceutical
  • Agrochemical
  • Adhesives
  • Dyes
On the basis of region, the ethyl cyanoacetate market has been segmented as follows:
  • Asia Pacific
  • Europe
  • North America
  • Middle East & Africa
  • South America

Recent Developments

  • In December 2020, Merck KGaA announced the broadening of its manufacturing footprint with a combined USD 45.6 million investment at its production facilities in Danvers, Massachusetts, and Jaffrey, New Hampshire, USA.
  • In September 2022, Merck KGaA, strengthens its manufacturing capabilities for single-use assemblies, a key technology for the production of Covid-19 vaccines and other lifesaving therapies, by investing more than USD 136.6 million in Molsheim, France. The investment is the largest ever in the 50-year history of the site and will create more than 800 jobs by the end of 2028.
  • In March 2024, Merck KGaA invests more than USD 325.7s million into a new Bioprocessing Production Center in Daejeon, South Korea. The new site is the largest investment by Merck's Life Science business sector in Asia-Pacific to date and demonstrates the company’s commitment to expanding its capacities in the fast-growing region.

Frequently Asked Questions (FAQ):

To speak to our analyst for a discussion on the above findings, click Speak to Analyst

Exclusive indicates content/data unique to MarketsandMarkets and not available with any competitors.

TABLE OF CONTENTS
 
1 INTRODUCTION (Page No. - 30)
    1.1 STUDY OBJECTIVES 
    1.2 MARKET DEFINITION 
    1.3 STUDY SCOPE 
           1.3.1 INCLUSIONS & EXCLUSIONS
                    FIGURE 1 ETHYL CYANOACETATE MARKET SEGMENTATION
           1.3.2 REGIONS COVERED
           1.3.3 YEARS CONSIDERED
    1.4 CURRENCY CONSIDERED 
    1.5 UNITS CONSIDERED 
    1.6 LIMITATIONS 
    1.7 STAKEHOLDERS 
 
2 RESEARCH METHODOLOGY (Page No. - 34)
    2.1 RESEARCH DATA 
          FIGURE 2 ETHYL CYANOACETATE MARKET: RESEARCH DESIGN
           2.1.1 SECONDARY DATA
                    2.1.1.1 Key data from secondary sources
           2.1.2 PRIMARY DATA
                    2.1.2.1 Key data from primary sources
                    2.1.2.2 Primary data sources
                    2.1.2.3 Key primary participants
                    2.1.2.4 Breakdown of primary interviews
                    2.1.2.5 Key industry insights
    2.2 BASE NUMBER CALCULATION 
           2.2.1 SUPPLY-SIDE APPROACH
                    FIGURE 3 MARKET SIZE ESTIMATION METHODOLOGY: SUPPLY-SIDE APPROACH
           2.2.2 DEMAND-SIDE APPROACH
                    FIGURE 4 MARKET SIZE ESTIMATION METHODOLOGY: DEMAND-SIDE APPROACH
    2.3 FORECAST NUMBER CALCULATION 
           2.3.1 SUPPLY SIDE
           2.3.2 DEMAND SIDE
    2.4 MARKET SIZE ESTIMATION 
          FIGURE 5 MARKET SIZE ESTIMATION METHODOLOGY: REVENUE OF MARKET PLAYERS
           2.4.1 BOTTOM-UP APPROACH
                    FIGURE 6 MARKET SIZE ESTIMATION METHODOLOGY: BOTTOM-UP APPROACH
           2.4.2 TOP-DOWN APPROACH
                    FIGURE 7 MARKET SIZE ESTIMATION METHODOLOGY: TOP-DOWN APPROACH
    2.5 DATA TRIANGULATION 
          FIGURE 8 ETHYL CYANOACETATE MARKET: DATA TRIANGULATION
    2.6 RESEARCH ASSUMPTIONS 
    2.7 IMPACT OF RECESSION 
    2.8 GROWTH FORECAST 
    2.9 RISK ASSESSMENT 
    2.10 FACTOR ANALYSIS 
 
3 EXECUTIVE SUMMARY (Page No. - 44)
    FIGURE 9 PHARMACEUTICAL GRADE TO LEAD MARKET DURING FORECAST PERIOD
    FIGURE 10 CHEMICAL INTERMEDIATE SEGMENT TO LEAD MARKET DURING FORECAST PERIOD
    FIGURE 11 PHARMACEUTICAL APPLICATION TO LEAD MARKET DURING FORECAST PERIOD
    FIGURE 12 ASIA PACIFIC TO LEAD MARKET DURING FORECAST PERIOD
 
4 PREMIUM INSIGHTS (Page No. - 48)
    4.1 ATTRACTIVE OPPORTUNITIES FOR PLAYERS IN ETHYL CYANOACETATE MARKET 
          FIGURE 13 GROWING DEMAND FROM AGROCHEMICAL AND PHARMACEUTICAL APPLICATIONS TO DRIVE MARKET
    4.2 ETHYL CYANOACETATE MARKET, BY GRADE 
          FIGURE 14 INDUSTRIAL GRADE TO BE FASTEST-GROWING SEGMENT DURING FORECAST PERIOD
    4.3 ETHYL CYANOACETATE MARKET, BY COUNTRY 
          FIGURE 15 CHINA TO BE FASTEST-GROWING MARKET DURING FORECAST PERIOD
 
5 MARKET OVERVIEW (Page No. - 50)
    5.1 INTRODUCTION 
    5.2 MARKET DYNAMICS 
          FIGURE 16 DRIVERS, RESTRAINTS, OPPORTUNITIES, AND CHALLENGES IN ETHYL CYANOACETATE MARKET
           5.2.1 DRIVERS
                    5.2.1.1 Increasing demand from pharmaceutical industry
                    5.2.1.2 Rise in demand for specialty chemicals
                    5.2.1.3 Technological advancements in synthesis processes
           5.2.2 RESTRAINTS
                    5.2.2.1 Stringent regulatory compliances and sustainability criteria
                    5.2.2.2 Raw material availability and price volatility
           5.2.3 OPPORTUNITIES
                    5.2.3.1 Emerging & new applications across various end-use industries
           5.2.4 CHALLENGES
                    5.2.4.1 Increased competition from alternative materials
 
6 INDUSTRY TRENDS (Page No. - 56)
    6.1 INTRODUCTION 
    6.2 TRENDS/DISRUPTIONS IMPACTING CUSTOMER BUSINESS 
           6.2.1 REVENUE SHIFT AND NEW REVENUE POCKETS FOR ETHYL CYANOACETATE MANUFACTURERS
                    FIGURE 17 REVENUE SHIFT OF ETHYL CYANOACETATE MARKET
    6.3 SUPPLY CHAIN ANALYSIS 
          FIGURE 18 ETHYL CYANOACETATE MARKET: VALUE CHAIN ANALYSIS
           6.3.1 RAW MATERIAL SUPPLIERS
           6.3.2 CHEMICAL SYNTHESIS AND MANUFACTURING
           6.3.3 STORAGE & DISTRIBUTION
           6.3.4 END-USE INDUSTRIES
    6.4 PRICING ANALYSIS 
           6.4.1 AVERAGE SELLING PRICE TREND, BY REGION
                    TABLE 1 AVERAGE SELLING PRICE, BY REGION, 2020–2029 (USD/TON)
                    FIGURE 19 ETHYL CYANOACETATE MARKET: AVERAGE SELLING PRICE TREND, BY REGION
           6.4.2 AVERAGE SELLING PRICE TREND, BY GRADE
                    TABLE 2 AVERAGE SELLING PRICE, BY TYPE, 2020–2029 (USD/TON)
           6.4.3 AVERAGE SELLING PRICE TREND OF KEY PLAYERS, BY TOP 3 GRADES
                    TABLE 3 AVERAGE SELLING PRICE OF KEY PLAYERS, BY GRADE, 2020–2029 (USD/TON)
                    FIGURE 20 AVERAGE SELLING PRICE TREND OF KEY PLAYERS FOR TOP 3 GRADES
    6.5 ECOSYSTEM MAP 
          FIGURE 21 ETHYL CYANOACETATE MARKET ECOSYSTEM
          TABLE 4 ETHYL CYANOACETATE MARKET: ECOSYSTEM
    6.6 TECHNOLOGY ANALYSIS 
          TABLE 5 KEY TECHNOLOGIES OFFERED IN ETHYL CYANOACETATE MARKET
          TABLE 6 COMPLEMENTARY TECHNOLOGIES OFFERED IN ETHYL CYANOACETATE MARKET
          TABLE 7 ADJACENT TECHNOLOGIES OFFERED IN ETHYL CYANOACETATE MARKET
    6.7 PATENT ANALYSIS 
           6.7.1 METHODOLOGY
           6.7.2 GRANTED PATENTS, 2013–2023
                    TABLE 8 TOTAL NUMBER OF PATENTS
                    6.7.2.1 Publication trends over last ten years
                                FIGURE 22 PATENTS GRANTED OVER LAST TEN YEARS
           6.7.3 INSIGHTS
           6.7.4 LEGAL STATUS
                    6.7.4.1 The legal status search was conducted to determine if one or more patents are active, inactive, or abandoned.
                                FIGURE 23 PATENT ANALYSIS, BY LEGAL STATUS
           6.7.5 JURISDICTION ANALYSIS
                    FIGURE 24 REGIONAL ANALYSIS OF PATENTS GRANTED FOR ETHYL CYANOACETATE MARKET, 2023
           6.7.6 TOP APPLICANTS
                    FIGURE 25 TOP 10 COMPANIES WITH HIGHEST NUMBER OF PATENTS IN LAST TEN YEARS
                    TABLE 9 MAJOR PATENT OWNERS FOR ETHYL CYANOACETATE
           6.7.7 KEY PATENTS FOR ETHYL CYANOACETATE
                    TABLE 10 ETHYL CYANOACETATE MARKET: MAJOR PATENTS
    6.8 TRADE ANALYSIS 
           6.8.1 IMPORT SCENARIO
                    FIGURE 26 IMPORTS OF ETHYL CYANOACETATE, BY COUNTRY, 2020–2023 (USD THOUSAND)
           6.8.2 EXPORT SCENARIO
                    FIGURE 27 EXPORTS OF ETHYL CYANOACETATE, BY COUNTRY, 2020–2023 (USD THOUSAND)
    6.9 KEY CONFERENCES AND EVENTS IN 2024–2025 
           TABLE 11 ETHYL CYANOACETATE MARKET: KEY CONFERENCES AND EVENTS, 2024–2025
    6.10 TARIFF AND REGULATORY LANDSCAPE 
           6.10.1 TARIFF AND REGULATIONS RELATED TO ETHYL CYANOACETATE
                     TABLE 12 TARIFFS RELATED TO ETHYL CYANOACETATE MARKET
           6.10.2 REGULATORY BODIES, GOVERNMENT AGENCIES, AND OTHER ORGANIZATIONS
                     TABLE 13 NORTH AMERICA: REGULATORY BODIES, GOVERNMENT AGENCIES, AND OTHER ORGANIZATIONS
                     TABLE 14 EUROPE: REGULATORY BODIES, GOVERNMENT AGENCIES, AND OTHER ORGANIZATIONS
                     TABLE 15 ASIA PACIFIC: REGULATORY BODIES, GOVERNMENT AGENCIES, AND OTHER ORGANIZATIONS
                     TABLE 16 MIDDLE EAST & AFRICA: REGULATORY BODIES, GOVERNMENT AGENCIES, AND OTHER ORGANIZATIONS
                     TABLE 17 SOUTH AMERICA: REGULATORY BODIES, GOVERNMENT AGENCIES, AND OTHER ORGANIZATIONS
           6.10.3 REGULATIONS RELATED TO ETHYL CYANOACETATE MARKET
                     TABLE 18 REGULATIONS FOR ETHYL CYANOACETATE MARKET
    6.11 PORTER’S FIVE FORCES ANALYSIS 
           TABLE 19 IMPACT OF PORTER’S FIVE FORCES ON ETHYL CYANOACETATE MARKET
           FIGURE 28 PORTER’S FIVE FORCES ANALYSIS: ETHYL CYANOACETATE MARKET
           6.11.1 THREAT OF NEW ENTRANTS
           6.11.2 THREAT OF SUBSTITUTES
           6.11.3 BARGAINING POWER OF SUPPLIERS
           6.11.4 BARGAINING POWER OF BUYERS
           6.11.5 INTENSITY OF COMPETITIVE RIVALRY
    6.12 KEY STAKEHOLDERS AND BUYING CRITERIA 
           6.12.1 KEY STAKEHOLDERS IN BUYING PROCESS
                     FIGURE 29 INFLUENCE OF STAKEHOLDERS ON BUYING PROCESS FOR TOP THREE END-USE INDUSTRIES
                     TABLE 20 INFLUENCE OF INSTITUTIONAL BUYERS ON BUYING PROCESS FOR TOP THREE END-USE INDUSTRIES
           6.12.2 BUYING CRITERIA
                     FIGURE 30 KEY BUYING CRITERIA FOR APPLICATIONS
                     TABLE 21 KEY BUYING CRITERIA FOR END-USE INDUSTRIES
           6.12.3 MACROECONOMIC INDICATORS
                    6.12.3.1 GDP Trends and Forecasts of Major Economies
                                 TABLE 22 GDP TRENDS AND FORECASTS, BY KEY COUNTRY, 2020–2029 (USD MILLION)
    6.13 CASE STUDY ANALYSIS 
           6.13.1 INNOVATIVE UTILIZATION OF ETHYL CYANOACETATE AS CYANATING AGENT IN PALLADIUM-CATALYZED CYANATION OF ARYL HALIDES
           6.13.2 OPTIMIZATION OF ETHYL CYANOACETATE SYNTHESIS VIA ESTERIFICATION: CATALYST SELECTION AND PROCESS ENHANCEMENT
 
7 ETHYL CYANOACETATE MARKET, BY GRADE (Page No. - 83)
    7.1 INTRODUCTION 
          FIGURE 31 PHARMACEUTICAL GRADE TO LEAD ETHYL CYANOACETATE MARKET DURING FORECAST PERIOD
          TABLE 23 ETHYL CYANOACETATE MARKET, BY GRADE, 2020–2023 (USD MILLION)
          TABLE 24 ETHYL CYANOACETATE MARKET, BY GRADE, 2024–2029 (USD MILLION)
          TABLE 25 ETHYL CYANOACETATE MARKET, BY GRADE, 2020–2023 (METRIC TON)
          TABLE 26 ETHYL CYANOACETATE MARKET, BY GRADE, 2024–2029 (METRIC TON)
    7.2 PHARMACEUTICAL GRADE 
           7.2.1 ENHANCED SAFETY, EFFICACY, AND REGULATORY ADHERENCE FOR PHARMACEUTICAL APPLICATIONS TO DRIVE DEMAND
    7.3 INDUSTRIAL GRADE 
           7.3.1 COST EFFICIENCY, VERSATILITY, AND SCALABILITY TO SUPPORT VARIOUS INDUSTRIAL APPLICATIONS
    7.4 OTHER GRADES 
           7.4.1 TECHNICAL GRADE
           7.4.2 FOOD GRADE
           7.4.3 ELECTRONIC GRADE
 
8 ETHYL CYANOACETATE MARKET, BY FUNCTION (Page No. - 88)
    8.1 INTRODUCTION 
          FIGURE 32 CHEMICAL INTERMEDIATES TO LEAD MARKET DURING FORECAST PERIOD
          TABLE 27 ETHYL CYANOACETATE MARKET, BY FUNCTION, 2020–2023 (USD MILLION)
          TABLE 28 ETHYL CYANOACETATE MARKET, BY FUNCTION, 2024–2029 (USD MILLION)
    8.2 CHEMICAL INTERMEDIATES 
           8.2.1 APPLICATIONS IN ORGANIC SYNTHESIS, HETEROCYCLIC CHEMISTRY, AND SPECIALTY CHEMICALS TO DRIVE MARKET
    8.3 POLYMERIZATION 
           8.3.1 VERSATILITY IN POLYMERIZATION LEADING TO PRODUCTION OF ADVANCED MATERIALS AND TAILORED SOLUTIONS TO DRIVE MARKET
    8.4 CROSS-LINKING AGENTS 
           8.4.1 ENHANCED MECHANICAL PROPERTIES LIKE CHEMICAL AND THERMAL RESISTANCE TO DRIVE MARKET
    8.5 CATALYSTS 
           8.5.1 ENHANCED REACTION KINETICS AND SELECTIVITY IN CHEMICAL TRANSFORMATION TO DRIVE DEMAND
    8.6 STABILIZERS OR ADDITIVES 
           8.6.1 ENHANCED PRODUCT PERFORMANCE, STABILITY, AND SHELF LIFE TO DRIVE MARKET
    8.7 OTHER FUNCTIONS 
           8.7.1 SOLVENT & DILUENT
           8.7.2 SURFACTANT OR EMULSIFIER
 
9 ETHYL CYANOACETATE MARKET, BY APPLICATION (Page No. - 94)
    9.1 INTRODUCTION 
          FIGURE 33 AGROCHEMICAL TO BE LARGEST SEGMENT OF MARKET DURING FORECAST PERIOD
          TABLE 29 ETHYL CYANOACETATE MARKET, BY APPLICATION, 2020–2023 (USD MILLION)
          TABLE 30 ETHYL CYANOACETATE MARKET, BY APPLICATION, 2024–2029 (USD MILLION)
    9.2 PHARMACEUTICAL 
           9.2.1 ADAPTABILITY AND VARIETY OF USES TO DRIVE DEMAND
    9.3 AGROCHEMICAL 
           9.3.1 USE AS PRECURSOR IN PRODUCTION OF PESTICIDES AND HERBICIDES TO DRIVE DEMAND
    9.4 ADHESIVES 
           9.4.1 ENHANCED PERFORMANCE OF ADHESIVES AND COATING PRODUCTS TO DRIVE MARKET
    9.5 DYES 
           9.5.1 EXTENSIVE USE IN TEXTILE INDUSTRY FOR COLORING FABRICS TO DRIVE DEMAND
 
10 ETHYL CYANOACETATE MARKET, BY REGION (Page No. - 99)
     10.1 INTRODUCTION 
            FIGURE 34 ASIA PACIFIC TO BE FASTEST-GROWING MARKET DURING FORECAST PERIOD
            TABLE 31 ETHYL CYANOACETATE MARKET, BY REGION, 2020–2023 (USD MILLION)
            TABLE 32 ETHYL CYANOACETATE MARKET, BY REGION, 2024–2029 (USD MILLION)
            TABLE 33 ETHYL CYANOACETATE MARKET, BY REGION, 2020–2023 (METRIC TON)
            TABLE 34 ETHYL CYANOACETATE MARKET, BY REGION, 2024–2029 (METRIC TON)
            TABLE 35 ETHYL CYANOACETATE MARKET, BY GRADE, 2020–2023 (USD MILLION)
            TABLE 36 ETHYL CYANOACETATE MARKET, BY GRADE, 2024–2029 (USD MILLION)
            TABLE 37 ETHYL CYANOACETATE MARKET, BY GRADE, 2020–2023 (METRIC TON)
            TABLE 38 ETHYL CYANOACETATE MARKET, BY GRADE, 2024–2029 (METRIC TON)
            TABLE 39 ETHYL CYANOACETATE MARKET, BY FUNCTION, 2020–2023 (USD MILLION)
            TABLE 40 ETHYL CYANOACETATE MARKET, BY FUNCTION, 2024–2029 (USD MILLION)
            TABLE 41 ETHYL CYANOACETATE MARKET, BY APPLICATION, 2020–2023 (USD MILLION)
            TABLE 42 ETHYL CYANOACETATE MARKET, BY APPLICATION, 2024–2029 (USD MILLION)
     10.2 ASIA PACIFIC 
             10.2.1 RECESSION IMPACT
                        FIGURE 35 ASIA PACIFIC: ETHYL CYANOACETATE MARKET SNAPSHOT
                        TABLE 43 ASIA PACIFIC: ETHYL CYANOACETATE MARKET, BY COUNTRY, 2020–2023 (USD MILLION)
                        TABLE 44 ASIA PACIFIC: ETHYL CYANOACETATE MARKET, BY COUNTRY, 2024–2029 (USD MILLION)
                        TABLE 45 ASIA PACIFIC: ETHYL CYANOACETATE MARKET, BY COUNTRY, 2020–2023 (METRIC TON)
                        TABLE 46 ASIA PACIFIC: ETHYL CYANOACETATE MARKET, BY COUNTRY, 2024–2029 (METRIC TON)
                        TABLE 47 ASIA PACIFIC: ETHYL CYANOACETATE MARKET, BY GRADE, 2020–2023 (USD MILLION)
                        TABLE 48 ASIA PACIFIC: ETHYL CYANOACETATE MARKET, BY GRADE, 2024–2029 (USD MILLION)
                        TABLE 49 ASIA PACIFIC: ETHYL CYANOACETATE MARKET, BY GRADE, 2020–2023 (METRIC TON)
                        TABLE 50 ASIA PACIFIC: ETHYL CYANOACETATE MARKET, BY GRADE, 2024–2029 (METRIC TON)
                        TABLE 51 ASIA PACIFIC: ETHYL CYANOACETATE MARKET, FUNCTION, 2020–2023 (USD MILLION)
                        TABLE 52 ASIA PACIFIC: ETHYL CYANOACETATE MARKET, BY FUNCTION, 2024–2029 (USD MILLION)
                        TABLE 53 ASIA PACIFIC: ETHYL CYANOACETATE MARKET, BY APPLICATION, 2020–2023 (USD MILLION)
                        TABLE 54 ASIA PACIFIC: ETHYL CYANOACETATE MARKET, BY APPLICATION, 2024–2029 (USD MILLION)
             10.2.2 CHINA
                        10.2.2.1 Massive chemical manufacturing capacity, abundant raw materials, and skilled labor force to drive market
                                     TABLE 55 CHINA: ETHYL CYANOACETATE MARKET, BY APPLICATION, 2020–2023 (USD MILLION)
                                     TABLE 56 CHINA: ETHYL CYANOACETATE MARKET, BY APPLICATION, 2024–2029 (USD MILLION)
             10.2.3 JAPAN
                        10.2.3.1 Research and development investments to drive market
                                     TABLE 57 JAPAN: ETHYL CYANOACETATE MARKET, BY APPLICATION, 2020–2023 (USD MILLION)
                                     TABLE 58 JAPAN: ETHYL CYANOACETATE MARKET, BY APPLICATION, 2024–2029 (USD MILLION)
             10.2.4 INDIA
                        10.2.4.1 Expanding pharmaceutical and agrochemical sectors to drive demand
                                     TABLE 59 INDIA: ETHYL CYANOACETATE MARKET, BY APPLICATION, 2020–2023 (USD MILLION)
                                     TABLE 60 INDIA: ETHYL CYANOACETATE MARKET, BY APPLICATION, 2024–2029 (USD MILLION)
             10.2.5 SOUTH KOREA
                        10.2.5.1 Favorable government initiatives and policies to promote market growth
                                     TABLE 61 SOUTH KOREA: ETHYL CYANOACETATE MARKET, BY APPLICATION, 2020–2023 (USD MILLION)
                                     TABLE 62 SOUTH KOREA: ETHYL CYANOACETATE MARKET, BY APPLICATION, 2024–2029 (USD MILLION)
             10.2.6 REST OF ASIA PACIFIC
                        TABLE 63 REST OF ASIA PACIFIC: ETHYL CYANOACETATE MARKET, BY APPLICATION, 2020–2023 (USD MILLION)
                        TABLE 64 REST OF ASIA PACIFIC: ETHYL CYANOACETATE MARKET, BY APPLICATION, 2024–2029 (USD MILLION)
     10.3 NORTH AMERICA 
             10.3.1 RECESSION IMPACT
                        FIGURE 36 NORTH AMERICA: ETHYL CYANOACETATE MARKET SNAPSHOT
                        TABLE 65 NORTH AMERICA: ETHYL CYANOACETATE MARKET, BY COUNTRY, 2020–2023 (USD MILLION)
                        TABLE 66 NORTH AMERICA: ETHYL CYANOACETATE MARKET, BY COUNTRY, 2024–2029 (USD MILLION)
                        TABLE 67 NORTH AMERICA: ETHYL CYANOACETATE MARKET, BY COUNTRY, 2020–2023 (METRIC TON)
                        TABLE 68 NORTH AMERICA: ETHYL CYANOACETATE MARKET, BY COUNTRY, 2024–2029 (METRIC TON)
                        TABLE 69 NORTH AMERICA: ETHYL CYANOACETATE MARKET, BY GRADE, 2020–2023 (USD MILLION)
                        TABLE 70 NORTH AMERICA: ETHYL CYANOACETATE MARKET, BY GRADE, 2024–2029 (USD MILLION)
                        TABLE 71 NORTH AMERICA: ETHYL CYANOACETATE MARKET, BY GRADE, 2020–2023 (METRIC TON)
                        TABLE 72 NORTH AMERICA: ETHYL CYANOACETATE MARKET, BY GRADE, 2024–2029 (METRIC TON)
                        TABLE 73 NORTH AMERICA: ETHYL CYANOACETATE MARKET, BY FUNCTION, 2020–2023 (USD MILLION)
                        TABLE 74 NORTH AMERICA: ETHYL CYANOACETATE MARKET, BY FUNCTION, 2024–2029 (USD MILLION)
                        TABLE 75 NORTH AMERICA: ETHYL CYANOACETATE MARKET, BY APPLICATION, 2020–2023 (USD MILLION)
                        TABLE 76 NORTH AMERICA: ETHYL CYANOACETATE MARKET, BY APPLICATION, 2024–2029 (USD MILLION)
             10.3.2 US
                        10.3.2.1 Largest and most established pharmaceutical and chemical industries to drive market
                                     TABLE 77 US: ETHYL CYANOACETATE MARKET, BY APPLICATION, 2020–2023 (USD MILLION)
                                     TABLE 78 US: ETHYL CYANOACETATE MARKET, BY APPLICATION, 2024–2029 (USD MILLION)
             10.3.3 CANADA
                        10.3.3.1 Growing pharmaceutical and chemical industries and domestic manufacturing support to drive market
                                     TABLE 79 CANADA: ETHYL CYANOACETATE MARKET, BY APPLICATION, 2020–2023 (USD MILLION)
                                     TABLE 80 CANADA: ETHYL CYANOACETATE MARKET, BY APPLICATION, 2024–2029 (USD MILLION)
             10.3.4 MEXICO
                        10.3.4.1 Emergence as manufacturing hub to drive demand
                                     TABLE 81 MEXICO: ETHYL CYANOACETATE MARKET, BY APPLICATION, 2020–2023 (USD MILLION)
                                     TABLE 82 MEXICO: ETHYL CYANOACETATE MARKET, BY APPLICATION, 2024–2029 (USD MILLION)
     10.4 EUROPE 
             10.4.1 RECESSION IMPACT
                        FIGURE 37 EUROPE: ETHYL CYANOACETATE MARKET SNAPSHOT
                        TABLE 83 EUROPE: ETHYL CYANOACETATE MARKET, BY COUNTRY, 2020–2023 (USD MILLION)
                        TABLE 84 EUROPE: ETHYL CYANOACETATE MARKET, BY COUNTRY, 2024–2029 (USD MILLION)
                        TABLE 85 EUROPE: ETHYL CYANOACETATE MARKET, BY COUNTRY, 2020–2023 (METRIC TON)
                        TABLE 86 EUROPE: ETHYL CYANOACETATE MARKET, BY COUNTRY, 2024–2029 (METRIC TON)
                        TABLE 87 EUROPE: ETHYL CYANOACETATE MARKET, BY GRADE, 2020–2023 (USD MILLION)
                        TABLE 88 EUROPE: ETHYL CYANOACETATE MARKET, BY GRADE, 2024–2029 (USD MILLION)
                        TABLE 89 EUROPE: ETHYL CYANOACETATE MARKET, BY GRADE, 2020–2023 (METRIC TON)
                        TABLE 90 EUROPE: ETHYL CYANOACETATE MARKET, BY GRADE, 2024–2029 (METRIC TON)
                        TABLE 91 EUROPE: ETHYL CYANOACETATE MARKET, BY FUNCTION, 2020–2023 (USD MILLION)
                        TABLE 92 EUROPE: ETHYL CYANOACETATE MARKET, BY FUNCTION, 2024–2029 (USD MILLION)
                        TABLE 93 EUROPE: ETHYL CYANOACETATE MARKET, BY APPLICATION, 2020–2023 (USD MILLION)
                        TABLE 94 EUROPE: ETHYL CYANOACETATE MARKET, BY APPLICATION, 2024–2029 (USD MILLION)
             10.4.2 GERMANY
                        10.4.2.1 Increasing use in specialty chemical formulations to drive demand
                                     TABLE 95 GERMANY: ETHYL CYANOACETATE MARKET, BY APPLICATION, 2020–2023 (USD MILLION)
                                     TABLE 96 GERMANY: ETHYL CYANOACETATE MARKET, BY APPLICATION, 2024–2029 (USD MILLION)
             10.4.3 ITALY
                        10.4.3.1 Established manufacturing and textile sectors, along with sustainability initiatives, to drive market
                                     TABLE 97 ITALY: ETHYL CYANOACETATE MARKET, BY APPLICATION, 2020–2023 (USD MILLION)
                                     TABLE 98 ITALY: ETHYL CYANOACETATE MARKET, BY APPLICATION, 2024–2029 (USD MILLION)
             10.4.4 FRANCE
                        10.4.4.1 Growth in adhesive, sealant, and coating sectors to drive market
                                     TABLE 99 FRANCE: ETHYL CYANOACETATE MARKET, BY APPLICATION, 2020–2023 (USD MILLION)
                                     TABLE 100 FRANCE: ETHYL CYANOACETATE MARKET, BY APPLICATION, 2024–2029 (USD MILLION)
             10.4.5 UK
                        10.4.5.1 Leading position in pharmaceutical R&D sector to drive market
                                     TABLE 101 UK: ETHYL CYANOACETATE MARKET, BY APPLICATION, 2020–2023 (USD MILLION)
                                     TABLE 102 UK: ETHYL CYANOACETATE MARKET, BY APPLICATION, 2024–2029 (USD MILLION)
             10.4.6 SPAIN
                        10.4.6.1 R&D in pharmaceutical and chemical sectors to drive demand
                                     TABLE 103 SPAIN: ETHYL CYANOACETATE MARKET, BY APPLICATION, 2020–2023 (USD MILLION)
                                     TABLE 104 SPAIN: ETHYL CYANOACETATE MARKET, BY APPLICATION, 2024–2029 (USD MILLION)
             10.4.7 RUSSIA
                        10.4.7.1 Resurgence of chemical industry to drive demand
                                     TABLE 105 RUSSIA: ETHYL CYANOACETATE MARKET, BY APPLICATION, 2020–2023 (USD MILLION)
                                     TABLE 106 RUSSIA: ETHYL CYANOACETATE MARKET, BY APPLICATION, 2024–2029 (USD MILLION)
             10.4.8 REST OF EUROPE
                        TABLE 107 REST OF EUROPE: ETHYL CYANOACETATE MARKET, BY APPLICATION, 2020–2023 (USD MILLION)
                        TABLE 108 REST OF EUROPE: ETHYL CYANOACETATE MARKET, BY APPLICATION, 2024–2029 (USD MILLION)
     10.5 MIDDLE EAST & AFRICA 
             10.5.1 RECESSION IMPACT
             10.5.2 GCC COUNTRIES
                        TABLE 109 MIDDLE EAST & AFRICA: ETHYL CYANOACETATE MARKET, BY COUNTRY, 2020–2023 (USD MILLION)
                        TABLE 110 MIDDLE EAST & AFRICA: ETHYL CYANOACETATE MARKET, BY COUNTRY, 2024–2029 (USD MILLION)
                        TABLE 111 MIDDLE EAST & AFRICA: ETHYL CYANOACETATE MARKET, BY COUNTRY, 2020–2023 (METRIC TON)
                        TABLE 112 MIDDLE EAST & AFRICA: ETHYL CYANOACETATE MARKET, BY COUNTRY, 2024–2029 (METRIC TON)
                        TABLE 113 MIDDLE EAST & AFRICA: ETHYL CYANOACETATE MARKET, BY GRADE, 2020–2023 (USD MILLION)
                        TABLE 114 MIDDLE EAST & AFRICA: ETHYL CYANOACETATE MARKET, BY GRADE, 2024–2029 (USD MILLION)
                        TABLE 115 MIDDLE EAST & AFRICA: ETHYL CYANOACETATE MARKET, BY GRADE, 2020–2023 (METRIC TON)
                        TABLE 116 MIDDLE EAST & AFRICA: ETHYL CYANOACETATE MARKET, BY GRADE, 2024–2029 (METRIC TON)
                        TABLE 117 MIDDLE EAST & AFRICA: ETHYL CYANOACETATE MARKET, BY FUNCTION, 2020–2023 (USD MILLION)
                        TABLE 118 MIDDLE EAST & AFRICA: ETHYL CYANOACETATE MARKET, BY FUNCTION, 2024–2029 (USD MILLION)
                        TABLE 119 MIDDLE EAST & AFRICA: ETHYL CYANOACETATE MARKET, BY APPLICATION, 2020–2023 (USD MILLION)
                        TABLE 120 MIDDLE EAST & AFRICA: ETHYL CYANOACETATE MARKET, BY APPLICATION, 2024–2029 (USD MILLION)
                        10.5.2.1 Saudi Arabia
                                     10.5.2.1.1 Reducing dependence on oil and cultivating robust domestic chemical industry to drive demand
                                                     TABLE 121 SAUDI ARABIA: ETHYL CYANOACETATE MARKET, BY APPLICATION, 2020–2023 (USD MILLION)
                                                     TABLE 122 SAUDI ARABIA: ETHYL CYANOACETATE MARKET, BY APPLICATION, 2024–2029 (USD MILLION)
                        10.5.2.2 UAE
                                     10.5.2.2.1 Strategic location and economic diversification to drive market
                                                     TABLE 123 UAE: ETHYL CYANOACETATE MARKET, BY APPLICATION, 2020–2023 (USD MILLION)
                                                     TABLE 124 UAE: ETHYL CYANOACETATE MARKET, BY APPLICATION, 2024–2029 (USD MILLION)
                        10.5.2.3 Rest of GCC countries
                                     TABLE 125 REST OF GCC COUNTRIES: ETHYL CYANOACETATE MARKET, BY APPLICATION, 2020–2023 (USD MILLION)
                                     TABLE 126 REST OF GCC COUNTRIES: ETHYL CYANOACETATE MARKET, BY APPLICATION, 2024–2029 (USD MILLION)
                        10.5.2.4 South Africa
                                     10.5.2.4.1 Innovative research in pharmaceuticals and agrochemicals to drive growth
                                                     TABLE 127 SOUTH AFRICA: ETHYL CYANOACETATE MARKET, BY APPLICATION, 2020–2023 (USD MILLION)
                                                     TABLE 128 SOUTH AFRICA: ETHYL CYANOACETATE MARKET, BY APPLICATION, 2024–2029 (USD MILLION)
                        10.5.2.5 Rest of Middle East & Africa
                                     TABLE 129 REST OF MIDDLE EAST & AFRICA: ETHYL CYANOACETATE MARKET, BY APPLICATION, 2020–2023 (USD MILLION)
                                     TABLE 130 REST OF MIDDLE EAST & AFRICA: ETHYL CYANOACETATE MARKET, BY APPLICATION, 2024–2029 (USD MILLION)
     10.6 SOUTH AMERICA 
             10.6.1 RECESSION IMPACT
                        TABLE 131 SOUTH AMERICA: ETHYL CYANOACETATE MARKET, BY COUNTRY, 2020–2023 (USD MILLION)
                        TABLE 132 SOUTH AMERICA: ETHYL CYANOACETATE MARKET, BY COUNTRY, 2024–2029 (USD MILLION)
                        TABLE 133 SOUTH AMERICA: ETHYL CYANOACETATE MARKET, BY COUNTRY, 2020–2023 (METRIC TON)
                        TABLE 134 SOUTH AMERICA: ETHYL CYANOACETATE MARKET, BY COUNTRY, 2024–2029 (METRIC TON)
                        TABLE 135 SOUTH AMERICA: ETHYL CYANOACETATE MARKET, BY GRADE, 2020–2023 (USD MILLION)
                        TABLE 136 SOUTH AMERICA: ETHYL CYANOACETATE MARKET, BY GRADE, 2024–2029 (USD MILLION)
                        TABLE 137 SOUTH AMERICA: ETHYL CYANOACETATE MARKET, BY GRADE, 2020–2023 (METRIC TON)
                        TABLE 138 SOUTH AMERICA: ETHYL CYANOACETATE MARKET, BY GRADE, 2024–2029 (METRIC TON)
                        TABLE 139 SOUTH AMERICA: ETHYL CYANOACETATE MARKET, BY FUNCTION, 2020–2023 (USD MILLION)
                        TABLE 140 SOUTH AMERICA: ETHYL CYANOACETATE MARKET, BY FUNCTION, 2024–2029(USD MILLION)
                        TABLE 141 SOUTH AMERICA: ETHYL CYANOACETATE MARKET, BY APPLICATION, 2020–2023 (USD MILLION)
                        TABLE 142 SOUTH AMERICA: ETHYL CYANOACETATE MARKET, BY APPLICATION, 2024–2029 (USD MILLION)
             10.6.2 ARGENTINA
                        10.6.2.1 Emerging industrial sector to drive market
                                     TABLE 143 ARGENTINA: ETHYL CYANOACETATE MARKET, BY APPLICATION, 2020–2023 (USD MILLION)
                                     TABLE 144 ARGENTINA: ETHYL CYANOACETATE MARKET, BY APPLICATION, 2024–2029 (USD MILLION)
             10.6.3 BRAZIL
                        10.6.3.1 Expansion of agriculture sector to drive market
                                     TABLE 145 BRAZIL: ETHYL CYANOACETATE MARKET, BY APPLICATION, 2020–2023 (USD MILLION)
                                     TABLE 146 BRAZIL: ETHYL CYANOACETATE MARKET, BY APPLICATION, 2024–2029 (USD MILLION)
             10.6.4 REST OF SOUTH AMERICA
                        TABLE 147 REST OF SOUTH AMERICA: ETHYL CYANOACETATE MARKET, BY APPLICATION, 2020–2023 (USD MILLION)
                        TABLE 148 REST OF SOUTH AMERICA: ETHYL CYANOACETATE MARKET, BY APPLICATION, 2024–2029 (USD MILLION)
 
11 COMPETITIVE LANDSCAPE (Page No. - 152)
     11.1 INTRODUCTION 
     11.2 KEY PLAYER STRATEGIES/RIGHT TO WIN 
             TABLE 149 OVERVIEW OF STRATEGIES ADOPTED BY KEY ETHYL CYANOACETATE MANUFACTURERS
     11.3 MARKET SHARE ANALYSIS 
             11.3.1 RANKING OF KEY MARKET PLAYERS, 2023
                        FIGURE 38 RANKING OF TOP FIVE PLAYERS IN ETHYL CYANOACETATE MARKET, 2022
             11.3.2 MARKET SHARE OF KEY PLAYERS
                        TABLE 150 ETHYL CYANOACETATE MARKET: DEGREE OF COMPETITION
                        FIGURE 39 ETHYL CYANOACETATE MARKET: SHARE OF KEY PLAYERS
     11.4 REVENUE ANALYSIS 
             FIGURE 40 REVENUE ANALYSIS OF KEY PLAYERS, 2020–2024
     11.5 BRAND/PRODUCT COMPARATIVE ANALYSIS 
             FIGURE 41 BRAND/PRODUCT COMPARATIVE ANALYSIS, BY SEGMENT
     11.6 COMPANY EVALUATION MATRIX, 2023 
             11.6.1 STARS
             11.6.2 EMERGING LEADERS
             11.6.3 PERVASIVE PLAYERS
             11.6.4 PARTICIPANTS
                        FIGURE 42 ETHYL CYANOACETATE MARKET: COMPANY EVALUATION MATRIX, 2023
             11.6.5 COMPANY FOOTPRINT
                        FIGURE 43 ETHYL CYANOACETATE MARKET: COMPANY OVERALL FOOTPRINT
                        TABLE 151 COMPANY GRADE FOOTPRINT (10 COMPANIES)
                        TABLE 152 COMPANY END-USE INDUSTRY FOOTPRINT (10 COMPANIES)
                        TABLE 153 COMPANY FUNCTION FOOTPRINT (10 COMPANIES)
                        TABLE 154 COMPANY REGION FOOTPRINT (10 COMPANIES)
     11.7 START-UP/SME EVALUATION MATRIX, 2023 
             11.7.1 PROGRESSIVE COMPANIES
             11.7.2 RESPONSIVE COMPANIES
             11.7.3 DYNAMIC COMPANIES
             11.7.4 STARTING BLOCKS
                        FIGURE 44 ETHYL CYANOACETATE MARKET: START-UPS/SMES EVALUATION MATRIX, 2023
             11.7.5 COMPETITIVE BENCHMARKING
                        TABLE 155 ETHYL CYANOACETATE MARKET: DETAILED LIST OF KEY START-UPS/SMES
                        TABLE 156 ETHYL CYANOACETATE MARKET: COMPETITIVE BENCHMARKING OF KEY START-UPS/SMES
             11.7.6 VALUATION AND FINANCIAL METRICS OF KEY ETHYL CYANOACETATE VENDORS
                        FIGURE 45 EV/EBITDA OF KEY VENDORS
                        FIGURE 46 YEAR-TO-DATE (YTD) PRICE TOTAL RETURN
     11.8 COMPETITIVE SCENARIO AND TRENDS 
             11.8.1 EXPANSIONS
                        TABLE 157 ETHYL CYANOACETATE MARKET: EXPANSIONS, MAY 2021–OCTOBER 2023
 
12 COMPANY PROFILES (Page No. - 168)
     12.1 KEY PLAYERS 
(Business Overview, Products/Solutions/Services Offered, Recent Developments, MnM view (Key strengths/Right to win, Strategic choices made, Weakness/competitive threats)*
             12.1.1 MERCK KGAA
                        TABLE 158 MERCK KGAA: COMPANY OVERVIEW
                        FIGURE 47 MERCK KGAA: COMPANY SNAPSHOT
                        TABLE 159 MERCK KGAA: PRODUCT OFFERINGS
                        TABLE 160 MERCK KGAA: EXPANSIONS
             12.1.2 TIANDE CHEMICAL HOLDINGS LIMITED.
                        TABLE 161 TIANDE CHEMICAL HOLDINGS LIMITED: COMPANY OVERVIEW
                        FIGURE 48 TIANDE CHEMICAL HOLDINGS LIMITED: COMPANY SNAPSHOT
                        TABLE 162 TIANDE CHEMICAL HOLDINGS LIMITED: PRODUCT OFFERINGS
             12.1.3 SHANDONG XINHUA PHARMACEUTICAL CO., LTD.
                        TABLE 163 SHANDONG XINHUA PHARMACEUTICAL CO., LTD.: COMPANY OVERVIEW
                        FIGURE 49 SHANDONG XINHUA PHARMACEUTICAL CO., LTD.: COMPANY SNAPSHOT
                        TABLE 164 SHANDONG XINHUA PHARMACEUTICAL CO., LTD.: PRODUCT OFFERINGS
             12.1.4 HEBEI CHENGXIN
                        TABLE 165 HEBEI CHENGXIN: COMPANY OVERVIEW
                        TABLE 166 HEBEI CHENGXIN: PRODUCT OFFERINGS
             12.1.5 TATEYAMA KASEI CO., LTD.
                        TABLE 167 TATEYAMA KASEI CO., LTD: COMPANY OVERVIEW
                        TABLE 168 TATEYAMA KASEI CO., LTD: PRODUCT OFFERINGS
             12.1.6 TRIVENI CHEMICALS
                        TABLE 169 TRIVENI CHEMICALS: COMPANY OVERVIEW
                        TABLE 170 TRIVENI CHEMICALS: PRODUCT OFFERINGS
             12.1.7 LOBA CHEMIE PVT. LTD.
                        TABLE 171 LOBA CHEMIE PVT. LTD.: COMPANY OVERVIEW
                        TABLE 172 LOBA CHEMIE PVT. LTD.: PRODUCT OFFERINGS
             12.1.8 SISCO RESEARCH LABORATORIES PVT. LTD.
                        TABLE 173 SISCO RESEARCH LABORATORIES PVT. LTD.: COMPANY OVERVIEW
                        TABLE 174 SISCO RESEARCH LABORATORIES PVT. LTD.: PRODUCT OFFERINGS
             12.1.9 EMCO DYESTUFF
                        TABLE 175 EMCO DYESTUFF: COMPANY OVERVIEW
                        TABLE 176 EMCO DYESTUFF: PRODUCT OFFERINGS
             12.1.10 TOKYO CHEMICAL INDUSTRY CO., LTD. (TCI)
                        TABLE 177 TOKYO CHEMICAL INDUSTRY CO., LTD. (TCI): COMPANY OVERVIEW
                        TABLE 178 TOKYO CHEMICAL INDUSTRY CO., LTD. (TCI): PRODUCT OFFERINGS
     12.2 OTHER PLAYERS 
             12.2.1 VIVAN LIFE SCIENCES
                        TABLE 179 VIVAN LIFE SCIENCES: COMPANY OVERVIEW
             12.2.2 IMPERIAL CHEMICAL CORPORATION
                        TABLE 180 IMPERIAL CHEMICAL CORPORATION: COMPANY OVERVIEW
             12.2.3 SIMSON PHARMA LIMITED
                        TABLE 181 SIMSON PHARMA LIMITED: COMPANY OVERVIEW
             12.2.4 JIAXING ISEN CHEMICAL CO., LTD
                        TABLE 182 JIAXING ISEN CHEMICAL CO., LTD: COMPANY OVERVIEW
             12.2.5 PARCHEM
                        TABLE 183 PARCHEM: COMPANY OVERVIEW
             12.2.6 KEMPHASOL
                        TABLE 184 KEMPHASOL: COMPANY OVERVIEW
             12.2.7 BIOSYNTH
                        TABLE 185 BIOSYNTH: COMPANY OVERVIEW
             12.2.8 BLDPHARM
                        TABLE 186 BLDPHARM: COMPANY OVERVIEW
             12.2.9 ALPHA CHEMIKA
                        TABLE 187 ALPHA CHEMIKA: COMPANY OVERVIEW
             12.2.10 OTTO CHEMIE PVT. LTD.
                        TABLE 188 OTTO CHEMIE PVT. LTD.: COMPANY OVERVIEW
             12.2.11 CENTRAL DRUG HOUSE
                        TABLE 189 CENTRAL DRUG HOUSE: COMPANY OVERVIEW
             12.2.12 JINAN XINGGAO CHEMICAL TECHNOLOGY CO., LTD.
                        TABLE 190 JINAN XINGGAO CHEMICAL TECHNOLOGY CO., LTD.: COMPANY OVERVIEW
             12.2.13 CHANGZHOU KANGRUI CHEMICALS CO., LTD.
                        TABLE 191 CHANGZHOU KANGRUI CHEMICALS CO., LTD.: COMPANY OVERVIEW
             12.2.14 CHEMWILL ASIA CO., LTD.
                        TABLE 192 CHEMWILL ASIA CO., LTD.: COMPANY OVERVIEW
             12.2.15 HEFEI TNJ CHEMICAL INDUSTRY CO., LTD.
                        TABLE 193 HEFEI TNJ CHEMICAL INDUSTRY CO., LTD.: COMPANY OVERVIEW
 
*Details on Business Overview, Products/Solutions/Services Offered, Recent Developments, MnM view (Key strengths/Right to win, Strategic choices made, Weakness/competitive threats)* might not be captured in case of unlisted companies.
 
13 APPENDIX (Page No. - 202)
     13.1 DISCUSSION GUIDE 
     13.2 KNOWLEDGESTORE: MARKETSANDMARKETS’ SUBSCRIPTION PORTAL 
     13.3 CUSTOMIZATION OPTIONS 
     13.4 RELATED REPORTS 
     13.5 AUTHOR DETAILS 

The study involved four major activities in estimating the market size of the Ethyl Cyanoacetate market. Exhaustive secondary research was done to collect information on the market, the peer market, and the parent market. The next step was to validate these findings, assumptions, and sizing with industry experts across the value chain through primary research. Both top-down and bottom-up approaches were employed to estimate the complete market size. Thereafter, the market breakdown and data triangulation procedures were used to estimate the market size of the segments and subsegments.

Secondary Research

In the secondary research process, various secondary sources have been referred to for identifying and collecting information for this study. These secondary sources include annual reports, press releases, investor presentations of companies, white papers, certified publications, trade directories, certified publications, articles from recognized authors, gold standard and silver standard websites, and databases.

Secondary research has been used to obtain key information about the value chain of the industry, monetary chain of the market, the total pool of key Ethyl Cyanoacetate, market classification and segmentation according to industry trends to the bottom-most level, and regional markets. It was also used to obtain information about the key developments from a market-oriented perspective.

Primary Research

The Ethyl Cyanoacetate market comprises several stakeholders in the value chain, which include raw material suppliers, manufacturers, and end users. Various primary sources from the supply and demand sides of the Ethyl Cyanoacetate market have been interviewed to obtain qualitative and quantitative information. The primary interviewees from the demand side include key opinion leaders in end-use sectors. The primary sources from the supply side include manufacturers, associations, and institutions involved in the Ethyl Cyanoacetate industry.

Primary interviews were conducted to gather insights such as market statistics, data of revenue collected from the products and services, market breakdowns, market size estimations, market forecasting, and data triangulation. Primary research also helped in understanding the various trends related to chemistry, application, and region. Stakeholders from the demand side, such as CIOs, CTOs, and CSOs were interviewed to understand the buyer’s perspective on the suppliers, products, component providers, and their current usage of Ethyl Cyanoacetate and future outlook of their business which will affect the overall market.

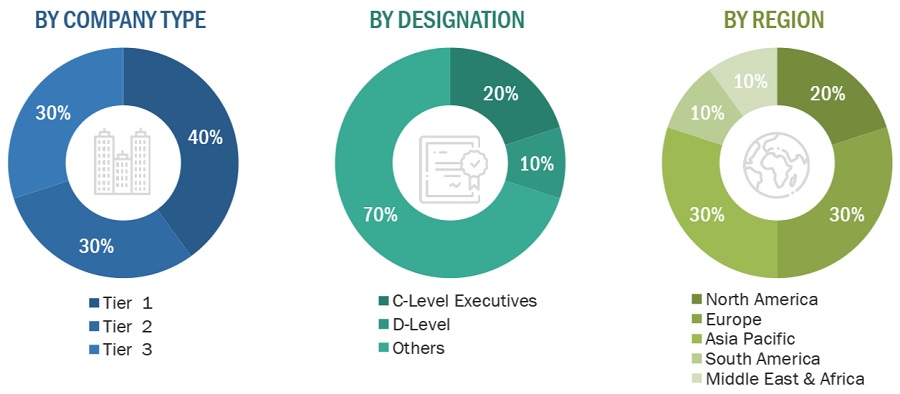
The breakdown of profiles of the primary interviewees is illustrated in the figure below:
Ethyl Cyanoacetate Market Size, and Share

Note: Tier 1, Tier 2, and Tier 3 companies are classified based on their market revenue in 2023 available in the public domain, product portfolios, and geographical presence.

Other designations include sales representatives, production heads, and technicians.

To know about the assumptions considered for the study, download the pdf brochure

Market Size Estimation

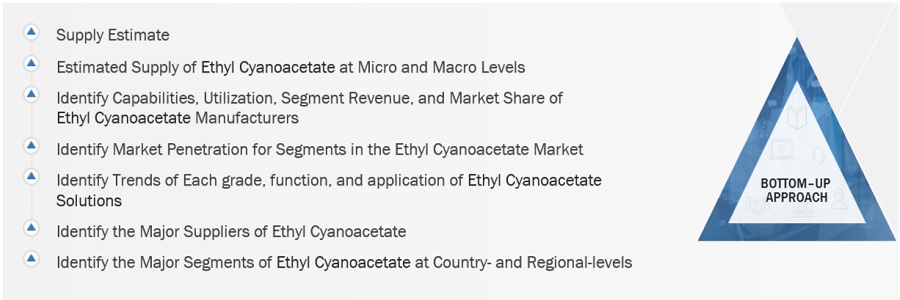
The top-down approach was used to estimate and validate the size of various submarkets for Ethyl Cyanoacetate for each region. The research methodology used to estimate the market size included the following steps:

  • The key players in the industry have been identified through extensive secondary research.
  • The supply chain of the industry has been determined through primary and secondary research.
  • The global market was then segmented into five major regions and validated by industry experts.
  • All percentage shares, splits, and breakdowns based on grade, function, end-use, and regions were determined using secondary sources and verified through primary sources.
  • All possible parameters that affect the markets covered in this research study were accounted for, viewed in extensive detail, verified through primary research, and analyzed to get the final quantitative and qualitative data. This data was consolidated and added with detailed inputs and analysis and presented in this report.

Ethyl Cyanoacetate Market: Bottum-Up Approach
Ethyl Cyanoacetate Market Size, and Share

To know about the assumptions considered for the study, Request for Free Sample Report

Source: Secondary Research, Interviews with Experts, and MarketsandMarkets Analysis

Ethyl Cyanoacetate Market: Top-Down Approach

Ethyl Cyanoacetate Market Size, and Share

Source: Secondary Research, Interviews with Experts, and MarketsandMarkets Analysis

Data Triangulation

After arriving at the total market size from the estimation process Ethyl Cyanoacetate above, the overall market has been split into several segments and sub-segments. To complete the overall market engineering process and arrive at the exact statistics for all the segments and sub-segments, the data triangulation and market breakdown procedures have been employed, wherever applicable. The data has been triangulated by studying various factors and trends from both the demand and supply sides. Along with this, the market size has been validated by using both the top-down and bottom-up approaches and primary interviews. Hence, for every data segment, there have been three sources—top-down approach, bottom-up approach, and expert interviews. The data was assumed correct when the values arrived from the three sources matched.

Market Definition

The Ethyl Cyanoacetate market refers to the commercial sector involved in the production, distribution, and sale of ethyl cyanoacetate , a versatile chemical compound used as an intermediate in various industries. Ethyl cyanoacetate finds extensive applications in pharmaceuticals, agrochemicals, adhesives, textiles, and other sectors, where it serves as a crucial building block in the synthesis of diverse compounds. Opportunities for ethyl cyanoacetate include the development of new derivatives and formulations tailored to specific industrial needs, fostering product diversification and market expansion. Technological advancements optimizing production processes, expanding applications and collaborations for innovation contribute and the trend towards eco-friendly solutions fuel market growth.

Key Stakeholders

  • Ethyl Cyanoacetate Manufacturers
  • Ethyl Cyanoacetate Traders, Distributors, and Suppliers
  • Raw Type Suppliers
  • Government and Private Research Organizations
  • Associations and Industrial Bodies
  • R&D Institutions
  • Environmental Support Agencies

Report Objectives

  • To define, describe, and forecast the size of the Ethyl Cyanoacetate market, in terms of value and volume.
  • To provide detailed information regarding the major factors (drivers, opportunities, restraints, and challenges) influencing the growth of the market.
  • To estimate and forecast the market size based on  grade, function, end-use, and region.
  • To forecast the size of the market with respect to major regions, namely, Europe, North America, Asia Pacific, Middle East & Africa, and South America, along with their key countries.
  • To strategically analyze micromarkets1 with respect to individual growth trends, prospects, and their contribution to the overall market.
  • To analyze opportunities in the market for stakeholders and provide a competitive landscape of market leaders.
  • To track and analyze recent developments such as expansions, new product launches, partnerships & agreements, and acquisitions in the market.
  • To strategically profile key market players and comprehensively analyze their core competencies.

Available Customizations

Along with the given market data, MarketsandMarkets offers customizations according to the company’s specific needs. The following customization options are available for the report:

Regional Analysis

  • Further breakdown of a region with respect to a particular country or additional application

Company Information

  • Detailed analysis and profiles of additional market players

Tariff & Regulations

  • Regulations and impact on Ethyl Cyanoacetate market

By Form Analysis

  • Market size for Ethyl Cyanoacetate in terms of value and volume
Custom Market Research Services

We will customize the research for you, in case the report listed above does not meet with your exact requirements. Our custom research will comprehensively cover the business information you require to help you arrive at strategic and profitable business decisions.

Request Customization
Report Code
CH 9040
Published ON
Jun, 2024
Choose License Type
BUY NOW
  • SHARE
X
Request Customization
Speak to Analyst
Speak to Analyst
OR FACE-TO-FACE MEETING
PERSONALIZE THIS RESEARCH
  • Triangulate with your Own Data
  • Get Data as per your Format and Definition
  • Gain a Deeper Dive on a Specific Application, Geography, Customer or Competitor
  • Any level of Personalization
REQUEST A FREE CUSTOMIZATION
LET US HELP YOU!
  • What are the Known and Unknown Adjacencies Impacting the Ethyl Cyanoacetate Market
  • What will your New Revenue Sources be?
  • Who will be your Top Customer; what will make them switch?
  • Defend your Market Share or Win Competitors
  • Get a Scorecard for Target Partners
CUSTOMIZED WORKSHOP REQUEST
knowledgestore logo

Want to explore hidden markets that can drive new revenue in Ethyl Cyanoacetate Market?

Find Hidden Markets
  • Call Us
  • +1-888-600-6441 (Corporate office hours)
  • +1-888-600-6441 (US/Can toll free)
  • +44-800-368-9399 (UK office hours)
CONNECT WITH US
ABOUT TRUST ONLINE
©2024 MarketsandMarkets Research Private Ltd. All rights reserved
DMCA.com Protection Status
Website Feedback