Employee Experience Management Market by Software (Integrated Software, Standalone Software), Standalone Software (Employee Survey & Feedback, Employee Engagement, Employee Recognition & Rewards, Employee Performance Management) - Global Forecast to 2028
[218 Pages Report] The employee experience management market size is projected to grow from USD 6.8 billion in 2023 to USD 11.1 billion by 2028 at a CAGR of 10.2% during the forecast period. The one-size-fits-all approach is crumbling as employees crave customized experiences tailored to their unique needs and preferences. Companies are embracing personalized learning paths, flexible benefits, and recognition programs, attracting and retaining loyal, motivated employees, ultimately gaining a competitive edge.
To know about the assumptions considered for the study, Request for Free Sample Report
To know about the assumptions considered for the study, download the pdf brochure
Employee Experience Management Market Growth Dynamics
Driver: Escalating demand for real-time performance management
Organizations are realizing the importance of adopting flexible and adaptive approaches to continuously evaluate, guide, and improve employee performance. This shift departs from traditional, infrequent performance reviews and instead embraces ongoing feedback loops and immediate recognition. Real-time performance management aligns with the changing work environment and meets the expectations of modern employees who seek prompt feedback and recognition. By utilizing technology and data analytics, solutions for employee experience management enable organizations to monitor and respond to performance metrics swiftly, leading to a more engaged and productive workforce. The increasing demand for real-time performance management as part of the broader employee experience management framework reflects a strategic focus on creating a responsive, adaptable, and supportive work environment that promotes individual and collective success.
Restraint: Data privacy concerns
As organizations continue to gather and analyze employee data to improve the overall employee experience, there is a growing concern about the possible invasion of privacy. Employees may feel uneasy about how much of their personal and professional information is being monitored and utilized. This concern can lead to resistance from both employers, who are wary of potential legal consequences, and employees, who may be afraid of violating their privacy rights. Striking a balance between extracting valuable insights from employee data and ensuring strict compliance with privacy regulations is a significant challenge for EXM providers.
Opportunity: Reduced burnout and increased well-being
According to recent findings by Slack, middle managers in the United States are experiencing a significant issue of burnout. 43% of middle managers face burnout, which is higher than other worker groups. Moreover, women have a 32% higher burnout rate compared to men. This highlights the need for practical solutions to address this problem. Harvard research estimates employee burnout costs American businesses up to USD 190 billion annually. This highlights a significant opportunity for innovative employee experience management solutions that can help organizations tackle and prevent burnout. Tools like Microsoft's Viva Insights can identify potential burnout indicators such as extended working hours, allowing companies to invest in comprehensive employee experience management strategies. As businesses increasingly recognize the impact of burnout on their bottom line, there is a growing market for solutions that proactively manage and enhance the overall employee experience.
Challenge: Remote workers to pose unique hurdles for organizations
Communication and collaboration can become complex when employees are not physically present in an office, impacting transparency and alignment between employees and management. Onboarding, a critical element in fostering a robust employee-organization relationship, requires careful planning for remote workers to ensure a smooth integration process. The lack of a shared workspace may hinder managers from appreciating team members, recognizing their efforts, or providing timely feedback. If left unaddressed, these challenges can negatively impact the overall employee experience.
To navigate the complexities of remote work, organizations should establish robust communication channels that foster connections among remote employees, managers, and C-level executives. Additionally, creating a comprehensive remote onboarding experience is crucial, including a clear organizational mission, technical training, interpretation of critical responsibilities, and the introduction of essential resources. Addressing these challenges is essential to maintaining a positive and engaging employee experience in the remote work paradigm.
Ecosystem Of Employee Experience Management Market
The BFSI industry registered the highest CAGR in the employee experience management market during the forecast period.
Employee experience management is crucial in the BFSI industry to create a work environment that attracts top talent and ensures sustained engagement and productivity. Since the sector is dynamic and characterized by fast-paced operations and stringent regulatory frameworks, employee experience management strategies in BFSI focus on various aspects. To comply with industry changes, training and development programs are designed to equip employees with the necessary skills. The BFSI sector has been at the forefront of digital transformation, leveraging technology to streamline processes, improve efficiency, and enhance employee experience. Digital tools and platforms are often integrated to facilitate remote work, collaboration, and communication. Fostering a positive workplace culture is a crucial aspect of employee experience management in BFSI. This includes initiatives to enhance work-life balance, mental health support, and recognition for achievements. Organizations in the BFSI sector often invest in creating a transparent and ethical work environment, given the sensitive nature of financial services, where trust and integrity are paramount.
Employee engagement software is expected to hold the largest market size during the forecast.
Employee engagement refers to the level of emotional commitment and involvement that employees have towards their work, their organization, and its goals. A highly engaged workforce is characterized by individuals who feel a sense of purpose and enthusiasm about their roles and exhibit a solid connection to the organization's values and mission. Various factors contribute to employee engagement, including effective communication, supportive leadership, opportunities for professional development, and a positive work environment. Engaged employees are more likely to be productive, innovative, and committed to the long-term success of the organization. Leading solutions in the employee engagement market allow organizations to tailor the platform to their needs. This includes customization of surveys, feedback forms, and recognition programs, enabling organizations to align the software with their unique culture and goals. Organizations need to monitor and understand employee engagement levels through surveys and feedback mechanisms to identify areas for improvement, foster a positive workplace culture, and ultimately enhance overall employee satisfaction and performance.
Based on region, North America is expected to hold the largest market size during the forecast.
The North American region, which includes the United States and Canada, is at the forefront of shaping employee experience management. Both countries, with strong and sustainable economies, play a significant role in driving research and development (R&D) activities, influencing innovations in the employee experience management market. A recent survey by Slack highlights a concerning scenario in the United States, where 43% of middle managers are experiencing burnout, surpassing other worker groups. Notably, women's burnout rates are 32% higher than those of men. This issue has far-reaching consequences for businesses, with Harvard research estimating that employee burnout costs American companies up to $190 billion annually. Fortunately, proactive measures, such as utilizing tools like Microsoft's Viva Insights, can help identify employees at risk of burnout based on their work habits, such as those working beyond regular hours.
Employee Experience Management Companies
The list of employee experiment management companies profiled in this market include Qualtrics (US), SAP (Germany), Oracle (US), Microsoft (US), Workday (US), Zoom Video Communication (US), Culture AMP (Germany), Achievers (Canada), Workleap (Canada), SurveySparrow (US), 15Five (US), Awardco (US), Vantage Circle (US), Quantum Workplace (US), ClearCompany (US), Jostle (Canada), Kudos (Canada), Lattice (US), Bonusly (US), Motivosity (US), WorkTango (US), Blink (US), MO (UK), and Pixida (US). These players have adopted various growth strategies, such as partnerships, agreements and collaborations, new product launches and product enhancements, and acquisitions to expand their footprint in the employee experience management market.
Want to explore hidden markets that can drive new revenue in Employee Experience Management Market?
Scope of the Report
Want to explore hidden markets that can drive new revenue in Employee Experience Management Market?
Report Metrics |
Details |
Market size available for years |
2018-2028 |
Base year considered |
2022 |
Forecast period |
2023–2028 |
Forecast units |
Value (USD) Million/Billion |
Segments Covered |
By Offering (software and services), Industry and Region |
Region covered |
North America, Europe, Asia Pacific, Middle East & Africa, and Latin America |
List of Companies in Employee Experience Management |
|
This research report categorizes the Employee Experience Management Market to forecast revenues and analyze trends in each of the following submarkets:
Based on Component:
-
Software
- Integrated Software
-
Standalone Software
- Employee Survey & Feedback
- Employee Engagement
- Employee Recognition & Rewards
- Employee Performance Management
- Other Software
-
Services
- Implementation & Integration
- Support & Maintenance
- Training & Development
Based on Industry:
- BFSI
- Healthcare
- IT & ITeS
- Telecom
- Government
- Manufacturing
- Other Industries
By Region:
-
North America
- United States (US)
- Canada
-
Europe
- United Kingdom (UK)
- Germany
- France
- Italy
- Spain
- Rest of Europe
-
Asia Pacific
- China
- Japan
- India
- Australia & New Zealand
- Rest of Asia Pacific
-
Middle East and Africa
-
GCC Countries
- UAE
- KSA
- Rest of GCC Countries
- South Africa
- Rest of the Middle East & Africa
-
GCC Countries
-
Latin America
- Brazil
- Mexico
- Rest of Latin America
Recent Developments:
- In December 2023, Workleap acquired Pingboard, a US-based HR tech SaaS company. This acquisition adds new capabilities to the company’s family of software products, in line with Workleap’s vision of building a best-in-class ecosystem of workplace tools.
- In October 2023, Qualtrics partnered with WorkJam, the world’s leading digital frontline workplace. The partnership will improve the frontline employees’ experience to enhance the customer experience. Qualtrics’ conversational intelligence technology will combine with WorkJam’s super app for frontline workers to give organizations a continuous pulse on the front lines of their businesses and surface insights into employees’ priorities, needs, and concerns.
- In June 2023, SAP completed the sale of its stake in Qualtrics as Silver Lake and CPP Investments completed Qualtrics’ acquisition.
- In April 2023, Zoom announced the acquisition of Workvivo to continue expanding its collaboration platform for a digital-first workplace. This acquisition is expected to close in the first quarter of the fiscal year 2024 and will add Workvivo’s employee experience platform to Zoom’s offerings.
Frequently Asked Questions (FAQ):
What is Employee Experience Management?
Employee experience management is a holistic approach that encompasses the entire journey of an employee within an organization, focusing on creating a positive and fulfilling work environment. It involves strategic initiatives to enhance every aspect of the employee's interaction with the company, from recruitment and onboarding to daily work experiences and professional development. Employee experience management prioritizes well-being, job satisfaction, and engagement by considering workplace culture, leadership, communication, and growth opportunities.
What is the employee experience management market size?
The employee experience management market size is projected to grow from USD 6.8 billion in 2023 to USD 11.1 billion by 2028 at a CAGR of 10.2% during the forecast period.
What are the major drivers in the employee experience management market?
The major drivers in the employee experience management market include escalating demand for real-time performance management and enhancing employee experience through seamless technology integration.
Which are the employee experience management companies included in the report?
The top employee experience management companies include Qualtrics (US), SAP (Germany), Oracle (US), Microsoft (US), Workday (US), Zoom Video Communication (US), Culture AMP (Germany), Achievers (Canada), Workleap (Canada), SurveySparrow (US), 15Five (US), Awardco (US), Vantage Circle (US), Quantum Workplace (US), ClearCompany (US), Jostle (Canada), Kudos (Canada), Lattice (US), Bonusly (US), Motivosity (US), WorkTango (US), Blink (US), MO (UK), and Pixida (US).
What are the opportunities for new market entrants in the employee experience management market?
New entrants entering the employee experience management market can seize opportunities by offering innovative solutions tailored to the rising demand for employee well-being and engagement. There's room for differentiation through technologically advanced tools, niche offerings, and the integration of AI and data analytics. Tailoring solutions to support remote work and hybrid models is also an essential avenue for new entrants to contribute to the evolving dynamics of the modern workplace. Understanding and addressing these trends strategically allows for a valuable and impactful entry into the dynamic employee experience management sector. .
To speak to our analyst for a discussion on the above findings, click Speak to Analyst
Exclusive indicates content/data unique to MarketsandMarkets and not available with any competitors.
- 5.1 INTRODUCTION
-
5.2 MARKET DYNAMICSDRIVERS- Escalating demand for real-time performance management- Enhancing employee experience through seamless technology integrationRESTRAINTS- Budget constraints- Data privacy concernsOPPORTUNITIES- Reduced burnout and increased well-being- Talent attraction and retentionCHALLENGES- Remote workers to pose unique hurdles for organizations- Quest to elevate employee productivity within organizational framework
- 5.3 VALUE CHAIN ANALYSIS
- 5.4 ECOSYSTEM
-
5.5 TECHNOLOGY ANALYSISKEY TECHNOLOGIES- Artificial Intelligence (AI) & Machine Learning (ML)- Internet of Things (IoT)ADJACENT TECHNOLOGIES- BlockchainCOMPLEMENTARY TECHNOLOGIES- Data & Analytics- Text Analytics and Sentiment Analysis
-
5.6 PORTER’S FIVE FORCES ANALYSISINTENSITY OF COMPETITIVE RIVALRYBARGAINING POWER OF SUPPLIERSBARGAINING POWER OF BUYERSTHREAT OF SUBSTITUTESTHREAT OF NEW ENTRANTS
-
5.7 BUSINESS MODELBRIEF HISTORY OF EMPLOYEE EXPERIENCE MANAGEMENT SOLUTIONS- Early 2000s- 2010s- 2020s- Present
-
5.8 IMPACT OF EMPLOYEE EXPERIENCE MANAGEMENT ON ADJACENT NICHE TECHNOLOGIESHUMAN RESOURCES INFORMATION SYSTEMS (HRIS)ARTIFICIAL INTELLIGENCE (AI) AND PREDICTIVE ANALYTICSEMPLOYEE ONBOARDING SOLUTIONSWORKFORCE PLANNING TOOLSEMPLOYEE ENGAGEMENT PLATFORMSINTERNAL COMMUNICATION TOOLSLEARNING AND DEVELOPMENT TECHNOLOGIES
- 5.9 FUTURE OF EMPLOYEE EXPERIENCE MANAGEMENT MARKET LANDSCAPE
- 5.10 TRENDS/DISRUPTIONS IMPACTING CUSTOMERS’ BUSINESSES
- 5.11 BEST PRACTICES OF EMPLOYEE EXPERIENCE MANAGEMENT
-
5.12 USE CASESCASE STUDY 1: SAP HELPED AKT GLOBAL BUILD ENGAGING DIGITAL WORK EXPERIENCE FOR REMOTE WORKFORCECASE STUDY 2: SHARESIES BUILT THRIVING FEEDBACK-DRIVEN, HIGH-PERFORMING CULTURE WITH CULTURE AMPCASE STUDY 3: NEW SUN LIFE ENHANCED EMPLOYEE EXPERIENCE USING WORKDAYCASE STUDY 4: PCA GROUP ENHANCED EMPLOYEE EXPERIENCE USING CLEARCOMPANY
-
5.13 PRICING ANALYSISAVERAGE SELLING PRICE TREND OF KEY PLAYERS, BY SOLUTIONINDICATIVE PRICING ANALYSIS OF EMPLOYEE EXPERIENCE MANAGEMENT KEY PLAYERS
-
5.14 PATENT ANALYSISMETHODOLOGY
-
5.15 REGULATORY LANDSCAPEREGULATORY BODIES, GOVERNMENT AGENCIES, AND OTHER ORGANIZATIONS- North America- Europe- Asia Pacific- Middle East & Africa- Latin America
-
5.16 KEY STAKEHOLDERS AND BUYING CRITERIAKEY STAKEHOLDERS IN BUYING PROCESSBUYING CRITERIA
- 5.17 KEY CONFERENCES & EVENTS, 2024
-
6.1 INTRODUCTIONOFFERING: EMPLOYEE EXPERIENCE MANAGEMENT MARKET DRIVERS
-
6.2 SOFTWAREOPTIMIZING OVERALL EMPLOYEE JOURNEY WITH EMPLOYEE ENGAGEMENT SOFTWARE TO DRIVE MARKET GROWTHINTEGRATED SOFTWARESTANDALONE SOFTWARE- Employee Survey & Feedback- Employee Engagement- Employee Recognition & Rewards- Employee Performance Management- Other Standalone Software
-
6.3 SERVICESSERVICES TO HELP CREATE POSITIVE AND ENGAGING WORK ENVIRONMENTINTEGRATION & IMPLEMENTATIONSUPPORT & MAINTENANCETRAINING & DEVELOPMENT
-
7.1 INTRODUCTIONINDUSTRY: EMPLOYEE EXPERIENCE MANAGEMENT MARKET DRIVERS
-
7.2 BFSIEMPLOYEE EXPERIENCE MANAGEMENT TO HELP CREATE TRANSPARENT AND ETHICAL WORK ENVIRONMENT IN BFSI INDUSTRY
-
7.3 HEALTHCARECULTURE OF COMPASSION AND COLLABORATION ENABLED BY EMPLOYEE EXPERIENCE MANAGEMENT IN HEALTHCARE TO DRIVE MARKET GROWTH
-
7.4 IT & ITESFLEXIBLE WORK ARRANGEMENTS AND RECOGNITION FOR ACHIEVEMENTS KEY TO KEEPING EMPLOYEES SATISFIED IN IT & ITES SECTOR
-
7.5 TELECOMOPPORTUNITIES FOR CAREER GROWTH, AND MENTORSHIP INITIATIVES CENTRAL TO RETAINING TOP TALENT IN TELECOM INDUSTRY
-
7.6 GOVERNMENTGOVERNMENTS LEVERAGING DIGITAL TOOLS TO ENHANCE EFFICIENCY
-
7.7 MANUFACTURINGRECOGNITION PROGRAMS AND CONTRIBUTIONS TO CONTINUOUS IMPROVEMENT EFFORTS TO DRIVE GROWTH IN MANUFACTURING INDUSTRY
- 7.8 OTHER INDUSTRIES
- 8.1 INTRODUCTION
-
8.2 NORTH AMERICANORTH AMERICA: EMPLOYEE EXPERIENCE MANAGEMENT MARKET DRIVERSNORTH AMERICA: RECESSION IMPACTUS- Need for insights into employee engagement and challenges in US to drive market growthCANADA- Elevating success with growing investments in employee experience management to drive market growth in Canada
-
8.3 EUROPEEUROPE: EMPLOYEE EXPERIENCE MANAGEMENT MARKET DRIVERSEUROPE: RECESSION IMPACTUK- Prioritizing employee experience in UK amidst skills shortage to drive market growthITALY- Majority of Italian employees expressing their commitment to stay to fuel growthGERMANY- Evolving work culture and engagement trends in Germany to drive market growthFRANCE- France’s priority to improve employee well-being to fuel market growthSPAIN- Technology to play pivotal role in Spain’s employee experience management effortsREST OF EUROPE
-
8.4 ASIA PACIFICASIA PACIFIC: EMPLOYEE EXPERIENCE MANAGEMENT MARKET DRIVERSASIA PACIFIC: RECESSION IMPACTCHINA- Government policies and regulations to play crucial role in shaping employee experience management strategiesINDIA- Integration of AI and advanced technologies to reshape employee experience landscape in IndiaJAPAN- Aging population and evolving work preferences to fuel employee experience management in JapanAUSTRALIA & NEW ZEALAND- Robust investments in employee development and well-being initiatives to drive market growthREST OF ASIA PACIFIC
-
8.5 MIDDLE EAST & AFRICAMIDDLE EAST & AFRICA: EMPLOYEE EXPERIENCE MANAGEMENT MARKET DRIVERSMIDDLE EAST & AFRICA: RECESSION IMPACTGCC COUNTRIES- UAE- KSA- Rest of GCC countriesSOUTH AFRICA- Prioritizing employee well-being & rising adoption of flexible work arrangements to drive marketREST OF MIDDLE EAST & AFRICA
-
8.6 LATIN AMERICALATIN AMERICA: EMPLOYEE EXPERIENCE MANAGEMENT MARKET DRIVERSLATIN AMERICA: RECESSION IMPACTBRAZIL- Digital transformation in Brazil to drive marketMEXICO- Mexico’s workforce and imperative of employee experience management to drive market growthREST OF LATIN AMERICA
- 9.1 INTRODUCTION
- 9.2 KEY PLAYER STRATEGIES/RIGHT TO WIN
- 9.3 REVENUE ANALYSIS
- 9.4 MARKET SHARE ANALYSIS
-
9.5 COMPANY EVALUATION MATRIXSTARSEMERGING LEADERSPERVASIVE PLAYERSPARTICIPANTSEMPLOYEE EXPERIENCE MANAGEMENT MARKET: COMPANY FOOTPRINT
-
9.6 STARTUP/SME EVALUATION MATRIX, 2022PROGRESSIVE COMPANIESRESPONSIVE COMPANIESDYNAMIC COMPANIESSTARTING BLOCKSCOMPETITIVE BENCHMARKING
- 9.7 RANKING OF KEY MARKET PLAYERS IN EMPLOYEE EXPERIENCE MANAGEMENT MARKET, 2022
-
9.8 COMPETITIVE SCENARIOPRODUCT LAUNCHESDEALS
-
9.9 EMPLOYEE EXPERIENCE MANAGEMENT PRODUCT BENCHMARKINGPROMINENT EMPLOYEE EXPERIENCE MANAGEMENT SOLUTIONS- Culture Amp Employee Experience Platform- Workleap Officevibe- Qualtrics Employee Experience- Workday Employee Experience
- 9.10 VALUATION AND FINANCIAL METRICS OF KEY EMPLOYEE EXPERIENCE MANAGEMENT VENDORS
-
10.1 MAJOR PLAYERSQUALTRICS- Business overview- Products/Solutions/Services offered- Recent developments- MnM viewSAP- Business overview- Products/Solutions/Services offered- Recent developments- MnM viewORACLE- Business overview- Products/Solutions/Services offered- Recent developments- MnM viewMICROSOFT- Business overview- Products/Solutions/Services offered- Recent developments- MnM viewWORKDAY- Business overview- Products/Solutions/Services offered- Recent developments- MnM viewZOOM VIDEO COMMUNICATIONS- Business overview- Products/Solutions/Services offered- Recent developmentsZOHO CORPORATION- Business overview- Products/Solutions/Services offered- Recent developmentsCULTURE AMP- Business overview- Products/Solutions/Services offered- Recent developmentsACHIEVERS- Business overview- Products/Solutions/Services offered- Recent developmentsWORKLEAP- Business overview- Products/Solutions/Services offered- Recent developmentsSURVEYSPARROW15FIVEAWARDCOVANTAGE CIRCLE
-
10.2 STARTUPS/SMESQUANTUM WORKPLACECLEARCOMPANYJOSTELKUDOSLATTICEBONUSLYMOTIVOSITYWORKTANGOBLINKMOPIXIDA
- 11.1 INTRODUCTION TO ADJACENT MARKETS
- 11.2 LIMITATIONS
-
11.3 WORKFORCE MANAGEMENTWORKFORCE MANAGEMENT MARKET, BY COMPONENTWORKFORCE MANAGEMENT MARKET, BY SOLUTIONWORKFORCE MANAGEMENT MARKET, BY SERVICEWORKFORCE MANAGEMENT MARKET, BY DEVELOPMENT TYPEWORKFORCE MANAGEMENT MARKET, BY ORGANIZATION SIZEWORKFORCE MANAGEMENT MARKET, BY VERTICAL
-
11.4 HR ANALYTICS MARKETMARKET DEFINITIONHR ANALYTICS MARKET, BY COMPONENTHR ANALYTICS MARKET, BY SERVICEHR ANALYTICS MARKET, BY APPLICATION AREAHR ANALYTICS MARKET, BY ORGANIZATION SIZEHR ANALYTICS MARKET, BY DEPLOYMENT TYPEHR ANALYTICS MARKET, BY VERTICAL
- 12.1 DISCUSSION GUIDE
- 12.2 KNOWLEDGESTORE: MARKETSANDMARKETS’ SUBSCRIPTION PORTAL
- 12.3 CUSTOMIZATION OPTIONS
- 12.4 RELATED REPORTS
- 12.5 AUTHOR DETAILS
- TABLE 1 USD EXCHANGE RATES, 2020–2022
- TABLE 2 ECOSYSTEM ANALYSIS: EMPLOYEE EXPERIENCE MANAGEMENT MARKET
- TABLE 3 IMPACT OF PORTER’S FIVE FORCES ON EMPLOYEE EXPERIENCE MANAGEMENT MARKET
- TABLE 4 AVERAGE SELLING PRICE TREND OF KEY PLAYERS, BY SOLUTION (USD PER USER/YEAR)
- TABLE 5 INDICATIVE PRICING ANALYSIS OF EMPLOYEE EXPERIENCE MANAGEMENT
- TABLE 6 LIST OF MAJOR PATENTS
- TABLE 7 NORTH AMERICA: LIST OF REGULATORY BODIES, GOVERNMENT AGENCIES, AND OTHER ORGANIZATIONS
- TABLE 8 EUROPE: LIST OF REGULATORY BODIES, GOVERNMENT AGENCIES, AND OTHER ORGANIZATIONS
- TABLE 9 ASIA PACIFIC: LIST OF REGULATORY BODIES, GOVERNMENT AGENCIES, AND OTHER ORGANIZATIONS
- TABLE 10 MIDDLE EAST & AFRICA: LIST OF REGULATORY BODIES, GOVERNMENT AGENCIES, AND OTHER ORGANIZATIONS
- TABLE 11 LATIN AMERICA: LIST OF REGULATORY BODIES, GOVERNMENT AGENCIES, AND OTHER ORGANIZATIONS
- TABLE 12 INFLUENCE OF STAKEHOLDERS ON BUYING PROCESS FOR KEY INDUSTRIES (%)
- TABLE 13 KEY BUYING CRITERIA FOR KEY INDUSTRIES
- TABLE 14 DETAILED LIST OF CONFERENCES & EVENTS, 2024
- TABLE 15 EMPLOYEE EXPERIENCE MANAGEMENT MARKET, BY OFFERING, 2018–2022 (USD MILLION)
- TABLE 16 EMPLOYEE EXPERIENCE MANAGEMENT MARKET, BY OFFERING, 2023–2028 (USD MILLION)
- TABLE 17 EMPLOYEE EXPERIENCE MANAGEMENT MARKET, BY SOFTWARE, 2018–2022 (USD MILLION)
- TABLE 18 EMPLOYEE EXPERIENCE MANAGEMENT MARKET, BY SOFTWARE, 2023–2028 (USD MILLION)
- TABLE 19 SOFTWARE: EMPLOYEE EXPERIENCE MANAGEMENT MARKET, BY REGION, 2018–2022 (USD MILLION)
- TABLE 20 SOFTWARE: EMPLOYEE EXPERIENCE MANAGEMENT MARKET, BY REGION, 2023–2028 (USD MILLION)
- TABLE 21 INTEGRATED SOFTWARE: EMPLOYEE EXPERIENCE MANAGEMENT MARKET, BY REGION, 2018–2022 (USD MILLION)
- TABLE 22 INTEGRATED SOFTWARE: EMPLOYEE EXPERIENCE MANAGEMENT MARKET, BY REGION, 2023–2028 (USD MILLION)
- TABLE 23 EMPLOYEE EXPERIENCE MANAGEMENT MARKET, BY STANDALONE SOFTWARE, 2018–2022 (USD MILLION)
- TABLE 24 EMPLOYEE EXPERIENCE MANAGEMENT MARKET, BY STANDALONE SOFTWARE, 2023–2028 (USD MILLION)
- TABLE 25 STANDALONE SOFTWARE: EMPLOYEE EXPERIENCE MANAGEMENT MARKET, BY REGION, 2018–2022 (USD MILLION)
- TABLE 26 STANDALONE SOFTWARE: EMPLOYEE EXPERIENCE MANAGEMENT MARKET, BY REGION, 2023–2028 (USD MILLION)
- TABLE 27 EMPLOYEE SURVEY & FEEDBACK: EMPLOYEE EXPERIENCE MANAGEMENT MARKET, BY REGION, 2018–2022 (USD MILLION)
- TABLE 28 EMPLOYEE SURVEY & FEEDBACK: EMPLOYEE EXPERIENCE MANAGEMENT MARKET, BY REGION, 2023–2028 (USD MILLION)
- TABLE 29 EMPLOYEE ENGAGEMENT: EMPLOYEE EXPERIENCE MANAGEMENT MARKET, BY REGION, 2018–2022 (USD MILLION)
- TABLE 30 EMPLOYEE ENGAGEMENT: EMPLOYEE EXPERIENCE MANAGEMENT MARKET, BY REGION, 2023–2028 (USD MILLION)
- TABLE 31 EMPLOYEE RECOGNITION & REWARDS: EMPLOYEE EXPERIENCE MANAGEMENT MARKET, BY REGION, 2018–2022 (USD MILLION)
- TABLE 32 EMPLOYEE RECOGNITION & REWARDS: EMPLOYEE EXPERIENCE MANAGEMENT MARKET, BY REGION, 2023–2028 (USD MILLION)
- TABLE 33 EMPLOYEE PERFORMANCE MANAGEMENT: EMPLOYEE EXPERIENCE MANAGEMENT MARKET, BY REGION, 2018–2022 (USD MILLION)
- TABLE 34 EMPLOYEE PERFORMANCE MANAGEMENT: EMPLOYEE EXPERIENCE MANAGEMENT MARKET, BY REGION, 2023–2028 (USD MILLION)
- TABLE 35 OTHER STANDALONE SOFTWARE: EMPLOYEE EXPERIENCE MANAGEMENT MARKET, BY REGION, 2018–2022 (USD MILLION)
- TABLE 36 OTHER STANDALONE SOFTWARE: EMPLOYEE EXPERIENCE MANAGEMENT MARKET, BY REGION, 2023–2028 (USD MILLION)
- TABLE 37 SERVICES: EMPLOYEE EXPERIENCE MANAGEMENT MARKET, BY REGION, 2018–2022 (USD MILLION)
- TABLE 38 SERVICES: EMPLOYEE EXPERIENCE MANAGEMENT MARKET, BY REGION, 2023–2028 (USD MILLION)
- TABLE 39 EMPLOYEE EXPERIENCE MANAGEMENT MARKET, BY INDUSTRY, 2018–2022 (USD MILLION)
- TABLE 40 EMPLOYEE EXPERIENCE MANAGEMENT MARKET, BY INDUSTRY, 2023–2028 (USD MILLION)
- TABLE 41 BFSI: EMPLOYEE EXPERIENCE MANAGEMENT MARKET, BY REGION, 2018–2022 (USD MILLION)
- TABLE 42 BFSI: EMPLOYEE EXPERIENCE MANAGEMENT MARKET, BY REGION, 2023–2028 (USD MILLION)
- TABLE 43 HEALTHCARE: EMPLOYEE EXPERIENCE MANAGEMENT MARKET, BY REGION, 2018–2022 (USD MILLION)
- TABLE 44 HEALTHCARE: EMPLOYEE EXPERIENCE MANAGEMENT MARKET, BY REGION, 2023–2028 (USD MILLION)
- TABLE 45 IT & ITES: EMPLOYEE EXPERIENCE MANAGEMENT MARKET, BY REGION, 2018–2022 (USD MILLION)
- TABLE 46 IT & ITES: EMPLOYEE EXPERIENCE MANAGEMENT MARKET, BY REGION, 2023–2028 (USD MILLION)
- TABLE 47 TELECOM: EMPLOYEE EXPERIENCE MANAGEMENT MARKET, BY REGION, 2018–2022 (USD MILLION)
- TABLE 48 TELECOM: EMPLOYEE EXPERIENCE MANAGEMENT MARKET, BY REGION, 2023–2028 (USD MILLION)
- TABLE 49 GOVERNMENT: EMPLOYEE EXPERIENCE MANAGEMENT MARKET, BY REGION, 2018–2022 (USD MILLION)
- TABLE 50 GOVERNMENT: EMPLOYEE EXPERIENCE MANAGEMENT MARKET, BY REGION, 2023–2028 (USD MILLION)
- TABLE 51 MANUFACTURING: EMPLOYEE EXPERIENCE MANAGEMENT MARKET, BY REGION, 2018–2022 (USD MILLION)
- TABLE 52 MANUFACTURING: EMPLOYEE EXPERIENCE MANAGEMENT MARKET, BY REGION, 2023–2028 (USD MILLION)
- TABLE 53 OTHER INDUSTRIES: EMPLOYEE EXPERIENCE MANAGEMENT MARKET, BY REGION, 2018–2022 (USD MILLION)
- TABLE 54 OTHER INDUSTRIES: EMPLOYEE EXPERIENCE MANAGEMENT MARKET, BY REGION, 2023–2028 (USD MILLION)
- TABLE 55 EMPLOYEE EXPERIENCE MANAGEMENT MARKET, BY REGION, 2018–2022 (USD MILLION)
- TABLE 56 EMPLOYEE EXPERIENCE MANAGEMENT MARKET, BY REGION, 2023–2028 (USD MILLION)
- TABLE 57 NORTH AMERICA: EMPLOYEE EXPERIENCE MANAGEMENT MARKET, BY OFFERING, 2018–2022 (USD MILLION)
- TABLE 58 NORTH AMERICA: EMPLOYEE EXPERIENCE MANAGEMENT MARKET, BY OFFERING, 2023–2028 (USD MILLION)
- TABLE 59 NORTH AMERICA: EMPLOYEE EXPERIENCE MANAGEMENT MARKET, BY SOFTWARE, 2018–2022 (USD MILLION)
- TABLE 60 NORTH AMERICA: EMPLOYEE EXPERIENCE MANAGEMENT MARKET, BY SOFTWARE, 2023–2028 (USD MILLION)
- TABLE 61 NORTH AMERICA: EMPLOYEE EXPERIENCE MANAGEMENT MARKET, BY STANDALONE SOFTWARE, 2018–2022 (USD MILLION)
- TABLE 62 NORTH AMERICA: EMPLOYEE EXPERIENCE MANAGEMENT MARKET, BY STANDALONE SOFTWARE, 2023–2028 (USD MILLION)
- TABLE 63 NORTH AMERICA: EMPLOYEE EXPERIENCE MANAGEMENT MARKET, BY INDUSTRY, 2018–2022 (USD MILLION)
- TABLE 64 NORTH AMERICA: EMPLOYEE EXPERIENCE MANAGEMENT MARKET, BY INDUSTRY, 2023–2028 (USD MILLION)
- TABLE 65 NORTH AMERICA: EMPLOYEE EXPERIENCE MANAGEMENT MARKET, BY COUNTRY, 2018–2022 (USD MILLION)
- TABLE 66 NORTH AMERICA: EMPLOYEE EXPERIENCE MANAGEMENT MARKET, BY COUNTRY, 2023–2028 (USD MILLION)
- TABLE 67 US: EMPLOYEE EXPERIENCE MANAGEMENT MARKET, BY OFFERING, 2018–2022 (USD MILLION)
- TABLE 68 US: EMPLOYEE EXPERIENCE MANAGEMENT MARKET, BY OFFERING, 2023–2028 (USD MILLION)
- TABLE 69 US: EMPLOYEE EXPERIENCE MANAGEMENT MARKET, BY SOFTWARE, 2018–2022 (USD MILLION)
- TABLE 70 US: EMPLOYEE EXPERIENCE MANAGEMENT MARKET, BY SOFTWARE, 2023–2028 (USD MILLION)
- TABLE 71 US: EMPLOYEE EXPERIENCE MANAGEMENT MARKET, BY STANDALONE SOFTWARE, 2018–2022 (USD MILLION)
- TABLE 72 US: EMPLOYEE EXPERIENCE MANAGEMENT MARKET, BY STANDALONE SOFTWARE, 2023–2028 (USD MILLION)
- TABLE 73 US: EMPLOYEE EXPERIENCE MANAGEMENT MARKET, BY INDUSTRY, 2018–2022 (USD MILLION)
- TABLE 74 US: EMPLOYEE EXPERIENCE MANAGEMENT MARKET, BY INDUSTRY, 2023–2028 (USD MILLION)
- TABLE 75 CANADA: EMPLOYEE EXPERIENCE MANAGEMENT MARKET, BY OFFERING, 2018–2022 (USD MILLION)
- TABLE 76 CANADA: EMPLOYEE EXPERIENCE MANAGEMENT MARKET, BY OFFERING, 2023–2028 (USD MILLION)
- TABLE 77 CANADA: EMPLOYEE EXPERIENCE MANAGEMENT MARKET, BY SOFTWARE, 2018–2022 (USD MILLION)
- TABLE 78 CANADA: EMPLOYEE EXPERIENCE MANAGEMENT MARKET, BY SOFTWARE, 2023–2028 (USD MILLION)
- TABLE 79 CANADA: EMPLOYEE EXPERIENCE MANAGEMENT MARKET, BY STANDALONE SOFTWARE, 2018–2022 (USD MILLION)
- TABLE 80 CANADA: EMPLOYEE EXPERIENCE MANAGEMENT MARKET, BY STANDALONE SOFTWARE, 2023–2028 (USD MILLION)
- TABLE 81 CANADA: EMPLOYEE EXPERIENCE MANAGEMENT MARKET, BY INDUSTRY, 2018–2022 (USD MILLION)
- TABLE 82 CANADA: EMPLOYEE EXPERIENCE MANAGEMENT MARKET, BY INDUSTRY, 2023–2028 (USD MILLION)
- TABLE 83 EUROPE: EMPLOYEE EXPERIENCE MANAGEMENT MARKET, BY OFFERING, 2018–2022 (USD MILLION)
- TABLE 84 EUROPE: EMPLOYEE EXPERIENCE MANAGEMENT MARKET, BY OFFERING, 2023–2028 (USD MILLION)
- TABLE 85 EUROPE: EMPLOYEE EXPERIENCE MANAGEMENT MARKET, BY SOFTWARE, 2018–2022 (USD MILLION)
- TABLE 86 EUROPE: EMPLOYEE EXPERIENCE MANAGEMENT MARKET, BY SOFTWARE, 2023–2028 (USD MILLION)
- TABLE 87 EUROPE: EMPLOYEE EXPERIENCE MANAGEMENT MARKET, BY STANDALONE SOFTWARE, 2018–2022 (USD MILLION)
- TABLE 88 EUROPE: EMPLOYEE EXPERIENCE MANAGEMENT MARKET, BY STANDALONE SOFTWARE, 2023–2028 (USD MILLION)
- TABLE 89 EUROPE: EMPLOYEE EXPERIENCE MANAGEMENT MARKET, BY INDUSTRY, 2018–2022 (USD MILLION)
- TABLE 90 EUROPE: EMPLOYEE EXPERIENCE MANAGEMENT MARKET, BY INDUSTRY, 2023–2028 (USD MILLION)
- TABLE 91 EUROPE: EMPLOYEE EXPERIENCE MANAGEMENT MARKET, BY COUNTRY, 2018–2022 (USD MILLION)
- TABLE 92 EUROPE: EMPLOYEE EXPERIENCE MANAGEMENT MARKET, BY COUNTRY, 2023–2028 (USD MILLION)
- TABLE 93 UK: EMPLOYEE EXPERIENCE MANAGEMENT MARKET, BY OFFERING, 2018–2022 (USD MILLION)
- TABLE 94 UK: EMPLOYEE EXPERIENCE MANAGEMENT MARKET, BY OFFERING, 2023–2028 (USD MILLION)
- TABLE 95 UK: EMPLOYEE EXPERIENCE MANAGEMENT MARKET, BY SOFTWARE, 2018–2022 (USD MILLION)
- TABLE 96 UK: EMPLOYEE EXPERIENCE MANAGEMENT MARKET, BY SOFTWARE, 2023–2028 (USD MILLION)
- TABLE 97 UK: EMPLOYEE EXPERIENCE MANAGEMENT MARKET, BY STANDALONE SOFTWARE, 2018–2022 (USD MILLION)
- TABLE 98 UK: EMPLOYEE EXPERIENCE MANAGEMENT MARKET, BY STANDALONE SOFTWARE, 2023–2028 (USD MILLION)
- TABLE 99 UK: EMPLOYEE EXPERIENCE MANAGEMENT MARKET, BY INDUSTRY, 2018–2022 (USD MILLION)
- TABLE 100 UK: EMPLOYEE EXPERIENCE MANAGEMENT MARKET, BY INDUSTRY, 2023–2028 (USD MILLION)
- TABLE 101 ITALY: EMPLOYEE EXPERIENCE MANAGEMENT MARKET, BY OFFERING, 2018–2022 (USD MILLION)
- TABLE 102 ITALY: EMPLOYEE EXPERIENCE MANAGEMENT MARKET, BY OFFERING, 2023–2028 (USD MILLION)
- TABLE 103 ITALY: EMPLOYEE EXPERIENCE MANAGEMENT MARKET, BY SOFTWARE, 2018–2022 (USD MILLION)
- TABLE 104 ITALY: EMPLOYEE EXPERIENCE MANAGEMENT MARKET, BY SOFTWARE, 2023–2028 (USD MILLION)
- TABLE 105 ITALY: EMPLOYEE EXPERIENCE MANAGEMENT MARKET, BY STANDALONE SOFTWARE, 2018–2022 (USD MILLION)
- TABLE 106 ITALY: EMPLOYEE EXPERIENCE MANAGEMENT MARKET, BY STANDALONE SOFTWARE, 2023–2028 (USD MILLION)
- TABLE 107 ITALY: EMPLOYEE EXPERIENCE MANAGEMENT MARKET, BY INDUSTRY, 2018–2022 (USD MILLION)
- TABLE 108 ITALY: EMPLOYEE EXPERIENCE MANAGEMENT MARKET, BY INDUSTRY, 2023–2028 (USD MILLION)
- TABLE 109 ASIA PACIFIC: EMPLOYEE EXPERIENCE MANAGEMENT MARKET, BY OFFERING, 2018–2022 (USD MILLION)
- TABLE 110 ASIA PACIFIC: EMPLOYEE EXPERIENCE MANAGEMENT MARKET, BY OFFERING, 2023–2028 (USD MILLION)
- TABLE 111 ASIA PACIFIC: EMPLOYEE EXPERIENCE MANAGEMENT MARKET, BY SOFTWARE, 2018–2022 (USD MILLION)
- TABLE 112 ASIA PACIFIC: EMPLOYEE EXPERIENCE MANAGEMENT MARKET, BY SOFTWARE, 2023–2028 (USD MILLION)
- TABLE 113 ASIA PACIFIC: EMPLOYEE EXPERIENCE MANAGEMENT MARKET, BY STANDALONE SOFTWARE, 2018–2022 (USD MILLION)
- TABLE 114 ASIA PACIFIC: EMPLOYEE EXPERIENCE MANAGEMENT MARKET, BY STANDALONE SOFTWARE, 2023–2028 (USD MILLION)
- TABLE 115 ASIA PACIFIC: EMPLOYEE EXPERIENCE MANAGEMENT MARKET, BY INDUSTRY, 2018–2022 (USD MILLION)
- TABLE 116 ASIA PACIFIC: EMPLOYEE EXPERIENCE MANAGEMENT MARKET, BY INDUSTRY, 2023–2028 (USD MILLION)
- TABLE 117 ASIA PACIFIC: EMPLOYEE EXPERIENCE MANAGEMENT MARKET, BY COUNTRY, 2018–2022 (USD MILLION)
- TABLE 118 ASIA PACIFIC: EMPLOYEE EXPERIENCE MANAGEMENT MARKET, BY COUNTRY, 2023–2028 (USD MILLION)
- TABLE 119 CHINA: EMPLOYEE EXPERIENCE MANAGEMENT MARKET, BY OFFERING, 2018–2022 (USD MILLION)
- TABLE 120 CHINA: EMPLOYEE EXPERIENCE MANAGEMENT MARKET, BY OFFERING, 2023–2028 (USD MILLION)
- TABLE 121 CHINA: EMPLOYEE EXPERIENCE MANAGEMENT MARKET, BY SOFTWARE, 2018–2022 (USD MILLION)
- TABLE 122 CHINA: EMPLOYEE EXPERIENCE MANAGEMENT MARKET, BY SOFTWARE, 2023–2028 (USD MILLION)
- TABLE 123 CHINA: EMPLOYEE EXPERIENCE MANAGEMENT MARKET, BY STANDALONE SOFTWARE, 2018–2022 (USD MILLION)
- TABLE 124 CHINA: EMPLOYEE EXPERIENCE MANAGEMENT MARKET, BY STANDALONE SOFTWARE, 2023–2028 (USD MILLION)
- TABLE 125 CHINA: EMPLOYEE EXPERIENCE MANAGEMENT MARKET, BY INDUSTRY, 2018–2022 (USD MILLION)
- TABLE 126 CHINA: EMPLOYEE EXPERIENCE MANAGEMENT MARKET, BY INDUSTRY, 2023–2028 (USD MILLION)
- TABLE 127 INDIA: EMPLOYEE EXPERIENCE MANAGEMENT MARKET, BY OFFERING, 2018–2022 (USD MILLION)
- TABLE 128 INDIA: EMPLOYEE EXPERIENCE MANAGEMENT MARKET, BY OFFERING, 2023–2028 (USD MILLION)
- TABLE 129 INDIA: EMPLOYEE EXPERIENCE MANAGEMENT MARKET, BY SOFTWARE, 2018–2022 (USD MILLION)
- TABLE 130 INDIA: EMPLOYEE EXPERIENCE MANAGEMENT MARKET, BY SOFTWARE, 2023–2028 (USD MILLION)
- TABLE 131 INDIA: EMPLOYEE EXPERIENCE MANAGEMENT MARKET, BY STANDALONE SOFTWARE, 2018–2022 (USD MILLION)
- TABLE 132 INDIA: EMPLOYEE EXPERIENCE MANAGEMENT MARKET, BY STANDALONE SOFTWARE, 2023–2028 (USD MILLION)
- TABLE 133 INDIA: EMPLOYEE EXPERIENCE MANAGEMENT MARKET, BY INDUSTRY, 2018–2022 (USD MILLION)
- TABLE 134 INDIA: EMPLOYEE EXPERIENCE MANAGEMENT MARKET, BY INDUSTRY, 2023–2028 (USD MILLION)
- TABLE 135 MIDDLE EAST & AFRICA: EMPLOYEE EXPERIENCE MANAGEMENT MARKET, BY OFFERING, 2018–2022 (USD MILLION)
- TABLE 136 MIDDLE EAST & AFRICA: EMPLOYEE EXPERIENCE MANAGEMENT MARKET, BY OFFERING, 2023–2028 (USD MILLION)
- TABLE 137 MIDDLE EAST & AFRICA: EMPLOYEE EXPERIENCE MANAGEMENT MARKET, BY SOFTWARE, 2018–2022 (USD MILLION)
- TABLE 138 MIDDLE EAST & AFRICA: EMPLOYEE EXPERIENCE MANAGEMENT MARKET, BY SOFTWARE, 2023–2028 (USD MILLION)
- TABLE 139 MIDDLE EAST & AFRICA: EMPLOYEE EXPERIENCE MANAGEMENT MARKET, BY STANDALONE SOFTWARE, 2018–2022 (USD MILLION)
- TABLE 140 MIDDLE EAST & AFRICA: EMPLOYEE EXPERIENCE MANAGEMENT MARKET, BY STANDALONE SOFTWARE, 2023–2028 (USD MILLION)
- TABLE 141 MIDDLE EAST & AFRICA: EMPLOYEE EXPERIENCE MANAGEMENT MARKET, BY INDUSTRY, 2018–2022 (USD MILLION)
- TABLE 142 MIDDLE EAST & AFRICA: EMPLOYEE EXPERIENCE MANAGEMENT MARKET, BY INDUSTRY, 2023–2028 (USD MILLION)
- TABLE 143 MIDDLE EAST & AFRICA: EMPLOYEE EXPERIENCE MANAGEMENT MARKET, BY COUNTRY, 2018–2022 (USD MILLION)
- TABLE 144 MIDDLE EAST & AFRICA: EMPLOYEE EXPERIENCE MANAGEMENT MARKET, BY COUNTRY, 2023–2028 (USD MILLION)
- TABLE 145 GCC COUNTRIES: EMPLOYEE EXPERIENCE MANAGEMENT MARKET, BY OFFERING, 2018–2022 (USD MILLION)
- TABLE 146 GCC COUNTRIES: EMPLOYEE EXPERIENCE MANAGEMENT MARKET, BY OFFERING, 2023–2028 (USD MILLION)
- TABLE 147 GCC COUNTRIES: EMPLOYEE EXPERIENCE MANAGEMENT MARKET, BY SOFTWARE, 2018–2022 (USD MILLION)
- TABLE 148 GCC COUNTRIES: EMPLOYEE EXPERIENCE MANAGEMENT MARKET, BY SOFTWARE, 2023–2028 (USD MILLION)
- TABLE 149 GCC COUNTRIES: EMPLOYEE EXPERIENCE MANAGEMENT MARKET, BY STANDALONE SOFTWARE, 2018–2022 (USD MILLION)
- TABLE 150 GCC COUNTRIES: EMPLOYEE EXPERIENCE MANAGEMENT MARKET, BY STANDALONE SOFTWARE, 2023–2028 (USD MILLION)
- TABLE 151 GCC COUNTRIES: EMPLOYEE EXPERIENCE MANAGEMENT MARKET, BY INDUSTRY, 2018–2022 (USD MILLION)
- TABLE 152 GCC COUNTRIES: EMPLOYEE EXPERIENCE MANAGEMENT MARKET, BY INDUSTRY, 2023–2028 (USD MILLION)
- TABLE 153 GCC COUNTRIES: EMPLOYEE EXPERIENCE MANAGEMENT MARKET, BY COUNTRY, 2018–2022 (USD MILLION)
- TABLE 154 GCC COUNTRIES: EMPLOYEE EXPERIENCE MANAGEMENT MARKET, BY COUNTRY, 2023–2028 (USD MILLION)
- TABLE 155 LATIN AMERICA: EMPLOYEE EXPERIENCE MANAGEMENT MARKET, BY OFFERING, 2018–2022 (USD MILLION)
- TABLE 156 LATIN AMERICA: EMPLOYEE EXPERIENCE MANAGEMENT MARKET, BY OFFERING, 2023–2028 (USD MILLION)
- TABLE 157 LATIN AMERICA: EMPLOYEE EXPERIENCE MANAGEMENT MARKET, BY SOFTWARE, 2018–2022 (USD MILLION)
- TABLE 158 LATIN AMERICA: EMPLOYEE EXPERIENCE MANAGEMENT MARKET, BY SOFTWARE, 2023–2028 (USD MILLION)
- TABLE 159 LATIN AMERICA: EMPLOYEE EXPERIENCE MANAGEMENT MARKET, BY STANDALONE SOFTWARE, 2018–2022 (USD MILLION)
- TABLE 160 LATIN AMERICA: EMPLOYEE EXPERIENCE MANAGEMENT MARKET, BY STANDALONE SOFTWARE, 2023–2028 (USD MILLION)
- TABLE 161 LATIN AMERICA: EMPLOYEE EXPERIENCE MANAGEMENT MARKET, BY INDUSTRY, 2018–2022 (USD MILLION)
- TABLE 162 LATIN AMERICA: EMPLOYEE EXPERIENCE MANAGEMENT MARKET, BY INDUSTRY, 2023–2028 (USD MILLION)
- TABLE 163 LATIN AMERICA: EMPLOYEE EXPERIENCE MANAGEMENT MARKET, BY COUNTRY, 2018–2022 (USD MILLION)
- TABLE 164 LATIN AMERICA: EMPLOYEE EXPERIENCE MANAGEMENT MARKET, BY COUNTRY, 2023–2028 (USD MILLION)
- TABLE 165 BRAZIL: EMPLOYEE EXPERIENCE MANAGEMENT MARKET, BY OFFERING, 2018–2022 (USD MILLION)
- TABLE 166 BRAZIL: EMPLOYEE EXPERIENCE MANAGEMENT MARKET, BY OFFERING, 2023–2028 (USD MILLION)
- TABLE 167 BRAZIL: EMPLOYEE EXPERIENCE MANAGEMENT MARKET, BY SOFTWARE, 2018–2022 (USD MILLION)
- TABLE 168 BRAZIL: EMPLOYEE EXPERIENCE MANAGEMENT MARKET, BY SOFTWARE, 2023–2028 (USD MILLION)
- TABLE 169 BRAZIL: EMPLOYEE EXPERIENCE MANAGEMENT MARKET, BY STANDALONE SOFTWARE, 2018–2022 (USD MILLION)
- TABLE 170 BRAZIL: EMPLOYEE EXPERIENCE MANAGEMENT MARKET, BY STANDALONE SOFTWARE, 2023–2028 (USD MILLION)
- TABLE 171 BRAZIL: EMPLOYEE EXPERIENCE MANAGEMENT MARKET, BY INDUSTRY, 2018–2022 (USD MILLION)
- TABLE 172 BRAZIL: EMPLOYEE EXPERIENCE MANAGEMENT MARKET, BY INDUSTRY, 2023–2028 (USD MILLION)
- TABLE 173 OVERVIEW OF STRATEGIES DEPLOYED BY KEY EMPLOYEE EXPERIENCE MANAGEMENT TECHNOLOGY VENDORS
- TABLE 174 EMPLOYEE EXPERIENCE MANAGEMENT MARKET: DEGREE OF COMPETITION
- TABLE 175 COMPANY FOOTPRINT FO KEY PLYERS
- TABLE 176 OFFERING FOOTPRINT
- TABLE 177 INDUSTRY FOOTPRINT
- TABLE 178 REGION FOOTPRINT
- TABLE 179 EMPLOYEE EXPERIENCE MANAGEMENT MARKET: DETAILED LIST OF KEY STARTUPS/SMES
- TABLE 180 EMPLOYEE EXPERIENCE MANAGEMENT MARKET: COMPETITIVE BENCHMARKING OF KEY STARTUPS/SMES
- TABLE 181 EMPLOYEE EXPERIENCE MANAGEMENT MARKET: PRODUCT LAUNCHES, 2019–2022
- TABLE 182 EMPLOYEE EXPERIENCE MANAGEMENT MARKET: DEALS, 2020–2022
- TABLE 183 COMPARATIVE ANALYSIS OF PROMINENT EMPLOYEE EXPERIENCE MANAGEMENT SOLUTIONS
- TABLE 184 QUALTRICS: BUSINESS OVERVIEW
- TABLE 185 QUALTRICS: PRODUCTS/SOLUTIONS/SERVICES OFFERED
- TABLE 186 QUALTRICS: DEALS
- TABLE 187 SAP: BUSINESS OVERVIEW
- TABLE 188 SAP: PRODUCTS/SOLUTIONS/SERVICES OFFERED
- TABLE 189 SAP: DEALS
- TABLE 190 ORACLE: BUSINESS OVERVIEW
- TABLE 191 ORACLE: PRODUCTS/SOLUTIONS OFFERED
- TABLE 192 ORACLE: DEALS
- TABLE 193 MICROSOFT: BUSINESS OVERVIEW
- TABLE 194 MICROSOFT: PRODUCTS/SOLUTIONS/SERVICES OFFERED
- TABLE 195 MICROSOFT: PRODUCT LAUNCHES
- TABLE 196 MICROSOFT: DEALS
- TABLE 197 WORKDAY: BUSINESS OVERVIEW
- TABLE 198 WORKDAY: PRODUCTS/SOLUTIONS/SERVICES OFFERED
- TABLE 199 WORKDAY: DEALS
- TABLE 200 ZOOM VIDEO COMMUNICATIONS: BUSINESS OVERVIEW
- TABLE 201 ZOOM VIDEO COMMUNICATIONS: PRODUCTS/SOLUTIONS/SERVICES OFFERED
- TABLE 202 ZOOM VIDEO COMMUNICATIONS: DEALS
- TABLE 203 ZOHO CORPORATION: BUSINESS OVERVIEW
- TABLE 204 ZOHO CORPORATION: PRODUCTS/SOLUTIONS/SERVICES OFFERED
- TABLE 205 ZOHO CORPORATION: DEALS
- TABLE 206 CULTURE AMP: BUSINESS OVERVIEW
- TABLE 207 CULTURE AMP: PRODUCTS/SOLUTIONS OFFERED
- TABLE 208 CULTURE AMP: DEALS
- TABLE 209 ACHIEVERS: BUSINESS OVERVIEW
- TABLE 210 ACHIEVERS: PRODUCTS/SOLUTIONS/SERVICES OFFERED
- TABLE 211 ACHIEVERS: DEALS
- TABLE 212 WORKLEAP: BUSINESS OVERVIEW
- TABLE 213 WORKLEAP: PRODUCTS/SOLUTIONS/SERVICES OFFERED
- TABLE 214 WORKLEAP: DEALS
- TABLE 215 ADJACENT MARKETS AND FORECASTS
- TABLE 216 WORKFORCE MANAGEMENT MARKET, BY COMPONENT, 2018–2025 (USD MILLION)
- TABLE 217 SOLUTIONS: WORKFORCE MANAGEMENT MARKET, BY REGION, 2018–2025 (USD MILLION)
- TABLE 218 SERVICES: WORKFORCE MANAGEMENT MARKET, BY REGION, 2018–2025 (USD MILLION)
- TABLE 219 WORKFORCE MANAGEMENT MARKET, BY SOLUTION, 2018–2025 (USD MILLION)
- TABLE 220 WORKFORCE MANAGEMENT MARKET, BY SERVICE, 2018–2025 (USD MILLION)
- TABLE 221 WORKFORCE MANAGEMENT MARKET, BY DEPLOYMENT TYPE, 2018–2025 (USD MILLION)
- TABLE 222 WORKFORCE MANAGEMENT MARKET, BY ORGANIZATION SIZE, 2018–2025 (USD MILLION)
- TABLE 223 WORKFORCE MANAGEMENT MARKET, BY VERTICAL, 2018–2025 (USD MILLION)
- TABLE 224 HR ANALYTICS MARKET, BY COMPONENT, 2017–2024 (USD MILLION)
- TABLE 225 SOLUTIONS: HR ANALYTICS MARKET, BY REGION, 2017–2024 (USD MILLION)
- TABLE 226 SERVICES: HR ANALYTICS MARKET, BY REGION, 2017–2024 (USD MILLION)
- TABLE 227 SERVICES: HR ANALYTICS MARKET, BY TYPE, 2017–2024 (USD MILLION)
- TABLE 228 HR ANALYTICS MARKET, BY APPLICATION AREA, 2017–2024 (USD MILLION)
- TABLE 229 HR ANALYTICS MARKET, BY ORGANIZATION SIZE, 2017–2024 (USD MILLION)
- TABLE 230 HR ANALYTICS MARKET, BY DEPLOYMENT TYPE, 2017–2024 (USD MILLION)
- TABLE 231 HR ANALYTICS MARKET, BY VERTICAL, 2017–2024 (USD MILLION)
- FIGURE 1 EMPLOYEE EXPERIENCE MANAGEMENT MARKET: RESEARCH DESIGN
- FIGURE 2 BOTTOM-UP APPROACH
- FIGURE 3 MARKET SIZE ESTIMATION METHODOLOGY, BOTTOM-UP (SUPPLY SIDE): COLLECTIVE REVENUE FROM SOFTWARE AND SERVICES OF EMPLOYEE EXPERIENCE MANAGEMENT MARKET
- FIGURE 4 TOP-DOWN APPROACH
- FIGURE 5 MARKET SIZE ESTIMATION METHODOLOGY: DEMAND-SIDE ANALYSIS
- FIGURE 6 MARKET SIZE ESTIMATION METHODOLOGY: SUPPLY-SIDE ANALYSIS
- FIGURE 7 DATA TRIANGULATION
- FIGURE 8 EMPLOYEE EXPERIENCE MANAGEMENT MARKET, 2021–2028 (USD MILLION)
- FIGURE 9 ALIGNMENT OF EMPLOYEE VALUES AND COMPANY VISION TO DRIVE MARKET GROWTH
- FIGURE 10 SERVICES SEGMENT TO REGISTER HIGHER GROWTH RATE DURING FORECAST PERIOD
- FIGURE 11 EMPLOYEE ENGAGEMENT SEGMENT ESTIMATED TO LEAD MARKET IN 2023
- FIGURE 12 IT & ITES SEGMENT TO LEAD MARKET DURING FORECAST PERIOD
- FIGURE 13 SOFTWARE AND IT & ITES TO ACCOUNT FOR LARGEST MARKET IN 2023
- FIGURE 14 DRIVERS, RESTRAINTS, OPPORTUNITIES, AND CHALLENGES: EMPLOYEE EXPERIENCE MANAGEMENT MARKET
- FIGURE 15 EMPLOYEE EXPERIENCE MANAGEMENT MARKET: VALUE CHAIN ANALYSIS
- FIGURE 16 KEY PLAYERS IN EMPLOYEE EXPERIENCE MANAGEMENT MARKET ECOSYSTEM
- FIGURE 17 PORTER’S FIVE FORCES ANALYSIS: EMPLOYEE EXPERIENCE MANAGEMENT MARKET
- FIGURE 18 EVOLUTION OF EMPLOYEE EXPERIENCE MANAGEMENT SOLUTIONS
- FIGURE 19 EMPLOYEE EXPERIENCE MANAGEMENT TOOLS, FRAMEWORKS, AND TECHNIQUES
- FIGURE 20 REVENUE SHIFT IN EMPLOYEE EXPERIENCE MANAGEMENT MARKET
- FIGURE 21 AVERAGE SELLING PRICE TREND OF KEY PLAYERS, BY SOLUTION (USD PER USER/YEAR)
- FIGURE 22 LIST OF MAJOR PATENTS FOR EMPLOYEE EXPERIENCE MANAGEMENT
- FIGURE 23 INFLUENCE OF STAKEHOLDERS ON BUYING PROCESS FOR INDUSTRY
- FIGURE 24 KEY BUYING CRITERIA FOR KEY INDUSTRIES
- FIGURE 25 SERVICES SEGMENT TO GROW AT HIGHER CAGR DURING FORECAST PERIOD
- FIGURE 26 STANDALONE SEGMENT TO ACCOUNT FOR LARGER MARKET SIZE DURING FORECAST PERIOD
- FIGURE 27 EMPLOYEE ENGAGEMENT SEGMENT TO ACCOUNT FOR LARGEST MARKET SIZE DURING FORECAST PERIOD
- FIGURE 28 IT & ITES SEGMENT TO ACCOUNT FOR LARGEST MARKET SIZE DURING FORECAST PERIOD
- FIGURE 29 ASIA PACIFIC TO REGISTER HIGHEST CAGR DURING FORECAST PERIOD
- FIGURE 30 NORTH AMERICA: MARKET SNAPSHOT
- FIGURE 31 ASIA PACIFIC: MARKET SNAPSHOT
- FIGURE 32 REVENUE ANALYSIS FOR KEY COMPANIES IN PAST 5 YEARS
- FIGURE 33 SHARE OF LEADING COMPANIES IN EMPLOYEE EXPERIENCE MANAGEMENT MARKET
- FIGURE 34 EMPLOYEE EXPERIENCE MANAGEMENT MARKET: COMPANY EVALUATION MATRIX, 2022
- FIGURE 35 EMPLOYEE EXPERIENCE MANAGEMENT MARKET: STARTUP/SME EVALUATION MATRIX, 2022
- FIGURE 36 RANKING OF KEY EMPLOYEE EXPERIENCE MANAGEMENT VENDORS, 2022
- FIGURE 37 VALUATION AND FINANCIAL METRICS OF KEY EMPLOYEE EXPERIENCE MANAGEMENT VENDORS
- FIGURE 38 SAP: COMPANY SNAPSHOT
- FIGURE 39 ORACLE: COMPANY SNAPSHOT
- FIGURE 40 MICROSOFT: COMPANY SNAPSHOT
- FIGURE 41 WORKDAY: COMPANY SNAPSHOT
- FIGURE 42 ZOOM VIDEO COMMUNICATIONS: COMPANY SNAPSHOT
The research study involved four major activities in estimating the employee experience management market size. Exhaustive secondary research has been done to collect important information about the market and peer markets. The next step has been to validate these findings, assumptions, and sizing with the help of primary research with industry experts across the value chain. Both top-down and bottom-up approaches have been used to estimate the market size. Post which the market breakdown and data triangulation have been adopted to estimate the market sizes of segments and sub-segments.
Secondary Research
The market size of the companies offering employee experience management to various end users was arrived at based on the secondary data available through paid and unpaid sources and by analyzing the product portfolios of major companies in the ecosystem and rating the companies based on their performance and quality. In the secondary research process, various sources were referred to identify and collect information for the study. The secondary sources included annual reports of Microsoft, press releases of multiple companies, such as Oracle, SAP, and Qualtrics, and white papers, journals, and certified publications and articles from recognized authors, directories, and databases, such as the IMF and the US Bureau of Labor Statistics.
Secondary research was used to obtain critical information about the industry’s supply chain, the total pool of key players, market classification and segmentation according to the industry trends to the bottom-most level, regional markets, and key developments from market- and technology-oriented perspectives, all of which were further validated by primary sources.
Primary Research
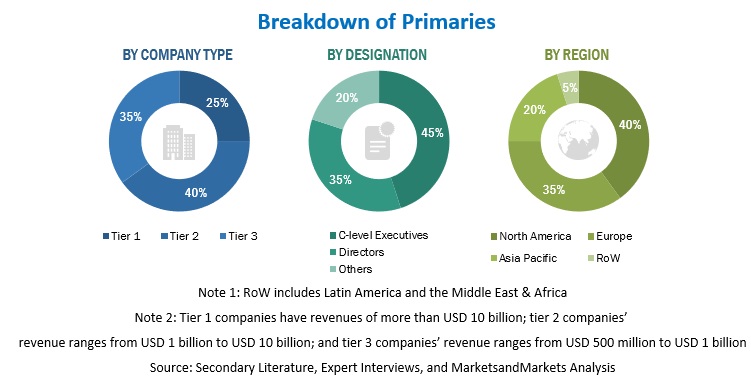
In the primary research process, various primary sources from the supply and demand sides were interviewed to obtain qualitative and quantitative information for the report. The primary sources from the supply side included Chief Executive Officers (CEOs), Chief Technology Officers (CTOs), Chief Operating Officers (COOs), Vice Presidents (VPs), Managing Directors (MDs), technology and innovation directors, and related key executives from various key companies and organizations operating in the employee experience management market.
Primary interviews were conducted to gather insights, such as market statistics, data on revenue collected from software and services, market breakups, market size estimations, market forecasts, and data triangulation. Stakeholders from the demand side, such as Chief Information Officers (CIOs), Chief Finance Officers (CFOs), Chief Strategy Officers (CSOs), and the installation team of end users who use employee experience management, were interviewed to understand buyers’ perspectives on suppliers, products, service providers, and their current usage of employee experience management, which is expected to affect the overall employee experience management market growth.
To know about the assumptions considered for the study, download the pdf brochure
Market Size Estimation
In the market engineering process, the top-down and bottom-up approaches were used along with multiple data triangulation methods to estimate and validate the size of the employee experience management market and other dependent submarkets. The research methodology used to estimate the market sizes includes the following:
- Initially, MarketsandMarkets focuses on top-line investments and spending in the ecosystems. Further, significant developments in the critical market area have been considered.
- Tracking the recent and upcoming developments in the employee experience management market that include investments, R&D activities, product launches, collaborations, mergers and acquisitions, and partnerships, as well as forecasting the market size based on these developments and other critical parameters.
- Conduct multiple discussions with key opinion leaders to know about diverse types of authentications and brand protection offerings used and the applications for which they are used to analyze the breakup of the scope of work carried out by major companies.
- Segmenting the market based on technology types concerning applications wherein the types are to be used and deriving the size of the global application market.
- Segmenting the overall market into various market segments
- Validating the estimates at every level through discussions with key opinion leaders, such as chief executives (CXOs), directors, and operation managers, and finally with the domain experts at MarketsandMarkets
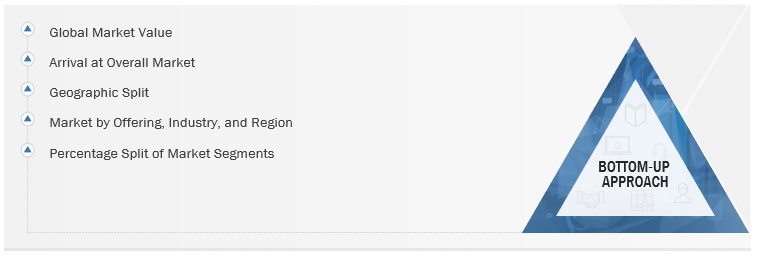
Market Size Estimation Methodology-Bottom-up approach
To know about the assumptions considered for the study, Request for Free Sample Report
Market Size Estimation Methodology-top-down approach
Data Triangulation
After arriving at the overall market size from the estimation process explained above, the employee experience management market has been split into several segments and sub-segments. To complete the overall market engineering process and arrive at the exact statistics for all segments and sub-segments, data triangulation and market breakdown procedures have been used, wherever applicable. The data has been triangulated by studying various factors and trends from both the demand and supply sides.
The employee experience management market size has been validated using top-down and bottom-up approaches.
Market Definition
Employee experience management (EXM) is a comprehensive solution that combines technology, tools, and services to enhance employee engagement, productivity, and retention, which can significantly impact an organization's profitability and efficiency. EXM involves shaping every employee interaction with a company, from the hiring process to onboarding and exit strategies. Both IT and HR departments play a critical role in implementing strategies that support optimal employee performance. Technology is a crucial enabler of a positive EXM strategy, and by selecting the right tools and integrating them seamlessly, organizations can create a data-driven, personalized, and continually evolving employee experience that fosters productivity, loyalty, and a thriving company culture.
Stakeholders
- Employee experience management software and service providers
- Value-added resellers (VARs)
- Research organizations
- Consulting firms
- Application service providers
- Cloud platform providers
- Investors and venture capitalists
- System integrators (SIs)
- Technology providers
- Suppliers, distributors, and contractors
- End users/Enterprise users
Report Objectives
- To determine and forecast the global employee experience management market by offering (software and services), industry, and region from 2023 to 2028, and analyze the various macroeconomic and microeconomic factors that affect the market growth.
- To forecast the size of the market segments concerning five central regions: North America, Europe, Asia Pacific (APAC), Latin America, and the Middle East & Africa (MEA).
- To provide detailed information about the major factors (drivers, restraints, opportunities, and challenges) influencing the growth of the market.
- To analyze each submarket with respect to individual growth trends, prospects, and contributions to the overall market.
- To analyze the opportunities in the market for stakeholders by identifying the high-growth segments of the market.
- To profile the key market players; provide a comparative analysis based on business overviews, regional presence, product offerings, business strategies, and key financials; and illustrate the market’s competitive landscape.
- Track and analyze competitive developments in the market, such as mergers and acquisitions, product developments, partnerships and collaborations, and Research and Development (R&D) activities.
Available Customizations
With the given market data, MarketsandMarkets offers customizations per the company’s specific needs. The following customization options are available for the report:
Geographic Analysis
- Further break-up of the Asia Pacific market into countries contributing 75% to the regional market size
- Further break-up of the North American market into countries contributing 75% to the regional market size
- Further break-up of the Latin American market into countries contributing 75% to the regional market size
- Further break-up of the Middle East African market into countries contributing 75% to the regional market size
- Further break-up of the European market into countries contributing 75% to the regional market size
Company Information
- Detailed analysis and profiling of additional market players (up to 5)
Growth opportunities and latent adjacency in Employee Experience Management Market