Embedded Finance Market

Embedded Finance Market Size, Share, Growth Analysis, By Type (embedded payments, embedded lending, embedded insurance, embedded wealth management), Business Model, Industry (retail & eCommerce, healthcare) - Global Forecast to 2029

Report Code: TC 9065 Jul, 2024, by marketsandmarkets.com

The embedded finance market is estimated to be worth USD 115.8 billion in 2024. It is projected to reach USD 251.5 billion by 2029 at a Compound Annual Growth Rate (CAGR) of 16.8% during the forecast period. The embedded finance market is expected to surge substantially in the coming years due to the growing advancement and integration of non-financial platforms with flexible access to financial services.

Embedded Finance Market

To know about the assumptions considered for the study, Request for Free Sample Report

Embedded Finance Market Opportunities

To know about the assumptions considered for the study, download the pdf brochure

Embedded Finance Market Trends

Driver: Digitization of financial services

Technology is empowering the movement towards digital solutions across the financial services market and enabling banking, lending, insurance, payments, and other services to be incorporated into everyday apps. This change helps to carry out the current financial operations instantly and delivers individual services to customers. For instance, Cake by VPBank and GoTyme Bank in Southeast Asia are both strong examples of firms that have successfully incorporated the embedded finance model and made use of new technologies to integrate more value-added services, which would ultimately cater to customers’ needs and financial access. In the United States, the embedded finance market has also been forecasted to grow highly, with Nasdaq attributing this to the digital transformation of many industries. Mobile banking applications and online payment portals served as perfect examples of how integration with the digital world helps to bring financial services closer to consumers and make them more readily acceptable.

Restraint: Data privacy concerns

The threat arises with the facility of providing financial services as it requires the safeguarding of users’ data. There is a genuine fear of data confidentiality and integrity as businesses must guarantee that they respect data protection policy and avoid data leakage, compromising customer trust. Other regulations include the General Data Protection Regulation (GDPR), which applies to the European Union, and the California Consumer Privacy Act (CCPA), which applies to the United States, which makes it mandatory for organizations to employ appropriate measures to protect data and offer users more visibility on the use made of their data.

Opportunity: Financial Inclusion

Embedded Finance is advantageous to the community because it can deliver financial services to the unserved due to banking constraints using popular tools such as mobile applications that offer businesses the ability to provide financial services to consumers who may otherwise not have access to these services and thus become active participants in the economy. For instance, starting with micro-credit or saving products within mobile money can offer a financial product to people in rural or low-income settings who cannot afford a bank.

Challenge: Cybersecurity risks

Incorporating financial services in diverse applications raises the vulnerability of such attacks and break-ins. Having secure financial data security is a must for business organizations, and employing it can be a difficult and expensive procedure. It may comprise hacking, phishing, and data compromise, which could lead to financial and legal consequences and reputational loss. The risks related to cybersecurity can be managed using better protocols, constant surveillance, and staff education.

Ecosystem Of Embedded Finance Market

List of Top Companies in Embedded Finance Market

The prominent players in the embedded finance market include Stripe, Inc. (US), PayPal Holdings, Inc. (US), Amazon.com, Inc. (US), Plaid, Inc. (US), Klarna Bank AB (Sweden), FIS (US), Visa Inc. (US), Cross River Bank (US), Zeta Services Inc. (US), Marqeta, Inc. (US), Wise Payments Limited (UK), Goldman Sachs (UK), JPMorgan Chase & Co. (US), Alipay+ (China),  and so on. These companies have been operating in the market for several years and possess a diversified product portfolio and state-of-the-art technologies with a well-established geographic footprint.

Based on the business model, the B2C model is expected to hold a higher growth rate during the forecast period

Looking at the future of the embedded finance market up to 2029, it is predicted that B2C business models have the potential to register a higher growth rate for various reasons. The availability of financial services on B2C platforms brings transactional convenience to consumers by performing operations in familiar portals. Evaluating payment options, loans, and insurance directly into these platforms makes the use more accessible and enhances engagement. Large amounts of consumer data also facilitate the customization of financial products, which boosts the uptake of such commodities and loyalty among patrons. Legal requirements are another factor uniquely addressed through robust B2C frameworks, which are fundamental to the buildup of consumer confidence. These partnerships help such platforms to remain innovative and add more financial utilities to their offerings, thereby signifying even higher growth prospects for B2C models within the embedded finance space in the forecasting period.

By type, embedded payments are estimated to have the largest market size during the forecast period

Among all the types of embedded finance, the embedded payments segment is likely to account for the largest market share during the forecast period due to their integration into non-financial platforms making customers’ experience and convenience much better. This integration removes the friction of a direct transaction, increases user engagement, and targets the ever-increasing demand for digital transactions worldwide. With more applications gaining ground and integrating into different industries, such as e-business and digital trade markets, the market size for embedded payments is set to expand significantly, thereby redefining the future of financial transactions and services.

North America is expected to register the largest market share during the forecast period. 

The largest market share throughout 2029 is expected from North America due to its well-established technological structure in conventional and emerging digital services and government support for innovations while maintaining the consumers’ protection. There are many opportunities for partnerships and collaborations because the region is already developed and has a highly concentrated financial business ecosystem with several banks, financial institutions, and fintech companies. This is complemented by increasingly heavy investments in venture capital and private equity, which continues to encourage development and expansion. Secondly, North American consumers expect their financial solutions to be all-encompassing and must be integrated into multiple applications. The region continues to develop and create new innovative use cases like digital wallets and the BNPL sector, which confirms its position as the global leader in embedded finance.

North American Embedded Finance Market

Market Players:

The major players in the embedded finance market are Stripe, Inc. (US), PayPal Holdings, Inc. (US), Amazon.com, Inc. (US), Plaid, Inc. (US), Klarna Bank AB (Sweden), FIS (US), Visa Inc. (US), Cross River Bank (US), Zeta Services Inc. (US), Marqeta, Inc. (US), Wise Payments Limited (UK), Goldman Sachs (UK), JPMorgan Chase & Co. (US), Alipay+ (China), Unit Finance Inc. (US), Solaris SE (Germany), Parafin, Inc. (US), Belvo (Mexico), Kasko Ltd. (UK), Tint Technologies Inc. (US), Mezu, Inc. (US), Fortis Payment Systems (US), Additiv AG (Switzerland), Galileo Financial Technologies, LLC (US), Trevipay (US). These players have adopted various growth strategies, such as partnerships, agreements and collaborations, new product launches and enhancements, and acquisitions to expand their passenger information system market footprint.

Get online access to the report on the World's First Market Intelligence Cloud

  • Easy to Download Historical Data & Forecast Numbers
  • Company Analysis Dashboard for high growth potential opportunities
  • Research Analyst Access for customization & queries
  • Competitor Analysis with Interactive dashboard
  • Latest News, Updates & Trend analysis
Request Sample

Scope of the Report

Report Metrics

Details

Market size available for years

2020-2029

Base year considered

2023

Forecast period

2024–2029

Forecast units

Value (USD) Billion

Segments Covered

by type (embedded payments, embedded lending, embedded insurance, embedded investment/wealth management, other types), business model (B2B, B2C), industry (retail & eCommerce, healthcare, education, telecom, transportation, mobility and logistics, travel & hospitality, other industries)

Region covered

North America, Europe, Asia Pacific, Middle East & Africa, and Latin America.

Companies covered

Stripe, Inc. (US), PayPal Holdings, Inc. (US), Amazon.com, Inc. (US), Plaid, Inc. (US), Klarna Bank AB (Sweden), FIS (US), Visa Inc. (US), Cross River Bank (US), Zeta Services Inc. (US), Marqeta, Inc. (US), Wise Payments Limited (UK), Goldman Sachs (UK), JPMorgan Chase & Co. (US), Alipay+ (China), Unit Finance Inc. (US), Solaris SE (Germany), Parafin, Inc. (US), Belvo (Mexico), Kasko Ltd. (UK), Tint Technologies Inc. (US), Mezu, Inc. (US), Fortis Payment Systems (US), Additiv AG (Switzerland), Galileo Financial Technologies, LLC (US), Trevipay (US).

This research report categorizes the embedded finance market to forecast revenues and analyze trends in each of the following submarkets:

Based on Type:
  • Embedded Payments
  • Embedded Lending
  • Embedded Insurance
  • Embedded Investment/Wealth Management           
  • Other Types
Based on the business model:
  • B2B
  • B2C
Based on Industry:
  • Retail & eCommerce
  • Healthcare
  • Education
  • Telecom
  • Transportation, Mobility, and Logistics
  • Travel & Hospitality
  • Other Industries
By Region:
  • North America
    • United States (US)
    • Canada
  • Europe
    • United Kingdom (UK)
    • Germany
    • France
    • Italy
    • Spain
    • Rest of Europe
  • Asia Pacific
    • China
    • Japan
    • India
    • Australia & New Zealand
    • South Korea      
    • Rest of Asia Pacific
  • Middle East & Africa
    • GCC Countries
    • Kingdom of Saudi Arabia (KSA)
    • United Arab Emirates (UAE)
    • Rest of GCC Countries
    • South Africa
    • Rest of the Middle East & Africa
  • Latin America
    • Brazil
    • Mexico
    • Rest of Latin America

Recent Development

  • In June 2024, Capital One joined forces with payment powerhouses Stripe and Adyen to introduce a free fraud reduction product.
  • In February 2024, Klarna launched ‘Sign in with Klarna’ to offer consumers a smoother shopping experience with increased control over their data.

Frequently Asked Questions (FAQ):

To speak to our analyst for a discussion on the above findings, click Speak to Analyst

TABLE OF CONTENTS
 
1 INTRODUCTION (Page No. - 25)
    1.1 STUDY OBJECTIVES 
    1.2 MARKET DEFINITION 
    1.3 STUDY SCOPE 
           1.3.1 MARKET SEGMENTATION
           1.3.2 REGIONS COVERED
           1.3.3 INCLUSIONS & EXCLUSIONS
           1.3.4 YEARS CONSIDERED
    1.4 CURRENCY CONSIDERED 
    1.5 STAKEHOLDERS 
    1.6 RECESSION IMPACT 
 
2 RESEARCH METHODOLOGY (Page No. - 29)
    2.1 RESEARCH DATA 
           2.1.1 SECONDARY DATA
                    2.1.1.1 Key data from secondary sources
           2.1.2 PRIMARY DATA
                    2.1.2.1 Breakup of primary interviews
                    2.1.2.2 Key primary interview participants
                    2.1.2.3 Key insights from industry experts
    2.2 MARKET BREAKUP AND DATA TRIANGULATION 
    2.3 MARKET SIZE ESTIMATION METHODOLOGY 
           2.3.1 TOP-DOWN APPROACH
                    2.3.1.1 Supply-side analysis
           2.3.2 BOTTOM-UP APPROACH
           2.3.3 EMBEDDED FINANCE MARKET ESTIMATION: DEMAND-SIDE ANALYSIS
    2.4 RESEARCH ASSUMPTIONS 
    2.5 LIMITATIONS 
    2.6 RISK ASSESSMENT 
    2.7 IMPLICATION OF RECESSION ON MARKET 
 
3 EXECUTIVE SUMMARY (Page No. - 38)
 
4 PREMIUM INSIGHTS (Page No. - 40)
    4.1 ATTRACTIVE OPPORTUNITIES FOR KEY PLAYERS IN MARKET 
    4.2 MARKET: TOP GROWING SEGMENTS 
    4.3 EMBEDDED FINANCE MARKET, BY INDUSTRY 
    4.4 MARKET, BY BUSINESS MODEL 
    4.5 MARKET, BY TYPE 
    4.6 NORTH AMERICA: MARKET, BY TYPE AND BUSINESS MODEL 
 
5 MARKET OVERVIEW AND INDUSTRY TRENDS (Page No. - 43)
    5.1 INTRODUCTION 
    5.2 MARKET DYNAMICS 
           5.2.1 DRIVERS
                    5.2.1.1 Digitalization of financial services
                    5.2.1.2 Consumer demand for convenience
                    5.2.1.3 Technological advancements
           5.2.2 RESTRAINTS
                    5.2.2.1 Regulatory complexities
                    5.2.2.2 Data privacy concerns
                    5.2.2.3 High implementation costs
           5.2.3 OPPORTUNITIES
                    5.2.3.1 Financial inclusion
                    5.2.3.2 Enhanced customer engagement
           5.2.4 CHALLENGES
                    5.2.4.1 Cybersecurity risks
                    5.2.4.2 Interoperability issues
                    5.2.4.3 Market competition
    5.3 INDUSTRY TRENDS 
           5.3.1 BRIEF HISTORY OF EMBEDDED FINANCE
           5.3.2 ECOSYSTEM ANALYSIS
           5.3.3 CASE STUDY ANALYSIS
                    5.3.3.1 Booksy switched to Stripe for faster payouts and omnichannel payments
                    5.3.3.2 With Plaid, Zip automated essential compliance work, securing shopping experience for millions of customers
                    5.3.3.3 Shopify built Shopify Balance with Stripe to give small businesses easier way to manage money
                    5.3.3.4 Adorama and PayPal’s solutions created picture-perfect portrait of success
           5.3.4 VALUE CHAIN ANALYSIS
           5.3.5 REGULATORY LANDSCAPE
                    5.3.5.1 Regulatory Bodies, Government Agencies, and Other Organizations
                               5.3.5.1.1 Financial Stability Board (FSB)
                               5.3.5.1.2 Consumer Financial Protection Bureau (CFPB)
                    5.3.5.2 North America
                               5.3.5.2.1 US
                               5.3.5.2.2 Canada
                    5.3.5.3 Europe
                    5.3.5.4 Asia Pacific
                               5.3.5.4.1 Australia
                               5.3.5.4.2 Singapore
                               5.3.5.4.3 Hong Kong
                    5.3.5.5 Middle East & Africa
                               5.3.5.5.1 UAE
                               5.3.5.5.2 South Africa
                    5.3.5.6 Latin America
                               5.3.5.6.1 Brazil
           5.3.6 PRICING ANALYSIS
                    5.3.6.1 Indicative pricing analysis, by type
                    5.3.6.2 Average pricing analysis, by solution
           5.3.7 TECHNOLOGY ANALYSIS
                    5.3.7.1 Key Technologies
                               5.3.7.1.1 Application Programming Interfaces (APIs)
                               5.3.7.1.2 Cloud Computing
                               5.3.7.1.3 Artificial Intelligence (AI) and Machine Learning (ML)
                    5.3.7.2 Complementary Technologies
                               5.3.7.2.1 Open Banking
                               5.3.7.2.2 Biometrics
                               5.3.7.2.3 Blockchain
                    5.3.7.3 Adjacent Technologies
                               5.3.7.3.1 Internet of Things (IoT)
                               5.3.7.3.2 Big Data Analytics
                               5.3.7.3.3 Regulatory Technology (RegTech)
           5.3.8 PATENT ANALYSIS
                    5.3.8.1 List of major patents
           5.3.9 PORTER’S FIVE FORCES’ ANALYSIS
                    5.3.9.1 Threat of new entrants
                    5.3.9.2 Threat of substitutes
                    5.3.9.3 Bargaining power of suppliers
                    5.3.9.4 Bargaining power of buyers
                    5.3.9.5 Intensity of competitive rivalry
           5.3.10 TRENDS/DISRUPTIONS IMPACTING CUSTOMERS’ BUSINESSES
           5.3.11 KEY STAKEHOLDERS AND BUYING CRITERIA
                    5.3.11.1 Key stakeholders in buying process
                    5.3.11.2 Buying criteria
           5.3.12 KEY CONFERENCES AND EVENTS
           5.3.13 TECHNOLOGY ROADMAP FOR EMBEDDED FINANCE MARKET
                    5.3.13.1 Short-term roadmap (2023–2025)
                    5.3.13.2 Mid-term roadmap (2026–2028)
                    5.3.13.3 Long-term roadmap (2029–2030)
           5.3.14 BEST PRACTICES IN MARKET
                    5.3.14.1 Integrate Financial Services Seamlessly
                    5.3.14.2 Prioritize Compliance and Security
                    5.3.14.3 Offer Personalized Financial Services
                    5.3.14.4 Focus on User-centric Design
                    5.3.14.5 Leverage Data Analytics and Insights
           5.3.15 CURRENT AND EMERGING BUSINESS MODELS
                    5.3.15.1 Subscription-based Model
                    5.3.15.2 Pay-per-use Model
                    5.3.15.3 Freemium Model
                    5.3.15.4 Transaction-based Model
                    5.3.15.5 Advertising-based Model
           5.3.16 THREE MODELS OF EMBEDDED PAYMENTS
                    5.3.16.1 Referral partnership
                    5.3.16.2 Payment facilitation
                    5.3.16.3 Payment facilitation-as-a-service
           5.3.17 EMBEDDED FINANCE MARKET: TOOLS, FRAMEWORKS, AND TECHNIQUES
           5.3.18 INVESTMENT AND FUNDING SCENARIO
 
6 EMBEDDED FINANCE MARKET, BY TYPE (Page No. - 71)
    6.1 INTRODUCTION 
           6.1.1 TYPE: MARKET DRIVERS
    6.2 EMBEDDED PAYMENTS 
           6.2.1 STREAMLINED INTEGRATION OF PAYMENT PROCESSING INTO NON-FINANCIAL PLATFORMS TO ENHANCE USER EXPERIENCE AND BOOST TRANSACTION EFFICIENCY
    6.3 EMBEDDED LENDING 
           6.3.1 SIMPLIFIES FINANCING OPTIONS AND BOOSTS CONSUMER SPENDING AND LOYALTY BY INTEGRATING CREDIT AND LOAN SERVICES DIRECTLY WITHIN PLATFORMS
    6.4 EMBEDDED INSURANCE 
           6.4.1 IMPROVES CUSTOMER SATISFACTION AND TRANSACTION VALUE BY OFFERING PERSONALIZED COVERAGE SOLUTIONS SEAMLESSLY INTEGRATED INTO TRANSACTIONS
    6.5 EMBEDDED INVESTMENT/WEALTH MANAGEMENT 
           6.5.1 INTEGRATION OF FINANCIAL ADVISORY AND INVESTMENT SERVICES WITHIN DIGITAL PLATFORMS TO PROVIDE COMPREHENSIVE FINANCIAL SOLUTIONS, ENHANCING USER ENGAGEMENT AND SATISFACTION
    6.6 OTHER TYPES 
 
7 EMBEDDED FINANCE MARKET, BY BUSINESS MODEL (Page No. - 79)
    7.1 INTRODUCTION 
           7.1.1 BUSINESS MODEL: MARKET DRIVERS
    7.2 B2B 
           7.2.1 ENHANCES EFFICIENCY AND SCALABILITY IN BUSINESS OPERATIONS, DRIVING INNOVATION IN TRANSACTION MANAGEMENT AND FINANCIAL INSIGHTS.
    7.3 B2C 
           7.3.1 IMPROVES CONVENIENCE AND LOYALTY IN CONSUMER-FACING PLATFORMS, ENHANCING SHOPPING EXPERIENCES WITH SEAMLESS PAYMENT SOLUTIONS.
 
8 EMBEDDED FINANCE MARKET, BY INDUSTRY (Page No. - 84)
    8.1 INTRODUCTION 
           8.1.1 INDUSTRY: MARKET DRIVERS
    8.2 RETAIL & E-COMMERCE 
           8.2.1 ENHANCING SALES AND CHECKOUT EXPERIENCES WITH SEAMLESS PAYMENTS AND CREDIT SERVICES
           8.2.2 USE CASES
                    8.2.2.1 E-commerce platforms enabling embedded lending solutions for MSMEs
    8.3 HEALTHCARE 
           8.3.1 SIMPLIFYING MEDICAL BILLING AND IMPROVING AFFORDABILITY THROUGH INSTALLMENT PLANS AND SPECIALIZED FINANCING SOLUTIONS
           8.3.2 USE CASES
                    8.3.2.1 Optional add-on travel insurance offered by Indian Railways while booking tickets online
    8.4 EDUCATION 
           8.4.1 STREAMLINING GLOBAL TUITION PAYMENTS AND STUDENT LOANS, IMPROVING FINANCIAL MANAGEMENT FOR INSTITUTIONS AND STUDENTS.
           8.4.2 USE CASES
                    8.4.2.1 Personalized education finance solutions by EdTech companies
    8.5 TELECOM 
           8.5.1 EXPANDING MOBILE BANKING AND DIGITAL PAYMENTS, FOSTERING FINANCIAL INCLUSION THROUGH PARTNERSHIPS WITH TELECOM OPERATORS
    8.6 TRANSPORTATION, MOBILITY, AND LOGISTICS 
           8.6.1 OPTIMIZING PAYMENTS FOR RIDESHARING AND LOGISTICS, ENHANCING OPERATIONAL EFFICIENCY
           8.6.2 USE CASES
                    8.6.2.1 Seamless payments and micro-insurance integration in ride-hailing apps
    8.7 TRAVEL & HOSPITALITY 
           8.7.1 OFFERING SEAMLESS PAYMENT OPTIONS AND ENHANCING BOOKING EXPERIENCES
    8.8 OTHER INDUSTRIES 
           8.8.1 USE CASES
                    8.8.1.1 Integrated payments and home loan services on real estate aggregator platforms
                    8.8.1.2 AgriTech platforms offering integrated finance for farmers
 
9 EMBEDDED FINANCE MARKET, BY REGION (Page No. - 95)
    9.1 INTRODUCTION 
    9.2 NORTH AMERICA 
           9.2.1 NORTH AMERICA: MARKET DRIVERS
           9.2.2 NORTH AMERICA: RECESSION IMPACT
           9.2.3 US
                    9.2.3.1 Embedded finance platforms to fundamentally reshape traditional banking services in US by embedding financial capabilities into everyday consumer experiences
           9.2.4 CANADA
                    9.2.4.1 Uptake of embedded finance solutions in Canada to reflect growing preference among tech-savvy consumers for integrated financial experiences that simplify transactions and enhance financial management
    9.3 EUROPE 
           9.3.1 EUROPE: EMBEDDED FINANCE MARKET DRIVERS
           9.3.2 EUROPE: RECESSION IMPACT
           9.3.3 UK
                    9.3.3.1 Consumers to favor convenience and accessibility offered by mobile banking apps that provide traditional banking services as well as incorporate advanced features
           9.3.4 GERMANY
                    9.3.4.1 Fintech startups partnering with traditional financial institutions to integrate banking services into retail and digital platforms, catering to evolving consumer preferences for convenience and efficiency
           9.3.5 FRANCE
                    9.3.5.1 French regulators to play pivotal role in creating favorable environment for fintech innovations
           9.3.6 ITALY
                    9.3.6.1 Key stakeholders in Italy's embedded finance ecosystem encompass adapting to digital transformation alongside agile fintech enterprises leveraging technology to innovate financial solutions
           9.3.7 SPAIN
                    9.3.7.1 Spain witnessing surge in adoption of embedded finance solutions, underscoring broader trend toward integrating financial services into non-financial digital platforms
           9.3.8 REST OF EUROPE
    9.4 ASIA PACIFIC 
           9.4.1 ASIA PACIFIC: EMBEDDED FINANCE MARKET DRIVERS
           9.4.2 ASIA PACIFIC: RECESSION IMPACT
           9.4.3 CHINA
                    9.4.3.1 Consumers increasingly rely on digital platforms for everything, from everyday purchases to sophisticated financial planning
           9.4.4 JAPAN
                    9.4.4.1 Plaid, Stripe, and Wallester to be pivotal in shaping future of financial services in Japan
           9.4.5 INDIA
                    9.4.5.1 Digital payments through embedded finance solutions in India witnessed remarkable surge of 183% year-on-year in transaction volumes
           9.4.6 AUSTRALIA & NEW ZEALAND
                    9.4.6.1 Adoption of embedded finance solutions in Australia witnessed notable uptick, with 30% increase in digital wallet transactions compared to previous year
           9.4.7 REST OF ASIA PACIFIC
    9.5 MIDDLE EAST & AFRICA 
           9.5.1 MIDDLE EAST & AFRICA: EMBEDDED FINANCE MARKET DRIVERS
           9.5.2 MIDDLE EAST & AFRICA: RECESSION IMPACT
           9.5.3 GCC COUNTRIES
                    9.5.3.1 GCC's strategic location and role as global business hub to amplify potential of embedded finance to drive economic diversification and enhance financial inclusion
                    9.5.3.2 UAE
                               9.5.3.2.1 Partnerships between e-commerce platforms and financial institutions to enable seamless payment experiences and enhanced customer satisfaction
                    9.5.3.3 KSA
                               9.5.3.3.1 Surge in partnerships between fintech companies and traditional businesses in KSA to drive market growth
                    9.5.3.4 Rest of GCC Countries
           9.5.4 SOUTH AFRICA
                    9.5.4.1 Mobile-centric economy where significant portion of population accesses financial services through smartphones to drive market growth in South Africa
           9.5.5 REST OF MIDDLE EAST & AFRICA
    9.6 LATIN AMERICA 
           9.6.1 LATIN AMERICA: EMBEDDED FINANCE MARKET DRIVERS
           9.6.2 LATIN AMERICA: RECESSION IMPACT
           9.6.3 BRAZIL
                    9.6.3.1 Brazil's robust digital infrastructure, including high smartphone penetration and increasing internet connectivity, to drive market growth
           9.6.4 MEXICO
                    9.6.4.1 Mexico's supportive regulatory environment and growing fintech ecosystem, facilitating collaborations, to drive innovation and broaden scope of financial solutions available to consumers
           9.6.5 REST OF LATIN AMERICA
 
10 COMPETITIVE LANDSCAPE (Page No. - 138)
     10.1 INTRODUCTION 
     10.2 KEY PLAYER STRATEGIES/RIGHT TO WIN 
     10.3 REVENUE ANALYSIS 
     10.4 MARKET SHARE ANALYSIS 
             10.4.1 MARKET RANKING ANALYSIS
     10.5 COMPANY EVALUATION MATRIX: KEY PLAYERS, 2023 
             10.5.1 STARS
             10.5.2 EMERGING LEADERS
             10.5.3 PERVASIVE PLAYERS
             10.5.4 PARTICIPANTS
             10.5.5 COMPANY FOOTPRINT: KEY PLAYERS, 2023
     10.6 COMPANY EVALUATION MATRIX: STARTUPS/SMES, 2023 
             10.6.1 PROGRESSIVE COMPANIES
             10.6.2 RESPONSIVE COMPANIES
             10.6.3 DYNAMIC COMPANIES
             10.6.4 STARTING BLOCKS
             10.6.5 COMPETITIVE BENCHMARKING
     10.7 COMPETITIVE SCENARIO AND TRENDS 
             10.7.1 PRODUCT LAUNCHES
             10.7.2 DEALS
     10.8 BRAND/PRODUCT COMPARISON ANALYSIS 
     10.9 COMPANY VALUATION AND FINANCIAL METRICS OF KEY EMBEDDED FINANCE PROVIDERS 
 
11 COMPANY PROFILES (Page No. - 157)
     11.1 KEY PLAYERS 
             11.1.1 STRIPE, INC.
                       11.1.1.1 Business overview
                       11.1.1.2 Products/Solutions/Services offered
                       11.1.1.3 Recent developments
                       11.1.1.4 MnM view
                                   11.1.1.4.1 Right to win
                                   11.1.1.4.2 Strategic choices
                                   11.1.1.4.3 Weaknesses and competitive threats
             11.1.2 PAYPAL HOLDINGS, INC.
                       11.1.2.1 Business overview
                       11.1.2.2 Products/Solutions/Services offered
                       11.1.2.3 Recent developments
                       11.1.2.4 MnM view
                                   11.1.2.4.1 Right to win
                                   11.1.2.4.2 Strategic choices
                                   11.1.2.4.3 Weaknesses and competitive threats
             11.1.3 AMAZON.COM, INC.
                       11.1.3.1 Business overview
                       11.1.3.2 Products/Solutions/Services offered
                       11.1.3.3 Recent developments
                       11.1.3.4 MnM view
                                   11.1.3.4.1 Right to win
                                   11.1.3.4.2 Strategic choices
                                   11.1.3.4.3 Weaknesses and competitive threats
             11.1.4 FIS
                       11.1.4.1 Business overview
                       11.1.4.2 Products/Solutions/Services offered
                       11.1.4.3 Recent developments
                       11.1.4.4 MnM view
                                   11.1.4.4.1 Right to win
                                   11.1.4.4.2 Strategic choices
                                   11.1.4.4.3 Weaknesses and competitive threats
             11.1.5 VISA INC.
                       11.1.5.1 Business overview
                       11.1.5.2 Products/Solutions/Services offered
                       11.1.5.3 Recent developments
                       11.1.5.4 MnM view
                                   11.1.5.4.1 Right to win
                                   11.1.5.4.2 Strategic choices
                                   11.1.5.4.3 Weaknesses and competitive threats
             11.1.6 PLAID, INC.
                       11.1.6.1 Business overview
                       11.1.6.2 Products/Solutions/Services offered
                       11.1.6.3 Recent developments
             11.1.7 KLARNA BANK AB
                       11.1.7.1 Business overview
                       11.1.7.2 Products/Solutions/Services offered
                       11.1.7.3 Recent developments
             11.1.8 CROSS RIVER BANK
                       11.1.8.1 Business overview
                       11.1.8.2 Products/Solutions/Services offered
                       11.1.8.3 Recent developments
             11.1.9 ZETA SERVICES INC.
                       11.1.9.1 Business overview
                       11.1.9.2 Products/Solutions/Services offered
                       11.1.9.3 Recent developments
               11.1.10 MARQETA, INC.
            11.1.10.1 Business overview
            11.1.10.2 Products/Solutions/Services offered
            11.1.10.3 Recent developments
               11.1.11 WISE PAYMENTS LIMITED
               11.1.12 GOLDMAN SACHS
               11.1.13 JPMORGAN CHASE & CO.
               11.1.14 ALIPAY+
     11.2 STARTUPS/SMES 
             11.2.1 UNIT FINANCE INC.
             11.2.2 SOLARIS SE
             11.2.3 PARAFIN, INC.
             11.2.4 BELVO
             11.2.5 KASKO LTD.
             11.2.6 TINT TECHNOLOGIES INC.
             11.2.7 MEZU, INC.
             11.2.8 FORTIS PAYMENT SYSTEMS
             11.2.9 ADDITIV AG
               11.2.10 GALILEO FINANCIAL TECHNOLOGIES, LLC
               11.2.11 TREVIPAY
 
12 ADJACENT/RELATED MARKETS (Page No. - 211)
     12.1 INTRODUCTION 
             12.1.1 LIMITATIONS
     12.2 DIGITAL PAYMENT MARKET 
             12.2.1 MARKET DEFINITION
             12.2.2 MARKET OVERVIEW
     12.3 SOLUTIONS 
             12.3.1 DIGITAL PAYMENT MARKET, BY TRANSACTION TYPE
             12.3.2 DIGITAL PAYMENT MARKET, BY PAYMENT MODE
             12.3.3 DIGITAL PAYMENT MARKET, BY VERTICAL
             12.3.4 DIGITAL PAYMENT MARKET, BY REGION
     12.4 PAYMENT PROCESSING SOLUTIONS MARKET 
             12.4.1 MARKET DEFINITION
             12.4.2 MARKET OVERVIEW
             12.4.3 PAYMENT PROCESSING SOLUTIONS, BY PAYMENT METHOD
             12.4.4 PAYMENT PROCESSING SOLUTIONS MARKET, BY VERTICAL
             12.4.5 PAYMENT PROCESSING SOLUTIONS MANAGEMENT MARKET, BY REGION
 
13 APPENDIX (Page No. - 220)
     13.1 DISCUSSION GUIDE 
     13.2 KNOWLEDGESTORE: MARKETSANDMARKETS’ SUBSCRIPTION PORTAL 
     13.3 CUSTOMIZATION OPTIONS 
     13.4 RELATED REPORTS 
     13.5 AUTHOR DETAILS 
 
 
LIST OF TABLES (207 Tables)
 
TABLE 1 USD EXCHANGE RATES, 2021–2023
TABLE 2 KEY PRIMARY INTERVIEW PARTICIPANTS
TABLE 3 RESEARCH ASSUMPTIONS
TABLE 4 RISK ASSESSMENT
TABLE 5 EMBEDDED FINANCE MARKET: ECOSYSTEM
TABLE 6 NORTH AMERICA: REGULATORY BODIES, GOVERNMENT AGENCIES, AND OTHER ORGANIZATIONS
TABLE 7 EUROPE: REGULATORY BODIES, GOVERNMENT AGENCIES, AND OTHER ORGANIZATIONS
TABLE 8 ASIA PACIFIC: LIST OF REGULATORY BODIES, GOVERNMENT AGENCIES, AND OTHER ORGANIZATIONS
TABLE 9 REST OF THE WORLD: REGULATORY BODIES, GOVERNMENT AGENCIES, AND OTHER ORGANIZATIONS
TABLE 10 INDICATIVE PRICING ANALYSIS OF EMBEDDED FINANCE, BY TYPE (USD)
TABLE 11 AVERAGE PRICING ANALYSIS OF KEY PLAYERS, BY SOLUTION (USD)
TABLE 12 PORTER’S FIVE FORCES’ IMPACT ON MARKET
TABLE 13 INFLUENCE OF STAKEHOLDERS ON BUYING PROCESS FOR INDUSTRIES
TABLE 14 KEY BUYING CRITERIA FOR INDUSTRIES
TABLE 15 MARKET: LIST OF KEY CONFERENCES AND EVENTS, 2024–2025
TABLE 16 MARKET, BY TYPE, 2020–2023 (USD BILLION)
TABLE 17 MARKET, BY TYPE, 2024–2029 (USD BILLION)
TABLE 18 EMBEDDED PAYMENTS: MARKET, BY REGION, 2020–2023 (USD BILLION)
TABLE 19 EMBEDDED PAYMENTS: MARKET, BY REGION, 2024–2029 (USD BILLION)
TABLE 20 EMBEDDED LENDING: MARKET, BY REGION, 2020–2023 (USD BILLION)
TABLE 21 EMBEDDED LENDING: EMBEDDED FINANCE MARKET, BY REGION, 2024–2029 (USD BILLION)
TABLE 22 EMBEDDED INSURANCE: MARKET, BY REGION, 2020–2023 (USD BILLION)
TABLE 23 EMBEDDED INSURANCE: MARKET, BY REGION, 2024–2029 (USD BILLION)
TABLE 24 EMBEDDED INVESTMENT/WEALTH MANAGEMENT: MARKET, BY REGION, 2020–2023 (USD BILLION)
TABLE 25 EMBEDDED INVESTMENT/WEALTH MANAGEMENT: MARKET, BY REGION, 2024–2029 (USD BILLION)
TABLE 26 OTHER TYPES: MARKET, BY REGION, 2020–2023 (USD BILLION)
TABLE 27 OTHER TYPES: MARKET, BY REGION, 2024–2029 (USD BILLION)
TABLE 28 EMBEDDED FINANCE MARKET, BY BUSINESS MODEL, 2020–2023 (USD BILLION)
TABLE 29 MARKET, BY BUSINESS MODEL, 2024–2029 (USD BILLION)
TABLE 30 B2B: MARKET, BY REGION, 2020–2023 (USD BILLION)
TABLE 31 B2B: MARKET, BY REGION, 2024–2029 (USD BILLION)
TABLE 32 B2C: MARKET, BY REGION, 2020–2023 (USD BILLION)
TABLE 33 B2C: MARKET, BY REGION, 2024–2029 (USD BILLION)
TABLE 34 MARKET, BY INDUSTRY, 2020–2023 (USD BILLION)
TABLE 35 MARKET, BY INDUSTRY, 2024–2029 (USD BILLION)
TABLE 36 RETAIL & E-COMMERCE: MARKET, BY REGION, 2020–2023 (USD BILLION)
TABLE 37 RETAIL & E-COMMERCE: MARKET, BY REGION, 2024–2029 (USD BILLION)
TABLE 38 HEALTHCARE: MARKET, BY REGION, 2020–2023 (USD BILLION)
TABLE 39 HEALTHCARE: MARKET, BY REGION, 2024–2029 (USD BILLION)
TABLE 40 EDUCATION: MARKET, BY REGION, 2020–2023 (USD BILLION)
TABLE 41 EDUCATION: MARKET, BY REGION, 2024–2029 (USD BILLION)
TABLE 42 TELECOM: MARKET, BY REGION, 2020–2023 (USD BILLION)
TABLE 43 TELECOM: MARKET, BY REGION, 2024–2029 (USD BILLION)
TABLE 44 TRANSPORTATION, MOBILITY, AND LOGISTICS: MARKET, BY REGION, 2020–2023 (USD BILLION)
TABLE 45 TRANSPORTATION, MOBILITY, AND LOGISTICS: MARKET, BY REGION, 2024–2029 (USD BILLION)
TABLE 46 TRAVEL & HOSPITALITY: MARKET, BY REGION, 2020–2023 (USD BILLION)
TABLE 47 TRAVEL & HOSPITALITY: MARKET, BY REGION, 2024–2029 (USD BILLION)
TABLE 48 OTHER INDUSTRIES: MARKET, BY REGION, 2020–2023 (USD BILLION)
TABLE 49 OTHER INDUSTRIES: MARKET, BY REGION, 2024–2029 (USD BILLION)
TABLE 50 EMBEDDED FINANCE MARKET, BY REGION, 2020–2023 (USD BILLION)
TABLE 51 MARKET, BY REGION, 2024–2029 (USD BILLION)
TABLE 52 NORTH AMERICA: MARKET, BY TYPE, 2020–2023 (USD BILLION)
TABLE 53 NORTH AMERICA: MARKET, BY TYPE, 2024–2029 (USD BILLION)
TABLE 54 NORTH AMERICA: MARKET, BY BUSINESS MODEL, 2020–2023 (USD BILLION)
TABLE 55 NORTH AMERICA: EMBEDDED FINANCE MARKET, BY BUSINESS MODEL, 2024–2029 (USD BILLION)
TABLE 56 NORTH AMERICA: MARKET, BY INDUSTRY, 2020–2023 (USD BILLION)
TABLE 57 NORTH AMERICA: MARKET, BY INDUSTRY, 2024–2029 (USD BILLION)
TABLE 58 NORTH AMERICA: MARKET, BY COUNTRY, 2020–2023 (USD BILLION)
TABLE 59 NORTH AMERICA: MARKET, BY COUNTRY, 2024–2029 (USD BILLION)
TABLE 60 US: MARKET, BY TYPE, 2020–2023 (USD BILLION)
TABLE 61 US: MARKET, BY TYPE, 2024–2029 (USD BILLION)
TABLE 62 US: MARKET, BY BUSINESS MODEL, 2020–2023 (USD BILLION)
TABLE 63 US: EMBEDDED FINANCE MARKET, BY BUSINESS MODEL, 2024–2029 (USD BILLION)
TABLE 64 US: MARKET, BY INDUSTRY, 2020–2023 (USD BILLION)
TABLE 65 US: MARKET, BY INDUSTRY, 2024–2029 (USD BILLION)
TABLE 66 EUROPE: MARKET, BY TYPE, 2020–2023 (USD BILLION)
TABLE 67 EUROPE: MARKET, BY TYPE, 2024–2029 (USD BILLION)
TABLE 68 EUROPE: MARKET, BY BUSINESS MODEL, 2020–2023 (USD BILLION)
TABLE 69 EUROPE: EMBEDDED FINANCE MARKET, BY BUSINESS MODEL, 2024–2029 (USD BILLION)
TABLE 70 EUROPE: MARKET, BY INDUSTRY, 2020–2023 (USD BILLION)
TABLE 71 EUROPE: MARKET, BY INDUSTRY, 2024–2029 (USD BILLION)
TABLE 72 EUROPE: MARKET, BY COUNTRY, 2020–2023 (USD BILLION)
TABLE 73 EUROPE: MARKET, BY COUNTRY, 2024–2029 (USD BILLION)
TABLE 74 UK: MARKET, BY TYPE, 2020–2023 (USD BILLION)
TABLE 75 UK: MARKET, BY TYPE, 2024–2029 (USD BILLION)
TABLE 76 UK: EMBEDDED FINANCE MARKET, BY BUSINESS MODEL, 2020–2023 (USD BILLION)
TABLE 77 UK: MARKET, BY BUSINESS MODEL, 2024–2029 (USD BILLION)
TABLE 78 UK: MARKET, BY INDUSTRY, 2020–2023 (USD BILLION)
TABLE 79 UK: MARKET, BY INDUSTRY, 2024–2029 (USD BILLION)
TABLE 80 ITALY: MARKET, BY TYPE, 2020–2023 (USD BILLION)
TABLE 81 ITALY: MARKET, BY TYPE, 2024–2029 (USD BILLION)
TABLE 82 ITALY: MARKET, BY BUSINESS MODEL, 2020–2023 (USD BILLION)
TABLE 83 ITALY: MARKET, BY BUSINESS MODEL, 2024–2029 (USD BILLION)
TABLE 84 ITALY: MARKET, BY INDUSTRY, 2020–2023 (USD BILLION)
TABLE 85 ITALY: MARKET, BY INDUSTRY, 2024–2029 (USD BILLION)
TABLE 86 ASIA PACIFIC: MARKET, BY TYPE, 2020–2023 (USD BILLION)
TABLE 87 ASIA PACIFIC: EMBEDDED FINANCE MARKET, BY TYPE, 2024–2029 (USD BILLION)
TABLE 88 ASIA PACIFIC: MARKET, BY BUSINESS MODEL, 2020–2023 (USD BILLION)
TABLE 89 ASIA PACIFIC: MARKET, BY BUSINESS MODEL, 2024–2029 (USD BILLION)
TABLE 90 ASIA PACIFIC: MARKET, BY INDUSTRY, 2020–2023 (USD BILLION)
TABLE 91 ASIA PACIFIC: MARKET, BY INDUSTRY, 2024–2029 (USD BILLION)
TABLE 92 ASIA PACIFIC: MARKET, BY COUNTRY, 2020–2023 (USD BILLION)
TABLE 93 ASIA PACIFIC: MARKET, BY COUNTRY, 2024–2029 (USD BILLION)
TABLE 94 CHINA: MARKET, BY TYPE, 2020–2023 (USD BILLION)
TABLE 95 CHINA: MARKET, BY TYPE, 2024–2029 (USD BILLION)
TABLE 96 CHINA: MARKET, BY BUSINESS MODEL, 2020–2023 (USD BILLION)
TABLE 97 CHINA: MARKET, BY BUSINESS MODEL, 2024–2029 (USD BILLION)
TABLE 98 CHINA: MARKET, BY INDUSTRY, 2020–2023 (USD BILLION)
TABLE 99 CHINA: MARKET, BY INDUSTRY, 2024–2029 (USD BILLION)
TABLE 100 INDIA: MARKET, BY TYPE, 2020–2023 (USD BILLION)
TABLE 101 INDIA: MARKET, BY TYPE, 2024–2029 (USD BILLION)
TABLE 102 INDIA: MARKET, BY BUSINESS MODEL, 2020–2023 (USD BILLION)
TABLE 103 INDIA: MARKET, BY BUSINESS MODEL, 2024–2029 (USD BILLION)
TABLE 104 INDIA: MARKET, BY INDUSTRY, 2020–2023 (USD BILLION)
TABLE 105 INDIA: MARKET, BY INDUSTRY, 2024–2029 (USD BILLION)
TABLE 106 MIDDLE EAST & AFRICA: MARKET, BY TYPE, 2020–2023 (USD BILLION)
TABLE 107 MIDDLE EAST & AFRICA: EMBEDDED FINANCE MARKET, BY TYPE, 2024–2029 (USD BILLION)
TABLE 108 MIDDLE EAST & AFRICA: MARKET, BY BUSINESS MODEL, 2020–2023 (USD BILLION)
TABLE 109 MIDDLE EAST & AFRICA: MARKET, BY BUSINESS MODEL, 2024–2029 (USD BILLION)
TABLE 110 MIDDLE EAST & AFRICA: MARKET, BY INDUSTRY, 2020–2023 (USD BILLION)
TABLE 111 MIDDLE EAST & AFRICA: MARKET, BY INDUSTRY, 2024–2029 (USD BILLION)
TABLE 112 MIDDLE EAST & AFRICA: MARKET, BY REGION/COUNTRY, 2020–2023 (USD BILLION)
TABLE 113 MIDDLE EAST & AFRICA: MARKET, BY REGION/COUNTRY, 2024–2029 (USD BILLION)
TABLE 114 GCC COUNTRIES: MARKET, BY TYPE, 2020–2023 (USD BILLION)
TABLE 115 GCC COUNTRIES: MARKET, BY TYPE, 2024–2029 (USD BILLION)
TABLE 116 GCC COUNTRIES: EMBEDDED FINANCE MARKET, BY BUSINESS MODEL, 2020–2023 (USD BILLION)
TABLE 117 GCC COUNTRIES: MARKET, BY BUSINESS MODEL, 2024–2029 (USD BILLION)
TABLE 118 GCC COUNTRIES: MARKET, BY INDUSTRY, 2020–2023 (USD BILLION)
TABLE 119 GCC COUNTRIES: MARKET, BY INDUSTRY, 2024–2029 (USD BILLION)
TABLE 120 GCC COUNTRIES: MARKET, BY COUNTRY, 2020–2023 (USD BILLION)
TABLE 121 GCC COUNTRIES: MARKET, BY COUNTRY, 2024–2029 (USD BILLION)
TABLE 122 KSA: MARKET, BY TYPE, 2020–2023 (USD BILLION)
TABLE 123 KSA: MARKET, BY TYPE, 2024–2029 (USD BILLION)
TABLE 124 KSA: MARKET, BY BUSINESS MODEL, 2020–2023 (USD BILLION)
TABLE 125 KSA: MARKET, BY BUSINESS MODEL, 2024–2029 (USD BILLION)
TABLE 126 KSA: MARKET, BY INDUSTRY, 2020–2023 (USD BILLION)
TABLE 127 KSA: MARKET, BY INDUSTRY, 2024–2029 (USD BILLION)
TABLE 128 LATIN AMERICA: MARKET, BY TYPE, 2020–2023 (USD BILLION)
TABLE 129 LATIN AMERICA: MARKET, BY TYPE, 2024–2029 (USD BILLION)
TABLE 130 LATIN AMERICA: EMBEDDED FINANCE MARKET, BY BUSINESS MODEL, 2020–2023 (USD BILLION)
TABLE 131 LATIN AMERICA: MARKET, BY BUSINESS MODEL, 2024–2029 (USD BILLION)
TABLE 132 LATIN AMERICA: MARKET, BY INDUSTRY, 2020–2023 (USD BILLION)
TABLE 133 LATIN AMERICA: MARKET, BY INDUSTRY, 2024–2029 (USD BILLION)
TABLE 134 LATIN AMERICA: MARKET, BY COUNTRY, 2020–2023 (USD BILLION)
TABLE 135 LATIN AMERICA: MARKET, BY COUNTRY, 2024–2029 (USD BILLION)
TABLE 136 BRAZIL: MARKET, BY TYPE, 2020–2023 (USD BILLION)
TABLE 137 BRAZIL: MARKET, BY TYPE, 2024–2029 (USD BILLION)
TABLE 138 BRAZIL: MARKET, BY BUSINESS MODEL, 2020–2023 (USD BILLION)
TABLE 139 BRAZIL: MARKET, BY BUSINESS MODEL, 2024–2029 (USD BILLION)
TABLE 140 BRAZIL: MARKET, BY INDUSTRY, 2020–2023 (USD BILLION)
TABLE 141 BRAZIL: MARKET, BY INDUSTRY, 2024–2029 (USD BILLION)
TABLE 142 OVERVIEW OF STRATEGIES ADOPTED BY KEY EMBEDDED FINANCE VENDORS
TABLE 143 EMBEDDED FINANCE MARKET: DEGREE OF COMPETITION
TABLE 144 TYPE FOOTPRINT
TABLE 145 BUSINESS MODEL FOOTPRINT
TABLE 146 INDUSTRY FOOTPRINT
TABLE 147 REGIONAL FOOTPRINT
TABLE 148 MARKET: KEY STARTUPS/SMES
TABLE 149 MARKET: COMPETITIVE BENCHMARKING OF KEY STARTUPS/SMES
TABLE 150 MARKET: PRODUCT LAUNCHES, MARCH 2023–JUNE 2024
TABLE 151 EMBEDDED FINANCE MARKET: DEALS, JULY 2023–JUNE 2024
TABLE 152 STRIPE, INC.: COMPANY OVERVIEW
TABLE 153 STRIPE, INC.: PRODUCTS/SOLUTIONS/SERVICES OFFERED
TABLE 154 STRIPE, INC.: PRODUCT LAUNCHES
TABLE 155 STRIPE, INC.: DEALS
TABLE 156 STRIPE, INC.: EXPANSIONS
TABLE 157 PAYPAL HOLDINGS, INC.: COMPANY OVERVIEW
TABLE 158 PAYPAL HOLDINGS, INC.: PRODUCTS/SOLUTIONS/SERVICES OFFERED
TABLE 159 PAYPAL HOLDINGS, INC.: PRODUCT LAUNCHES
TABLE 160 PAYPAL HOLDINGS, INC.: DEALS
TABLE 161 AMAZON.COM, INC.: COMPANY OVERVIEW
TABLE 162 AMAZON.COM, INC.: PRODUCTS/SOLUTIONS/SERVICES OFFERED
TABLE 163 AMAZON.COM, INC.: PRODUCT LAUNCHES
TABLE 164 AMAZON.COM, INC.: DEALS
TABLE 165 FIS: COMPANY OVERVIEW
TABLE 166 FIS: PRODUCTS/SOLUTIONS/SERVICES OFFERED
TABLE 167 FIS: PRODUCT LAUNCHES
TABLE 168 FIS: DEALS
TABLE 169 VISA INC.: COMPANY OVERVIEW
TABLE 170 VISA INC.: PRODUCTS/SOLUTIONS/SERVICES OFFERED
TABLE 171 VISA INC.: DEALS
TABLE 172 VISA INC.: OTHERS
TABLE 173 PLAID, INC.: COMPANY OVERVIEW
TABLE 174 PLAID, INC.: PRODUCTS/SOLUTIONS/SERVICES OFFERED
TABLE 175 PLAID, INC.: PRODUCT LAUNCHES
TABLE 176 PLAID, INC.: DEALS
TABLE 177 KLARNA BANK AB: COMPANY OVERVIEW
TABLE 178 KLARNA BANK AB: PRODUCTS/SOLUTIONS/SERVICES OFFERED
TABLE 179 KLARNA BANK AB: PRODUCT LAUNCHES
TABLE 180 KLARNA BANK AB: DEALS
TABLE 181 CROSS RIVER BANK: COMPANY OVERVIEW
TABLE 182 CROSS RIVER BANK: PRODUCTS/SOLUTIONS/SERVICES OFFERED
TABLE 183 CROSS RIVER BANK: DEALS
TABLE 184 ZETA SERVICES INC.: COMPANY OVERVIEW
TABLE 185 ZETA SERVICES INC.: PRODUCTS/SOLUTIONS/SERVICES OFFERED
TABLE 186 ZETA SERVICES INC.: PRODUCT LAUNCHES
TABLE 187 ZETA SERVICES INC.: DEALS
TABLE 188 MARQETA, INC.: COMPANY OVERVIEW
TABLE 189 MARQETA, INC.: PRODUCTS/SOLUTIONS/SERVICES OFFERED
TABLE 190 MARQETA, INC.: PRODUCT LAUNCHES
TABLE 191 MARQETA, INC.: DEALS
TABLE 192 DIGITAL PAYMENT MARKET, BY SOLUTION, 2018–2022 (USD MILLION)
TABLE 193 DIGITAL PAYMENT MARKET, BY SOLUTION, 2023–2028 (USD MILLION)
TABLE 194 DIGITAL PAYMENT MARKET, BY TRANSACTION TYPE, 2018–2022 (USD MILLION)
TABLE 195 DIGITAL PAYMENT MARKET, BY TRANSACTION TYPE, 2023–2028 (USD MILLION)
TABLE 196 DIGITAL PAYMENT MARKET, BY PAYMENT MODE, 2018–2022 (USD MILLION)
TABLE 197 DIGITAL PAYMENT MARKET, PAYMENT MODE, 2023–2028 (USD MILLION)
TABLE 198 DIGITAL PAYMENT MARKET, BY VERTICAL, 2018–2022 (USD MILLION)
TABLE 199 DIGITAL PAYMENT MARKET, BY VERTICAL, 2023–2028 (USD MILLION)
TABLE 200 DIGITAL PAYMENT MARKET, BY REGION, 2018–2022 (USD MILLION)
TABLE 201 DIGITAL PAYMENT MARKET, BY REGION, 2023–2028 (USD MILLION)
TABLE 202 PAYMENT PROCESSING SOLUTIONS MARKET, BY PAYMENT METHOD, 2018–2022 (USD MILLION)
TABLE 203 PAYMENT PROCESSING SOLUTIONS MARKET, BY PAYMENT METHOD, 2023–2028 (USD MILLION)
TABLE 204 PAYMENT PROCESSING SOLUTIONS MARKET, BY VERTICAL, 2018–2022 (USD MILLION)
TABLE 205 PAYMENT PROCESSING SOLUTIONS MARKET, BY VERTICAL, 2023–2028 (USD MILLION)
TABLE 206 PAYMENT PROCESSING SOLUTIONS MARKET, BY REGION, 2018–2022 (USD MILLION)
TABLE 207 PAYMENT PROCESSING SOLUTIONS MARKET, BY REGION, 2023–2028 (USD MILLION)
 
  
LIST OF FIGURES (48 Figures) 
 
FIGURE 1 MARKET SEGMENTATION
FIGURE 2 EMBEDDED FINANCE MARKET: RESEARCH DESIGN
FIGURE 3 BREAKDOWN OF PRIMARY INTERVIEWS, BY COMPANY TYPE, DESIGNATION, AND REGION
FIGURE 4 DATA TRIANGULATION
FIGURE 5 TOP-DOWN APPROACH
FIGURE 6 MARKET SIZE ESTIMATION METHODOLOGY – APPROACH 1 (SUPPLY SIDE): REVENUE OF VENDORS IN EMBEDDED FINANCE MARKET
FIGURE 7 BOTTOM-UP APPROACH
FIGURE 8 MARKET SIZE ESTIMATION METHODOLOGY: DEMAND-SIDE ANALYSIS
FIGURE 9 BOTTOM-UP (SUPPLY SIDE) ANALYSIS: COLLECTIVE REVENUE FROM SOLUTIONS/SERVICES OF EMBEDDED FINANCE MARKET
FIGURE 10 EMBEDDED FINANCE MARKET TO WITNESS SIGNIFICANT GROWTH DURING FORECAST PERIOD
FIGURE 11 EMBEDDED FINANCE MARKET: REGIONAL SNAPSHOT
FIGURE 12 TECHNOLOGICAL ADVANCEMENTS AND INCREASING CONSUMER DEMAND TO DRIVE EMBEDDED FINANCE MARKET
FIGURE 13 TOP GROWING SEGMENTS IN MARKET IN 2024
FIGURE 14 RETAIL & E-COMMERCE SEGMENT TO ACCOUNT FOR LARGEST MARKET SHARE IN 2024
FIGURE 15 B2B SEGMENT TO ACCOUNT FOR LARGER MARKET SHARE IN 2024
FIGURE 16 EMBEDDED PAYMENTS SEGMENT TO ACCOUNT FOR LARGEST MARKET SHARE IN 2024
FIGURE 17 EMBEDDED PAYMENTS AND B2B SEGMENTS TO HOLD SIGNIFICANT MARKET SHARES IN 2024
FIGURE 18 DRIVERS, RESTRAINTS, OPPORTUNITIES, AND CHALLENGES: EMBEDDED FINANCE MARKET
FIGURE 19 EVOLUTION OF EMBEDDED FINANCE
FIGURE 20 KEY PLAYERS IN EMBEDDED FINANCE MARKET ECOSYSTEM
FIGURE 21 EMBEDDED FINANCE MARKET: VALUE CHAIN ANALYSIS
FIGURE 22 AVERAGE PRICING ANALYSIS OF KEY PLAYERS, BY SOLUTION (USD)
FIGURE 23 LIST OF MAJOR PATENTS FOR EMBEDDED FINANCE
FIGURE 24 PORTER’S FIVE FORCES ANALYSIS: EMBEDDED FINANCE MARKET
FIGURE 25 EMBEDDED FINANCE MARKET: TRENDS/DISRUPTIONS IMPACTING CUSTOMERS’ BUSINESSES
FIGURE 26 INFLUENCE OF STAKEHOLDERS ON BUYING PROCESS FOR INDUSTRIES
FIGURE 27 KEY BUYING CRITERIA FOR TOP INDUSTRIES
FIGURE 28 TOOLS, FRAMEWORKS, AND TECHNIQUES: EMBEDDED FINANCE MARKET
FIGURE 29 INVESTMENT AND FUNDING SCENARIO
FIGURE 30 EMBEDDED LENDING SEGMENT TO GROW AT HIGHEST CAGR DURING FORECAST PERIOD
FIGURE 31 B2C SEGMENT TO GROW AT HIGHER CAGR DURING FORECAST PERIOD
FIGURE 32 HEALTHCARE SEGMENT TO GROW AT HIGHEST CAGR DURING FORECAST PERIOD
FIGURE 33 NORTH AMERICA: MARKET SNAPSHOT
FIGURE 34 ASIA PACIFIC: MARKET SNAPSHOT
FIGURE 35 REVENUE ANALYSIS FOR KEY COMPANIES IN PAST 5 YEARS
FIGURE 36 SHARE OF LEADING COMPANIES IN EMBEDDED FINANCE MARKET, 2023
FIGURE 37 MARKET RANKING ANALYSIS OF TOP 5 PLAYERS
FIGURE 38 EMBEDDED FINANCE MARKET: COMPANY EVALUATION MATRIX (KEY PLAYERS), 2023
FIGURE 39 OVERALL COMPANY FOOTPRINT
FIGURE 40 EMBEDDED FINANCE MARKET: COMPANY EVALUATION MATRIX (STARTUPS/SMES), 2023
FIGURE 41 BRAND/PRODUCT COMPARISON ANALYSIS
FIGURE 42 FINANCIAL METRICS OF KEY EMBEDDED FINANCE VENDORS
FIGURE 43 COMPANY VALUATION OF KEY EMBEDDED FINANCE VENDORS
FIGURE 44 PAYPAL HOLDINGS, INC.: COMPANY SNAPSHOT
FIGURE 45 AMAZON.COM, INC.: COMPANY SNAPSHOT
FIGURE 46 FIS: COMPANY SNAPSHOT
FIGURE 47 VISA INC.: COMPANY SNAPSHOT
FIGURE 48 MARQETA, INC.: COMPANY SNAPSHOT

This research study involved the extensive use of secondary sources, directories, and databases, such as Dun & Bradstreet (D&B) Hoovers and Bloomberg BusinessWeek, to identify and collect information useful for a technical, market-oriented, and commercial study of the embedded finance market. The primary sources have been mainly industry experts from the core and related industries and preferred suppliers, manufacturers, distributors, service providers, technology developers, alliances, and organizations related to all segments of the value chain of this market. In-depth interviews have been conducted with various primary respondents, including key industry participants, subject matter experts, C-level executives of key market players, and industry consultants, to obtain and verify critical qualitative and quantitative information.

Secondary Research

The market for companies offering embedded finance solutions to different verticals has been estimated and projected based on the secondary data made available through paid and unpaid sources, as well as by analyzing their product portfolios in the ecosystem of the embedded finance market. It also involved rating company products based on their performance and quality. In the secondary research process, various sources, such as the FTT Embedded Finance & Super-Apps 2024 Summit, Institute of International Finance (IIF), Fintech Retreat Conference 2024, have been referred to for identifying and collecting information for this study on the market. The secondary sources included annual reports, press releases investor presentations of companies, white papers, journals, and certified publications and articles by recognized authors, directories, and databases. Secondary research has been mainly used to obtain key information about the supply chain of the market, the total pool of key players, market classification, segmentation according to industry trends to the bottommost level, regional markets, and key developments from both market- and technology-oriented perspectives that have been further validated by primary sources.

Primary Research

In the primary research process, various primary sources from both the supply and demand sides were interviewed to obtain qualitative and quantitative information on the market. The primary sources from the supply side included various industry experts, including Chief Experience Officers (CXOs); Vice Presidents (VPs); directors from business development, marketing, and product development/innovation teams; related key executives from embedded finance solution vendors, service providers, and industry associations; and key opinion leaders. Primary interviews were conducted to gather insights, such as market statistics, revenue data collected from solutions and services, market breakups, market size estimations, market forecasts, and data triangulation. Primary research also helped understand various trends related to technologies, applications, deployments, and regions. Stakeholders from the demand side, such as Chief Information Officers (CIOs), Chief Technology Officers (CTOs), Chief Strategy Officers (CSOs), and end users using embedded finance solutions, were interviewed to understand the buyer’s perspective on suppliers, products, service providers, and their current usage of embedded finance solutions which would impact the overall embedded finance market.

Embedded Finance Market  Size, and Share

To know about the assumptions considered for the study, download the pdf brochure

Market Size Estimation

Multiple approaches were adopted to estimate and forecast the size of the embedded finance market. The first approach involves estimating market size by summing up the revenue companies generate by selling embedded finance offerings.

Both top-down and bottom-up approaches were used to estimate and validate the total size of the market. These methods were extensively used to estimate the size of various segments in the market. The research methodology used to estimate the market size includes the following:

  • Key players in the market have been identified through extensive secondary research.
  • In terms of value, the industry’s supply chain and market size have been determined through primary and secondary research processes.
  • All percentage shares, splits, and breakups have been determined using secondary sources and verified through primary sources.

Embedded Finance Market Size: Bottom-Up Approach

Embedded Finance Market  Bottom Up Approach

To know about the assumptions considered for the study, Request for Free Sample Report

Embedded Finance Market Size: Top-Down Approach

Embedded Finance Market  Top Down Approach

Data Triangulation

After arriving at the overall market size, the embedded finance market was divided into several segments and subsegments. A data triangulation procedure was used to complete the overall market engineering process and arrive at the exact statistics for all segments and subsegments, wherever applicable. The data was triangulated by studying various factors and trends from the demand and supply sides. Along with data triangulation and market breakdown, the market size was validated by the top-down and bottom-up approaches.

Market Definition

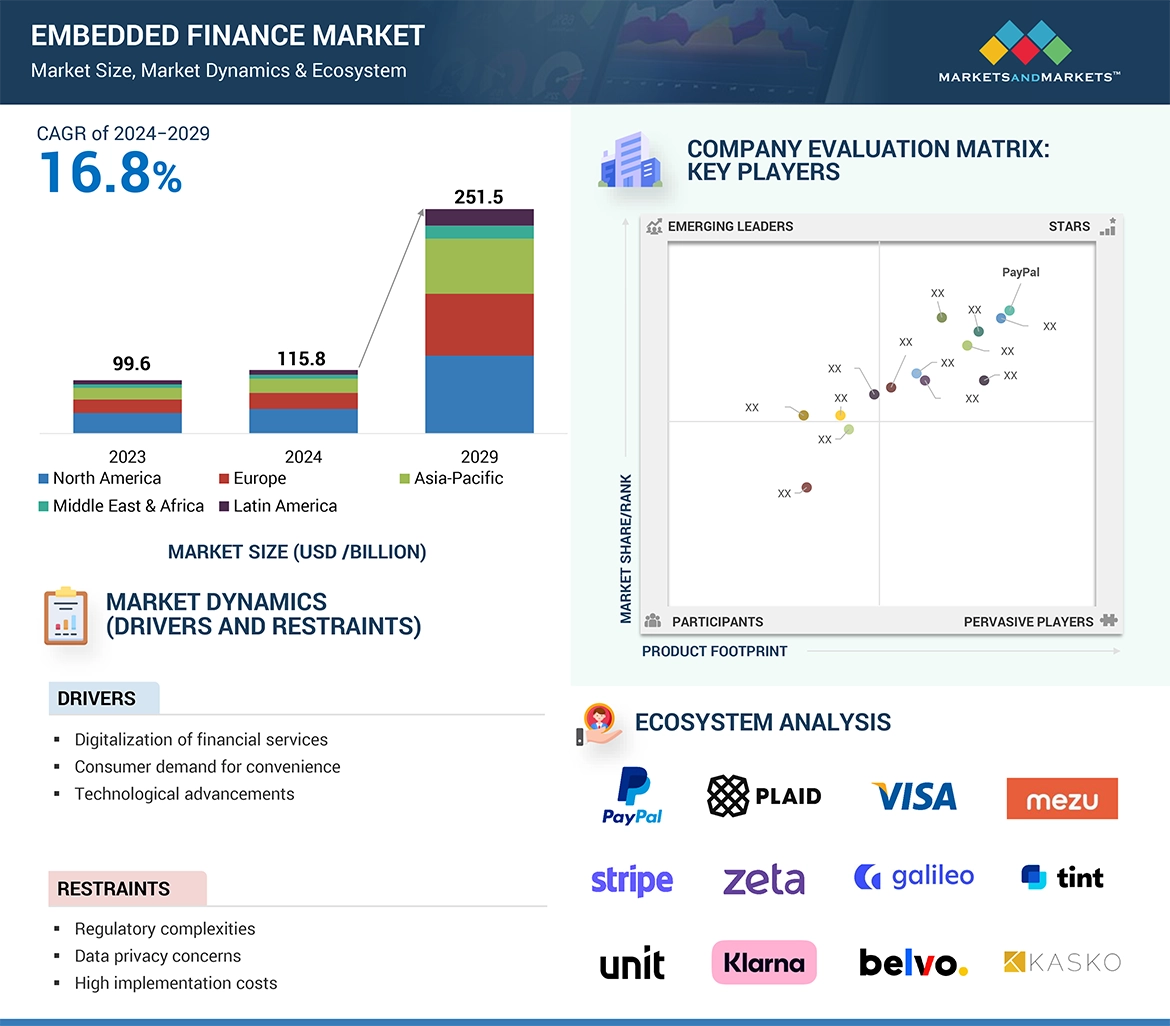
Embedded finance integrates financial services technology into platforms outside the financial sector. These platforms can provide various services, including loans, insurance, and payments, among others, using application programming interfaces (APIs), integrating financial transactions into the user experience.

Key Stakeholders

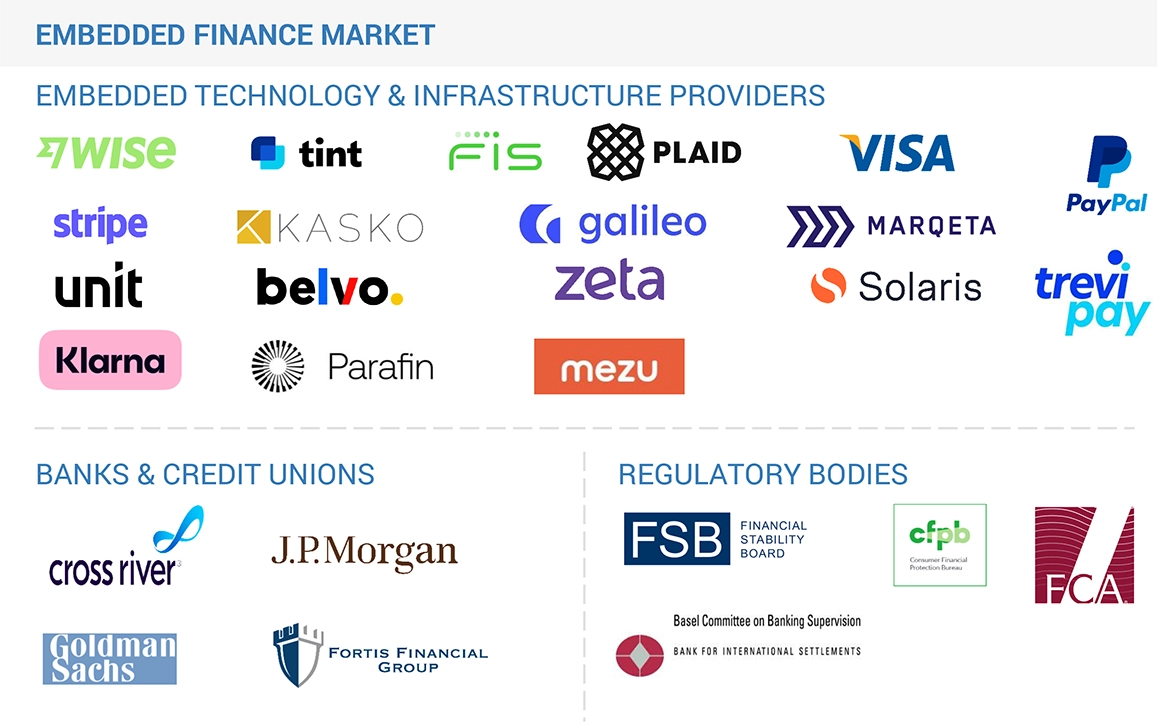
  • Embedded Finance providers
  • Financial Institutions
  • Consumers
  • Government
  • Non-financial Institutions
  • System integrators
  • Technology consultants
  • Embedders
  • Enablers

Report Objectives

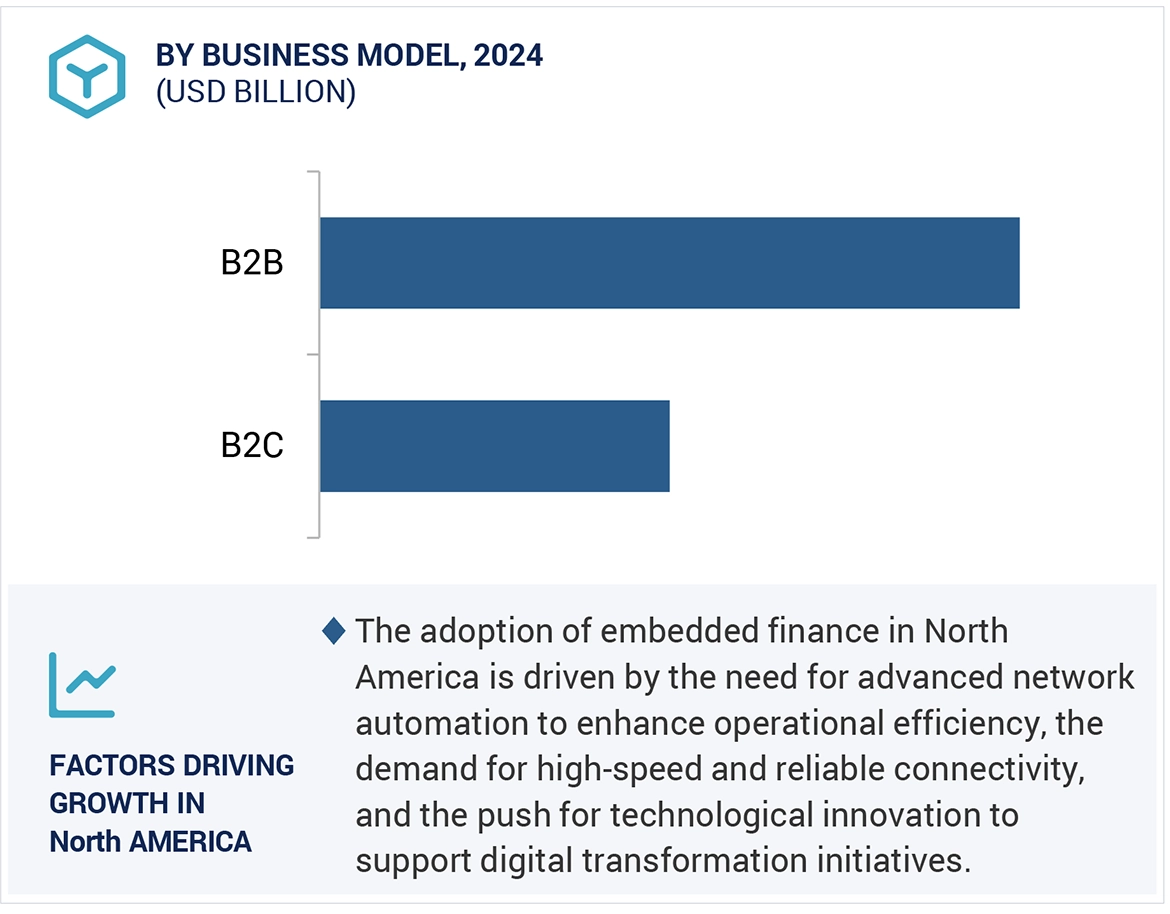
  • To determine, segment, and forecast the embedded finance market based on type (Embedded payments, embedded insurance, embedded lending, embedded investment/wealth management, and other types), business model, industry, and region in terms of value
  • To forecast the size of the market segments concerning 5 main areas: North America, Europe, Asia Pacific, Middle East & Africa, and Latin America
  • To provide detailed information about the major factors (drivers, restraints, opportunities, and challenges) influencing the growth of the market
  • To study the complete value chain and related industry segments and perform a value chain analysis of the market landscape
  • To strategically analyze the macro and micromarkets1 with respect to individual growth trends, prospects, and contributions to the total market
  • To analyze the industry trends, pricing data, patents, and innovations related to the market
  • To analyze the opportunities for stakeholders by identifying the high-growth segments of the market
  • To profile the key players in the market and comprehensively analyze their market share/ranking and core competencies
  • To track and analyze competitive developments, such as mergers & acquisitions, product launches & developments, partnerships, agreements, collaborations, business expansions, and R&D activities

Available Customizations

With the given market data, MarketsandMarkets offers customizations as per the company’s specific needs. The following customization options are available for the report:

Country-wise information

  • Analysis for additional countries (up to five)

Company Information

  • Detailed analysis and profiling of additional market players (up to 5)

Geographic Analysis

  • Further breakup of the Asia Pacific market into countries contributing 75% to the regional market size
  • Further breakup of the North American market into countries contributing 75% to the regional market size
  • Further breakup of the Latin American market into countries contributing 75% to the regional market size
  • Further breakup of the Middle East & Africa market into countries contributing 75% to the regional market size
  • Further breakup of the European market into countries contributing 75% to the regional market size
Custom Market Research Services

We will customize the research for you, in case the report listed above does not meet with your exact requirements. Our custom research will comprehensively cover the business information you require to help you arrive at strategic and profitable business decisions.

Request Customization
Report Code
TC 9065
Published ON
Jul, 2024
Choose License Type
BUY NOW
  • SHARE
X
Request Customization
Speak to Analyst
Speak to Analyst
OR FACE-TO-FACE MEETING
PERSONALIZE THIS RESEARCH
  • Triangulate with your Own Data
  • Get Data as per your Format and Definition
  • Gain a Deeper Dive on a Specific Application, Geography, Customer or Competitor
  • Any level of Personalization
REQUEST A FREE CUSTOMIZATION
LET US HELP YOU!
  • What are the Known and Unknown Adjacencies Impacting the Embedded Finance Market
  • What will your New Revenue Sources be?
  • Who will be your Top Customer; what will make them switch?
  • Defend your Market Share or Win Competitors
  • Get a Scorecard for Target Partners
CUSTOMIZED WORKSHOP REQUEST
  • Call Us
  • +1-888-600-6441 (Corporate office hours)
  • +1-888-600-6441 (US/Can toll free)
  • +44-800-368-9399 (UK office hours)
CONNECT WITH US
ABOUT TRUST ONLINE
©2024 MarketsandMarkets Research Private Ltd. All rights reserved
DMCA.com Protection Status Website Feedback