Electronic Chemicals CDMO & CRO Market

Report Code CH 9232
Published in Dec, 2024, By MarketsandMarkets™
Download PDF

Choose License Type

Buy Report Now Inquire Before Buying

Electronic Chemicals CDMO & CRO Market by Type (High Performance Polymers, Acid & Base Chemicals, Gases, Metals & Pastes), Scale, Application (Photoresist, Etchants, Dopants, Cleaning, Deposition), End-Use & Region-Global Forecast to 2029

Overview

The electronic chemicals CDMO and CRO market is projected to reach USD 0.66 billion by 2029, at a CAGR of 6.8% from USD 0.48 billion in 2024. The global electronics chemicals CDMO (Contract Development and Manufacturing Organization) and CRO (Contract Research Organization) market plays a vital role in the advanced electronics and semiconductor industries. These services facilitate the production of high-purity chemicals and materials essential for manufacturing electronic components like semiconductors, integrated circuits and displays.The global electronics chemicals CDMO and CRO market is driven by the rapid growth of electronics sectors across the globe, spurred by a rise in demand for new and compact devices. Another key driver is the increasing miniaturization trend. The more miniaturized devices are, the lighter they are and the more efficient, thus demanding very specialized chemicals and materials in their production to meet performance and reliability requirements. This trend is especially prominent in sectors such as consumer electronics and telecommunications, where compactness and functionality are critical. Technological developments are rapidly underway -5G, artificial intelligence (AI), Internet of Things, autonomous vehicles-with elevated demand for high-performance electronic devices that would boost demand for accurate and quality chemical solutions.

Electronic Chemicals CDMO & CRO Market

Attractive Opportunities in the Electronic Chemicals CDMO & CRO Market

Asia Pacific

The Asia-Pacific electronics chemicals CDMO and CRO market is driven by the region's rapid industrialization, growing electronics manufacturing hubs and advancements in semiconductor technologies.

Market expectations in the Asia-Pacific electronics chemicals CDMO and CRO sector are driven by rising consumer electronics demand, foreign investments, and cost-effective supply chains.

The expanding electronics sector, driven by the increasing adoption of consumer electronics, semiconductors, and advanced computing devices, is significantly fueling the demand for custom chemicals and specialized manufacturing services.

The global electronics chemicals CDMO and CRO market is expected to be worth USD 0.66 billion by 2029, growing at CAGR of 6.8% during the forecast period.

The rapid growth of transformative technologies like 5G and 6G networks create new revenue pockets for electronics chemicals CDMO and CRO market

Global Electronic Chemicals CDMO & CRO Market Dynamics

DRIVER: The expanding electronics sector around the world is pushing the production of electronic chemicals through CDMO

The CDMO and CRO market in 2023 for electronic chemicals is driven by several significant factors that are associated with growth in the semiconductor industry, new technologies, and government-friendly policies. With more industries such as automotive, consumer electronics, healthcare, and telecommunications using technologies that are semiconductor-based, the demand for outsourced development services and specialized electronic chemicals continues to grow.

Other notable drivers are government initiatives such as the U.S. CHIPS and Science Act. Over $200 billion in private investments were announced for new semiconductor projects in the U.S. It is not only the increase in production capacity but also in the resilience of the supply chain and national security. Of course, geopolitics, mainly related to the current U.S.-China tensions, make things even more complex since restrictions on sales to China affect the global supply chain. Despite these difficulties, the long-term prospects are good, because only the most specialized chemical solutions will be able to adapt to the transition towards even smaller nodes and higher processing powers. All these aspects therefore indicate that CDMOs and CROs have an important role in supporting technological progress and growth within the electronics industry.

RESTRAINT: Increasing Demand for Outsourcing in Emerging Technologies results in working with external partners which poses greater risk

A particular and relevant restraint in the electronics outsourcing market, especially for CDMOs and CROs, is the risk of intellectual property infringement and confidentiality breaches. Companies outsourcing complex electronics development and manufacturing are most concerned with the protection of proprietary technologies, designs, and data.In any case, external partners must be granted access to confidential information, which then opens loopholes in areas where IP has different levels of enforcement and protective laws. Another risk especially more glaring in markets where counterfeiting or unauthorized reproduction is significant is competitive disadvantage, lost income, and even damage to brand reputation.

However, the potential for IP misuse or leakage remains a significant deterrent and causes many to limit their outsourcing activities or pursue even stronger contractual and legal protections, adding another layer of complexity that can increase legal and operational costs, affecting the attractiveness of outsourcing in high-stakes or IP-intensive segments of the electronics industry.


OPPORTUNITY: Development of AI-Optimized Hardware develops need for specialized chips and sensors with high processing power and efficiency

The integration of AI technology in many industries creates a need for more hardware that can easily and efficiently process complex algorithms, making it imperative for more AI-optimized chips and sensors to improve performance while minimizing power consumption. Such optimized hardware is also characterized by the presence of special-purpose chips such as GPUs, TPU, and ASIC designed for machine learning operations. In these chips, operations like matrix multiplication are optimized in order to speed up a key function within machine learning and deep learning models. Contract Development and Manufacturing Organizations (CDMOs) and Contract Research Organizations (CROs) who specialize in semiconductor materials and hardware design are in a good position to benefit from this growth. These organizations can partner with electronics companies to innovate new materials and designs that will produce chips and sensors supporting both high performance and low power consumption. For example, in autonomous vehicles, there is a market that can reach $125 billion by 2030—AI hardware is necessary for the real-time processing of data from sensors to ensure safe navigation. These are growing needs that necessitate the partnership of the future with CDMOs and CROs that can provide expertise in AI hardware development. They contribute to advanced R&D in semiconductor materials that enhance AI chip efficiency as well as manufacturing processes meeting the precise tolerances needed for reliable AI hardware. Support from such partners is critical for industries to scale AI-enabled solutions while gaining significant performance, speed, and efficiency.

CHALLENGES: Navigating Regulatory Challenges in AI and 5G

The electronics industry, especially in the rapidly evolving fields of AI and 5G, faces a plethora of regulatory hurdles that further complicate the process of global market entry. Other regions have different standards to enforce in terms of safety, environmental impact, and data security, which would pose problems for manufacturers looking to expand across borders. For example, within the EU, the regulations regarding RoHS (Restriction of Hazardous Substances) and REACH (Registration, Evaluation, Authorization, and Restriction of Chemicals) have defined the restrictions on the usage of hazardous chemicals within electronic products; they demand compliance from their manufacturers under rigorous guidelines towards hazardous substances.

Another area of serious regulatory challenge within the sectors of AI and 5G relates to data security and privacy. There is such a thing as the GDPR within the European Union and a California Consumer Privacy Act (CCPA) in the U.S., which would mandate how companies must work with data. This usually means products which have anything related to AI and Internet of Things. These regulations control data collection, storage, and sharing, making them a compliance burden for manufacturers to ensure their products are capable of meeting `these stringent standards or else pay a heavy price in fines or the loss of consumer trust.

Secondly, environmental impact legislation is tightening up, with increasing focus on e-waste. Most countries- EU countries and regions, such as Japan and North America-require manufacturers to make their products easy to recycle and dispose of without posing risks to the environment. Such regulations force electronic companies to design their products in ways that are easily separable for recycling and waste handling. Such an approach increases cost and makes it difficult to innovate in products, especially on new technologies like AI and 5G.

All these regulations present barriers to entry for manufacturers of electronics, particularly newcomers looking to penetrate emerging global markets. The cost and time implications of changing processes, testing, and certifications make entry into the electronics sector with new products even challenging and costly. Legal recourse might include fines, recall of products, or expulsion from the market. In that regard, manufacturers must continually stay abreast of changes in the regulatory environment in order to remain current with all of the relevant standards and maintain their competitive edge globally.

Global Electronic Chemicals CDMO & CRO Market Ecosystem Analysis

Prominent companies in this market include well-established, financially stable service providers of electronic chemicals CDMO and CRO. These companies have been operating in the market for several years and possess diversified service product portfolios and strong global sales and marketing networks.

Electronic Chemicals CDMO & CRO Market
 

Cleaning Agents is the largest application segment in the electronic chemicals CDMO and CRO market in 2024, in terms of value.

Cleaning agents present the largest application in electronics chemicals CDMO and CRO market due to their critical role in electronics equipment functionality and longevity. Cleaning agents are used to extract contaminants like particulates, residues, and oxides from semiconductor wafers or circuit boards and display panels toward ensuring optimal performance and reliability. As the complexity of electronic components rises, so does the requirement for highly specialized cleaning agents that meet high purity and performance standards. The miniaturization trend in electronics leads to smaller chips and micro designs in semiconductors, necessitating advanced cleaning solutions. The operation of high-performance electronic components would be severely impaired by such small contaminants; hence pure cleaning chemicals are critical. High purity cleaning chemicals are therefore dependent on CDMO services and CROs when developing and manufacturing customised cleaning solutions. These services meet the specific needs of different manufacturers, for example, formulation compatibility with a particular material or process and environmental and safety regulations. With the increasing trends in technological advancements, the demand for contamination control, and sustainability, cleaning agents are bound to be at the forefront of the electronics chemicals CDMO and CRO market.

Optoelectronics accounted for the largest end use segment of the electronic chemicals CDMO and CRO market in 2024 in terms of value.

Optoelectronics is the largest end use segment in the market of electronics chemicals CDMO and CRO, with optoelectronic technology as light-based electronic applications having seen massive acceptance. Some examples of the products covered are LEDs, OLEDs, photodetectors, solar cells, and laser systems and form the basic input into the consumer electronics, telecom, automotive, and renewable energy industries.

It has boost demand for specialized chemicals and materials designed for optoelectronic applications. As demand for high-performance displays and lighting systems accelerates, it is being pushed by improvements in smartphones, televisions, and wearables. Examples include photo initiators, photoresists, and advanced coatings that improve the light-emission efficiency, color quality, and durability of optoelectronic components. The role of CDMO and CRO services becomes indispensable in the optoelectronics segment because customization is the key; these services help the manufacturers to develop innovative materials and formulations specific to cutting-edge technologies, thus helping in achieving faster time-to-market with compliance to stringent performance and environmental standards. For example, high-purity materials for OLEDs or quantum dot displays require precision chemistry, and this is exactly what the CDMO and CRO providers deliver. Next-generation technologies and multiple applications across critical industries made optoelectronics form the backbone. It remains as the largest end-use segment of the electronics chemicals CDMO and CRO market.

Acid and Base Chemicals is the largest type segment in the electronic chemicals CDMO and CRO market in 2024, in terms of value

Acid and base chemicals are likely to be the largest segment in the electronics chemicals CDMO and CRO market because they play an indispensable role in a broad spectrum of electronic manufacturing processes. They are critical in semiconductor, microelectronics, and display manufacturing and refinement, all relevant to the fast-growing electronics industry. Acid and base chemicals are significantly used in cleaning, etching, and stripping in the semiconductor manufacturing process. The chemicals are of significance in clean-up and patterning processes, such as photolithography, which requires extreme accuracy on semiconductor surfaces. Such examples include the use of sulfuric acid and hydrogen fluoride for cleaning wafers and base chemicals such as sodium hydroxide for etching and stripping layers in the fabrication of integrated circuits (ICs) and microchips.

Acid and base chemicals are also important in the manufacturing of liquid crystal displays (LCDs), OLEDs, and photovoltaic (solar) cells that have found extensive applications in consumer electronics. Due to their ability to participate in chemical reactions, they are vital for the production of high-quality, high-performance electronic products. With the rising demand for these technologies, the consumption of acid and base chemicals is growing rapidly. The consumption of consumer electronics is rising, and so are advancements in semiconductor manufacturing, along with the drive towards next-generation display technologies. Their widespread application in all ranges of industries, such as in automotive electronics, telecommunication, and renewable energy assures that acid and base chemicals will be central in the electronics chemicals CDMO and CRO market. This growth is further powered through the increasing attention being thrown on sustainability and how one develops green chemistry practice for the electronics industry.

Large scale will be the largest scale segment in the electronic chemicals CDMO and CRO market in 2024, in terms of value

The large-scale segment will dominate the electronics chemicals CDMO and CRO market because of several critical factors such as the high demand for mass production of electronic components, cost efficiencies, and technological advancements requiring vast manufacturing capabilities. Large-scale manufacturing is critical in responding to the rising demand for consumer electronics, semiconductors, displays, and other electronic devices. The world electronics industry continues to expand, and most companies now rely on mass production in order to meet the demands of constant supply and fulfill market requirements. For instance, semiconductor fabrication plants, known as fabs, use a huge amount of chemicals in cleaning wafers, etching, and doping. Mass production allows for uninterrupted, steady supply of these materials that are crucial in production. The economies of scale of mass operations reduce the per-unit cost of production, hence lowering the cost of making high-performance electronic components cheaper for companies.

Asia Pacific region holds the largest share of the electronic chemicals CDMO and CRO Market.

The Asia-Pacific region is said to hold the largest share of the electronics chemicals CDMO and CRO market because of its dominance in the global electronics manufacturing landscape. Countries such as China, South Korea, Japan, and Taiwan are said to host some of the leading electronics companies in the world. These countries are major manufacturing centers for semiconductors, displays, and other electronic components, thereby driving the demand for special chemicals and materials developed through CDMO and CRO services. The most important factor is the investment in advanced technologies, including 5G, artificial intelligence, and optoelectronics, which demand more sophisticated materials, such as photoresists, encapsulants, and high-purity solvents, that depend on custom development and manufacturing. Asia-Pacific's high adoption rate of consumer electronics and electric vehicles has also boosted demand for advanced electronic materials. Domestic semiconductor manufacturing and R&D support by governments add to the region's strength. Such initiatives promote better collaborations with CDMO and CRO partners in speeding up the development of next-generation materials. Moreover, the Asia-Pacific region enjoys a cost-competitive manufacturing ecosystem and a skilled workforce. Thus, it becomes a more attractive destination for electronics companies to outsource their chemical development and production. Its proximity to end markets and raw material sources makes it even stronger. Given its leadership in electronics production, innovation, and favorable economic environment, the Asia-Pacific region is likely to dominate the electronics chemicals CDMO and CRO market.

HIGHEST CAGR MARKET IN 2023
ASIA PACIFIC FASTEST GROWING MARKET IN THE REGION
Electronic Chemicals CDMO & CRO Market

Recent Developments of Electronic Chemicals CDMO & CRO Market

  • In September 2024, AGC establishes a new technical service center in Taiwan to enhance support for its chemical products, with a focus on semiconductor and electronic materials.
  • In July 2024, Suven Pharmaceuticals Limited announced that it has received approval from both the National Stock Exchange (NSE) and Bombay Stock Exchange (BSE) for its proposed merger with Cohance Lifesciences.
  • In December 2023, in addition to its existing facilities, Sajjan India is establishing a cutting-edge Research and Technology Centre in Navi Mumbai.
  • In October 2023, noctiluca sought innovative ways to enhance the OLED stack and extend the lifetime of blue pixels. Through targeted research and collaboration with partners in OLED manufacturing under their Chemical CRO/CDMO model, they developed a novel electron-injection material (EIL), named NCEIL-4.

Key Market Players

Want to explore hidden markets that can drive new revenue in Electronic Chemicals CDMO & CRO Market?

Scope of the Report

Report Metric Details
Market size available for years 2020-2029
Base Year Considered 2023
Forecast period 2024-2029
Forecast units Value (USD Million/USD Billion), Volume (Kilotons)
Segments covered Type, Scale, Application, End-use and Region
Geographies covered North America, Europe, Asia Pacific, Middle East & Africa, South America


Key Questions Addressed by the Report

What are the factors influencing the growth of the electronic chemicals CDMO and CRO market?
The growth of the electronics chemicals CDMO and CRO market is influenced by increasing demand for advanced electronic devices, miniaturization trends, and the expansion of electronic manufacturing hubs, particularly in regions like Asia-Pacific.
Define electronic chemicals CDMO and CRO market?
The electronics chemicals CDMO and CRO market refers to the sector providing contract development, manufacturing, and research services tailored for the electronics industry, focusing on materials like semiconductors, displays, and optoelectronics.
Which region is expected to have the largest market share in the electronic chemicals CDMO and CRO market?
The Asia-Pacific region will acquire the largest share of the electronic chemicals CDMO and CRO market during the forecast period.
What are the major market players covered in the report?
The key players in this market are Sajjan India Ltd. (India), Cohance Lifesciences (India), noctiluca (Poland), Actylis (US), AGC Inc. (Japan), Navin Fluorine International limited (India), CABB Group GmbH (Germany), Adesis Inc. (US), Inventys Research Company (India), etc.
How big is the global electronic chemicals CDMO and CRO market?
The electronic chemicals CDMO and CRO market is projected to reach USD 0.66 billion by 2029, at a CAGR of 6.8% from USD 0.48 billion in 2024.


Personalize This Research

  • Triangulate with your Own Data
  • Get Data as per your Format and Definition
  • Gain a Deeper Dive on a Specific Application, Geography, Customer or Competitor
  • Any level of Personalization
Request A Free Customisation

Let Us Help You

  • What are the Known and Unknown Adjacencies Impacting the Electronic Chemicals CDMO & CRO Market
  • What will your New Revenue Sources be?
  • Who will be your Top Customer; what will make them switch?
  • Defend your Market Share or Win Competitors
  • Get a Scorecard for Target Partners
Customized Workshop Request

Table of Contents

Exclusive indicates content/data unique to MarketsandMarkets and not available with any competitors.

TITLE
PAGE NO
INTRODUCTION
28
RESEARCH METHODOLOGY
32
EXECUTIVE SUMMARY
44
PREMIUM INSIGHTS
50
MARKET OVERVIEW
54
  • 5.1 INTRODUCTION
  • 5.2 MARKET DYNAMICS
    DRIVERS
    - Expanding semiconductors industry pushing production of electronic chemicals through CDMOs
    - Acceleration in adoption of advanced technologies and cloud computing
    - Growing trend of miniaturization resulting in increased investments in electronics industry
    RESTRAINTS
    - Electronics outsourcing resulting in working with external partners
    OPPORTUNITIES
    - Development of AI-optimized hardware leading to need for specialized chips and sensors with high processing power and efficiency
    - Rapid growth of high-frequency technologies
    CHALLENGES
    - Strict regulations pertaining to products incorporating advanced technologies
  • 5.3 IMPACT OF GENERATIVE AI ON ELECTRONIC CHEMICALS CDMO & CRO MARKET
    INTRODUCTION
  • 5.4 IMPACT ON ELECTRONIC CHEMICALS CDMO & CRO MARKET
INDUSTRY TRENDS
61
  • 6.1 INTRODUCTION
  • 6.2 TRENDS/DISRUPTIONS IMPACTING CUSTOMER BUSINESS
  • 6.3 SUPPLY CHAIN ANALYSIS
    RAW MATERIAL SOURCING
    MANUFACTURING AND FORMULATION
    CLIENT SERVICES AND CUSTOMIZATION
    END USER
  • 6.4 INVESTMENT AND FUNDING SCENARIO
  • 6.5 PRICING ANALYSIS
    AVERAGE SELLING PRICE TREND, BY REGION
    AVERAGE SELLING PRICE TREND OF ELECTRONIC CHEMICALS IN CDMO & CRO MARKET, BY TYPE
    AVERAGE SELLING PRICE TREND OF ELECTRONIC CHEMICALS IN CDMO & CRO MARKET, BY TYPE AND TOP 5 PLAYERS
  • 6.6 ECOSYSTEM ANALYSIS
  • 6.7 TECHNOLOGY ANALYSIS
  • 6.8 PATENT ANALYSIS
    METHODOLOGY
    PATENTS GRANTED WORLDWIDE, 2014–2023
    PATENT PUBLICATION TRENDS, 2014–2023
    INSIGHTS
    LEGAL STATUS OF PATENTS
    JURISDICTION ANALYSIS
    TOP COMPANIES/APPLICANTS
    LIST OF MAJOR PATENTS
  • 6.9 TRADE ANALYSIS
    IMPORT SCENARIO
    EXPORT SCENARIO
  • 6.10 KEY CONFERENCES AND EVENTS
  • 6.11 TARIFF AND REGULATORY LANDSCAPE
    TARIFF DATA RELATED TO ELECTRONIC CHEMICALS CDMO & CRO MARKET
    REGULATORY BODIES, GOVERNMENT AGENCIES, AND OTHER ORGANIZATIONS
    REGULATIONS RELATED TO ELECTRONIC CHEMICALS CDMO & CRO MARKET
  • 6.12 PORTER’S FIVE FORCES ANALYSIS
    IMPACT OF PORTER’S FIVE FORCES ON ELECTRONIC CHEMICALS CDMO & CRO MARKET
    BARGAINING POWER OF SUPPLIERS
    THREAT OF NEW ENTRANTS
    THREAT OF SUBSTITUTES
    BARGAINING POWER OF BUYERS
    INTENSITY OF COMPETITIVE RIVALRY
  • 6.13 KEY STAKEHOLDERS AND BUYING CRITERIA
    KEY STAKEHOLDERS IN BUYING PROCESS
    BUYING CRITERIA
  • 6.14 MACROECONOMIC INDICATORS
    GDP TRENDS AND FORECASTS OF MAJOR ECONOMIES
  • 6.15 CASE STUDY ANALYSIS
    INNOVATIONS AND OUTSOURCING IN ELECTRONIC CHEMICALS CDMO & CRO SERVICES
    INTEL'S TRANSITION TO AQUEOUS-BASED CLEANING IN PCB MANUFACTURING
    ADVANCING PRECISION IN ELECTRONIC CHEMICALS: ROLE OF CDMOS AND CROS IN MEETING SMART ELECTRONICS DEMANDS
ELECTRONIC CHEMICALS CDMO & CRO MARKET, BY TYPE
91
  • 7.1 INTRODUCTION
  • 7.2 HIGH-PERFORMANCE POLYMERS
    OFFER DURABILITY AND STABILITY UNDER HIGH TEMPERATURES AND CHEMICAL EXPOSURE
  • 7.3 ACID AND BASE CHEMICALS
    MINIATURIZATION OF ELECTRONIC COMPONENTS TO DRIVE DEMAND
  • 7.4 GASES
    INDISPENSABLE FOR ENABLING PRECISE THIN-FILM DEPOSITION, SURFACE TREATMENTS, AND CONTAMINATION-FREE ENVIRONMENTS
  • 7.5 POWDERS
    FACILITATE HIGH-SPEED CONNECTIVITY AND EFFICIENT HEAT DISSIPATION IN MODERN DEVICES
  • 7.6 METALS AND PASTES
    USED FOR CONDUCTIVITY, INTERCONNECTIONS, AND BONDING IN SEMICONDUCTOR DEVICES AND ELECTRONIC ASSEMBLIES
  • 7.7 OTHER TYPES
ELECTRONIC CHEMICALS CDMO & CRO MARKET, BY SCALE
97
  • 8.1 INTRODUCTION
  • 8.2 LARGE SCALE
    LARGE-SCALE CDMO SERVICES EMPOWER MASS-MARKET APPLICATIONS
  • 8.3 MEDIUM SCALE
    MEDIUM-SCALE CDMO SERVICES OPTIMIZE INNOVATION FOR NICHE AND EMERGING APPLICATIONS
  • 8.4 SMALL SCALE
    SMALL-SCALE CDMO SERVICES CATALYZE INNOVATION IN SPECIALIZED MARKETS
ELECTRONIC CHEMICALS CDMO & CRO MARKET, BY APPLICATION
102
  • 9.1 INTRODUCTION
  • 9.2 PHOTORESISTS
    GROWING DEMAND FOR ADVANCED ELECTRONICS AND MINIATURIZATION TREND TO DRIVE GROWTH
  • 9.3 ETCHANTS
    DEVELOPMENTS IN FLEXIBLE AND WEARABLE ELECTRONICS TO DRIVE GROWTH
  • 9.4 DOPANTS
    KEY TO MODIFYING SEMICONDUCTOR MATERIALS FOR PRECISE ELECTRICAL PROPERTIES
  • 9.5 CLEANING AGENTS
    ENSURE REMOVAL OF CONTAMINANTS TO MAINTAIN INTEGRITY OF ELECTRONIC DEVICES
  • 9.6 DEPOSITION MATERIALS
    ENABLE PRECISE LAYERING OF SUBSTANCES ESSENTIAL FOR FABRICATION OF ADVANCED ELECTRONIC DEVICES
  • 9.7 OTHER APPLICATIONS
    THERMAL INTERFACE MATERIALS
    CHEMICAL MECHANICAL PLANARIZATION
ELECTRONIC CHEMICALS CDMO & CRO MARKET, BY END-USE INDUSTRY
109
  • 10.1 INTRODUCTION
  • 10.2 INTEGRATED CIRCUITS
    RISING ENERGY DEMAND AND RENEWABLE INITIATIVES TO DRIVE GROWTH
  • 10.3 DISCRETE SEMICONDUCTORS
    OFFER PRECISION, CUSTOMIZATION, AND SCALABILITY
  • 10.4 SENSORS
    INTEGRAL TO INDUSTRIES WHERE REAL-TIME DATA MONITORING AND INTERCONNECTED DEVICES ARE CRITICAL
  • 10.5 OPTOELECTRONICS
    INCREASING ADOPTION OF ENERGY-EFFICIENT AND HIGH-PERFORMANCE TECHNOLOGIES TO DRIVE GROWTH
  • 10.6 BATTERY
    SOLID-STATE BATTERIES OFFERING HIGHER ENERGY DENSITY AND IMPROVED SAFETY OVER LITHIUM-ION
  • 10.7 OTHER END-USE INDUSTRIES
ELECTRONIC CHEMICALS CDMO & CRO MARKET, BY REGION
115
  • 11.1 INTRODUCTION
  • 11.2 ASIA PACIFIC
    CHINA
    - Extensive electronics manufacturing capacity to drive growth
    INDIA
    - Localization of semiconductor production to drive market
    JAPAN
    - Focus on revitalizing semiconductor manufacturing to drive growth
    SOUTH KOREA
    - Strong R&D investments and robust demand for advanced materials in electronics industry to drive growth
    REST OF ASIA PACIFIC
  • 11.3 NORTH AMERICA
    US
    - Growth of semiconductors industry to drive market
    CANADA
    - Growing demand for advanced semiconductor technology to drive market
    MEXICO
    - Strong demand from various electronics applications to drive market
  • 11.4 EUROPE
    GERMANY
    - Leadership in European semiconductor production to drive market
    UK
    - Innovation in semiconductor manufacturing and growing demand across automotive and telecommunications industries to drive market
    FRANCE
    - Dynamic growth in electronics and semiconductors industries to drive market
    ITALY
    - Significant investment in electronics and semiconductor production and related strategic partnerships and government initiatives to drive market
    SPAIN
    - PERTE Chip program and other government initiatives for semiconductors industry to drive market
    REST OF EUROPE
  • 11.5 SOUTH AMERICA
    BRAZIL
    - Government incentives and growing adoption of electric vehicles to drive market
    ARGENTINA
    - Industrial development and expanding demand for advanced electronics and semiconductors to drive market
    REST OF SOUTH AMERICA
  • 11.6 MIDDLE EAST & AFRICA
    GCC COUNTRIES
    - Saudi Arabia
    - UAE
    - Rest of GCC Countries
    SOUTH AFRICA
    - Growing electrotechnical industry and government-backed industrial policies to drive market
    REST OF MIDDLE EAST & AFRICA
COMPETITIVE LANDSCAPE
201
  • 12.1 INTRODUCTION
  • 12.2 KEY PLAYER STRATEGIES/RIGHT TO WIN
  • 12.3 MARKET SHARE ANALYSIS, 2023
  • 12.4 REVENUE ANALYSIS
  • 12.5 BRAND/PRODUCT COMPARATIVE ANALYSIS
  • 12.6 COMPANY EVALUATION MATRIX, KEY PLAYERS, 2023
    STARS
    EMERGING LEADERS
    PERVASIVE PLAYERS
    PARTICIPANTS
    COMPANY FOOTPRINT
    - Company footprint
    - Application footprint
    - End-use industry footprint
    - Region footprint
  • 12.7 COMPANY EVALUATION MATRIX, STARTUPS/SMES, 2023
    PROGRESSIVE COMPANIES
    RESPONSIVE COMPANIES
    DYNAMIC COMPANIES
    STARTING BLOCKS
    COMPETITIVE BENCHMARKING
    - List of key startups/SMEs
  • 12.8 VALUATION AND FINANCIAL METRICS IN ELECTRONIC CHEMICALS CDMO AND CRO VENDORS
  • 12.9 COMPETITIVE SCENARIO
    PRODUCT LAUNCHES
    DEALS
    EXPANSIONS
    OTHERS
COMPANY PROFILES
224
  • 13.1 KEY PLAYERS
    SAJJAN INDIA LTD.
    - Business overview
    - Products/Solutions/Services offered
    - Recent developments
    - MnM view
    COHANCE LIFESCIENCES
    - Business overview
    - Products/Solutions/Services offered
    - Recent developments
    - MnM view
    NOCTILUCA
    - Business overview
    - Products/Solutions/Services offered
    - Recent developments
    - MnM view
    ACTYLIS
    - Business overview
    - Products/Solutions/Services offered
    - Recent developments
    - MnM view
    AGC INC.
    - Business overview
    - Products/Solutions/Services offered
    - Recent developments
    - MnM view
    NAVIN FLUORINE INTERNATIONAL LIMITED
    - Business overview
    - Products/Solutions/Services offered
    - Recent developments
    - MnM view
    CABB GROUP GMBH
    - Business overview
    - Products/Solutions/Services offered
    - Recent developments
    - MnM view
    ADESIS INC.
    - Business overview
    - Products/Solutions/Services offered
    - Recent developments
    - MnM view
    INVENTYS RESEARCH COMPANY
    - Business overview
    - Products/Solutions/Services offered
    - Recent developments
    - MnM view
    LINKCHEM TECHNOLOGY CO., LTD.
    - Business overview
    - Products/Solutions/Services offered
    - Recent developments
    - MnM view
  • 13.2 OTHER PLAYERS
    SSK BIOSCIENCES PVT. LTD.
    CHONGQING WERLCHEM NEW MATERIALS TECHNOLOGY CO., LTD
    VIAKEM
    INNOVASSYNTH
    PHT INDUSTRIES
    SYMPHARMA
    VIRUJ GROUP
    REDOX SCIENTIFIC
    SUNGWUN PHARMACOPIA CO., LTD.
    KNC LABORATORIES CO., LTD.
APPENDIX
267
  • 14.1 DISCUSSION GUIDE
  • 14.2 KNOWLEDGESTORE: MARKETSANDMARKETS’ SUBSCRIPTION PORTAL
  • 14.3 CUSTOMIZATION OPTIONS
  • 14.4 RELATED REPORTS
  • 14.5 AUTHOR DETAILS
LIST OF TABLES
 
  • TABLE 1 AVERAGE SELLING PRICE OF ELECTRONIC CHEMICALS IN CDMO & CRO MARKET, BY REGION, 2021–2024 (USD/KILOTON)
  • TABLE 2 AVERAGE SELLING PRICE OF ELECTRONIC CHEMICALS IN CDMO & CRO MARKET, BY TYPE, 2021–2024 (USD/KILOTON)
  • TABLE 3 AVERAGE SELLING PRICE OF ELECTRONIC CHEMICALS CDMO & CRO MARKET, BY TYPE AND TOP 5 PLAYERS (USD/KILOTON)
  • TABLE 4 ELECTRONIC CHEMICALS CDMO & CRO MARKET: ROLE OF COMPANIES IN ECOSYSTEM
  • TABLE 5 KEY TECHNOLOGIES
  • TABLE 6 COMPLEMENTARY TECHNOLOGIES
  • TABLE 7 ADJACENT TECHNOLOGIES
  • TABLE 8 ELECTRONIC CHEMICALS CDMO & CRO MARKET: TOTAL NUMBER OF PATENTS, 2014–2023
  • TABLE 9 ELECTRONIC CHEMICALS CDMO & CRO MARKET: LIST OF MAJOR PATENT OWNERS
  • TABLE 10 ELECTRONIC CHEMICALS CDMO & CRO MARKET: LIST OF MAJOR PATENTS, 2014–2024
  • TABLE 11 ELECTRONIC CHEMICALS CDMO & CRO MARKET: LIST OF KEY CONFERENCES AND EVENTS, 2024–2025
  • TABLE 12 TARIFF RATES IN ELECTRONIC CHEMICALS CDMO & CRO MARKET
  • TABLE 13 NORTH AMERICA: REGULATORY BODIES, GOVERNMENT AGENCIES, AND OTHER ORGANIZATIONS
  • TABLE 14 EUROPE: REGULATORY BODIES, GOVERNMENT AGENCIES, AND OTHER ORGANIZATIONS
  • TABLE 15 ASIA PACIFIC: REGULATORY BODIES, GOVERNMENT AGENCIES, AND OTHER ORGANIZATIONS
  • TABLE 16 MIDDLE EAST & AFRICA: REGULATORY BODIES, GOVERNMENT AGENCIES, AND OTHER ORGANIZATIONS
  • TABLE 17 SOUTH AMERICA: REGULATORY BODIES, GOVERNMENT AGENCIES, AND OTHER ORGANIZATIONS
  • TABLE 18 LIST OF REGULATIONS RELATED TO ELECTRONIC CHEMICALS CDMO & CRO MARKET
  • TABLE 19 IMPACT OF PORTER’S FIVE FORCES ON ELECTRONIC CHEMICALS CDMO & CRO MARKET
  • TABLE 20 INFLUENCE OF STAKEHOLDERS ON BUYING PROCESS FOR TOP 3 END-USE INDUSTRIES
  • TABLE 21 KEY BUYING CRITERIA FOR TOP 2 END-USE INDUSTRIES
  • TABLE 22 PROJECTED REAL GDP GROWTH (ANNUAL PERCENTAGE CHANGE) OF KEY COUNTRIES, 2018–2025
  • TABLE 23 ELECTRONIC CHEMICALS CDMO & CRO MARKET, BY TYPE, 2021–2023 (USD MILLION)
  • TABLE 24 ELECTRONIC CHEMICALS CDMO & CRO MARKET, BY TYPE, 2024–2029 (USD MILLION)
  • TABLE 25 ELECTRONIC CHEMICALS CDMO & CRO MARKET, BY TYPE, 2021–2023 (KILOTON)
  • TABLE 26 ELECTRONIC CHEMICALS CDMO & CRO MARKET, BY TYPE, 2024–2029 (KILOTON)
  • TABLE 27 ELECTRONIC CHEMICALS CDMO & CRO MARKET, BY SCALE, 2021–2023 (USD MILLION)
  • TABLE 28 ELECTRONIC CHEMICALS CDMO & CRO MARKET, BY SCALE, 2024–2029 (USD MILLION)
  • TABLE 29 ELECTRONIC CHEMICALS CDMO & CRO MARKET, BY SCALE, 2021–2023 (KILOTON)
  • TABLE 30 ELECTRONIC CHEMICALS CDMO & CRO MARKET, BY SCALE, 2024–2029 (KILOTON)
  • TABLE 31 ELECTRONIC CHEMICALS CDMO & CRO MARKET, BY APPLICATION, 2021–2023 (USD MILLION)
  • TABLE 32 ELECTRONIC CHEMICALS CDMO & CRO MARKET, BY APPLICATION, 2024–2029 (USD MILLION)
  • TABLE 33 ELECTRONIC CHEMICALS CDMO & CRO MARKET, BY APPLICATION, 2021–2023 (KILOTON)
  • TABLE 34 ELECTRONIC CHEMICALS CDMO & CRO MARKET, BY APPLICATION, 2024–2029 (KILOTON)
  • TABLE 35 ELECTRONIC CHEMICALS CDMO & CRO MARKET, BY END-USE INDUSTRY, 2021–2023 (USD MILLION)
  • TABLE 36 ELECTRONIC CHEMICALS CDMO & CRO MARKET, BY END-USE INDUSTRY, 2024–2029 (USD MILLION)
  • TABLE 37 ELECTRONIC CHEMICALS CDMO & CRO MARKET, BY END-USE INDUSTRY, 2021–2023 (KILOTON)
  • TABLE 38 ELECTRONIC CHEMICALS CDMO & CRO MARKET, BY END-USE INDUSTRY, 2024–2029 (KILOTON)
  • TABLE 39 ELECTRONIC CHEMICALS CDMO & CRO MARKET, BY REGION, 2021–2023 (USD MILLION)
  • TABLE 40 ELECTRONIC CHEMICALS CDMO & CRO MARKET, BY REGION, 2024–2029 (USD MILLION)
  • TABLE 41 ELECTRONIC CHEMICALS CDMO & CRO MARKET, BY REGION, 2021–2023 (KILOTON)
  • TABLE 42 ELECTRONIC CHEMICALS CDMO & CRO MARKET, BY REGION, 2024–2029 (KILOTON)
  • TABLE 43 ASIA PACIFIC: ELECTRONIC CHEMICALS CDMO & CRO MARKET, BY COUNTRY, 2021–2023 (USD MILLION)
  • TABLE 44 ASIA PACIFIC: ELECTRONIC CHEMICALS CDMO & CRO MARKET, BY COUNTRY, 2024–2029 (USD MILLION)
  • TABLE 45 ASIA PACIFIC: ELECTRONIC CHEMICALS CDMO & CRO MARKET, BY COUNTRY, 2021–2023 (KILOTON)
  • TABLE 46 ASIA PACIFIC: ELECTRONIC CHEMICALS CDMO & CRO MARKET, BY COUNTRY, 2024–2029 (KILOTON)
  • TABLE 47 ASIA PACIFIC: ELECTRONIC CHEMICALS CDMO & CRO MARKET, BY TYPE, 2021–2023 (USD MILLION)
  • TABLE 48 ASIA PACIFIC: ELECTRONIC CHEMICALS CDMO & CRO MARKET, BY TYPE, 2024–2029 (USD MILLION)
  • TABLE 49 ASIA PACIFIC: ELECTRONIC CHEMICALS CDMO & CRO MARKET, BY TYPE, 2021–2023 (KILOTON)
  • TABLE 50 ASIA PACIFIC: ELECTRONIC CHEMICALS CDMO & CRO MARKET, BY TYPE, 2024–2029 (KILOTON)
  • TABLE 51 ASIA PACIFIC: ELECTRONIC CHEMICALS CDMO & CRO MARKET, BY SCALE, 2021–2023 (USD MILLION)
  • TABLE 52 ASIA PACIFIC: ELECTRONIC CHEMICALS CDMO & CRO MARKET, BY SCALE, 2024–2029 (USD MILLION)
  • TABLE 53 ASIA PACIFIC: ELECTRONIC CHEMICALS CDMO & CRO MARKET, BY SCALE, 2021–2023 (KILOTON)
  • TABLE 54 ASIA PACIFIC: ELECTRONIC CHEMICALS CDMO & CRO MARKET, BY SCALE, 2024–2029 (KILOTON)
  • TABLE 55 ASIA PACIFIC: ELECTRONIC CHEMICALS CDMO & CRO MARKET, BY APPLICATION, 2021–2023 (USD MILLION)
  • TABLE 56 ASIA PACIFIC: ELECTRONIC CHEMICALS CDMO & CRO MARKET, BY APPLICATION, 2024–2029 (USD MILLION)
  • TABLE 57 ASIA PACIFIC: ELECTRONIC CHEMICALS CDMO & CRO MARKET, BY APPLICATION, 2021–2023 (KILOTON)
  • TABLE 58 ASIA PACIFIC: ELECTRONIC CHEMICALS CDMO & CRO MARKET, BY APPLICATION, 2024–2029 (KILOTON)
  • TABLE 59 ASIA PACIFIC: ELECTRONIC CHEMICALS CDMO & CRO MARKET, BY END-USE INDUSTRY, 2021–2023 (USD MILLION)
  • TABLE 60 ASIA PACIFIC: ELECTRONIC CHEMICALS CDMO & CRO MARKET, BY END-USE INDUSTRY, 2024–2029 (USD MILLION)
  • TABLE 61 ASIA PACIFIC: ELECTRONIC CHEMICALS CDMO & CRO MARKET, BY END-USE INDUSTRY, 2021–2023 (KILOTON)
  • TABLE 62 ASIA PACIFIC: ELECTRONIC CHEMICALS CDMO & CRO MARKET, BY END-USE INDUSTRY, 2024–2029 (KILOTON)
  • TABLE 63 CHINA: ELECTRONIC CHEMICALS CDMO & CRO MARKET, BY END-USE INDUSTRY, 2021–2023 (USD MILLION)
  • TABLE 64 CHINA: ELECTRONIC CHEMICALS CDMO & CRO MARKET, BY END-USE INDUSTRY, 2024–2029 (USD MILLION)
  • TABLE 65 CHINA: ELECTRONIC CHEMICALS CDMO & CRO MARKET, BY END-USE INDUSTRY, 2021–2023 (KILOTON)
  • TABLE 66 CHINA: ELECTRONIC CHEMICALS CDMO & CRO MARKET, BY END-USE INDUSTRY, 2024–2029 (KILOTON)
  • TABLE 67 INDIA: ELECTRONIC CHEMICALS CDMO & CRO MARKET, BY END-USE INDUSTRY, 2021–2023 (USD MILLION)
  • TABLE 68 INDIA: ELECTRONIC CHEMICALS CDMO & CRO MARKET, BY END-USE INDUSTRY, 2024–2029 (USD MILLION)
  • TABLE 69 INDIA: ELECTRONIC CHEMICALS CDMO & CRO MARKET, BY END-USE INDUSTRY, 2021–2023 (KILOTON)
  • TABLE 70 INDIA: ELECTRONIC CHEMICALS CDMO & CRO MARKET, BY END-USE INDUSTRY, 2024–2029 (KILOTON)
  • TABLE 71 JAPAN: ELECTRONIC CHEMICALS CDMO & CRO MARKET, BY END-USE INDUSTRY, 2021–2023 (USD MILLION)
  • TABLE 72 JAPAN: ELECTRONIC CHEMICALS CDMO & CRO MARKET, BY END-USE INDUSTRY, 2024–2029 (USD MILLION)
  • TABLE 73 JAPAN: ELECTRONIC CHEMICALS CDMO & CRO MARKET, BY END-USE INDUSTRY, 2021–2023 (KILOTON)
  • TABLE 74 JAPAN: ELECTRONIC CHEMICALS CDMO & CRO MARKET, BY END-USE INDUSTRY, 2024–2029 (KILOTON)
  • TABLE 75 SOUTH KOREA: ELECTRONIC CHEMICALS CDMO & CRO MARKET, BY END-USE INDUSTRY, 2021–2023 (USD MILLION)
  • TABLE 76 SOUTH KOREA: ELECTRONIC CHEMICALS CDMO & CRO MARKET, BY END-USE INDUSTRY, 2024–2029 (USD MILLION)
  • TABLE 77 SOUTH KOREA: ELECTRONIC CHEMICALS CDMO & CRO MARKET, BY END-USE INDUSTRY, 2021–2023 (KILOTON)
  • TABLE 78 SOUTH KOREA: ELECTRONIC CHEMICALS CDMO & CRO MARKET, BY END-USE INDUSTRY, 2024–2029 (KILOTON)
  • TABLE 79 REST OF ASIA PACIFIC: ELECTRONIC CHEMICALS CDMO & CRO MARKET, BY END-USE INDUSTRY, 2021–2023 (USD MILLION)
  • TABLE 80 REST OF ASIA PACIFIC: ELECTRONIC CHEMICALS CDMO & CRO MARKET, BY END-USE INDUSTRY, 2024–2029 (USD MILLION)
  • TABLE 81 REST OF ASIA PACIFIC: ELECTRONIC CHEMICALS CDMO & CRO MARKET, BY END-USE INDUSTRY, 2021–2023 (KILOTON)
  • TABLE 82 REST OF ASIA PACIFIC: ELECTRONIC CHEMICALS CDMO & CRO MARKET, BY END-USE INDUSTRY, 2024–2029 (KILOTON)
  • TABLE 83 NORTH AMERICA: ELECTRONIC CHEMICALS CDMO & CRO MARKET, BY COUNTRY, 2021–2023 (USD MILLION)
  • TABLE 84 NORTH AMERICA: ELECTRONIC CHEMICALS CDMO & CRO MARKET, BY COUNTRY, 2024–2029 (USD MILLION)
  • TABLE 85 NORTH AMERICA: ELECTRONIC CHEMICALS CDMO & CRO MARKET, BY COUNTRY, 2021–2023 (KILOTON)
  • TABLE 86 NORTH AMERICA: ELECTRONIC CHEMICALS CDMO & CRO MARKET, BY COUNTRY, 2024–2029 (KILOTON)
  • TABLE 87 NORTH AMERICA: ELECTRONIC CHEMICALS CDMO & CRO MARKET, BY TYPE, 2021–2023 (USD MILLION)
  • TABLE 88 NORTH AMERICA: ELECTRONIC CHEMICALS CDMO & CRO MARKET, BY TYPE, 2024–2029 (USD MILLION)
  • TABLE 89 NORTH AMERICA: ELECTRONIC CHEMICALS CDMO & CRO MARKET, BY TYPE, 2021–2023 (KILOTON)
  • TABLE 90 NORTH AMERICA: ELECTRONIC CHEMICALS CDMO & CRO MARKET, BY TYPE, 2024–2029 (KILOTON)
  • TABLE 91 NORTH AMERICA: ELECTRONIC CHEMICALS CDMO & CRO MARKET, BY SCALE, 2021–2023 (USD MILLION)
  • TABLE 92 NORTH AMERICA: ELECTRONIC CHEMICALS CDMO & CRO MARKET, BY SCALE, 2024–2029 (USD MILLION)
  • TABLE 93 NORTH AMERICA: ELECTRONIC CHEMICALS CDMO & CRO MARKET, BY SCALE, 2021–2023 (KILOTON)
  • TABLE 94 NORTH AMERICA: ELECTRONIC CHEMICALS CDMO & CRO MARKET, BY SCALE, 2024–2029 (KILOTON)
  • TABLE 95 NORTH AMERICA: ELECTRONIC CHEMICALS CDMO & CRO MARKET, BY APPLICATION, 2021–2023 (USD MILLION)
  • TABLE 96 NORTH AMERICA: ELECTRONIC CHEMICALS CDMO & CRO MARKET, BY APPLICATION, 2024–2029 (USD MILLION)
  • TABLE 97 NORTH AMERICA: ELECTRONIC CHEMICALS CDMO & CRO MARKET, BY APPLICATION, 2021–2023 (KILOTON)
  • TABLE 98 NORTH AMERICA: ELECTRONIC CHEMICALS CDMO & CRO MARKET, BY APPLICATION, 2024–2029 (KILOTON)
  • TABLE 99 NORTH AMERICA: ELECTRONIC CHEMICALS CDMO & CRO MARKET, BY END-USE INDUSTRY, 2021–2023 (USD MILLION)
  • TABLE 100 NORTH AMERICA: ELECTRONIC CHEMICALS CDMO & CRO MARKET, BY END-USE INDUSTRY, 2024–2029 (USD MILLION)
  • TABLE 101 NORTH AMERICA: ELECTRONIC CHEMICALS CDMO & CRO MARKET, BY END-USE INDUSTRY, 2021–2023 (KILOTON)
  • TABLE 102 NORTH AMERICA: ELECTRONIC CHEMICALS CDMO & CRO MARKET, BY END-USE INDUSTRY, 2024–2029 (KILOTON)
  • TABLE 103 US: ELECTRONIC CHEMICALS CDMO & CRO MARKET, BY END-USE INDUSTRY, 2021–2023 (USD MILLION)
  • TABLE 104 US: ELECTRONIC CHEMICALS CDMO & CRO MARKET, BY END-USE INDUSTRY, 2024–2029 (USD MILLION)
  • TABLE 105 US: ELECTRONIC CHEMICALS CDMO & CRO MARKET, BY END-USE INDUSTRY, 2021–2023 (KILOTON)
  • TABLE 106 US: ELECTRONIC CHEMICALS CDMO & CRO MARKET, BY END-USE INDUSTRY, 2024–2029 (KILOTON)
  • TABLE 107 CANADA: ELECTRONIC CHEMICALS CDMO & CRO MARKET, BY END-USE INDUSTRY, 2021–2023 (USD MILLION)
  • TABLE 108 CANADA: ELECTRONIC CHEMICALS CDMO & CRO MARKET, BY END-USE INDUSTRY, 2024–2029 (USD MILLION)
  • TABLE 109 CANADA: ELECTRONIC CHEMICALS CDMO & CRO MARKET, BY END-USE INDUSTRY, 2021–2023 (KILOTON)
  • TABLE 110 CANADA: ELECTRONIC CHEMICALS CDMO & CRO MARKET, BY END-USE INDUSTRY, 2024–2029 (KILOTON)
  • TABLE 111 MEXICO: ELECTRONIC CHEMICALS CDMO & CRO MARKET, BY END-USE INDUSTRY, 2021–2023 (USD MILLION)
  • TABLE 112 MEXICO: ELECTRONIC CHEMICALS CDMO & CRO MARKET, BY END-USE INDUSTRY, 2024–2029 (USD MILLION)
  • TABLE 113 MEXICO: ELECTRONIC CHEMICALS CDMO & CRO MARKET, BY END-USE INDUSTRY, 2021–2023 (KILOTON)
  • TABLE 114 MEXICO: ELECTRONIC CHEMICALS CDMO & CRO MARKET, BY END-USE INDUSTRY, 2024–2029 (KILOTON)
  • TABLE 115 EUROPE: ELECTRONIC CHEMICALS CDMO AND & CRO MARKET, BY COUNTRY, 2021–2023 (USD MILLION)
  • TABLE 116 EUROPE: ELECTRONIC CHEMICALS CDMO AND & CRO MARKET, BY COUNTRY, 2024–2029 (USD MILLION)
  • TABLE 117 EUROPE: ELECTRONIC CHEMICALS CDMO AND & CRO MARKET, BY COUNTRY, 2021–2023 (KILOTON)
  • TABLE 118 EUROPE: ELECTRONIC CHEMICALS CDMO AND & CRO MARKET, BY COUNTRY, 2024–2029 (KILOTON)
  • TABLE 119 EUROPE: ELECTRONIC CHEMICALS CDMO & CRO MARKET, BY TYPE, 2021–2023 (USD MILLION)
  • TABLE 120 EUROPE: ELECTRONIC CHEMICALS CDMO & CRO MARKET, BY TYPE, 2024–2029 (USD MILLION)
  • TABLE 121 EUROPE: ELECTRONIC CHEMICALS CDMO & CRO MARKET, BY TYPE, 2021–2023 (KILOTON)
  • TABLE 122 EUROPE: ELECTRONIC CHEMICALS CDMO & CRO MARKET, BY TYPE, 2024–2029 (KILOTON)
  • TABLE 123 EUROPE: ELECTRONIC CHEMICALS CDMO & CRO MARKET, BY SCALE, 2021–2023 (USD MILLION)
  • TABLE 124 EUROPE: ELECTRONIC CHEMICALS CDMO & CRO MARKET, BY SCALE, 2024–2029 (USD MILLION)
  • TABLE 125 EUROPE: ELECTRONIC CHEMICALS CDMO & CRO MARKET, BY SCALE, 2021–2023 (KILOTON)
  • TABLE 126 EUROPE: ELECTRONIC CHEMICALS CDMO & CRO MARKET, BY SCALE, 2024–2029 (KILOTON)
  • TABLE 127 EUROPE: ELECTRONIC CHEMICALS CDMO & CRO MARKET, BY APPLICATION, 2021–2023 (USD MILLION)
  • TABLE 128 EUROPE: ELECTRONIC CHEMICALS CDMO & CRO MARKET, BY APPLICATION, 2024–2029 (USD MILLION)
  • TABLE 129 EUROPE: ELECTRONIC CHEMICALS CDMO & CRO MARKET, BY APPLICATION, 2021–2023 (KILOTON)
  • TABLE 130 EUROPE: ELECTRONIC CHEMICALS CDMO & CRO MARKET, BY APPLICATION, 2024–2029 (KILOTON)
  • TABLE 131 EUROPE: ELECTRONIC CHEMICALS CDMO & CRO MARKET, BY END-USE INDUSTRY, 2021–2023 (USD MILLION)
  • TABLE 132 EUROPE: ELECTRONIC CHEMICALS CDMO & CRO MARKET, BY END-USE INDUSTRY, 2024–2029 (USD MILLION)
  • TABLE 133 EUROPE: ELECTRONIC CHEMICALS CDMO & CRO MARKET, BY END-USE INDUSTRY, 2021–2023 (KILOTON)
  • TABLE 134 EUROPE: ELECTRONIC CHEMICALS CDMO & CRO MARKET, BY END-USE INDUSTRY, 2024–2029 (KILOTON)
  • TABLE 135 GERMANY: ELECTRONIC CHEMICALS CDMO & CRO MARKET, BY END-USE INDUSTRY, 2021–2023 (USD MILLION)
  • TABLE 136 GERMANY: ELECTRONIC CHEMICALS CDMO & CRO MARKET, BY END-USE INDUSTRY, 2024–2029 (USD MILLION)
  • TABLE 137 GERMANY: ELECTRONIC CHEMICALS CDMO & CRO MARKET, BY END-USE INDUSTRY, 2021–2023 (KILOTON)
  • TABLE 138 GERMANY: ELECTRONIC CHEMICALS CDMO & CRO MARKET, BY END-USE INDUSTRY, 2024–2029 (KILOTON)
  • TABLE 139 UK: ELECTRONIC CHEMICALS CDMO & CRO MARKET, BY END-USE INDUSTRY, 2021–2023 (USD MILLION)
  • TABLE 140 UK: ELECTRONIC CHEMICALS CDMO & CRO MARKET, BY END-USE INDUSTRY, 2024–2029 (USD MILLION)
  • TABLE 141 UK: ELECTRONIC CHEMICALS CDMO & CRO MARKET, BY END-USE INDUSTRY, 2021–2023 (KILOTON)
  • TABLE 142 UK: ELECTRONIC CHEMICALS CDMO & CRO MARKET, BY END-USE INDUSTRY, 2024–2029 (KILOTON)
  • TABLE 143 FRANCE: ELECTRONIC CHEMICALS CDMO & CRO MARKET, BY END-USE INDUSTRY, 2021–2023 (USD MILLION)
  • TABLE 144 FRANCE: ELECTRONIC CHEMICALS CDMO & CRO MARKET, BY END-USE INDUSTRY, 2024–2029 (USD MILLION)
  • TABLE 145 FRANCE: ELECTRONIC CHEMICALS CDMO & CRO MARKET, BY END-USE INDUSTRY, 2021–2023 (KILOTON)
  • TABLE 146 FRANCE: ELECTRONIC CHEMICALS CDMO & CRO MARKET, BY END-USE INDUSTRY, 2024–2029 (KILOTON)
  • TABLE 147 ITALY: ELECTRONIC CHEMICALS CDMO & CRO MARKET, BY END-USE INDUSTRY, 2021–2023 (USD MILLION)
  • TABLE 148 ITALY: ELECTRONIC CHEMICALS CDMO & CRO MARKET, BY END-USE INDUSTRY, 2024–2029 (USD MILLION)
  • TABLE 149 ITALY: ELECTRONIC CHEMICALS CDMO & CRO MARKET, BY END-USE INDUSTRY, 2021–2023 (KILOTON)
  • TABLE 150 ITALY: ELECTRONIC CHEMICALS CDMO & CRO MARKET, BY END-USE INDUSTRY, 2024–2029 (KILOTON)
  • TABLE 151 SPAIN: ELECTRONIC CHEMICALS CDMO & CRO MARKET, BY END-USE INDUSTRY, 2021–2023 (USD MILLION)
  • TABLE 152 SPAIN: ELECTRONIC CHEMICALS CDMO & CRO MARKET, BY END-USE INDUSTRY, 2024–2029 (USD MILLION)
  • TABLE 153 SPAIN: ELECTRONIC CHEMICALS CDMO & CRO MARKET, BY END-USE INDUSTRY, 2021–2023 (KILOTON)
  • TABLE 154 SPAIN: ELECTRONIC CHEMICALS CDMO & CRO MARKET, BY END-USE INDUSTRY, 2024–2029 (KILOTON)
  • TABLE 155 REST OF EUROPE: ELECTRONIC CHEMICALS CDMO & CRO MARKET, BY END-USE INDUSTRY, 2021–2023 (USD MILLION)
  • TABLE 156 REST OF EUROPE: ELECTRONIC CHEMICALS CDMO & CRO MARKET, BY END-USE INDUSTRY, 2024–2029 (USD MILLION)
  • TABLE 157 REST OF EUROPE: ELECTRONIC CHEMICALS CDMO & CRO MARKET, BY END-USE INDUSTRY, 2021–2023 (KILOTON)
  • TABLE 158 REST OF EUROPE: ELECTRONIC CHEMICALS CDMO & CRO MARKET, BY END-USE INDUSTRY, 2024–2029 (KILOTON)
  • TABLE 159 SOUTH AMERICA: ELECTRONIC CHEMICALS CDMO & CRO MARKET, BY COUNTRY, 2021–2023 (USD MILLION)
  • TABLE 160 SOUTH AMERICA: ELECTRONIC CHEMICALS CDMO & CRO MARKET, BY COUNTRY, 2024–2029 (USD MILLION)
  • TABLE 161 SOUTH AMERICA: ELECTRONIC CHEMICALS CDMO & CRO MARKET, BY COUNTRY, 2021–2023 (KILOTON)
  • TABLE 162 SOUTH AMERICA: ELECTRONIC CHEMICALS CDMO & CRO MARKET, BY COUNTRY, 2024–2029 (KILOTON)
  • TABLE 163 SOUTH AMERICA: ELECTRONIC CHEMICALS CDMO & CRO MARKET, BY TYPE, 2021–2023 (USD MILLION)
  • TABLE 164 SOUTH AMERICA: ELECTRONIC CHEMICALS CDMO & CRO MARKET, BY TYPE, 2024–2029 (USD MILLION)
  • TABLE 165 SOUTH AMERICA: ELECTRONIC CHEMICALS CDMO & CRO MARKET, BY TYPE, 2021–2023 (KILOTON)
  • TABLE 166 SOUTH AMERICA: ELECTRONIC CHEMICALS CDMO & CRO MARKET, BY TYPE, 2024–2029 (KILOTON)
  • TABLE 167 SOUTH AMERICA: ELECTRONIC CHEMICALS CDMO & CRO MARKET, BY SCALE, 2021–2023 (USD MILLION)
  • TABLE 168 SOUTH AMERICA: ELECTRONIC CHEMICALS CDMO & CRO MARKET, BY SCALE, 2024–2029 (USD MILLION)
  • TABLE 169 SOUTH AMERICA: ELECTRONIC CHEMICALS CDMO & CRO MARKET, BY SCALE, 2021–2023 (KILOTON)
  • TABLE 170 SOUTH AMERICA: ELECTRONIC CHEMICALS CDMO & CRO MARKET, BY SCALE, 2024–2029 (KILOTON)
  • TABLE 171 SOUTH AMERICA: ELECTRONIC CHEMICALS CDMO & CRO MARKET, BY APPLICATION, 2021–2023 (USD MILLION)
  • TABLE 172 SOUTH AMERICA: ELECTRONIC CHEMICALS CDMO & CRO MARKET, BY APPLICATION, 2024–2029 (USD MILLION)
  • TABLE 173 SOUTH AMERICA: ELECTRONIC CHEMICALS CDMO & CRO MARKET, BY APPLICATION, 2021–2023 (KILOTON)
  • TABLE 174 SOUTH AMERICA: ELECTRONIC CHEMICALS CDMO & CRO MARKET, BY APPLICATION, 2024–2029 (KILOTON)
  • TABLE 175 SOUTH AMERICA: ELECTRONIC CHEMICALS CDMO & CRO MARKET, BY END-USE INDUSTRY, 2021–2023 (USD MILLION)
  • TABLE 176 SOUTH AMERICA: ELECTRONIC CHEMICALS CDMO & CRO MARKET, BY END-USE INDUSTRY, 2024–2029 (USD MILLION)
  • TABLE 177 SOUTH AMERICA: ELECTRONIC CHEMICALS CDMO & CRO MARKET, BY END-USE INDUSTRY, 2021–2023 (KILOTON)
  • TABLE 178 SOUTH AMERICA: ELECTRONIC CHEMICALS CDMO & CRO MARKET, BY END-USE INDUSTRY, 2024–2029 (KILOTON)
  • TABLE 179 BRAZIL: ELECTRONIC CHEMICALS CDMO & CRO MARKET, BY END-USE INDUSTRY, 2021–2023 (USD MILLION)
  • TABLE 180 BRAZIL: ELECTRONIC CHEMICALS CDMO & CRO MARKET, BY END-USE INDUSTRY, 2024–2029 (USD MILLION)
  • TABLE 181 BRAZIL: ELECTRONIC CHEMICALS CDMO & CRO MARKET, BY END-USE INDUSTRY, 2021–2023 (KILOTON)
  • TABLE 182 BRAZIL: ELECTRONIC CHEMICALS CDMO & CRO MARKET, BY END-USE INDUSTRY, 2024–2029 (KILOTON)
  • TABLE 183 ARGENTINA: ELECTRONIC CHEMICALS CDMO & CRO MARKET, BY END-USE INDUSTRY, 2021–2023 (USD MILLION)
  • TABLE 184 ARGENTINA: ELECTRONIC CHEMICALS CDMO & CRO MARKET, BY END-USE INDUSTRY, 2024–2029 (USD MILLION)
  • TABLE 185 ARGENTINA: ELECTRONIC CHEMICALS CDMO & CRO MARKET, BY END-USE INDUSTRY, 2021–2023 (KILOTON)
  • TABLE 186 ARGENTINA: ELECTRONIC CHEMICALS CDMO & CRO MARKET, BY END-USE INDUSTRY, 2024–2029 (KILOTON)
  • TABLE 187 REST OF SOUTH AMERICA: ELECTRONIC CHEMICALS CDMO & CRO MARKET, BY END-USE INDUSTRY, 2021–2023 (USD MILLION)
  • TABLE 188 REST OF SOUTH AMERICA: ELECTRONIC CHEMICALS CDMO & CRO MARKET, BY END-USE INDUSTRY, 2024–2029 (USD MILLION)
  • TABLE 189 REST OF SOUTH AMERICA: ELECTRONIC CHEMICALS CDMO & CRO MARKET, BY END-USE INDUSTRY, 2021–2023 (KILOTON)
  • TABLE 190 REST OF SOUTH AMERICA: ELECTRONIC CHEMICALS CDMO & CRO MARKET, BY END-USE INDUSTRY, 2024–2029 (KILOTON)
  • TABLE 191 MIDDLE EAST & AFRICA: ELECTRONIC CHEMICALS CDMO & CRO MARKET, BY COUNTRY, 2021–2023 (USD MILLION)
  • TABLE 192 MIDDLE EAST & AFRICA: ELECTRONIC CHEMICALS CDMO & CRO MARKET, BY COUNTRY, 2024–2029 (USD MILLION)
  • TABLE 193 MIDDLE EAST & AFRICA: ELECTRONIC CHEMICALS CDMO & CRO MARKET, BY COUNTRY, 2021–2023 (KILOTON)
  • TABLE 194 MIDDLE EAST & AFRICA: ELECTRONIC CHEMICALS CDMO & CRO MARKET, BY COUNTRY, 2024–2029 (KILOTON)
  • TABLE 195 MIDDLE EAST & AFRICA: ELECTRONIC CHEMICALS CDMO & CRO MARKET, BY TYPE, 2021–2023 (USD MILLION)
  • TABLE 196 MIDDLE EAST & AFRICA: ELECTRONIC CHEMICALS CDMO & CRO MARKET, BY TYPE, 2024–2029 (USD MILLION)
  • TABLE 197 MIDDLE EAST & AFRICA: ELECTRONIC CHEMICALS CDMO & CRO MARKET, BY TYPE, 2021–2023 (KILOTON)
  • TABLE 198 MIDDLE EAST & AFRICA: ELECTRONIC CHEMICALS CDMO & CRO MARKET, BY TYPE, 2024–2029 (KILOTON)
  • TABLE 199 MIDDLE EAST & AFRICA: ELECTRONIC CHEMICALS CDMO & CRO MARKET, BY SCALE, 2021–2023 (USD MILLION)
  • TABLE 200 MIDDLE EAST & AFRICA: ELECTRONIC CHEMICALS CDMO & CRO MARKET, BY SCALE, 2024–2029 (USD MILLION)
  • TABLE 201 MIDDLE EAST & AFRICA: ELECTRONIC CHEMICALS CDMO & CRO MARKET, BY SCALE, 2021–2023 (KILOTON)
  • TABLE 202 MIDDLE EAST & AFRICA: ELECTRONIC CHEMICALS CDMO & CRO MARKET, BY SCALE, 2024–2029 (KILOTON)
  • TABLE 203 MIDDLE EAST & AFRICA: ELECTRONIC CHEMICALS CDMO & CRO MARKET, BY APPLICATION, 2021–2023 (USD MILLION)
  • TABLE 204 MIDDLE EAST & AFRICA: ELECTRONIC CHEMICALS CDMO & CRO MARKET, BY APPLICATION, 2024–2029 (USD MILLION)
  • TABLE 205 MIDDLE EAST & AFRICA: ELECTRONIC CHEMICALS CDMO & CRO MARKET, BY APPLICATION, 2021–2023 (KILOTON)
  • TABLE 206 MIDDLE EAST & AFRICA: ELECTRONIC CHEMICALS CDMO & CRO MARKET, BY APPLICATION, 2024–2029 (KILOTON)
  • TABLE 207 MIDDLE EAST & AFRICA: ELECTRONIC CHEMICALS CDMO & CRO MARKET, BY END-USE INDUSTRY, 2021–2023 (USD MILLION)
  • TABLE 208 MIDDLE EAST & AFRICA: ELECTRONIC CHEMICALS CDMO & CRO MARKET, BY END-USE INDUSTRY, 2024–2029 (USD MILLION)
  • TABLE 209 MIDDLE EAST & AFRICA: ELECTRONIC CHEMICALS CDMO & CRO MARKET, BY END-USE INDUSTRY, 2021–2023 (KILOTON)
  • TABLE 210 MIDDLE EAST & AFRICA: ELECTRONIC CHEMICALS CDMO & CRO MARKET, BY END-USE INDUSTRY, 2024–2029 (KILOTON)
  • TABLE 211 SAUDI ARABIA: ELECTRONIC CHEMICALS CDMO & CRO MARKET, BY END-USE INDUSTRY, 2021–2023 (USD MILLION)
  • TABLE 212 SAUDI ARABIA: ELECTRONIC CHEMICALS CDMO & CRO MARKET, BY END-USE INDUSTRY, 2024–2029 (USD MILLION)
  • TABLE 213 SAUDI ARABIA: ELECTRONIC CHEMICALS CDMO & CRO MARKET, BY END-USE INDUSTRY, 2021–2023 (KILOTON)
  • TABLE 214 SAUDI ARABIA: ELECTRONIC CHEMICALS CDMO & CRO MARKET, BY END-USE INDUSTRY, 2024–2029 (KILOTON)
  • TABLE 215 UAE: ELECTRONIC CHEMICALS CDMO & CRO MARKET, BY END-USE INDUSTRY, 2021–2023 (USD MILLION)
  • TABLE 216 UAE: ELECTRONIC CHEMICALS CDMO & CRO MARKET, BY END-USE INDUSTRY, 2024–2029 (USD MILLION)
  • TABLE 217 UAE: ELECTRONIC CHEMICALS CDMO & CRO MARKET, BY END-USE INDUSTRY, 2021–2023 (KILOTON)
  • TABLE 218 UAE: ELECTRONIC CHEMICALS CDMO & CRO MARKET, BY END-USE INDUSTRY, 2024–2029 (KILOTON)
  • TABLE 219 REST OF GCC COUNTRIES: ELECTRONIC CHEMICALS CDMO & CRO MARKET, BY END-USE INDUSTRY, 2021–2023 (USD MILLION)
  • TABLE 220 REST OF GCC COUNTRIES: ELECTRONIC CHEMICALS CDMO & CRO MARKET, BY END-USE INDUSTRY, 2024–2029 (USD MILLION)
  • TABLE 221 REST OF GCC COUNTRIES: ELECTRONIC CHEMICALS CDMO & CRO MARKET, BY END-USE INDUSTRY, 2021–2023 (KILOTON)
  • TABLE 222 REST OF GCC COUNTRIES: ELECTRONIC CHEMICALS CDMO & CRO MARKET, BY END-USE INDUSTRY, 2024–2029 (KILOTON)
  • TABLE 223 SOUTH AFRICA: ELECTRONIC CHEMICALS CDMO & CRO MARKET, BY END-USE INDUSTRY, 2021–2023 (USD MILLION)
  • TABLE 224 SOUTH AFRICA: ELECTRONIC CHEMICALS CDMO & CRO MARKET, BY END-USE INDUSTRY, 2024–2029 (USD MILLION)
  • TABLE 225 SOUTH AFRICA: ELECTRONIC CHEMICALS CDMO & CRO MARKET, BY END-USE INDUSTRY, 2021–2023 (KILOTON)
  • TABLE 226 SOUTH AFRICA: ELECTRONIC CHEMICALS CDMO & CRO MARKET, BY END-USE INDUSTRY, 2024–2029 (KILOTON)
  • TABLE 227 REST OF MIDDLE EAST & AFRICA: ELECTRONIC CHEMICALS CDMO & CRO MARKET, BY END-USE INDUSTRY, 2021–2023 (USD MILLION)
  • TABLE 228 REST OF MIDDLE EAST & AFRICA: ELECTRONIC CHEMICALS CDMO & CRO MARKET, BY END-USE INDUSTRY, 2024–2029 (USD MILLION)
  • TABLE 229 REST OF MIDDLE EAST & AFRICA: ELECTRONIC CHEMICALS CDMO & CRO MARKET, BY END-USE INDUSTRY, 2021–2023 (KILOTON)
  • TABLE 230 REST OF MIDDLE EAST & AFRICA: ELECTRONIC CHEMICALS CDMO & CRO MARKET, BY END-USE INDUSTRY, 2024–2029 (KILOTON)
  • TABLE 231 OVERVIEW OF STRATEGIES ADOPTED BY KEY ELECTRONIC CHEMICALS CDMO AND CRO MARKET PLAYERS
  • TABLE 232 ELECTRONIC CHEMICALS CDMO & CRO MARKET: DEGREE OF COMPETITION
  • TABLE 233 ELECTRONIC CHEMICALS CDMO & CRO MARKET: APPLICATION FOOTPRINT
  • TABLE 234 ELECTRONIC CHEMICALS CDMO & CRO MARKET: END-USE INDUSTRY FOOTPRINT
  • TABLE 235 ELECTRONIC CHEMICALS CDMO & CRO MARKET: REGION FOOTPRINT
  • TABLE 236 ELECTRONIC CHEMICALS CDMO & CRO MARKET: KEY STARTUPS/SMES
  • TABLE 237 ELECTRONIC CHEMICALS CDMO & CRO MARKET: COMPETITIVE BENCHMARKING OF KEY STARTUPS/SMES
  • TABLE 238 ELECTRONIC CHEMICALS CDMO & CRO MARKET: PRODUCT LAUNCHES AND DEVELOPMENTS, JANUARY 2020–OCTOBER 2024
  • TABLE 239 ELECTRONIC CHEMICALS CDMO & CRO MARKET: DEALS, JANUARY 2020–JULY 2024
  • TABLE 240 ELECTRONIC CHEMICALS CDMO & CRO MARKET: EXPANSIONS, JANUARY 2020–SEPTEMBER 2024
  • TABLE 241 ELECTRONIC CHEMICALS CDMO & CRO MARKET: OTHERS, JANUARY 2020– OCTOBER 2024
  • TABLE 242 SAJJAN INDIA LTD.: COMPANY OVERVIEW
  • TABLE 243 SAJJAN INDIA LTD.: PRODUCTS/SOLUTIONS/SERVICES OFFERED
  • TABLE 244 SAJJAN INDIA LTD.: EXPANSIONS, JANUARY 2021–JULY 2024
  • TABLE 245 SAJJAN INDIA LTD.: DEALS, JANUARY 2021–JULY 2024
  • TABLE 246 COHANCE LIFESCIENCES: COMPANY OVERVIEW
  • TABLE 247 COHANCE LIFESCIENCES: PRODUCTS/SOLUTIONS/SERVICES OFFERED
  • TABLE 248 COHANCE LIFESCIENCES: DEALS, JANUARY 2020–DECEMBER 2023
  • TABLE 249 COHANCE LIFESCIENCES: OTHERS, JANUARY 2021–JULY 2024
  • TABLE 250 NOCTILUCA: COMPANY OVERVIEW
  • TABLE 251 NOCTILUCA: PRODUCTS/SOLUTIONS/SERVICES OFFERED
  • TABLE 252 NOCTILUCA: PRODUCT LAUNCHES
  • TABLE 253 NOCTILUCA: EXPANSIONS, JANUARY 2021–JULY 2024
  • TABLE 254 NOCTILUCA: OTHERS, JANUARY 2021–JULY 2024
  • TABLE 255 ACTYLIS: COMPANY OVERVIEW
  • TABLE 256 ACTYLIS: PRODUCTS/SOLUTIONS/SERVICES OFFERED
  • TABLE 257 ACTYLIS: DEALS, JANUARY 2020–DECEMBER 2023
  • TABLE 258 ACTYLIS: OTHERS, JANUARY 2021–JULY 2024
  • TABLE 259 AGC INC.: COMPANY OVERVIEW
  • TABLE 260 AGC INC.: PRODUCTS/SOLUTIONS/SERVICES OFFERED
  • TABLE 261 AGC INC.: PRODUCT LAUNCHES
  • TABLE 262 AGC INC.: EXPANSIONS, JANUARY 2021–JULY 2024
  • TABLE 263 AGC INC.: OTHERS, JANUARY 2021–JULY 2024
  • TABLE 264 NAVIN FLUORINE INTERNATIONAL LIMITED: COMPANY OVERVIEW
  • TABLE 265 NAVIN FLUORINE INTERNATIONAL LIMITED: PRODUCTS/SOLUTIONS/SERVICES OFFERED
  • TABLE 266 NAVIN FLUORINE INTERNATIONAL LIMITED: DEALS, JANUARY 2020-DECEMBER 2023
  • TABLE 267 NAVIN FLUORINE INTERNATIONAL LIMITED: OTHERS, JANUARY 2021–JULY 2024
  • TABLE 268 CABB GROUP GMBH: COMPANY OVERVIEW
  • TABLE 269 CABB GROUP GMBH: PRODUCTS/SOLUTIONS/SERVICES OFFERED
  • TABLE 270 CABB GROUP GMBH: OTHERS, JANUARY 2021–JULY 2024
  • TABLE 271 ADESIS INC.: COMPANY OVERVIEW
  • TABLE 272 ADESIS INC.: PRODUCTS/SOLUTIONS/SERVICES OFFERED
  • TABLE 273 ADESIS INC.: EXPANSIONS, JANUARY 2021–JULY 2024
  • TABLE 274 ADESIS INC.: OTHERS, JANUARY 2021–JULY 2024
  • TABLE 275 INVENTYS RESEARCH COMPANY: COMPANY OVERVIEW
  • TABLE 276 INVENTYS RESEARCH COMPANY: PRODUCTS/SOLUTIONS/SERVICES OFFERED
  • TABLE 277 INVENTYS RESEARCH COMPANY: EXPANSIONS, JANUARY 2021–JULY 2024
  • TABLE 278 INVENTYS RESEARCH COMPANY: OTHERS, JANUARY 2021–JULY 2024
  • TABLE 279 LINKCHEM TECHNOLOGY CO., LTD.: COMPANY OVERVIEW
  • TABLE 280 LINKCHEM TECHNOLOGY CO., LTD.: PRODUCTS/SOLUTIONS/SERVICES OFFERED
  • TABLE 281 LINKCHEM TECHNOLOGY CO., LTD.: OTHERS, JANUARY 2021–JULY 2024
  • TABLE 282 SSK BIOSCIENCES PVT. LTD.: COMPANY OVERVIEW
  • TABLE 283 CHONGQING WERLCHEM NEW MATERIALS TECHNOLOGY CO., LTD: COMPANY OVERVIEW
  • TABLE 284 VIAKEM: COMPANY OVERVIEW
  • TABLE 285 INNOVASSYNTH: COMPANY OVERVIEW
  • TABLE 286 PHT INDUSTRIES: COMPANY OVERVIEW
  • TABLE 287 SYMPHARMA: COMPANY OVERVIEW
  • TABLE 288 VIRUJ GROUP: COMPANY OVERVIEW
  • TABLE 289 REDOX SCIENTIFIC: COMPANY OVERVIEW
  • TABLE 290 SUNGWUN PHARMACOPIA CO., LTD.: COMPANY OVERVIEW
  • TABLE 291 KNC LABORATORIES CO., LTD.: COMPANY OVERVIEW
LIST OF FIGURES
 
  • FIGURE 1 ELECTRONIC CHEMICALS CDMO & CRO MARKET SEGMENTATION
  • FIGURE 2 ELECTRONIC CHEMICALS CDMO & CRO MARKET: RESEARCH DESIGN
  • FIGURE 3 MARKET SIZE ESTIMATION METHODOLOGY: SUPPLY-SIDE APPROACH
  • FIGURE 4 MARKET SIZE ESTIMATION METHODOLOGY: DEMAND-SIDE APPROACH
  • FIGURE 5 MARKET SIZE ESTIMATION METHODOLOGY: REVENUE OF MARKET PLAYERS
  • FIGURE 6 MARKET SIZE ESTIMATION METHODOLOGY: BOTTOM-UP APPROACH
  • FIGURE 7 MARKET SIZE ESTIMATION METHODOLOGY: TOP-DOWN APPROACH
  • FIGURE 8 ELECTRONIC CHEMICALS CDMO & CRO MARKET: DATA TRIANGULATION
  • FIGURE 9 ACID AND BASE CHEMICALS SEGMENT TO LEAD MARKET DURING FORECAST PERIOD
  • FIGURE 10 LARGE SCALE SEGMENT TO LEAD MARKET DURING FORECAST PERIOD
  • FIGURE 11 CLEANING AGENTS APPLICATION TO LEAD MARKET DURING FORECAST PERIOD
  • FIGURE 12 OPTOELECTRONICS END-USE INDUSTRY TO LEAD MARKET DURING FORECAST PERIOD
  • FIGURE 13 ASIA PACIFIC LEADS ELECTRONIC CHEMICALS CDMO & CRO MARKET
  • FIGURE 14 GROWTH OF SEMICONDUCTORS INDUSTRY TO DRIVE ELECTRONIC CHEMICALS CDMO & CRO MARKET
  • FIGURE 15 ACID AND BASE CHEMICALS TO BE FASTEST-GROWING SEGMENT DURING FORECAST PERIOD
  • FIGURE 16 CLEANING AGENTS TO BE FASTEST-GROWING APPLICATION SEGMENT DURING FORECAST PERIOD
  • FIGURE 17 MEDIUM SCALE TO BE FASTEST-GROWING SEGMENT DURING FORECAST PERIOD
  • FIGURE 18 OPTOELECTRONICS TO BE FASTEST-GROWING END-USE INDUSTRY DURING FORECAST PERIOD
  • FIGURE 19 CHINA AND JAPAN TO BE FASTEST-GROWING ELECTRONIC CHEMICALS CDMO & CRO MARKETS DURING FORECAST PERIOD
  • FIGURE 20 DRIVERS, RESTRAINTS, CHALLENGES, AND OPPORTUNITIES IN ELECTRONIC CHEMICALS CDMO & CRO MARKET
  • FIGURE 21 USE OF GENERATIVE AI IN ELECTRONIC CHEMICALS CDMO & CRO MARKET
  • FIGURE 22 TRENDS/DISRUPTIONS IMPACTING CUSTOMER BUSINESS IN ELECTRONIC CHEMICALS CDMO & CRO MARKET
  • FIGURE 23 ELECTRONIC CHEMICALS CDMO & CRO MARKET SUPPLY CHAIN
  • FIGURE 24 INVESTMENT AND FUNDING SCENARIO IN ELECTRONIC CHEMICALS CDMO & CRO MARKET
  • FIGURE 25 ELECTRONIC CHEMICALS CDMO & CRO MARKET: AVERAGE SELLING PRICE TREND, BY REGION
  • FIGURE 26 ELECTRONIC CHEMICALS CDMO & CRO MARKET: AVERAGE SELLING PRICE TREND, BY TYPE AND TOP 3 THREE PLAYERS
  • FIGURE 27 ELECTRONIC CHEMICALS CDMO & CRO MARKET: ECOSYSTEM ANALYSIS
  • FIGURE 28 NUMBER OF PATENTS GRANTED, 2014−2023
  • FIGURE 29 ELECTRONIC CHEMICALS CDMO & CRO MARKET: LEGAL STATUS OF PATENTS
  • FIGURE 30 PATENT ANALYSIS FOR ELECTRONIC CHEMICALS IN CDMO & CRO MARKET, BY JURISDICTION, 2014−2023
  • FIGURE 31 TOP 10 COMPANIES WITH SIGNIFICANT NUMBER OF PATENTS IN LAST 10 YEARS
  • FIGURE 32 IMPORTS OF ELECTRONIC CHEMICALS IN CDMO & CRO MARKET FOR HS CODE 3818, BY COUNTRY, 2020–2023 (USD THOUSAND)
  • FIGURE 33 EXPORTS OF ELECTRONIC CHEMICALS CDMO & CRO FOR HS CODE 3818, BY COUNTRY, 2020–2023 (USD THOUSAND)
  • FIGURE 34 PORTER’S FIVE FORCES ANALYSIS OF ELECTRONIC CHEMICALS CDMO & CRO MARKET
  • FIGURE 35 INFLUENCE OF STAKEHOLDERS ON BUYING PROCESS FOR TOP 3 END-USE INDUSTRIES
  • FIGURE 36 KEY BUYING CRITERIA FOR TOP 2 END-USE INDUSTRIES
  • FIGURE 37 ACID AND BASE CHEMICALS TO LEAD ELECTRONIC CHEMICALS CDMO & CRO MARKET DURING FORECAST PERIOD
  • FIGURE 38 LARGE SCALE SEGMENT TO LEAD ELECTRONIC CHEMICALS CDMO & CRO MARKET DURING FORECAST PERIOD
  • FIGURE 39 CLEANING AGENTS SEGMENT TO LEAD MARKET DURING FORECAST PERIOD
  • FIGURE 40 OPTOELECTRONICS END-USE INDUSTRY TO LEAD ELECTRONIC CHEMICALS CDMO & CRO MARKET DURING FORECAST PERIOD
  • FIGURE 41 ASIA PACIFIC TO BE FASTEST-GROWING MARKET DURING FORECAST PERIOD
  • FIGURE 42 ASIA PACIFIC: ELECTRONIC CHEMICALS CDMO & CRO MARKET SNAPSHOT
  • FIGURE 43 NORTH AMERICA: ELECTRONIC CHEMICALS CDMO & CRO MARKET SNAPSHOT
  • FIGURE 44 EUROPE: ELECTRONIC CHEMICALS CDMO & CRO MARKET SNAPSHOT
  • FIGURE 45 ELECTRONIC CHEMICALS CDMO & CRO MARKET SHARE ANALYSIS OF KEY PLAYERS, 2023
  • FIGURE 46 ELECTRONIC CHEMICALS CDMO & CRO MARKET: REVENUE ANALYSIS OF KEY PLAYERS, 2020–2024
  • FIGURE 47 ELECTRONIC CHEMICALS CDMO & CRO MARKET: BRAND/PRODUCT COMPARATIVE ANALYSIS
  • FIGURE 48 ELECTRONIC CHEMICALS CDMO & CRO MARKET: COMPANY EVALUATION MATRIX OF KEY PLAYERS, 2023
  • FIGURE 49 ELECTRONIC CHEMICALS CDMO & CRO MARKET: OVERALL COMPANY FOOTPRINT
  • FIGURE 50 ELECTRONIC CHEMICALS CDMO AND CRO MARKET: COMPANY EVALUATION MATRIX OF STARTUPS/SMES, 2023
  • FIGURE 51 EV/EBITDA OF KEY VENDORS
  • FIGURE 52 YEAR-TO-DATE (YTD) PRICE TOTAL RETURN AND 5-YEAR STOCK BETA OF KEY VENDORS
  • FIGURE 53 NOCTILUCA: COMPANY SNAPSHOT
  • FIGURE 54 AGC INC.: COMPANY SNAPSHOT
  • FIGURE 55 NAVIN FLUORINE INTERNATIONAL LIMITED: COMPANY SNAPSHOT
  • FIGURE 56 ADESIS INC.: COMPANY SNAPSHOT

The study involved four major activities in estimating the market size of the electronic chemicals CDMO and CRO market. Exhaustive secondary research was done to collect information on the market, the peer market, and the parent market. The next step was to validate these findings, assumptions, and sizing with industry experts across the value chain through primary research. Both top-down and bottom-up approaches were employed to estimate the complete market size. Thereafter, the market breakdown and data triangulation procedures were used to estimate the market size of the segments and subsegments.

Secondary Research

In the secondary research process, various secondary sources have been referred to for identifying and collecting information for this study. These secondary sources include annual reports, press releases, investor presentations of companies, white papers, certified publications, trade directories, articles from recognized authors, the gold standard and silver standard websites, and databases.

Secondary research has been used to obtain key information about the value chain of the industry, the monetary chain of the market, the total pool of key players, market classification, and segmentation according to industry trends to the bottom-most level and regional markets. It was also used to obtain information about the key developments from a market-oriented perspective.

Primary Research

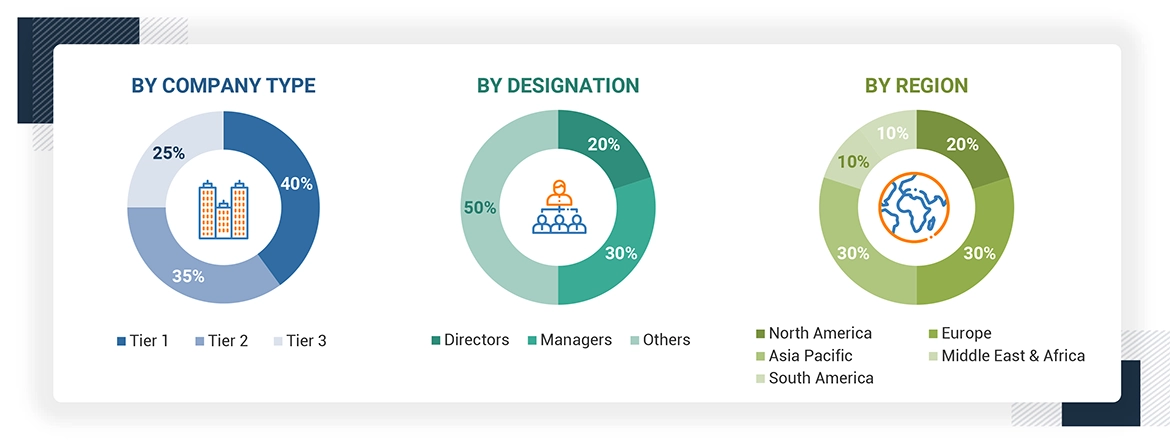
The electronic chemicals CDMO and CRO market comprises several stakeholders in the value chain, which include raw material sourcing, manufacturing and formulation, packaging and distribution, and end users. Various primary sources from the supply and demand sides of the electronic chemicals CDMO and CRO market have been interviewed to obtain qualitative and quantitative information. The primary interviewees from the demand side include key opinion leaders in the electronics chemicals sectors. The primary sources from the supply side include manufacturers, associations, and institutions involved in the electronic chemicals CDMO and CRO market industry.

Primary interviews were conducted to gather insights such as market statistics, data on revenue collected from the products and services, market breakdowns, market size estimations, market forecasting, and data triangulation. Primary research also helped in understanding the various trends related to type, scale, application, end-use and region. Stakeholders from the demand side, such as CIOs, CTOs, and CSOs, were interviewed to understand the buyer’s perspective on the suppliers, products, fabricators, and their current usage of electronic chemicals CDMO and CRO market and the outlook of their business, which will affect the overall market.
Electronic Chemicals CDMO & CRO Market

Note: Tier 1, Tier 2, and Tier 3 companies are classified based on their market revenue in 2022, available in the public domain, product portfolios, and geographical presence.

To know about the assumptions considered for the study, download the pdf brochure

COMPANY NAME DESIGNATION
Navin Fluorine International Limited Sales Executive
Sajjan India Ltd. Marketing Personnel
Actylis Research Scientist
Noctiluca Product Manager

Market Size Estimation

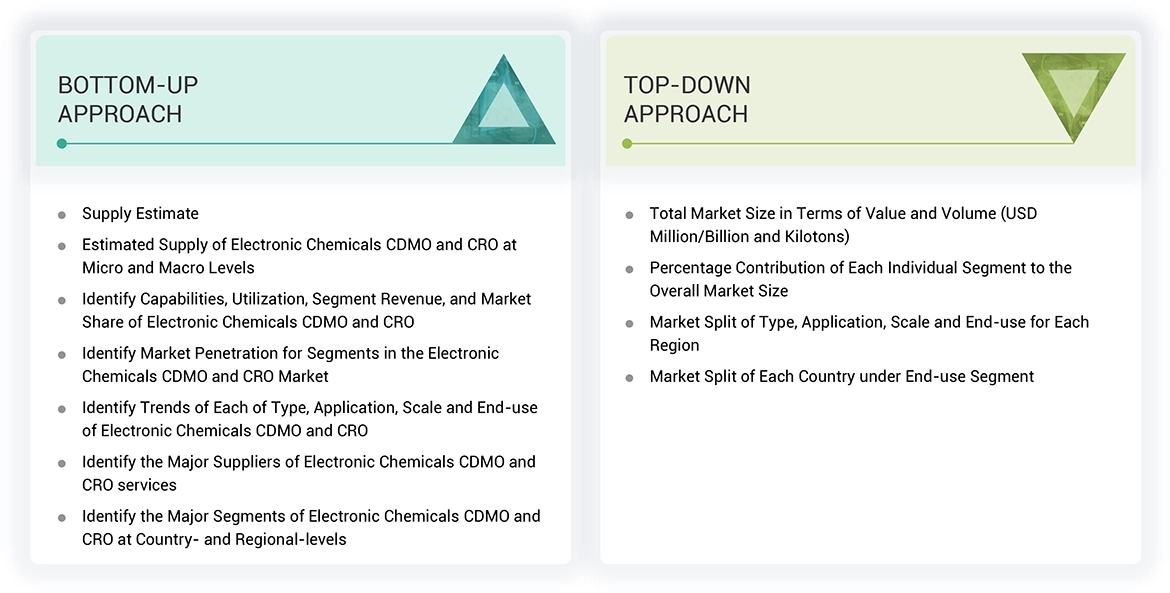
The top-down and bottom-up approaches have been used to estimate and validate the size of the electronics chemicals CDMO and CRO market.

  • The key players in the industry have been identified through extensive secondary research.
  • The industry's supply chain has been determined through primary and secondary research.
  • All percentage shares, splits, and breakdowns have been determined using secondary sources and verified through primary sources.
  • All possible parameters that affect the markets covered in this research study have been accounted for, viewed in extensive detail, verified through primary research, and analyzed to obtain the final quantitative and qualitative data.
  • The research includes the study of reports, reviews, and newsletters of the key market players, along with extensive interviews for opinions with leaders such as directors and marketing executives.
Electronic Chemicals CDMO & CRO Market

Data Triangulation

After arriving at the overall market size using the market size estimation processes explained above, the market was split into several segments and subsegments. The data triangulation and market breakup procedures were employed, wherever applicable, to complete the overall market engineering process and arrive at the exact statistics of each market segment and subsegment. The data was triangulated by studying various factors and trends from both the demand and supply sides.

Market Definition

Electronic chemicals include the specialized electronic chemicals contract development and manufacturing organization (CDMO) and contract research organization (CRO markets) services of personalized concepts for developing, manufacturing, and conducting research on electronic materials to satisfy manufacturers in the electronics industry. It covers almost all key materials, namely photoresist, etching agent, cleaning agents, and other advanced chemicals used in semiconductors, displays, optoelectronics, and other products. The market acts as a strong backbone for electronics manufacturers in innovation and cost efficiency. Services in CDMO generally involve process development, scale-up, and production of specialty chemicals. CRO services comprise R&D activities, formulation, and material testing. Growth in this market is further facilitated by government incentives for technological innovations and extensive investments in the rapid establishment of electronics manufacturing hubs in various areas such as Asia Pacific. Most of the players in this domain partner with global electronics manufacturers to create conditions that rope in both performance and environmental standards; thus providing custom solutions as well as scalability to their solutions. Hence, the electronics chemicals CDMO and CRO markets can help the modernization of electronic devices by bringing an increasingly faster innovation cycle to the development process and ensuring that the materials critical to their manufacture remain high quality.

Stakeholders

  • Electronics Chemicals CDMO and CRO Market Manufacturers
  • Electronics Chemicals CDMO and CRO Market Traders, Distributors, and Suppliers
  • Government and research organizations
  • Associations and industrial bodies
  • Research and consulting firms.
  • Research & development (R&D) institutions.
  • Electronic Manufacturers

Report Objectives

  • To define, describe, and forecast the size of the electronic chemicals CDMO and CRO market, in terms of value and volume.
  • To provide detailed information regarding the major factors (drivers, opportunities, restraints, and challenges) influencing the growth of the market
  • To estimate and forecast the market size based on type, application, scale, end-use and region.
  • To forecast the size of the market with respect to major regions, namely, Europe, North America, Asia Pacific, Middle East & Africa, and South America, along with their key countries.
  • To strategically analyze micromarkets1 with respect to individual growth trends, prospects, and their contribution to the overall market.
  • To analyze opportunities in the market for stakeholders and provide a competitive landscape of market leaders.
  • To track and analyze recent developments such as expansions, new product launches, partnerships & agreements, and acquisitions in the market.
  • To strategically profile key market players and comprehensively analyze their core competencies.

Previous Versions of this Report

Custom Market Research Services

We Will Customise The Research For You, In Case The Report Listed Above Does Not Meet With Your Requirements

Get 10% Free Customisation

Growth opportunities and latent adjacency in Electronic Chemicals CDMO & CRO Market

DMCA.com Protection Status