Electric Commercial Vehicle Traction Motor Market Size, Share, Analysis

Report Code AT 9013
Published in May, 2024, By MarketsandMarkets™
Download PDF

Choose License Type

Buy Report Now Inquire Before Buying

Electric Commercial Vehicle Traction Motor Market by Vehicle Type (Pickups, Medium and Heavy-Duty Trucks, Vans, Buses), Power Output, Motor Type, Transmission, Design, Axle Architecture (Integrated, Central Drive Unit), & Region - Global Forecast to 2030

Overview

The global electric commercial vehicle traction motor market size was valued at USD 2.1 billion in 2024 and is expected to reach USD 9.8 billion by 2030, at a CAGR of 28.8%, during the forecast period 2024-2030. The traction motor market for Electric Commercial Vehicles (ECVs) has witnessed substantial growth in recent years, driven by several key factors. With the increasing focus on environmental sustainability and stringent emissions regulations, there has been a significant shift towards electrification in the transportation sector, particularly in commercial vehicles. This transition has fueled the demand for traction motors, which are integral components in electric vehicles, powering their propulsion systems. Moreover, advancements in battery technology and the expanding infrastructure for electric vehicle charging have bolstered the adoption of ECVs, further propelling the traction motor market's expansion. Additionally, governments worldwide are incentivizing the adoption of electric vehicles through subsidies, tax credits, and regulatory measures, which has accelerated the market growth. In February 2023, the European Union proposed ambitious CO2 standards for most new trucks and coaches (90% emissions reduction by 2040) and urban buses (100% zero-emission city bus sales by 2030). Furthermore, the growing interest from automotive manufacturers and suppliers in developing innovative traction motor solutions, including high-efficiency motors with improved power density and thermal management capabilities, has contributed to the market's upward trajectory. For instance, in January 2024, American Axle & Manufacturing launched its next-generation 3-in-1 electric drive units (eDUs), fully integrated e-Beam axles at CES 2024, along with innovative component technologies that are helping define the future of mobility around the globe. Additionally, in October 2023, Allison Transmission, Inc. launched its new eGen Power 85S, a fully electric axle integrated into the Isuzu Novo VOLT electric bus. As a result, the ECV traction motor market is expected to continue its robust growth momentum in the foreseeable future, driven by ongoing technological advancements, supportive government policies, and increasing consumer acceptance of electric commercial vehicles. As a result, the ECV traction motor market is expected to continue its robust growth momentum in the foreseeable future, driven by ongoing technological advancements, supportive government policies, and increasing consumer acceptance of electric commercial vehicles.

Attractive Opportunities in the Electric Commercial Vehicle Traction Motor Market

Asia Pacific

The growth of Asia Pacific Electric commercial vehicle traction motor market is attributed to predominance of leading players and implemented supportive policies and incentives to promote the adoption of electric vehicles, including commercial vehicles. Also, leading manufacturers are investing in R&D to enhance the performance, efficiency, and reliability of traction motors, catering to the specific needs of the market

The Electric commercial vehicle traction motor market's growth is driven by technical innovations in Motor Control and Power Electronics, along with growing adoption of electric commercial vehicles and lower operating costs compared to ICE engines

The Asia Pacific market is projected to reach USD 4.2 Billion by 2030, at a CAGR of 20.0% during the forecast period.

Electric Vans are emerging as leader in electric commercial vehicles traction motor market as they are widely used for local delivery services, such as courier, e-commerce, and last-mile logistics. Their compact size allows for easier navigation in urban areas and parking in tight spaces, making them ideal for urban delivery operations.

Europe is expected to have significant growth for above 400 kW segment of the electric commercial vehicle traction motor market during the forecast period. The market growth in Europe can be attributed to the presence of players in the electric commercial vehicle traction motor market, such as Robert Bosch GmbH (Germany), ZF Friedrichshafen AG (Germany), Schaffler AG (Germany), MAHLE GmbH (Germany) and among others

Global Electric Commercial Vehicle Traction Motor Market Dynamics

Driver: Technical innovations in Motor Control and Power Electronics

The development of advanced motor control algorithms, generally based on artificial intelligence (AI), allows for more accurate control of the motor's magnetic field and torque delivery. This results in smoother operation, quicker acceleration, and more sustained power output, all of which increase the performance and drivability of electric commercial vehicles. Furthermore, advancements in power electronics components such as inverters and converters, particularly the adoption of silicon carbide (SiC) MOSFETs, contribute to higher power densities, faster switching speeds, and increased efficiency in electric drivetrains. This results in reduced energy losses during power conversion, ultimately extending the range and improving the overall efficiency of electric commercial vehicles. These technological innovations have significantly enhanced the efficiency, performance, and reliability of electric traction motors. Companies such as Evolito Ltd., EVR Motors, Passionchip, and Petalite are taking initiatives in the development of power electronics for EV traction motors. Modern motor control algorithms enable finer control over motor speed, torque, and efficiency, facilitating smoother acceleration, regenerative braking, and optimized energy management in electric commercial vehicles. The utilization of AI in motor control further enhances precision and adaptability, ensuring optimal performance across varying driving conditions.

Restraint: Limited range of electric commercial vehicle

Range anxiety, or the fear of running out of battery power before reaching a destination or charging station, is a primary concern for fleet operators and businesses considering the adoption of electric commercial vehicles. Unlike traditional gasoline or diesel vehicles that can be refueled quickly at numerous gas stations, electric commercial vehicles require charging infrastructure that may not be as widespread or convenient, especially for long-haul transportation or applications requiring heavy loads.The restricted range of electric commercial vehicles not only impacts their adoption but also directly affects the demand for traction motors. Fleet operators might hesitate to invest in these vehicles if they anticipate operational disruptions or increased downtime due to the need for frequent recharging. This hesitation translates into lower demand for electric traction motors, hindering market growth and investment in motor technology. Moreover, the limited range of electric commercial vehicles influences the design and specifications of traction motors. Manufacturers must balance factors such as motor efficiency, energy density, and power output to optimize the range and performance of these vehicles. However, achieving an ideal balance between these factors requires compromises and trade-offs, which can result in higher costs or reduced competitiveness compared to traditional vehicles.


Opportunity: Developments in Fuel Cell technology

Fuel cell vehicles, powered by hydrogen fuel cells, offer an alternative zero-emission solution to battery electric vehicles, particularly for heavy-duty applications such as trucks and buses where long-range and rapid refueling are critical. Traction motors play a crucial role in fuel cell vehicles, powering electric drivetrains that propel the vehicles forward. As the demand for fuel cell commercial vehicles increases, traction motor manufacturers have the opportunity to supply high-performance motors tailored to the specific requirements of fuel cell drivetrains. By leveraging their expertise in electric motor technology and adapting their products to suit the unique characteristics of fuel cell vehicles, traction motor manufacturers can capture a growing share of the market for electric drivetrain components. Additionally, collaboration with fuel cell vehicle manufacturers and infrastructure providers can accelerate the adoption of fuel cell commercial vehicles, creating additional opportunities for traction motor suppliers to expand their presence in the evolving market for zero-emission transportation solutions. Various automakers are also showcasing their fuel cell tech-laden commercial vehicles. For instance, GM (US) announced in December 2023 that it had partnered with Autocar, LLC (US) to develop zero-emission commercial vehicles powered by GM’s fuel cell solution, HYDROTEC power cubes.

Challenge: Overheating of motor

The overheating of motor poses a significant challenge to the growth of the electric vehicle traction motor market. Excessive heating can lead to motor failure by weakening the winding insulation in electric motors, resulting in insulation failure. Overheating leads to thermal stress on motor components, causing them to wear out faster and reducing overall efficiency. This results in decreased vehicle performance, slower acceleration, reduced towing capacity and compromised operational reliability. It also affects the vehicle's range, as the battery management system may limit power output to prevent further overheating. This can exacerbate range anxiety among consumers and fleet operators, making them hesitant to adopt electric commercial vehicles, especially for long-distance applications.Overheating occurs due to various factors, including overload, poor power conditions, highly effective service factors, frequent turning on/off of the motor, lack of air circulation around the motor, and operation in high-temperature environments. Permanent magnet motors, commonly used in electric traction motors, are particularly susceptible to reliability issues caused by overheating. These motors can lose their magnetism if exposed to high temperatures, leading to demagnetization of the permanent magnets and decreased torque performance. Overheating poses safety risks to both the vehicle occupants and the surrounding environment. In extreme cases, overheating can lead to motor failure, electrical shorts, or even fires, presenting a significant liability for manufacturers and discouraging consumer confidence in ECV technology.To mitigate these challenges and promote the market of electric commercial vehicle traction motors, manufacturers must invest in R&D to improve thermal management strategies, enhance motor efficiency, and optimize cooling systems. This includes implementing advanced thermal insulation materials, active cooling solutions, intelligent motor control algorithms, and predictive maintenance technologies to prevent overheating and ensure reliable performance in operating conditions. Additionally, robust testing and validation procedures are essential to identify and address potential thermal issues early in the development process, thereby building confidence among consumers and accelerating the adoption of traction motors in electric commercial vehicles.

Global Electric Commercial Vehicle Traction Motor Market Ecosystem Analysis

The ecosystem mapping highlights various players in the electric commercial vehicle traction motor market ecosystem, which is primarily represented by OEMs, Tier I integrators/suppliers, and Tier II suppliers. Some major electric commercial vehicle traction motor suppliers are ZF Friedrichshafen AG (Germany), Dana Limited (US), Robert Bosch GmbH (Germany), Magna International Inc. (Germany), and Allison Transmission, Inc. (US). Tianqi Lithium (China), Livent Corporation (US), BHP (Australia), Codelco (Chile), and Nippon Steel (Japan), Freeport-McMoRan (US) are the major raw material providers for electric commercial vehicle traction motors.


Improved acceleration and range to drive growth of multi-speed drive during the forecasted period.

A multi-speed drive in traction motors incorporates multiple gear ratios, allowing the motor to operate at different speeds or torque outputs. In this setup, the motor is coupled with a transmission mechanism that can shift between different gear ratios based on the vehicle's speed, load, or driver input. Adjusting the gear ratio allows the motor to operate at different speeds while maintaining optimal efficiency and performance. This enables the vehicle to achieve better acceleration, higher top speeds, improved hill-climbing capabilities, and enhanced energy efficiency compared to single-speed drive systems. Multi-speed drive motors are particularly beneficial in electric commercial vehicles operating in diverse environments, including urban, suburban, and highway driving conditions. By providing multiple gear ratios, these motors optimize power delivery and torque output across various speeds and load demands, resulting in improved overall driving dynamics, efficiency, and range. Additionally, multi-speed drive systems offer flexibility in adapting to different driving scenarios, ensuring optimal performance and drivability in various operating conditions.OEMs such as AB Volvo (Sweden) offer a two-speed automated manual transmission in their Volvo 7900 electric bus with a power output of 200 kW. Multi-speed drive systems enable manufacturers to tailor the powertrain to specific vehicle applications, maximizing performance and efficiency. It also contributes to a smoother and more responsive driving experience, with seamless gear changes and improved control over vehicle speed. This advantage enhances driver comfort and satisfaction, leading to improved productivity and safety, particularly in demanding commercial vehicle applications.

The comprehensive offerings by motor manufacturers of 100–200 kW power output segment to drive growth of the electric commercial vehicles traction motor market over the forecast period.

The 100–200 kW power output is primarily found in delivery vans, medium-duty trucks, and pick-up trucks, offering versatile regional transport and urban logistics solutions. Some 100–200 kW motors can be designed to accept higher DC fast charging rates. This can significantly reduce charging times, making electric vehicles more convenient for long trips or everyday use. A 100–200 kW motor delivers better passing power and overall responsiveness when passing slower vehicles or maintaining speed on high-speed roads. This is crucial for safety and confidence while driving on highways.Traction motor manufacturers such as ABB Ltd. (Switzerland) offer 163 kW EV traction motors for heavy electric vehicles with a peak power output of 163 kW and motor speed of 5000 rpm. Similarly, Dana Incorporated (US) offers 170 kW IP6K9K-rated EV traction motors/inverters for light, medium, and heavy electric vehicles with a peak power of 170 kW and speed of 3,250 rpm. Such comprehensive offerings by motor manufacturers support the market growth of the 100–200 kW segment in the electric commercial vehicle traction motor market.

Asia Pacific region holds the largest share of the Electric Commercial Vehicle Traction Motor Market.

The Asia Pacific region is projected to be the largest ECV traction motor market by 2030. The Asia Pacific market is dominated by China, which has large sales volumes for Electric Commercial Vehicle Traction Motors, especially electric buses. With favourable government regulations and the increasing adoption of electric buses in public transport fleets, India is expected to be a high potential market for Electric Commercial Vehicle Traction Motors in the future. Automotive manufacturers, technology companies, and startups in India are actively collaborating to develop and deploy electric commercial vehicles. This collaboration fosters innovation and accelerates the adoption of traction motors in the Indian market. In January 2023, American Axle and Manufacturing, Inc. and EKA mobility (India) have collaborated to supply eka e-beam axle for the 2.5 T battery electric commercial vehicle by EKA. Asia Pacific is home to many traction motor manufacturers and suppliers, such as BYD (China), Shenzhen Inovance Technology (China), Zhejiang Founder Motor Co., Ltd. (China), Kirloskar Electric Company Limited (India), Mitsubishi Electric Corporation (Japan) and among others. The presence of all such manufacturers in the region will drive the market for Electric Commercial Vehicle Traction Motors during the forecast period.


Recent Developments of Electric Commercial Vehicle Traction Motor Market industry

  • In January 2024, Magna International Inc. launched its next-generation 800V eDrive solution with new standards in efficiency, power-to-weight ratio, and torque density. The system delivers 250 kW of power and 5,000 Nm of axle torque, achieving up to 93% efficiency in real-world driving.
  • In January 2024, American Axle & Manufacturing launched its next-generation 3-in-1 electric drive units (eDUs), fully integrated e-Beam axles at CES 2024, along with innovative component technologies that are helping define the future of mobility around the globe.

Key Market Players

Want to explore hidden markets that can drive new revenue in Electric Commercial Vehicle Traction Motor Market?

Scope of the Report

Report Attribute Details
Market size available for years 2019–2030
Base year considered 2023
Forecast period 2024-2030
Forecast units Volume (Units) and Value (USD Million)
Segments Covered Vehicle type, Power Output, Motor type, Design, Transmission, Axle Architecture and Region
Geographies covered Asia Pacific, Europe, and North America
Companies Covered ZF Friedrichshafen AG (Germany), Dana Limited (US), Robert Bosch GmbH (Germany), Magna International Inc. (Germany), and Allison Transmission, Inc. (US)


Key Questions Addressed by the Report

What is the current size of the electric commercial vehicle traction motor market by value?
The market size is estimated to be USD 2.1 billion in 2024.
Who are the key players in the electric commercial vehicle traction motor market?
Major players include ZF Friedrichshafen AG (Germany), Dana Limited (US), Robert Bosch GmbH (Germany), Magna International Inc. (Germany), and Allison Transmission, Inc. (US), among others.
Which region will have the fastest-growing electric commercial vehicle traction motor market?
Asia Pacific, driven by China's leadership in global EV sales and prominent automotive manufacturers like BYD, Shenzhen Inovance Technology, and Mitsubishi Electric Corporation.
What are the new market trends impacting the electric commercial vehicle traction motor market?
Key trends include government initiatives promoting electric commercial vehicles and technological advancements in motor control and power electronics.
What countries are covered in the North American region for this market?
The US and Canada are included in the North American market analysis.


Personalize This Research

  • Triangulate with your Own Data
  • Get Data as per your Format and Definition
  • Gain a Deeper Dive on a Specific Application, Geography, Customer or Competitor
  • Any level of Personalization
Request A Free Customisation

Let Us Help You

  • What are the Known and Unknown Adjacencies Impacting the Electric Commercial Vehicle Traction Motor Market
  • What will your New Revenue Sources be?
  • Who will be your Top Customer; what will make them switch?
  • Defend your Market Share or Win Competitors
  • Get a Scorecard for Target Partners
Customized Workshop Request

Table of Contents

Exclusive indicates content/data unique to MarketsandMarkets and not available with any competitors.

TITLE
PAGE NO
INTRODUCTION
25
RESEARCH METHODOLOGY
33
EXECUTIVE SUMMARY
47
PREMIUM INSIGHTS
51
MARKET OVERVIEW
55
  • 5.1 INTRODUCTION
  • 5.2 MARKET DYNAMICS
    DRIVERS
    - Technological innovations in motor control and power electronics
    - Shift toward sustainable transportation
    - Lower operating costs than ICE engines
    - Government initiatives and subsidiaries
    RESTRAINTS
    - Vulnerability to supply chain constraints
    - Limited range of electric commercial vehicles
    OPPORTUNITIES
    - Development in fuel cell technology
    - Rapid urbanization and fast growth of e-commerce sector
    CHALLENGES
    - Overheating of motor
    - Absence of standardized norms and regulations
  • 5.3 PRICING ANALYSIS
  • 5.4 BILL OF MATERIALS
  • 5.5 SUPPLY CHAIN ANALYSIS
  • 5.6 ECOSYSTEM ANALYSIS
    TIER II SUPPLIERS
    TIER I SUPPLIERS
    OEMS
  • 5.7 CASE STUDY ANALYSIS
    DESIGN OF MODULAR EAXLE FOR ALL-TERRAIN HEAVY-DUTY APPLICATIONS CONSIDERING GRADIENT WEIGHT TRANSFER
    DESIGN AND PACKAGING OF ALL-IN-ONE AXLE
    USER EXPERIENCE OF BATTERY-ELECTRIC TRUCKS IN NORWAY
  • 5.8 INVESTMENT SCENARIO
  • 5.9 PATENT ANALYSIS
    INTRODUCTION
    LEGAL STATUS OF PATENTS, 2012–2024
    TOP PATENT APPLICANTS, 2012–2024
  • 5.10 TECHNOLOGY ANALYSIS
    KEY TECHNOLOGIES
    - Axial Flux Motors
    - Switched Reluctance Motors (SRMs)
    - Permanent Magnet Synchronous Reluctance Motors
    ADJACENT TECHNOLOGIES
    - IOT in electric vehicles
    - Solid-state batteries
  • 5.11 HS CODE
  • 5.12 REGULATORY LANDSCAPE
    COUNTRY-WISE REGULATIONS
    - Netherlands
    - Germany
    - France
    - UK
    - China
    - US
    REGULATORY BODIES, GOVERNMENT AGENCIES, AND OTHER ORGANIZATIONS
  • 5.13 KEY CONFERENCES AND EVENTS
  • 5.14 KEY STAKEHOLDERS AND BUYING CRITERIA
    KEY STAKEHOLDERS IN BUYING PROCESS
    BUYING CRITERIA
  • 5.15 TRENDS/DISRUPTIONS IMPACTING CUSTOMER BUSINESS
ELECTRIC COMMERCIAL VEHICLE TRACTION MOTOR MARKET, BY AXLE ARCHITECTURE
89
  • 6.1 INTRODUCTION
  • 6.2 INTEGRATED AXLE
    LOW MAINTENANCE REQUIREMENTS TO DRIVE GROWTH
  • 6.3 CENTRAL DRIVE AXLE
    OPTIMIZED WEIGHT DISTRIBUTION WITHIN VEHICLES TO DRIVE GROWTH
  • 6.4 KEY PRIMARY INSIGHTS
ELECTRIC COMMERCIAL VEHICLE TRACTION MOTOR MARKET, BY DESIGN
94
  • 7.1 INTRODUCTION
  • 7.2 RADIAL FLUX
    HIGH POWER DENSITY AND EFFICIENCY TO DRIVE GROWTH
  • 7.3 AXIAL FLUX
    COMPACT DESIGN AND SCALABILITY TO DRIVE GROWTH
  • 7.4 KEY PRIMARY INSIGHTS
ELECTRIC COMMERCIAL VEHICLE TRACTION MOTOR MARKET, BY MOTOR TYPE
99
  • 8.1 INTRODUCTION
  • 8.2 PERMANENT MAGNET SYNCHRONOUS MOTOR
    ADVANCEMENTS IN MOTOR DESIGN TO DRIVE GROWTH
  • 8.3 AC INDUCTION MOTOR
    LOWER PRODUCTION COSTS TO DRIVE GROWTH
  • 8.4 DC TRACTION MOTOR
    LOW EFFICIENCY AND HIGH ENERGY CONSUMPTION TO IMPEDE GROWTH
    DC SERIES MOTOR
    DC BRUSHLESS MOTOR
    SWITCHED RELUCTANCE MOTOR
    ELECTRICALLY EXCITED SYNCHRONOUS MOTOR
  • 8.5 KEY PRIMARY INSIGHTS
ELECTRIC COMMERCIAL VEHICLE TRACTION MOTOR MARKET, BY POWER OUTPUT
107
  • 9.1 INTRODUCTION
  • 9.2 LESS THAN 100 KW
    RISING ADOPTION OF ELECTRIC VANS FOR DELIVERIES BY LOGISTICS SECTOR TO DRIVE GROWTH
  • 9.3 100–200 KW
    COMPREHENSIVE OFFERINGS BY MOTOR MANUFACTURERS TO DRIVE GROWTH
  • 9.4 200–400 KW
    WIDE SCOPE OF APPLICATIONS IN ELECTRIC COMMERCIAL VEHICLES TO DRIVE GROWTH
  • 9.5 ABOVE 400 KW
    ESCALATING DEMAND FOR HIGH-POWERED ELECTRIC PICK-UP TRUCKS TO DRIVE GROWTH
  • 9.6 KEY PRIMARY INSIGHTS
ELECTRIC COMMERCIAL VEHICLE TRACTION MOTOR MARKET, BY TRANSMISSION
114
  • 10.1 INTRODUCTION
  • 10.2 SINGLE-SPEED DRIVE
    REDUCED MECHANICAL COMPLEXITY AND POWER LOSS TO DRIVE GROWTH
  • 10.3 MULTI-SPEED DRIVE
    IMPROVED ACCELERATION AND RANGE TO DRIVE GROWTH
  • 10.4 KEY PRIMARY INSIGHTS
ELECTRIC COMMERCIAL VEHICLE TRACTION MOTOR MARKET, BY VEHICLE TYPE
119
  • 11.1 INTRODUCTION
  • 11.2 PICK-UP TRUCKS
    RISING DEMAND FOR CLEANER TRANSPORTATION SOLUTIONS TO DRIVE GROWTH
  • 11.3 TRUCKS
    RAPID DEVELOPMENT OF ELECTRIC TRUCKS BY AUTOMOTIVE OEMS TO DRIVE GROWTH
    - Medium-duty trucks
    - Heavy-duty trucks
  • 11.4 VANS
    BOOMING LOGISTICS SECTOR TO DRIVE GROWTH
    - Light vans
    - Full-size vans
  • 11.5 BUSES & COACHES
    INCREASING DEMAND FOR EMISSION-FREE PUBLIC TRANSPORT TO DRIVE GROWTH
  • 11.6 KEY PRIMARY INSIGHTS
ELECTRIC COMMERCIAL VEHICLE TRACTION MOTOR MARKET, BY REGION
135
  • 12.1 INTRODUCTION
  • 12.2 ASIA PACIFIC
    RECESSION IMPACT
    CHINA
    - Presence of leading players to drive market
    JAPAN
    - Increased investments in automotive R&D to drive market
    INDIA
    - Major government initiatives to promote EV ecosystem to drive market
    SOUTH KOREA
    - Rising demand for electric pick-up trucks to drive market
  • 12.3 NORTH AMERICA
    RECESSION IMPACT
    US
    - Rising adoption of electric vans with traction motors to drive market
    CANADA
    - Government plans to electrify transit to drive market
  • 12.4 EUROPE
    RECESSION IMPACT
    FRANCE
    - Rising adoption of EVs to drive market
    GERMANY
    - Increasing investment in R&D activities for development of advanced ECV traction motors to drive market
    SPAIN
    - Government focus on replacing existing ICE buses and vans with EVs to drive market
    AUSTRIA
    - Government support in electrification of commercial vehicles to drive market
    NORWAY
    - Rapid adoption of EVs to drive market
    SWEDEN
    - Growth of EV ecosystem to drive market
    NETHERLANDS
    - Advancement in EV charging infrastructure to drive market
    UK
    - Increasing investment in R&D activities for development of advanced electric traction motors to drive market
    ITALY
    - Strong focus on utilization of renewable energy sources to drive market
    REST OF EUROPE
COMPETITIVE LANDSCAPE
176
  • 13.1 OVERVIEW
  • 13.2 MARKET RANKING ANALYSIS
  • 13.3 REVENUE ANALYSIS
  • 13.4 COMPANY EVALUATION MATRIX
    STARS
    EMERGING LEADERS
    PERVASIVE PLAYERS
    PARTICIPANTS
    COMPANY FOOTPRINT
  • 13.5 STARTUP/SME EVALUATION MATRIX
    PROGRESSIVE COMPANIES
    RESPONSIVE COMPANIES
    DYNAMIC COMPANIES
    STARTING BLOCKS
    COMPETITIVE BENCHMARKING
  • 13.6 COMPETITIVE SCENARIOS AND TRENDS
    PRODUCT LAUNCHES
    DEALS
    EXPANSIONS
  • 13.7 COMPANY VALUATION AND FINANCIAL METRICS
    COMPANY VALUATION
    FINANCIAL METRICS
  • 13.8 PRODUCT COMPARISON
COMPANY PROFILES
194
  • 14.1 KEY PLAYERS
    DANA LIMITED
    - Business overview
    - Products/Solutions/Services offered
    - Recent developments
    - MnM view
    ZF FRIEDRICHSHAFEN AG
    - Business overview
    - Products/Solutions/Services offered
    - Recent developments
    - MnM view
    ROBERT BOSCH GMBH
    - Business overview
    - Products/Solutions/Services offered
    - Recent developments
    - MnM view
    MAGNA INTERNATIONAL INC.
    - Business overview
    - Products/Solutions/Services offered
    - Recent developments
    - MnM view
    BORGWARNER INC.
    - Business overview
    - Products/Solutions/Services offered
    - Recent developments
    - MnM view
    AMERICAN AXLE & MANUFACTURING, INC.
    - Business overview
    - Products/Solutions/Services offered
    - Recent developments
    ALLISON TRANSMISSION, INC.
    - Business overview
    - Products/Solutions/Services offered
    - Recent developments
    BYD
    - Business overview
    - Products/Solutions/Services offered
    - Recent developments
    SCHAEFFLER AG
    - Business overview
    - Products/Solutions/Services offered
    - Recent developments
    MAHLE GMBH
    - Business overview
    - Products/Solutions/Services offered
    - Recent developments
    SHENZHEN INOVANCE TECHNOLOGY
    - Business overview
    - Products/Solutions/Services offered
  • 14.2 OTHER PLAYERS
    CUMMINS INC.
    SKODA TRANSPORTATION A.S.
    KIRLOSKAR ELECTRIC COMPANY LIMITED
    TRAKTIONSSYSTEME AUSTRIA (TSA) GMBH
    DELTA ELECTRONICS, INC.
    MITSUBISHI ELECTRIC CORPORATION
    HITACHI, LTD.
    VEM GROUP
    WEG
    ZHEJIANG FOUNDER MOTOR CO., LTD.
RECOMMENDATIONS BY MARKETSANDMARKETS
244
  • 15.1 ASIA PACIFIC TO BE SIGNIFICANT MARKET FOR ELECTRIC COMMERCIAL VEHICLE TRACTION MOTORS
  • 15.2 PERMANENT MAGNET SYNCHRONOUS MOTORS TO EMERGE AS LARGEST SEGMENT OF ELECTRIC COMMERCIAL VEHICLE TRACTION MOTOR MARKET
  • 15.3 LESS THAN 100 KW POWER OUTPUT TO BE PROMISING SEGMENT OF MARKET
  • 15.4 CONCLUSION
APPENDIX
246
  • 16.1 KEY INSIGHTS FROM INDUSTRY EXPERTS
  • 16.2 DISCUSSION GUIDE
  • 16.3 KNOWLEDGESTORE: MARKETSANDMARKETS’ SUBSCRIPTION PORTAL
  • 16.4 CUSTOMIZATION OPTIONS
    ELECTRIC COMMERCIAL VEHICLE TRACTION MOTOR MARKET, BY MOTOR TYPE, AT COUNTRY LEVEL (FOR COUNTRIES COVERED IN SCOPE OF REPORT)
    PROFILING OF ADDITIONAL MARKET PLAYERS (UP TO 5)
  • 16.5 RELATED REPORTS
  • 16.6 AUTHOR DETAILS
LIST OF TABLES
 
  • TABLE 1 MARKET DEFINITION, BY VEHICLE TYPE
  • TABLE 2 MARKET DEFINITION, BY MOTOR TYPE
  • TABLE 3 MARKET DEFINITION, BY POWER OUTPUT
  • TABLE 4 MARKET DEFINITION, BY DESIGN
  • TABLE 5 MARKET DEFINITION, BY TRANSMISSION
  • TABLE 6 MARKET DEFINITION, BY AXLE ARCHITECTURE
  • TABLE 7 INCLUSIONS AND EXCLUSIONS
  • TABLE 8 USD EXCHANGE RATES
  • TABLE 9 OPERATIONAL COST COMPARISON: ICE VS. ELECTRIC TRACTION MOTOR
  • TABLE 10 GOVERNMENT INCENTIVES, BY COUNTRY
  • TABLE 11 OEM VEHICLE MODELS, BY RANGE
  • TABLE 12 FUEL CELL ELECTRIC COMMERCIAL VEHICLE LAUNCHES SCHEDULED IN 2024−2026
  • TABLE 13 TRANSITION TOWARD ELECTRIFICATION FOR E-COMMERCE AND DELIVERY VEHICLES
  • TABLE 14 ROLE OF COMPANIES IN ELECTRIC COMMERCIAL VEHICLE TRACTION MOTOR MARKET ECOSYSTEM
  • TABLE 15 LIST OF FEW FUNDING, 2022–2024
  • TABLE 16 PATENT REGISTRATIONS RELATED TO MARKET, 2022–2024
  • TABLE 17 ELECTRIC COMMERCIAL VEHICLE TRACTION MOTOR IMPORT DATA FOR HS CODE 8501, BY COUNTRY, 2020–2022 (USD)
  • TABLE 18 ELECTRIC COMMERCIAL VEHICLE TRACTION MOTOR EXPORT DATA FOR HS CODE 8501, BY COUNTRY, 2020–2022 (USD)
  • TABLE 19 NETHERLANDS: EV INCENTIVES
  • TABLE 20 GERMANY: EV INCENTIVES
  • TABLE 21 FRANCE: EV INCENTIVES
  • TABLE 22 UK: EV INCENTIVES
  • TABLE 23 CHINA: EV INCENTIVES
  • TABLE 24 US: EV INCENTIVES
  • TABLE 25 ASIA PACIFIC: REGULATORY BODIES, GOVERNMENT AGENCIES, AND OTHER ORGANIZATIONS
  • TABLE 26 NORTH AMERICA: REGULATORY BODIES, GOVERNMENT AGENCIES, AND OTHER ORGANIZATIONS
  • TABLE 27 EUROPE: REGULATORY BODIES, GOVERNMENT AGENCIES, AND OTHER ORGANIZATIONS
  • TABLE 28 KEY CONFERENCES AND EVENTS, 2024−2025
  • TABLE 29 INFLUENCE OF STAKEHOLDERS ON BUYING PROCESS FOR TOP 3 VEHICLE TYPES
  • TABLE 30 KEY BUYING CRITERIA FOR TOP 3 VEHICE TYPE
  • TABLE 31 ELECTRIC COMMERCIAL VEHICLE TRACTION MOTOR MARKET, BY AXLE ARCHITECTURE, 2019–2023 (UNITS)
  • TABLE 32 MARKET, BY AXLE ARCHITECTURE, 2024–2030 (UNITS)
  • TABLE 33 INTEGRATED AXLE: MARKET, BY REGION, 2019–2023 (UNITS)
  • TABLE 34 INTEGRATED AXLE: MARKET, BY REGION, 2024–2030 (UNITS)
  • TABLE 35 CENTRAL DRIVE AXLE: MARKET, BY REGION, 2019–2023 (UNITS)
  • TABLE 36 CENTRAL DRIVE AXLE: MARKET, BY REGION, 2024–2030 (UNITS)
  • TABLE 37 MARKET, BY DESIGN, 2019–2023 (UNITS)
  • TABLE 38 MARKET, BY DESIGN, 2024–2030 (UNITS)
  • TABLE 39 RADIAL FLUX: MARKET, BY REGION, 2019–2023 (UNITS)
  • TABLE 40 RADIAL FLUX: MARKET, BY REGION, 2024–2030 (UNITS)
  • TABLE 41 AXIAL FLUX: MARKET, BY REGION, 2019–2023 (UNITS)
  • TABLE 42 AXIAL FLUX: MARKET, BY REGION, 2024–2030 (UNITS)
  • TABLE 43 MARKET, BY MOTOR TYPE, 2019–2023 (UNITS)
  • TABLE 44 MARKET, BY MOTOR TYPE, 2024–2030 (UNITS)
  • TABLE 45 PERMANENT MAGNET SYNCHRONOUS MOTOR: MARKET, BY REGION, 2019–2023 (UNITS)
  • TABLE 46 PERMANENT MAGNET SYNCHRONOUS MOTOR: MARKET, BY REGION, 2024–2030 (UNITS)
  • TABLE 47 AC INDUCTION MOTOR: MARKET, BY REGION, 2019–2023 (UNITS)
  • TABLE 48 AC INDUCTION MOTOR: MARKET, BY REGION, 2024–2030 (UNITS)
  • TABLE 49 DC TRACTION MOTOR: MARKET, BY REGION, 2019–2023 (UNITS)
  • TABLE 50 DC TRACTION MOTOR: MARKET, BY REGION, 2024–2030 (UNITS)
  • TABLE 51 DC SERIES MOTOR VS. DC BRUSHLESS MOTOR VS. SWITCHED RELUCTANCE MOTOR VS. ELECTRONICALLY EXCITED SYNCHRONOUS MOTOR
  • TABLE 52 BRUSHED AND BRUSHLESS MOTORS: ADVANTAGES AND DISADVANTAGES
  • TABLE 53 MARKET, BY POWER OUTPUT, 2019–2023 (UNITS)
  • TABLE 54 MARKET, BY POWER OUTPUT, 2024–2030 (UNITS)
  • TABLE 55 LESS THAN 100 KW: MARKET, BY REGION, 2019–2023 (UNITS)
  • TABLE 56 LESS THAN 100 KW: MARKET, BY REGION, 2024–2030 (UNITS)
  • TABLE 57 100–200 KW: MARKET, BY REGION, 2019–2023 (UNITS)
  • TABLE 58 100–200 KW: MARKET, BY REGION, 2024–2030 (UNITS)
  • TABLE 59 200–400 KW: MARKET, BY REGION, 2019–2023 (UNITS)
  • TABLE 60 200–400 KW: MARKET, BY REGION, 2024–2030 (UNITS)
  • TABLE 61 ABOVE 400 KW: MARKET, BY REGION, 2019–2023 (UNITS)
  • TABLE 62 ABOVE 400 KW: MARKET, BY REGION, 2024–2030 (UNITS)
  • TABLE 63 MARKET, BY TRANSMISSION, 2019–2023 (UNITS)
  • TABLE 64 MARKET, BY TRANSMISSION, 2024–2030 (UNITS)
  • TABLE 65 SINGLE-SPEED DRIVE: MARKET, BY REGION, 2019–2023 (UNITS)
  • TABLE 66 SINGLE-SPEED DRIVE: MARKET, BY REGION, 2024–2030 (UNITS)
  • TABLE 67 MULTI-SPEED DRIVE: MARKET, BY REGION, 2019–2023 (UNITS)
  • TABLE 68 MULTI-SPEED DRIVE: MARKET, BY REGION, 2024–2030 (UNITS)
  • TABLE 69 MARKET, BY VEHICLE TYPE, 2019–2023 (UNITS)
  • TABLE 70 MARKET, BY VEHICLE TYPE, 2024–2030 (UNITS)
  • TABLE 71 MARKET, BY VEHICLE TYPE, 2019–2023 (USD MILLION)
  • TABLE 72 MARKET, BY VEHICLE TYPE, 2024–2030 (USD MILLION)
  • TABLE 73 PICK-UP TRUCKS: MARKET, BY REGION, 2019–2023 (UNITS)
  • TABLE 74 PICK-UP TRUCKS: MARKET, BY REGION, 2024–2030 (UNITS)
  • TABLE 75 PICK-UP TRUCKS: MARKET, BY REGION, 2019–2023 (USD MILLION)
  • TABLE 76 PICK-UP TRUCKS: MARKET, BY REGION, 2024–2030 (USD MILLION)
  • TABLE 77 TRUCKS: MARKET, BY REGION, 2019–2023 (UNITS)
  • TABLE 78 TRUCKS: MARKET, BY REGION, 2024–2030 (UNITS)
  • TABLE 79 TRUCKS: MARKET, BY REGION, 2019–2023 (USD MILLION)
  • TABLE 80 TRUCKS: MARKET, BY REGION, 2024–2030 (USD MILLION)
  • TABLE 81 MEDIUM-DUTY TRUCKS: MARKET, BY REGION, 2019–2023 (UNITS)
  • TABLE 82 MEDIUM-DUTY TRUCKS: MARKET, BY REGION, 2024–2030 (UNITS)
  • TABLE 83 MEDIUM-DUTY TRUCKS: MARKET, BY REGION, 2019–2023 (USD MILLION)
  • TABLE 84 MEDIUM-DUTY TRUCKS: MARKET, BY REGION, 2024–2030 (USD MILLION)
  • TABLE 85 HEAVY-DUTY TRUCKS: MARKET, BY REGION, 2019–2023 (UNITS)
  • TABLE 86 HEAVY-DUTY TRUCKS: MARKET, BY REGION, 2024–2030 (UNITS)
  • TABLE 87 HEAVY-DUTY TRUCKS: MARKET, BY REGION, 2019–2023 (USD MILLION)
  • TABLE 88 HEAVY-DUTY TRUCKS: MARKET, BY REGION, 2024–2030 (USD MILLION)
  • TABLE 89 VANS: MARKET, BY REGION, 2019–2023 (UNITS)
  • TABLE 90 VANS: MARKET, BY REGION, 2024–2030 (UNITS)
  • TABLE 91 VANS: MARKET, BY REGION, 2019–2023 (USD MILLION)
  • TABLE 92 VANS: MARKET, BY REGION, 2024–2030 (USD MILLION)
  • TABLE 93 LIGHT VANS: MARKET, BY REGION, 2019–2023 (UNITS)
  • TABLE 94 LIGHT VANS: MARKET, BY REGION, 2024–2030 (UNITS)
  • TABLE 95 LIGHT VANS: MARKET, BY REGION, 2019–2023 (USD MILLION)
  • TABLE 96 LIGHT VANS: MARKET, BY REGION, 2024–2030 (USD MILLION)
  • TABLE 97 FULL-SIZE VANS: MARKET, BY REGION, 2019–2023 (UNITS)
  • TABLE 98 FULL-SIZE VANS: MARKET, BY REGION, 2024–2030 (UNITS)
  • TABLE 99 FULL-SIZE VANS: MARKET, BY REGION, 2019–2023 (USD MILLION)
  • TABLE 100 FULL-SIZE VANS: MARKET, BY REGION, 2024–2030 (USD MILLION)
  • TABLE 101 BUSES & COACHES: MARKET, BY REGION, 2019–2023 (UNITS)
  • TABLE 102 BUSES & COACHES: MARKET, BY REGION, 2024–2030 (UNITS)
  • TABLE 103 BUSES & COACHES: MARKET, BY REGION, 2019–2023 (USD MILLION)
  • TABLE 104 BUSES & COACHES: MARKET, BY REGION, 2024–2030 (USD MILLION)
  • TABLE 105 MARKET, BY REGION, 2019–2023 (UNITS)
  • TABLE 106 MARKET, BY REGION, 2024–2030 (UNITS)
  • TABLE 107 MARKET, BY REGION, 2019–2023 (USD MILLION)
  • TABLE 108 MARKET, BY REGION, 2024–2030 (USD MILLION)
  • TABLE 109 ASIA PACIFIC: MARKET, BY COUNTRY, 2019–2023 (UNITS)
  • TABLE 110 ASIA PACIFIC: MARKET, BY COUNTRY, 2024–2030 (UNITS)
  • TABLE 111 ASIA PACIFIC: MARKET, BY COUNTRY, 2019–2023 (USD MILLION)
  • TABLE 112 ASIA PACIFIC: MARKET, BY COUNTRY, 2024–2030 (USD MILLION)
  • TABLE 113 CHINA: MARKET, BY VEHICLE TYPE, 2019–2023 (UNITS)
  • TABLE 114 CHINA: MARKET, BY VEHICLE TYPE, 2024–2030 (UNITS)
  • TABLE 115 CHINA: MARKET, BY VEHICLE TYPE, 2019–2023 (USD MILLION)
  • TABLE 116 CHINA: MARKET, BY VEHICLE TYPE, 2024–2030 (USD MILLION)
  • TABLE 117 JAPAN: MARKET, BY VEHICLE TYPE, 2019–2023 (UNITS)
  • TABLE 118 JAPAN: MARKET, BY VEHICLE TYPE, 2024–2030 (UNITS)
  • TABLE 119 JAPAN: MARKET, BY VEHICLE TYPE, 2019–2023 (USD MILLION)
  • TABLE 120 JAPAN MARKET, BY VEHICLE TYPE, 2024–2030 (USD MILLION)
  • TABLE 121 INDIA: MARKET, BY VEHICLE TYPE, 2019–2023 (UNITS)
  • TABLE 122 INDIA: MARKET, BY VEHICLE TYPE, 2024–2030 (UNITS)
  • TABLE 123 INDIA: MARKET, BY VEHICLE TYPE, 2019–2023 (USD MILLION)
  • TABLE 124 INDIA: MARKET, BY VEHICLE TYPE, 2024–2030 (USD MILLION)
  • TABLE 125 SOUTH KOREA: MARKET, BY VEHICLE TYPE, 2019–2023 (UNITS)
  • TABLE 126 SOUTH KOREA: MARKET, BY VEHICLE TYPE, 2024–2030 (UNITS)
  • TABLE 127 SOUTH KOREA: MARKET, BY VEHICLE TYPE, 2019–2023 (USD MILLION)
  • TABLE 128 SOUTH KOREA: MARKET, BY VEHICLE TYPE, 2024–2030 (USD MILLION)
  • TABLE 129 NORTH AMERICA: MARKET, BY COUNTRY, 2019–2023 (UNITS)
  • TABLE 130 NORTH AMERICA: MARKET, BY COUNTRY, 2024–2030 (UNITS)
  • TABLE 131 NORTH AMERICA: MARKET, BY COUNTRY, 2019–2023 (USD MILLION)
  • TABLE 132 NORTH AMERICA: MARKET, BY COUNTRY, 2024–2030 (USD MILLION)
  • TABLE 133 US: MARKET, BY VEHICLE TYPE, 2019–2023 (UNITS)
  • TABLE 134 US: MARKET, BY VEHICLE TYPE, 2024–2030 (UNITS)
  • TABLE 135 US: MARKET, BY VEHICLE TYPE, 2019–2023 (USD MILLION)
  • TABLE 136 US: MARKET, BY VEHICLE TYPE, 2024–2030 (USD MILLION)
  • TABLE 137 CANADA: MARKET, BY VEHICLE TYPE, 2019–2023 (UNITS)
  • TABLE 138 CANADA: MARKET, BY VEHICLE TYPE, 2024–2030 (UNITS)
  • TABLE 139 CANADA: MARKET, BY VEHICLE TYPE, 2019–2023 (USD MILLION)
  • TABLE 140 CANADA: MARKET, BY VEHICLE TYPE, 2024–2030 (USD MILLION)
  • TABLE 141 EUROPE: MARKET, BY COUNTRY, 2019–2023 (UNITS)
  • TABLE 142 EUROPE: MARKET, BY COUNTRY, 2024–2030 (UNITS)
  • TABLE 143 EUROPE: MARKET, BY COUNTRY, 2019–2023 (USD MILLION)
  • TABLE 144 EUROPE: MARKET, BY COUNTRY, 2024–2030 (USD MILLION)
  • TABLE 145 FRANCE: MARKET, BY VEHICLE TYPE, 2019–2023 (UNITS)
  • TABLE 146 FRANCE: MARKET, BY VEHICLE TYPE, 2024–2030 (UNITS)
  • TABLE 147 FRANCE: MARKET, BY VEHICLE TYPE, 2019–2023 (USD MILLION)
  • TABLE 148 FRANCE: MARKET, BY VEHICLE TYPE, 2024–2030 (USD MILLION)
  • TABLE 149 GERMANY: MARKET, BY VEHICLE TYPE, 2019–2023 (UNITS)
  • TABLE 150 GERMANY: MARKET, BY VEHICLE TYPE, 2024–2030 (UNITS)
  • TABLE 151 GERMANY: MARKET, BY VEHICLE TYPE, 2019–2023 (USD MILLION)
  • TABLE 152 GERMANY: MARKET, BY VEHICLE TYPE, 2024–2030 (USD MILLION)
  • TABLE 153 SPAIN: MARKET, BY VEHICLE TYPE, 2019–2023 (UNITS)
  • TABLE 154 SPAIN: MARKET, BY VEHICLE TYPE, 2024–2030 (UNITS)
  • TABLE 155 SPAIN: MARKET, BY VEHICLE TYPE, 2019–2023 (USD MILLION)
  • TABLE 156 SPAIN: MARKET, BY VEHICLE TYPE, 2024–2030 (USD MILLION)
  • TABLE 157 AUSTRIA: MARKET, BY VEHICLE TYPE, 2019–2023 (UNITS)
  • TABLE 158 AUSTRIA: MARKET, BY VEHICLE TYPE, 2024–2030 (UNITS)
  • TABLE 159 AUSTRIA: MARKET, BY VEHICLE TYPE, 2019–2023 (USD MILLION)
  • TABLE 160 AUSTRIA: MARKET, BY VEHICLE TYPE, 2024–2030 (USD MILLION)
  • TABLE 161 NORWAY: MARKET, BY VEHICLE TYPE, 2019–2023 (UNITS)
  • TABLE 162 NORWAY: MARKET, BY VEHICLE TYPE, 2024–2030 (UNITS)
  • TABLE 163 NORWAY: MARKET, BY VEHICLE TYPE, 2019–2023 (USD MILLION)
  • TABLE 164 NORWAY: MARKET, BY VEHICLE TYPE, 2024–2030 (USD MILLION)
  • TABLE 165 SWEDEN: MARKET, BY VEHICLE TYPE, 2019–2023 (UNITS)
  • TABLE 166 SWEDEN: MARKET, BY VEHICLE TYPE, 2024–2030 (UNITS)
  • TABLE 167 SWEDEN: MARKET, BY VEHICLE TYPE, 2019–2023 (USD MILLION)
  • TABLE 168 SWEDEN: MARKET, BY VEHICLE TYPE, 2024–2030 (USD MILLION)
  • TABLE 169 NETHERLANDS: MARKET, BY VEHICLE TYPE, 2019–2023 (UNITS)
  • TABLE 170 NETHERLANDS: MARKET, BY VEHICLE TYPE, 2024–2030 (UNITS)
  • TABLE 171 NETHERLANDS: MARKET, BY VEHICLE TYPE, 2019–2023 (USD MILLION)
  • TABLE 172 NETHERLANDS: MARKET, BY VEHICLE TYPE, 2024–2030 (USD MILLION)
  • TABLE 173 UK: MARKET, BY VEHICLE TYPE, 2019–2023 (UNITS)
  • TABLE 174 UK: MARKET, BY VEHICLE TYPE, 2024–2030 (UNITS)
  • TABLE 175 UK: MARKET, BY VEHICLE TYPE, 2019–2023 (USD MILLION)
  • TABLE 176 UK: MARKET, BY VEHICLE TYPE, 2024–2030 (USD MILLION)
  • TABLE 177 ITALY: MARKET, BY VEHICLE TYPE, 2019–2023 (UNITS)
  • TABLE 178 ITALY: MARKET, BY VEHICLE TYPE, 2024–2030 (UNITS)
  • TABLE 179 ITALY: MARKET, BY VEHICLE TYPE, 2019–2023 (USD MILLION)
  • TABLE 180 ITALY: MARKET, BY VEHICLE TYPE, 2024–2030 (USD MILLION)
  • TABLE 181 REST OF EUROPE: MARKET, BY VEHICLE TYPE, 2019–2023 (UNITS)
  • TABLE 182 REST OF EUROPE: MARKET, BY VEHICLE TYPE, 2024–2030 (UNITS)
  • TABLE 183 REST OF EUROPE: MARKET, BY VEHICLE TYPE, 2019–2023 (USD MILLION)
  • TABLE 184 REST OF EUROPE: MARKET, BY VEHICLE TYPE, 2024–2030 (USD MILLION)
  • TABLE 185 MARKET: REGION FOOTPRINT
  • TABLE 186 MARKET: VEHICLE TYPE FOOTPRINT
  • TABLE 187 LIST OF KEY STARTUPS/SMES
  • TABLE 188 COMPETITIVE BENCHMARKING OF KEY STARTUPS/SMES
  • TABLE 189 MARKET: PRODUCT LAUNCHES, SEPTEMBER 2021–JANUARY 2024
  • TABLE 190 MARKET: DEALS, MARCH 2021–JANUARY 2024
  • TABLE 191 MARKET: EXPANSIONS, APRIL 2022–SEPTEMBER 2023
  • TABLE 192 ELECTRIC MOTOR COMPARISON
  • TABLE 193 DANA LIMITED: COMPANY OVERVIEW
  • TABLE 194 DANA LIMITED: PRODUCTS/SOLUTIONS/SERVICES OFFERED
  • TABLE 195 DANA LIMITED: PRODUCT LAUNCHES/DEVELOPMENTS
  • TABLE 196 DANA LIMITED: DEALS
  • TABLE 197 ZF FRIEDRICHSHAFEN AG: COMPANY OVERVIEW
  • TABLE 198 ZF FRIEDRICHSHAFEN AG: PRODUCTS/SOLUTIONS/SERVICES OFFERED
  • TABLE 199 ZF FRIEDRICHSHAFEN AG: PRODUCT LAUNCHES/DEVELOPMENTS
  • TABLE 200 ZF FRIEDRICHSHAFEN AG: DEALS
  • TABLE 201 ZF FRIEDRICHSHAFEN AG: OTHER DEVELOPMENTS
  • TABLE 202 ROBERT BOSCH GMBH: COMPANY OVERVIEW
  • TABLE 203 ROBERT BOSCH GMBH: PRODUCTS/SOLUTIONS/SERVICES OFFERED
  • TABLE 204 ROBERT BOSCH GMBH: PRODUCT LAUNCHES
  • TABLE 205 ROBERT BOSCH GMBH: DEALS
  • TABLE 206 MAGNA INTERNATIONAL INC.: COMPANY OVERVIEW
  • TABLE 207 MAGNA INTERNATIONAL INC.: PRODUCTS/SOLUTIONS/SERVICES OFFERED
  • TABLE 208 MAGNA INTERNATIONAL INC.: PRODUCT LAUNCHES/DEVELOPMENTS
  • TABLE 209 MAGNA INTERNATIONAL INC.: EXPANSIONS
  • TABLE 210 BORGWARNER INC.: COMPANY OVERVIEW
  • TABLE 211 BORGWARNER INC.: PRODUCTS/SOLUTIONS/SERVICES OFFERED
  • TABLE 212 BORGWARNER INC.: PRODUCT DEVELOPMENTS
  • TABLE 213 BORGWARNER INC.: DEALS
  • TABLE 214 BORGWARNER INC.: OTHER DEVELOPMENTS
  • TABLE 215 AMERICAN AXLE & MANUFACTURING, INC.: COMPANY OVERVIEW
  • TABLE 216 AMERICAN AXLE & MANUFACTURING, INC.: PRODUCTS/SOLUTIONS/SERVICES OFFERED
  • TABLE 217 AMERICAN AXLE & MANUFACTURING, INC.: PRODUCT LAUNCHES
  • TABLE 218 AMERICAN AXLE & MANUFACTURING, INC.: DEALS
  • TABLE 219 AMERICAN AXLE & MANUFACTURING, INC.: OTHER DEVELOPMENTS
  • TABLE 220 ALLISON TRANSMISSION, INC.: COMPANY OVERVIEW
  • TABLE 221 ALLISON TRANSMISSION, INC: PRODUCTS/SOLUTIONS/SERVICES OFFERED
  • TABLE 222 ALLISON TRANSMISSION, INC: PRODUCT LAUNCHES
  • TABLE 223 ALLISON TRANSMISSION, INC: DEALS
  • TABLE 224 ALLISON TRANSMISSION, INC: OTHER DEVELOPMENTS
  • TABLE 225 BYD: COMPANY OVERVIEW
  • TABLE 226 BYD: PRODUCTS/SOLUTIONS/SERVICES OFFERED
  • TABLE 227 BYD: PRODUCT LAUNCHES
  • TABLE 228 BYD: DEALS
  • TABLE 229 SCHAEFFLER AG: COMPANY OVERVIEW
  • TABLE 230 SCHAEFFLER AG: PRODUCTS/SOLUTIONS/SERVICES OFFERED
  • TABLE 231 SCHAEFFLER AG: PRODUCT DEVELOPMENTS/LAUNCHES
  • TABLE 232 SCHAEFFLER AG: DEALS
  • TABLE 233 SCHAEFFLER AG: EXPANSIONS
  • TABLE 234 MAHLE GMBH: COMPANY OVERVIEW
  • TABLE 235 MAHLE GMBH: PRODUCTS/SOLUTIONS/SERVICES OFFERED
  • TABLE 236 MAHLE GMBH: PRODUCT DEVELOPMENTS
  • TABLE 237 MAHLE GMBH: DEALS
  • TABLE 238 MAHLE GMBH: OTHER DEVELOPMENTS
  • TABLE 239 SHENZHEN INOVANCE TECHNOLOGY: COMPANY OVERVIEW
  • TABLE 240 SHENZHEN INOVANCE TECHNOLOGY: PRODUCTS/SOLUTIONS/SERVICES OFFERED
  • TABLE 241 SHENZHEN INOVANCE TECHNOLOGY: DEALS
  • TABLE 242 CUMMINS INC.: COMPANY OVERVIEW
  • TABLE 243 SKODA TRANSPORTATION A.S.: COMPANY OVERVIEW
  • TABLE 244 KIRLOSKAR ELECTRIC COMPANY LIMITED: COMPANY OVERVIEW
  • TABLE 245 TRAKTIONSSYSTEME AUSTRIA (TSA) GMBH: COMPANY OVERVIEW
  • TABLE 246 DELTA ELECTRONICS, INC.: COMPANY OVERVIEW
  • TABLE 247 MITSUBISHI ELECTRIC CORPORATION: COMPANY OVERVIEW
  • TABLE 248 HITACHI, LTD.: COMPANY OVERVIEW
  • TABLE 249 VEM GROUP: COMPANY OVERVIEW
  • TABLE 250 WEG: COMPANY OVERVIEW
  • TABLE 251 ZHEJIANG FOUNDER MOTOR CO., LTD.: COMPANY OVERVIEW
LIST OF FIGURES
 
  • FIGURE 1 MARKET SEGMENTATION
  • FIGURE 2 RESEARCH DESIGN
  • FIGURE 3 REPORT WRITING METHOD
  • FIGURE 4 BREAKDOWN OF PRIMARY INTERVIEWS
  • FIGURE 5 BOTTOM-UP APPROACH
  • FIGURE 6 TOP-DOWN APPROACH
  • FIGURE 7 RESEARCH APPROACH
  • FIGURE 8 MARKET ESTIMATION NOTES
  • FIGURE 9 DATA TRIANGULATION
  • FIGURE 10 REPORT SUMMARY
  • FIGURE 11 MARKET, BY REGION, 2024 VS. 2030 (USD MILLION)
  • FIGURE 12 MARKET, BY VEHICLE TYPE, 2024 VS. 2030 (UNITS)
  • FIGURE 13 KEY PLAYERS IN MARKET
  • FIGURE 14 RAPID DEVELOPMENT IN ELECTRIC COMMERCIAL VEHICLES TO DRIVE MARKET
  • FIGURE 15 LIGHT VAN SEGMENT TO HOLD LARGEST MARKET SHARE DURING FORECAST PERIOD
  • FIGURE 16 INTEGRATED AXLE SEGMENT TO DOMINATE MARKET DURING FORECAST PERIOD
  • FIGURE 17 AXIAL FLUX TO HAVE LARGER MARKET SHARE DURING FORECAST PERIOD
  • FIGURE 18 PERMANENT MAGNET SYNCHRONOUS MOTOR SEGMENT TO LEAD MARKET DURING FORECAST PERIOD
  • FIGURE 19 MULTI-SPEED DRIVE SEGMENT TO REGISTER HIGHER CAGR DURING FORECAST PERIOD
  • FIGURE 20 LESS THAN 100 KW SEGMENT TO HOLD LARGEST MARKET SHARE DURING FORECAST PERIOD
  • FIGURE 21 ASIA PACIFIC TO ACCOUNT FOR DOMINANT MARKET SHARE IN 2024
  • FIGURE 22 MARKET: DRIVERS, RESTRAINTS, OPPORTUNITIES, AND CHALLENGES
  • FIGURE 23 GLOBAL ELECTRIC COMMERCIAL VEHICLE SALES
  • FIGURE 24 MATERIALS USED IN TRACTION MOTORS
  • FIGURE 25 AVERAGE SELLING PRICE TREND, BY VEHICLE TYPE, 2024
  • FIGURE 26 AVERAGE SELLING PRICE TREND, BY REGION, 2021−2030 (USD PER UNIT)
  • FIGURE 27 BILL OF MATERIALS FOR ELECTRIC COMMERCIAL VEHICLE TRACTION MOTORS
  • FIGURE 28 SUPPLY CHAIN ANALYSIS
  • FIGURE 29 MARKET ECOSYSTEM
  • FIGURE 30 INVESTMENT SCENARIO, 2021−2024
  • FIGURE 31 PATENT REGISTRATION TRENDS, 2012–2024
  • FIGURE 32 LEGAL STATUS OF PATENTS, 2012–2024
  • FIGURE 33 TOP PATENT APPLICANTS, 2012–2024
  • FIGURE 34 KEY BUYING CRITERIA FOR TOP 3 VEHICLE TYPES
  • FIGURE 35 REVENUE SHIFT AND NEW REVENUE POCKETS FOR PLAYERS IN MARKET
  • FIGURE 36 MARKET, BY AXLE ARCHITECTURE, 2024 VS. 2030 (UNITS)
  • FIGURE 37 MARKET, BY DESIGN, 2024 VS. 2030 (UNITS)
  • FIGURE 38 MARKET, BY MOTOR TYPE, 2024 VS. 2030 (UNITS)
  • FIGURE 39 MARKET, BY POWER OUTPUT, 2024 VS. 2030 (UNITS)
  • FIGURE 40 MARKET, BY TRANSMISSION, 2024 VS. 2030 (UNITS)
  • FIGURE 41 MARKET, BY VEHICLE TYPE, 2024 VS. 2030 (USD MILLION)
  • FIGURE 42 MARKET, BY REGION, 2024 VS. 2030 (USD MILLION)
  • FIGURE 43 ASIA PACIFIC: MARKET SNAPSHOT
  • FIGURE 44 NORTH AMERICA: MARKET SNAPSHOT
  • FIGURE 45 EUROPE: MARKET, BY COUNTRY, 2024 VS. 2030 (USD MILLION)
  • FIGURE 46 RANKING OF KEY MARKET PLAYERS
  • FIGURE 47 REVENUE ANALYSIS OF KEY PLAYERS, 2018–2022
  • FIGURE 48 MARKET: COMPANY EVALUATION MATRIX, 2023
  • FIGURE 49 MARKET: COMPANY FOOTPRINT
  • FIGURE 50 MARKET: STARTUP/SME EVALUATION MATRIX, 2023
  • FIGURE 51 COMPANY VALUATION, 2023 (USD BILLION)
  • FIGURE 52 FINANCIAL METRICS OF KEY PLAYERS, 2024
  • FIGURE 53 DANA LIMITED: COMPANY SNAPSHOT
  • FIGURE 54 ZR FRIEDRICHSHAFEN AG: COMPANY SNAPSHOT
  • FIGURE 55 ROBERT BOSCH GMBH: COMPANY SNAPSHOT
  • FIGURE 56 MAGNA INTERNATIONAL INC.: COMPANY SNAPSHOT
  • FIGURE 57 BORGWARNER INC.: COMPANY SNAPSHOT
  • FIGURE 58 AMERICAN AXLE & MANUFACTURING, INC.: COMPANY SNAPSHOT
  • FIGURE 59 ALLISON TRANSMISSION, INC.: COMPANY SNAPSHOT
  • FIGURE 60 BYD: COMPANY SNAPSHOT
  • FIGURE 61 SCHAEFFLER AG: COMPANY SNAPSHOT
  • FIGURE 62 MAHLE GMBH: COMPANY SNAPSHOT
  • FIGURE 63 SHENZHEN INOVANCE TECHNOLOGY: COMPANY SNAPSHOT


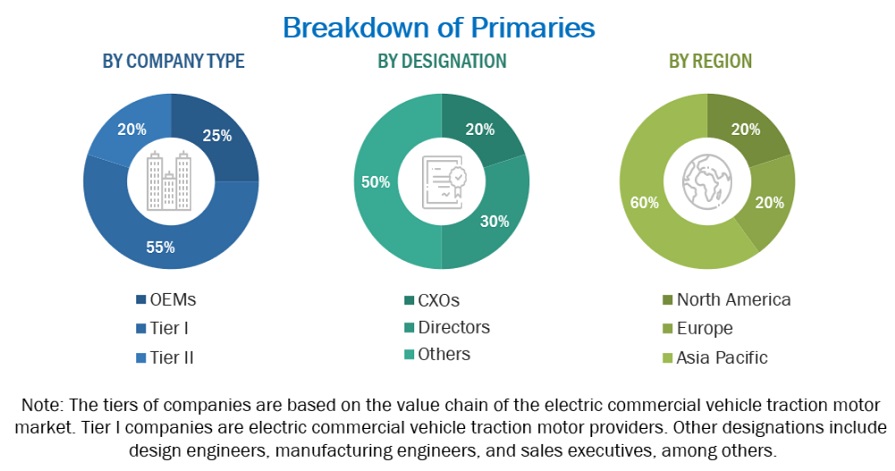
This research study involved the extensive use of secondary sources, such as company annual reports/presentations, industry association publications, automotive magazine articles, directories, technical handbooks, the World Economic Outlook, trade websites, technical articles, and databases, to identify and collect information on the Electric Commercial Vehicle Traction Motor market. In-depth interviews were conducted with various primary respondents, including key industry participants, subject-matter experts (SMEs), C-level executives of key market players (ECV traction motor manufacturers and suppliers), and industry consultants, among other experts, to obtain and verify critical qualitative and quantitative information and assess market prospects.

Secondary Research

In the secondary research process, various secondary sources have been used to identify and collect information on the electric commercial vehicle traction motor market for this study. Secondary sources include annual reports, press releases, and investor presentations of companies; whitepapers, certified publications, and articles from recognized authors; directories; databases; and articles from recognized associations and government publishing sources.

Primary Research

Extensive primary research has been conducted after understanding the electric commercial vehicle traction motor market scenario through secondary research. Several primary interviews have been conducted with market experts from both the demand (OEMs) and supply (electric commercial vehicle traction motor manufacturers and component manufacturers) sides across major regions, namely, North America, Europe, and Asia Pacific. Approximately 30% and 70% of primary interviews have been conducted from the demand and supply sides, respectively. Primary data has been collected through questionnaires, emails, and telephonic interviews.

In the canvassing of primaries, various departments within organizations, such as sales, operations, and marketing, have been covered to provide a holistic viewpoint in the report. After interacting with industry experts, brief sessions have been conducted with highly experienced independent consultants to reinforce the findings from primaries. This, along with the opinions of in-house subject matter experts, have led to the findings, as described in the remainder of this report.
Electric Commercial Vehicle Traction MotorMarket  Market Size, and Share

To know about the assumptions considered for the study, download the pdf brochure

Market Size Estimation

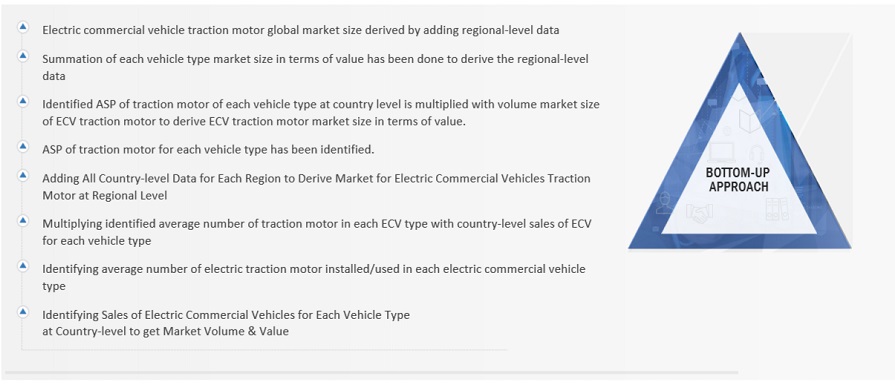
A detailed market estimation approach has been followed to estimate and validate the value and volume of the electric commercial vehicle traction motor market and other dependent submarkets, as mentioned below:

  • The market size has been derived by collecting sales of electric commercial vehicles (Pickup trucks, medium-duty and heavy-duty trucks, light and full-size vans, and buses & coaches ) through association and paid databases.
  • The average number of traction motors per electric commercial vehicle type has been considered to gain the market size by value and volume in the market
  • Key players in the market have been identified through secondary research, and their global market share has been determined through primary and secondary research.
  • The research methodology includes the study of annual and quarterly financial reports, regulatory filings of major market players, and interviews with industry experts to gain detailed market insights.
  • All major penetration rates, percentage shares, splits, and breakdowns for the electric commercial vehicles traction motor market have been determined through secondary sources and verified through primary sources.
  • All key macro indicators affecting the revenue growth of the market segments and subsegments have been accounted for, viewed in extensive detail, verified through primary research, and analyzed to get the validated and verified quantitative & qualitative data.

The gathered market data has been consolidated and added with detailed inputs, analyzed, and presented in this report.
Electric Commercial Vehicle Traction MotorMarket  Market Bottom Up Approach

To know about the assumptions considered for the study, Request for Free Sample Report

Electric Commercial Vehicle Traction MotorMarket  Market Top Down Approach

Data Triangulation

All percentage shares, splits, and breakdowns have been determined using secondary sources and verified by primary sources. All parameters that affect the markets covered in this research study have been accounted for, viewed in extensive detail, and analyzed to obtain the final quantitative and qualitative data. This data has been consolidated, enhanced with detailed inputs and analysis from MarketsandMarkets, and presented in the report. The following figure is an illustrative representation of the overall market size estimation process employed for this study.

Market Definition

A traction motor is a type of electric motor that is specifically designed for providing propulsion in vehicles such as electric vehicles (EVs). It delivers torque to drive the wheels or axles of the vehicle, providing the necessary traction to power the vehicle's movement. A traction motor is typically designed to operate at high efficiency and with high power density, making it an important component in the powertrain of modern vehicles. ECV traction motor are specifically designed for commercial vehicles such as buses, trucks, vans, and pickup trucks.

List of Key Stakeholders

  • Associations, Forums, and Alliances related to Electric Trucks
  • Automobile Manufacturers
  • Automotive Component Manufacturers
  • Automotive Investors
  • Battery Distributors
  • Battery Manufacturers
  • Companies Operating in Autonomous Vehicle Ecosystem
  • Distributors and Retailers
  • Electric Bus Manufacturers
  • Electric Commercial Vehicle Traction Motor Manufacturers, Dealers and Suppliers
  • Electric Pickup Truck Manufacturers
  • Electric Traction Motor Manufacturers
  • Electric Van Manufacturers
  • End Users
  • Environmental and Industrial Associations
  • EV Component Manufacturers
  • EV Infrastructure Component Manufacturers
  • EV Infrastructure Developers
  • EV Manufacturers, Distributors, and Retailers
  • Electric Medium and Heavy-duty Truck Manufacturers
  • EV Component Manufacturers
  • EV Distributors and Retailers
  • Government Agencies and Policy Makers
  • Manufacturers of Electric Vehicles (EVs)
  • Motor Manufacturing Companies
  • Original Equipment Manufacturers
  • Raw Material Suppliers for traction motor or Components
  • State and National Regulatory Authorities
  • Traders and Distributors of Electric Vehicles
  • Transport Authorities

Report Objectives

  • To segment and forecast the size of the electric commercial vehicle traction motor market in terms of volume (units) and value (USD million) from 2019 to 2030
    • To define, describe, and forecast the market based on vehicle type, motor type, power output, design, transmission, axle architecture and region
    • To segment and forecast the market size by volume and value at the regional level based on vehicle type (pickup trucks, trucks (medium-duty trucks and heavy-duty trucks), vans (light vans and full-size vans), and buses & coaches
    • To segment and forecast the market size by volume based on motor type (permanent magnet synchronous motor, AC induction motor, and DC traction motor)
    • To segment and forecast the market size by volume based on power output (less than 100 kW, 100 – 200 kW, 200 – 400 kW and above 400 kW)
    • To segment and forecast the market size by volume based on design (radial flux and axial flux)
    • To segment and forecast the market size by volume based on transmission (single speed drive and multi-speed drive)
    • To segment and forecast the market size by volume based on axle architecture (integrated axle and central drive unit)
    • To forecast the market size with respect to key regions, namely, Asia Pacific, Europe, and North America
  • To provide detailed information regarding the major factors influencing the market growth (drivers, challenges, restraints, and opportunities)
  • To strategically analyze markets with respect to individual growth trends, prospects, and contributions to the total market
  • To strategically profile key players and comprehensively analyze their market share and core competencies
  • To analyze opportunities for stakeholders and the competitive landscape for market leaders
  • To track and analyze competitive developments such as product launches, deals, and others undertaken by the key industry participants
  • To study the following with respect to the market:
    • Supply Chain Analysis
    • Ecosystem Analysis
    • Technology Analysis
    • HS Code
    • Case Study Analysis
    • Patent Analysis
    • Regulatory Landscape
    • Conferences and Events
    • Average Selling Price Analysis
    • Buying Criteria
  • To analyze opportunities for stakeholders and the competitive landscape for market leaders
  • To track and analyze competitive developments such as product developments, deals, and others undertaken by the key industry participants

Available Customizations

With the given market data, MarketsandMarkets offers customizations in accordance with the company’s specific needs.

  • Electric commercial vehicle traction motor market, by motor type, at country level (for countries covered in the scope of the report)
  • Profiling of additional market players (up to 5)

Previous Versions of this Report

"Our USP is "providing game-changing business opportunities reports with free customization" - so please feel free to provide us with your specific areas of interest / business challenges in much greater detail !!"

We appreciate your interest in this report. Once you fill out the form, you'll be immediately directed to an exclusive solution tailored to your needs. This high-value offering can help boost your revenue by 30% - a must-see opportunity for anyone looking to maximize growth.


By clicking the "Submit" button, you are agreeing to the Terms of Use and Privacy Policy.

Custom Market Research Services

We Will Customise The Research For You, In Case The Report Listed Above Does Not Meet With Your Requirements

Get 10% Free Customisation

Growth opportunities and latent adjacency in Electric Commercial Vehicle Traction Motor Market

DMCA.com Protection Status