Education Smart Display Market

Education Smart Display Market by Product Type (Whiteboard, Video Wall), Display Size (Above 55", Up to 55"), Display Technology (LCD, Direct-view LED, OLED), Resolution (4K & Above, FHD, Less than HD & HD) and Region - Global Forecast to 2029

Report Code: SE 8916 Jan, 2024, by marketsandmarkets.com

[213 Pages Report] The education smart display market is projected to reach USD 4.1 billion by 2029 from USD 3.4 billion in 2024 at a CAGR of 4.0% during the forecast period. Digital transformation in learning, rising demand for collaborative learning, and technological advancements, emphasis on interactive learning experiences, integration of IoT and AI in educational tools are some of the major factors driving the market growth globally.

Education Smart Display Market

Education Smart Display Market

Education Smart Display Market Forecast to 2029

To know about the assumptions considered for the study, Request for Free Sample Report

Education Smart Display   Market Dynamics

Driver: Digital transformation in learning

The education sector's digital transformation is a key driver for the adoption of smart displays. Institutions are increasingly leveraging these displays to revolutionize learning. For example, smart displays facilitate interactive lessons with virtual tours for a more engaging history class. They also promote collaborative activities, dynamic content delivery, and real-time assessments, transforming traditional classrooms into tech-enhanced, interactive spaces. This shift aligns with the goal of preparing students for a digitally advanced future through personalized and immersive learning experiences.

Moreover, smart displays empower collaborative learning, allowing students to work together on projects, presentations, and group activities. In language classes, for instance, students can engage in interactive language learning exercises using touch-enabled displays. Real-time assessments and quizzes conducted through these displays further contribute to a more responsive and adaptive learning environment.

Restraint: Integration Challenges

The implementation of smart displays in educational settings introduces integration challenges that can potentially slow down the adoption rate. One significant hurdle is the need for seamless integration with existing educational technology infrastructure. Educational institutions often have diverse technology ecosystems comprising learning management systems, interactive tools, and other devices. Ensuring that smart displays seamlessly integrate with these existing systems is crucial to their effective functionality within the educational environment.

Compatibility issues may arise when attempting to integrate smart displays with older or disparate technology solutions. For example, if a school has invested in specific software applications for lesson planning or collaboration, the smart displays need to seamlessly interface with these applications to deliver a cohesive and streamlined user experience. Additionally, issues related to interoperability with various operating systems, file formats, and connectivity protocols may emerge, necessitating careful consideration during the implementation phase.

Opportunity: Rising e-learning trends

The growing prominence of e-learning and the broader shift toward remote education offer significant opportunities for the education smart displays market. Institutions are increasingly recognizing the need to enhance virtual learning experiences, and this recognition has led to a surge in investments in advanced display solutions.

One key driver of this trend is the demand for more engaging and interactive virtual classrooms. Smart displays play a crucial role in facilitating dynamic and collaborative online learning environments. The interactive features of these displays enable educators to conduct virtual classes with a level of engagement that goes beyond traditional video conferencing. For example, interactive whiteboards allow teachers to conduct real-time annotations, collaborative brainstorming sessions, and interactive quizzes, enhancing student participation and understanding in virtual settings.

Challenge: Security Concern

In the context of security concerns in the education smart displays market, the integration of these displays into educational networks raises multifaceted challenges. As educational institutions increasingly rely on interconnected technologies, protecting sensitive student data becomes a top priority. The diverse range of data generated and processed by smart displays, including student interactions, assignments, and potentially sensitive information, necessitates stringent cybersecurity measures.

Institutions must implement robust authentication protocols and encryption methods to prevent unauthorized access to smart display systems. Moreover, safeguarding the privacy of students and educators requires comprehensive data protection strategies. This involves adherence to strict data governance policies, compliance with relevant privacy regulations, and regular security audits to identify and address vulnerabilities.

Education Smart Display Market Ecosystem

The major players in the education smart display market with a significant global presence include SAMSUNG (South Korea), LG Electronics (South korea), Newline Interactive (US), PPDS (Philips) (Netherlands), and Sharp NEC Display Solutions (US). These companies not only boast a comprehensive product portfolio but also have a strong geographic footprint.

Education Smart Display Market by Ecosystem

LCD technology to account for the largest share of the Education smart display market during the forecast period.

The LCD technology dominates the education smart displays market due to its established presence, cost-effectiveness, and versatility. Widely adopted for its reliability and affordability, LCD displays are available in various sizes, accommodating diverse classroom configurations. The mature manufacturing processes contribute to lower production costs, making the LCD technology accessible to educational institutions with budget constraints. The widespread use of LCDs in interactive flat panels and traditional displays strengthens its position as the preferred choice for educational smart displays.

Above 55” display size to register the largest share during the forecast period.

The growth of the above 55" education smart displays segment is propelled by several key factors. Firstly, the increasing emphasis on interactive and immersive learning experiences has driven the demand for larger displays in educational settings such as classrooms and lecture halls. The sizes, ranging from 65" to 86" and beyond, address the specific requirements of larger spaces, ensuring improved visibility for more extensive audiences. These displays feature higher resolutions, providing clearer and more detailed content, which is crucial for educational materials, presentations, and collaborative activities. The incorporation of advanced interactive functionalities and collaborative tools enhances engagement and participation, catering to the diverse needs of modern teaching methods.

Asia Pacific is expected to register the highest growth during the forecast period.

Asia Pacific is expected to register the highest growth in the education smart display market during the forecast period. China, South Korea, Japan, India, and Rest of Asia Pacific are covered under the Asia Pacific education smart display market analysis. The high growth can be attributed to the increased investments by the governments in the education sector and the presence of some of the key manufacturers, such as SAMSUNG, LG Electronics, Sharp Corporation, and Panasonic, in the Asia Pacific region.

Education Smart Display Market
 by Region

Education Smart Display Market by Region

To know about the assumptions considered for the study, download the pdf brochure

Key Market Players

The major players in the education smart display companies include SAMSUNG (South Korea), LG Electronics (South korea), Newline Interactive (US), PPDS (Philips) (Netherlands), and Sharp NEC Display Solutions (US). These companies have used both organic and inorganic growth strategies such as product launches, acquisitions, and partnerships to strengthen their position in the market.

Get online access to the report on the World's First Market Intelligence Cloud

  • Easy to Download Historical Data & Forecast Numbers
  • Company Analysis Dashboard for high growth potential opportunities
  • Research Analyst Access for customization & queries
  • Competitor Analysis with Interactive dashboard
  • Latest News, Updates & Trend analysis
Request Sample

Scope of the Report

Report Metric

Details

Market size available for years

2019–2029

Base year considered

2023

Forecast period

2024–2029

Forecast units

Value (USD Million)

Segments Covered

By Product Type, By Display Technology, And By Display Size

Geographies covered

North America, Europe, Asia Pacific, and the Rest of the World

Companies covered

The major players in the education smart display market with a significant global presence include SAMSUNG (South Korea), LG Electronics (South Korea), Newline Interactive (US), PPDS (Philips) (Netherlands),  Sharp NEC Display Solutions (US), Sony Group Corporation (Japan), Leyard (China), Panasonic Holdings Corporation (Japan), Barco (Belgium), Smart Technologies ULC (Canada).

Education Smart Display Market Highlights

The study segments the education smart market based on product type, display technology, display size, and region.

Segment

Subsegment

By Product Type

  • Whiteboards
  • Video Walls

By Display Technology

  • LCDs
  • Direct-view LEDs
  • OLEDs
  • Other Display Technologies

By Display Size

  • Up to 55”
  • Above 55”

By Region

  • North America
  • Europe
  • Asia Pacific
  • Rest of the World

Recent Developments

  • In January 2024, Sharp introduces the PN-LA series, the latest advancement in the AQUOS BOARD interactive display line. Combining a sleek design with high-performance touch capabilities, these displays prioritize IT security while offering flexibility. Packed with integrated software like Windows 11 Pro, SHARP Pen Software, and Sharp Touch Viewer, the PN-LA series ensures a versatile collaboration experience.
  • In November 2023, SMART Technologies unveiled the highly anticipated SMART Board RX series interactive display, introducing a revolutionary solution to enhance interactive learning in classrooms. With user-programmable tools and a strong focus on accessibility, this innovative display is designed to empower both, teachers and students.
  • In July 2023, Newline Interactive introduced the DV Series, a large-format Direct View LED display available in sizes 120”, 150”, and 180”. With a sleek bezel-less design and lightweight structure, this all-in-one display integrates power supplies, speakers, and control systems, streamlining installation and reducing maintenance.  The DV Series guarantees unparalleled visual performance, making it a standout choice for impactful displays in diverse settings.
  • In March 2023, SAMSUNG unveiled WAC series, an upgraded interactive display and powerful software solution at Bett 2023, the world's largest education technology exhibition in London. The new Samsung Interactive Display, showcased to over 30,000 attendees, highlights the future of education technology. Recognizing the pivotal role of technology in classrooms, SAMSUNG aims to address the evolving needs of educators by offering customizable, feature-rich, and interconnected classroom technology.
  • In January 2023, LG launched an initiative to reshape the landscape of education technology with the introduction of the LG CreateBoard (model TR3DK). Unveiled at the 2023 Future of Education Technology Conference (FETC) in New Orleans, this purpose-built solution reflects LG Business Solutions' dedication to addressing the diverse needs of in-person, remote, and blended learning environments.

Frequently Asked Questions(FAQs):

To speak to our analyst for a discussion on the above findings, click Speak to Analyst

TABLE OF CONTENTS
 
1 INTRODUCTION (Page No. - 31)
    1.1 STUDY OBJECTIVES 
    1.2 MARKET DEFINITION 
           1.2.1 INCLUSIONS AND EXCLUSIONS AT COMPANY LEVEL
           1.2.2 INCLUSIONS AND EXCLUSIONS AT PRODUCT TYPE LEVEL
           1.2.3 INCLUSIONS AND EXCLUSIONS AT DISPLAY TECHNOLOGY LEVEL
           1.2.4 INCLUSIONS AND EXCLUSIONS AT DISPLAY SIZE LEVEL
           1.2.5 INCLUSIONS AND EXCLUSIONS AT REGIONAL LEVEL
    1.3 STUDY SCOPE 
           FIGURE 1 EDUCATION SMART DISPLAY MARKET SEGMENTATION
           1.3.1 REGIONAL SCOPE
           1.3.2 YEARS CONSIDERED
    1.4 CURRENCY CONSIDERED 
    1.5 UNITS CONSIDERED 
    1.6 LIMITATIONS 
    1.7 STAKEHOLDERS 
    1.8 IMPACT OF RECESSION 
 
2 RESEARCH METHODOLOGY (Page No. - 36)
    2.1 RESEARCH APPROACH 
           FIGURE 2 RESEARCH DESIGN
           2.1.1 SECONDARY DATA
                    2.1.1.1 Major secondary sources
                    2.1.1.2 Key data from secondary sources
           2.1.2 PRIMARY DATA
                    2.1.2.1 Primary interviews with experts
                    2.1.2.2 List of key primary interview participants
                    2.1.2.3 Breakdown of primaries
                    2.1.2.4 Key data from primary sources
           2.1.3 SECONDARY AND PRIMARY RESEARCH
                    2.1.3.1 Key industry insights
    2.2 MARKET SIZE ESTIMATION 
           2.2.1 BOTTOM-UP APPROACH
                    2.2.1.1 Approach to capture market using bottom-up analysis
                               FIGURE 3 BOTTOM-UP APPROACH
           2.2.2 TOP-DOWN APPROACH
                    2.2.2.1 Approach to capturing market using top-down analysis
                               FIGURE 4 TOP-DOWN APPROACH
    2.3 FACTOR ANALYSIS 
           2.3.1 DEMAND-SIDE ANALYSIS
                    FIGURE 5 MARKET SIZE ESTIMATION: DEMAND-SIDE ANALYSIS
           2.3.2 SUPPLY-SIDE ANALYSIS
                    FIGURE 6 MARKET SIZE ESTIMATION: SUPPLY-SIDE ANALYSIS
           2.3.3 GROWTH FORECAST ASSUMPTIONS
                    TABLE 1 MARKET GROWTH ASSUMPTIONS
    2.4 IMPACT OF RECESSION 
    2.5 MARKET BREAKDOWN AND DATA TRIANGULATION 
           FIGURE 7 DATA TRIANGULATION
    2.6 RESEARCH ASSUMPTIONS 
    2.7 RISK ASSESSMENT 
           TABLE 2 RISK ASSESSMENT
 
3 EXECUTIVE SUMMARY (Page No. - 48)
    FIGURE 8 EDUCATION SMART DISPLAY MARKET GLOBAL SNAPSHOT
    FIGURE 9 WHITEBOARDS SEGMENT TO DOMINATE MARKET DURING FORECAST PERIOD
    FIGURE 10 LCDS SEGMENT TO LEAD EDUCATION SMART DISPLAY MARKET DURING FORECAST PERIOD
    FIGURE 11 ABOVE 55” DISPLAY SEGMENT TO DOMINATE MARKET DURING FORECAST PERIOD
    FIGURE 12 ASIA PACIFIC TO REGISTER HIGHEST CAGR DURING FORECAST PERIOD
 
4 PREMIUM INSIGHTS (Page No. - 52)
    4.1 ATTRACTIVE OPPORTUNITIES FOR EDUCATION SMART DISPLAY MARKET PLAYERS 
           FIGURE 13 SHIFT TOWARD COLLABORATIVE LEARNING IN NORTH AMERICA TO DRIVE MARKET GROWTH
    4.2 EDUCATION SMART DISPLAY MARKET, BY PRODUCT TYPE 
           FIGURE 14 WHITEBOARDS SEGMENT TO ACCOUNT FOR LARGER SHARE OF EDUCATION SMART DISPLAY MARKET DURING FORECAST PERIOD
    4.3 EDUCATION SMART DISPLAY MARKET, BY DISPLAY TECHNOLOGY 
           FIGURE 15 LCDS SEGMENT TO ACCOUNT FOR LARGEST SHARE OF EDUCATION SMART DISPLAY MARKET DURING FORECAST PERIOD
    4.4 EDUCATION SMART DISPLAY MARKET, BY DISPLAY SIZE 
           FIGURE 16 ABOVE 55” SEGMENT TO DOMINATE EDUCATION SMART DISPLAY MARKET DURING FORECAST PERIOD
    4.5 NORTH AMERICA: EDUCATION SMART DISPLAY MARKET, BY PRODUCT TYPE AND COUNTRY, 2023 
           FIGURE 17 WHITEBOARDS SEGMENT AND US LED EDUCATION SMART DISPLAY MARKET IN NORTH AMERICA IN 2023
 
5 MARKET OVERVIEW (Page No. - 55)
    5.1 INTRODUCTION 
    5.2 MARKET DYNAMICS 
           FIGURE 18 MARKET DYNAMICS
           5.2.1 DRIVERS
                    5.2.1.1 Digital transformation in learning
                    5.2.1.2 Rising demand for collaborative learning
                    5.2.1.3 Technological advancements
                               FIGURE 19 IMPACT ANALYSIS OF DRIVERS ON EDUCATION SMART DISPLAY MARKET
           5.2.2 RESTRAINTS
                    5.2.2.1 Budget constraints
                    5.2.2.2 Integration challenges
                               FIGURE 20 IMPACT ANALYSIS OF RESTRAINTS ON EDUCATION SMART DISPLAY MARKET
           5.2.3 OPPORTUNITIES
                    5.2.3.1 Rising e-learning trend
                    5.2.3.2 Growing adoption and awareness about numerous benefits of smart displays
                               FIGURE 21 IMPACT ANALYSIS OF OPPORTUNITIES IN EDUCATION SMART DISPLAY MARKET
           5.2.4 CHALLENGES
                    5.2.4.1 Security concerns
                    5.2.4.2 Teacher training and adaptation
                    5.2.4.3 Maintenance and technical support
                               FIGURE 22 IMPACT ANALYSIS OF CHALLENGES ON EDUCATION SMART DISPLAY MARKET
    5.3 VALUE CHAIN ANALYSIS 
           FIGURE 23 VALUE CHAIN ANALYSIS
           TABLE 3 VALUE CHAIN ANALYSIS
    5.4 EDUCATION SMART DISPLAY MARKET ECOSYSTEM 
           FIGURE 24 EDUCATION SMART DISPLAY MARKET ECOSYSTEM
    5.5 KEY TECHNOLOGY TRENDS 
           5.5.1 RELATED TECHNOLOGIES
                    5.5.1.1 Advanced touchscreen technologies
                    5.5.1.2 Interactive projection mapping
           5.5.2 UPCOMING TECHNOLOGIES
                    5.5.2.1 Micro-LED
           5.5.3 TRANSPARENT DISPLAYS
           5.5.4 ADJACENT TECHNOLOGIES
                    5.5.4.1 5G connectivity
                    5.5.4.2 Edge computing for real-time interactivity
    5.6 PRICING ANALYSIS 
           5.6.1 AVERAGE SELLING PRICE TREND
                    FIGURE 25 AVERAGE SELLING PRICE, BY PRODUCT TYPE AND DISPLAY SIZE (IN USD)
                    TABLE 4 AVERAGE SELLING PRICE, BY DISPLAY SIZE (USD)
                    TABLE 5 AVERAGE SELLING PRICE FOR WHITEBOARDS (ABOVE 55"), BY REGION (USD)
    5.7 PATENT ANALYSIS 
           TABLE 6 NUMBER OF PATENTS GRANTED FOR INTERACTIVE DISPLAYS, 2013–2022
           FIGURE 26 NUMBER OF PATENTS GRANTED FOR INTERACTIVE DISPLAYS
           FIGURE 27 TOP 10 COMPANIES WITH HIGHEST NUMBER OF PATENT APPLICATIONS DURING REVIEW PERIOD
           TABLE 7 TOP 20 PATENT OWNERS DURING REVIEW PERIOD
           TABLE 8 KEY PATENTS RELATED TO INTERACTIVE DISPLAYS
    5.8 PORTER’S FIVE FORCES ANALYSIS 
           FIGURE 28 PORTER’S FIVE FORCES ANALYSIS–2022
           FIGURE 29 IMPACT OF PORTER’S FIVE FORCES ON EDUCATION SMART DISPLAY MARKET, 2023
           TABLE 9 PORTER’S FIVE FORCES ANALYSIS –2023
           5.8.1 THREAT OF NEW ENTRANTS
           5.8.2 THREAT OF SUBSTITUTES
           5.8.3 BARGAINING POWER OF SUPPLIERS
           5.8.4 BARGAINING POWER OF BUYERS
           5.8.5 INTENSITY OF COMPETITIVE RIVALRY
    5.9 KEY STAKEHOLDERS AND BUYING CRITERIA 
           5.9.1 KEY STAKEHOLDERS IN BUYING PROCESS
                    FIGURE 30 INFLUENCE OF STAKEHOLDERS ON BUYING PROCESS FOR EDUCATION SMART DISPLAYS
                    TABLE 10 INFLUENCE OF STAKEHOLDERS ON BUYING PROCESS FOR EDUCATION SMART DISPLAYS (%)
           5.9.2 BUYING CRITERIA
                    FIGURE 31 KEY BUYING CRITERIA FOR EDUCATION SMART DISPLAYS
                    TABLE 11 KEY BUYING CRITERIA FOR EDUCATION SMART DISPLAYS
    5.10 TRADE ANALYSIS 
           TABLE 12 IMPORT DATA FOR MONITORS AND PROJECTORS, HS CODE: 8528, BY COUNTRY, 2018–2022 (USD MILLION)
           FIGURE 32 HS CODE: 8528, IMPORT VALUES FOR MAJOR COUNTRIES, 2018–2022
           TABLE 13 EXPORT DATA FOR MONITORS AND PROJECTORS, HS CODE: 8528, BY COUNTRY, 2018–2022 (USD MILLION)
           FIGURE 33 HS CODE: 8528, EXPORT VALUES FOR MAJOR COUNTRIES, 2018–2022
    5.11 CASE STUDIES 
           5.11.1 ENHANCED LEARNING EXPERIENCE FOR STUDENTS WITH LCD VIDEO WALL DISPLAY
                    TABLE 14 SAMSUNG: LCD VIDEO WALL ENHANCED LEARNING EXPERIENCE FOR STUDENTS
           5.11.2 PANASONIC TO PROVIDE DISPLAY TECHNOLOGIES FOR AD HOC TEAMWORK CENTERS AND ACTIVE-LEARNING CLASSROOMS
                    TABLE 15 PANASONIC: VIDEO WALL DISPLAY PROMOTED ACTIVE-LEARNING IN CLASSROOMS
           5.11.3 ENHANCED CLARITY AND READABILITY IN CLASSROOMS
                    TABLE 16 OPTOMA: INTERACTIVE FLAT PANEL DISPLAYS ENHANCED CLARITY AND READABILITY IN CLASSROOMS
    5.12 TARIFF AND REGULATIONS 
           5.12.1 TARIFFS
           TABLE 17 MFN TARIFFS FOR PRODUCTS INCLUDED UNDER HS CODE: 8528 EXPORTED BY US
           5.12.2 STANDARDS
                    5.12.2.1 Global
                    5.12.2.2 Europe
                    5.12.2.3 Asia Pacific
                    5.12.2.4 North America
           5.12.3 REGULATIONS
                    5.12.3.1 North America
                    5.12.3.2 Europe
                    5.12.3.3 Asia Pacific
    5.13 TRENDS/DISRUPTIONS IMPACTING CUSTOMERS BUSINESS 
           FIGURE 34 REVENUE SHIFT FOR DISPLAYS MARKET
    5.14 KEY CONFERENCES & EVENTS IN 2022–2023 
           TABLE 18 DETAILED LIST OF CONFERENCES AND EVENTS, 2022–2023
 
6 EDUCATION SMART DISPLAY MARKET, BY RESOLUTION (Page No. - 82)
    6.1 INTRODUCTION 
    6.2 FHD 
    6.3 4K AND ABOVE 
    6.4 HD AND LOWER THAN HD 
 
7 EDUCATION SMART DISPLAY MARKET, BY PRODUCT TYPE (Page No. - 84)
    7.1 INTRODUCTION 
           FIGURE 35 WHITEBOARDS SEGMENT TO ACCOUNT FOR LARGER SHARE OF EDUCATION SMART DISPLAY MARKET DURING FORECAST PERIOD
           TABLE 19 EDUCATION SMART DISPLAY MARKET, BY PRODUCT TYPE, 2020–2023 (USD MILLION)
           TABLE 20 EDUCATION SMART DISPLAY MARKET, BY PRODUCT TYPE, 2024–2029 (USD MILLION)
           TABLE 21 EDUCATION SMART DISPLAY MARKET, BY PRODUCT TYPE, 2020–2023 (THOUSAND UNITS)
           TABLE 22 EDUCATION SMART DISPLAY MARKET, BY PRODUCT TYPE, 2024–2029 (THOUSAND UNITS)
    7.2 WHITEBOARDS 
           7.2.1 SIGNIFICANT IMPROVEMENT IN STUDENT ENGAGEMENT AND FOSTERING COLLABORATIVE LEARNING TO DRIVE MARKET
                    TABLE 23 WHITEBOARDS: EDUCATION SMART DISPLAY MARKET, BY DISPLAY SIZE, 2020–2023 (USD MILLION)
                    TABLE 24 WHITEBOARDS: EDUCATION SMART DISPLAY MARKET, BY DISPLAY SIZE, 2024–2029 (USD MILLION)
                    TABLE 25 WHITEBOARDS: EDUCATION SMART DISPLAY MARKET, BY DISPLAY SIZE, 2020–2023 (THOUSAND UNITS)
                    TABLE 26 WHITEBOARDS: EDUCATION SMART DISPLAY MARKET, BY DISPLAY SIZE, 2024–2029 (THOUSAND UNITS)
                    TABLE 27 WHITEBOARDS: EDUCATION SMART DISPLAY MARKET, BY DISPLAY TECHNOLOGY, 2020–2023 (USD MILLION)
                    TABLE 28 WHITEBOARDS: EDUCATION SMART DISPLAY MARKET, BY DISPLAY TECHNOLOGY, 2024–2029 (USD MILLION)
                    FIGURE 36 ASIA PACIFIC TO REGISTER HIGHEST CAGR IN EDUCATION SMART DISPLAY MARKET FOR WHITEBOARDS DURING FORECAST PERIOD
                    TABLE 29 WHITEBOARDS: EDUCATION SMART DISPLAY MARKET, BY REGION, 2020–2023 (USD MILLION)
                    TABLE 30 WHITEBOARDS: EDUCATION SMART DISPLAY MARKET, BY REGION, 2024–2029 (USD MILLION)
                    TABLE 31 WHITEBOARDS: EDUCATION SMART DISPLAY MARKET IN NORTH AMERICA, BY COUNTRY, 2020–2023 (USD MILLION)
                    TABLE 32 WHITEBOARDS: EDUCATION SMART DISPLAY MARKET IN NORTH AMERICA, BY COUNTRY, 2024–2029 (USD MILLION)
                    TABLE 33 WHITEBOARDS: EDUCATION SMART DISPLAY MARKET IN EUROPE, BY COUNTRY, 2020–2023 (USD MILLION)
                    TABLE 34 WHITEBOARDS: EDUCATION SMART DISPLAY MARKET IN EUROPE, BY COUNTRY, 2024–2029 (USD MILLION)
                    TABLE 35 WHITEBOARDS: EDUCATION SMART DISPLAY MARKET IN ASIA PACIFIC, BY COUNTRY, 2020–2023 (USD MILLION)
                    TABLE 36 WHITEBOARDS: EDUCATION SMART DISPLAY MARKET IN ASIA PACIFIC, BY COUNTRY, 2024–2029 (USD MILLION)
                    TABLE 37 WHITEBOARDS: EDUCATION SMART DISPLAY MARKET IN ROW, BY REGION, 2020–2023 (USD MILLION)
                    TABLE 38 WHITEBOARDS: EDUCATION SMART DISPLAY MARKET IN ROW, BY REGION, 2024–2029 (USD MILLION)
                    TABLE 39 WHITEBOARDS: EDUCATION SMART DISPLAY MARKET IN MIDDLE EAST & AFRICA, BY REGION, 2020–2023 (USD MILLION)
                    TABLE 40 WHITEBOARDS: EDUCATION SMART DISPLAY MARKET IN MIDDLE EAST & AFRICA, BY REGION, 2024–2029 (USD MILLION)
    7.3 VIDEO WALLS 
           7.3.1 GROWING DEMAND FOR LARGE FORMAT DISPLAYS FOR AUDITORIUMS TO DRIVE MARKET
                    TABLE 41 VIDEO WALLS: EDUCATION SMART DISPLAY MARKET, BY DISPLAY SIZE, 2020–2023 (USD MILLION)
                    TABLE 42 VIDEO WALLS: EDUCATION SMART DISPLAY MARKET, BY DISPLAY SIZE, 2024–2029 (USD MILLION)
                    TABLE 43 VIDEO WALLS: EDUCATION SMART DISPLAY MARKET, BY DISPLAY SIZE, 2020–2023 (THOUSAND UNITS)
                    TABLE 44 VIDEO WALLS: EDUCATION SMART DISPLAY MARKET, BY DISPLAY SIZE, 2024–2029 (THOUSAND UNITS)
                    TABLE 45 VIDEO WALLS: EDUCATION SMART DISPLAY MARKET, BY DISPLAY TECHNOLOGY, 2020–2023 (USD THOUSAND)
                    TABLE 46 VIDEO WALLS: EDUCATION SMART DISPLAY MARKET, BY DISPLAY TECHNOLOGY, 2024–2029 (USD THOUSAND)
                    FIGURE 37 NORTH AMERICA TO LEAD EDUCATION SMART DISPLAY MARKET FOR VIDEO WALLS DURING FORECAST PERIOD
                    TABLE 47 VIDEO WALLS: EDUCATION SMART DISPLAY MARKET, BY REGION, 2020–2023 (USD MILLION)
                    TABLE 48 VIDEO WALLS: EDUCATION SMART DISPLAY MARKET, BY REGION, 2024–2029 (USD MILLION)
                    TABLE 49 VIDEO WALLS: EDUCATION SMART DISPLAY MARKET IN NORTH AMERICA, BY COUNTRY, 2020–2023 (USD THOUSAND)
                    TABLE 50 VIDEO WALLS: EDUCATION SMART DISPLAY MARKET IN NORTH AMERICA, BY COUNTRY, 2024–2029 (USD THOUSAND)
                    TABLE 51 VIDEO WALLS: EDUCATION SMART DISPLAY MARKET IN EUROPE, BY COUNTRY, 2020–2023 (USD THOUSAND)
                    TABLE 52 VIDEO WALLS: EDUCATION SMART DISPLAY MARKET IN EUROPE, BY COUNTRY, 2024–2029 (USD THOUSAND)
                    TABLE 53 VIDEO WALLS: EDUCATION SMART DISPLAY MARKET IN ASIA PACIFIC, BY COUNTRY, 2020–2023 (USD THOUSAND)
                    TABLE 54 VIDEO WALLS: EDUCATION SMART DISPLAY MARKET IN ASIA PACIFIC, BY COUNTRY, 2024–2029 (USD THOUSAND)
                    TABLE 55 VIDEO WALLS: EDUCATION SMART DISPLAY MARKET IN ROW, BY REGION, 2020–2023 (USD THOUSAND)
                    TABLE 56 VIDEO WALLS: EDUCATION SMART DISPLAY MARKET IN ROW, BY REGION, 2024–2029 (USD THOUSAND)
                    TABLE 57 VIDEO WALLS: EDUCATION SMART DISPLAY MARKET IN MIDDLE EAST & AFRICA, BY REGION, 2020–2023 (USD THOUSAND)
                    TABLE 58 VIDEO WALLS: EDUCATION SMART DISPLAY MARKET IN MIDDLE EAST & AFRICA, BY REGION, 2024–2029 (USD THOUSAND)
 
8 EDUCATION SMART DISPLAY MARKET, BY DISPLAY SIZE (Page No. - 99)
    8.1 INTRODUCTION 
           TABLE 59 EDUCATION SMART DISPLAY MARKET, BY DISPLAY SIZE, 2020–2023 (USD MILLION)
           FIGURE 38 ABOVE 55” SEGMENT TO ACCOUNT FOR LARGER SHARE OF EDUCATION SMART DISPLAY MARKET BY 2029
           TABLE 60 EDUCATION SMART DISPLAY MARKET, BY DISPLAY SIZE, 2024–2029 (USD MILLION)
           TABLE 61 EDUCATION SMART DISPLAY MARKET, BY DISPLAY SIZE, 2020–2023 (THOUSAND UNITS)
           TABLE 62 EDUCATION SMART DISPLAY MARKET, BY DISPLAY SIZE, 2024–2029 (THOUSAND UNITS)
    8.2 UP TO 55” 
           8.2.1 SUITABILITY FOR SMALLER CLASSROOMS, MEETING ROOMS, OR INTERACTIVE DISPLAYS IN LIMITED SPACES TO DRIVE MARKET
                    TABLE 63 UP TO 55": EDUCATION SMART DISPLAY MARKET, BY PRODUCT TYPE, 2020–2023 (USD MILLION)
                    FIGURE 39 WHITEBOARDS SEGMENT TO ACCOUNT FOR LARGER SHARE FOR UP TO 55” DISPLAY SIZE OF EDUCATION SMART DISPLAY MARKET BY 2029
                    TABLE 64 UP TO 55": EDUCATION SMART DISPLAY MARKET, BY PRODUCT TYPE, 2024–2029 (USD MILLION)
                    TABLE 65 UP TO 55": EDUCATION SMART DISPLAY MARKET, BY PRODUCT TYPE, 2020–2023 (THOUSAND UNITS)
                    TABLE 66 UP TO 55": EDUCATION SMART DISPLAY MARKET, BY PRODUCT TYPE, 2024–2029 (THOUSAND UNITS)
    8.3 ABOVE 55” 
           8.3.1 HIGHER RESOLUTION, INTERACTIVE FUNCTIONALITIES, AND ADVANCED COLLABORATIVE TOOLS CATERING TO DIVERSE NEEDS TO DRIVE MARKET
                    TABLE 67 ABOVE 55": EDUCATION SMART DISPLAY MARKET, BY PRODUCT TYPE, 2020–2023 (USD MILLION)
                    FIGURE 40 WHITEBOARDS SEGMENT TO ACCOUNT FOR LARGER SHARE FOR ABOVE 55” OF EDUCATION SMART DISPLAY MARKET BY 2029
                    TABLE 68 ABOVE 55": EDUCATION SMART DISPLAY MARKET, BY PRODUCT TYPE, 2024–2029 (USD MILLION)
                    TABLE 69 ABOVE 55": EDUCATION SMART DISPLAY MARKET, BY PRODUCT TYPE, 2020–2023 (THOUSAND UNITS)
                    TABLE 70 ABOVE 55": EDUCATION SMART DISPLAY MARKET, BY PRODUCT TYPE, 2024–2029 (USD MILLION)
 
9 EDUCATION SMART DISPLAY MARKET, BY DISPLAY TECHNOLOGY (Page No. - 106)
    9.1 INTRODUCTION 
           TABLE 71 GLOBAL EDUCATION SMART DISPLAY MARKET, BY DISPLAY TECHNOLOGY, 2020–2023 (USD MILLION)
           FIGURE 41 LCD TECHNOLOGY TO ACCOUNT FOR LARGEST SHARE OF EDUCATION SMART DISPLAY MARKET BY 2029
           TABLE 72 GLOBAL EDUCATION SMART DISPLAY MARKET, BY DISPLAY TECHNOLOGY, 2024–2029 (USD MILLION)
    9.2 LCDS 
           9.2.1 LOWER PRODUCTION COST AND VERSATILITY TO DRIVE MARKET
                    TABLE 73 LCDS: EDUCATION SMART DISPLAY MARKET, BY PRODUCT TYPE, 2020–2023 (USD MILLION)
                    FIGURE 42 WHITEBOARDS SEGMENT TO DOMINATE LCD TECHNOLOGY IN EDUCATION SMART DISPLAY MARKET
                    TABLE 74 LCDS: EDUCATION SMART DISPLAY MARKET, BY PRODUCT TYPE, 2024–2029 (USD MILLION)
    9.3 DIRECT-VIEW LEDS 
           9.3.1 INCREASING DEMAND FOR LARGE VIDEO-WALLS AND DIGITAL SIGNAGE IN EDUCATIONAL INSTITUTIONS TO DRIVE MARKET
                    TABLE 75 DIRECT-VIEW LEDS: EDUCATION SMART DISPLAY MARKET, BY PRODUCT TYPE, 2020–2023 (USD MILLION)
                    TABLE 76 DIRECT-VIEW LEDS: EDUCATION SMART DISPLAY MARKET, BY PRODUCT TYPE, 2024–2029 (USD MILLION)
    9.4 OLEDS 
           9.4.1 GROWING DEMAND FOR PREMIUM INTERACTIVE DISPLAYS DELIVERING ENHANCED VISUAL EXPERIENCES TO PROPEL MARKET
                    TABLE 77 OLEDS: EDUCATION SMART DISPLAY MARKET, BY PRODUCT TYPE, 2020–2023 (USD MILLION)
                    FIGURE 43 WHITEBOARDS SEGMENT TO DOMINATE OLED TECHNOLOGY IN EDUCATION SMART DISPLAY MARKET
                    TABLE 78 OLEDS: EDUCATION SMART DISPLAY MARKET, BY PRODUCT TYPE, 2024–2029 (USD MILLION)
    9.5 OTHER DISPLAY TECHNOLOGIES 
           TABLE 79 OTHER DISPLAY TECHNOLOGIES: EDUCATION SMART DISPLAY MARKET, BY PRODUCT, TYPE 2020–2023 (USD MILLION)
           TABLE 80 OTHER DISPLAY TECHNOLOGIES: EDUCATION SMART DISPLAY MARKET, BY PRODUCT, TYPE 2024–2029 (USD MILLION)
 
10 EDUCATION SMART DISPLAY MARKET, BY REGION (Page No. - 113)
     10.1 INTRODUCTION 
             FIGURE 44 EDUCATION SMART DISPLAY MARKET, BY REGION
             TABLE 81 EDUCATION SMART DISPLAY MARKET, BY REGION, 2020–2023 (USD MILLION)
             TABLE 82 EDUCATION SMART DISPLAY MARKET, BY REGION, 2024–2029 (USD MILLION)
     10.2 NORTH AMERICA 
             FIGURE 45 NORTH AMERICA: EDUCATION SMART DISPLAY MARKET SNAPSHOT
             TABLE 83 NORTH AMERICA: EDUCATION SMART DISPLAY MARKET, BY COUNTRY, 2020–2023 (USD MILLION)
             TABLE 84 NORTH AMERICA: EDUCATION SMART DISPLAY MARKET, BY COUNTRY, 2024–2029 (USD MILLION)
             TABLE 85 NORTH AMERICA: EDUCATION SMART DISPLAY MARKET, BY PRODUCT TYPE, 2020–2023 (USD MILLION)
             TABLE 86 NORTH AMERICA: EDUCATION SMART DISPLAY MARKET, BY PRODUCT TYPE, 2024–2029 (USD MILLION)
             10.2.1 IMPACT OF RECESSION ON NORTH AMERICA
             10.2.2 US
                        10.2.2.1 Strong education sector, government backing, major company presence, and fostering dynamic and interactive learning experiences to drive market
                                     TABLE 87 US: EDUCATION SMART DISPLAY MARKET, BY PRODUCT TYPE, 2020–2023 (USD MILLION)
                                     TABLE 88 US: EDUCATION SMART DISPLAY MARKET, BY PRODUCT TYPE, 2024–2029 (USD MILLION)
             10.2.3 CANADA
                        10.2.3.1 Pioneer in embracing technology in education and tech-savvy population to contribute to market growth
                                     TABLE 89 CANADA: EDUCATION SMART DISPLAY MARKET, BY PRODUCT TYPE, 2020–2023 (USD MILLION)
                                     TABLE 90 CANADA: EDUCATION SMART DISPLAY MARKET, BY PRODUCT TYPE, 2024–2029 (USD MILLION)
             10.2.4 MEXICO
                        10.2.4.1 Efforts to modernize classrooms and enhance overall learning environment to drive market
                                     TABLE 91 MEXICO: EDUCATION SMART DISPLAY MARKET, BY PRODUCT TYPE, 2020–2023 (USD MILLION)
                                     TABLE 92 MEXICO: EDUCATION SMART DISPLAY MARKET, BY PRODUCT TYPE, 2024–2029 (USD MILLION)
     10.3 EUROPE 
             FIGURE 46 EUROPE: EDUCATION SMART DISPLAY MARKET SNAPSHOT
             TABLE 93 EUROPE: EDUCATION SMART DISPLAY MARKET, BY COUNTRY, 2020–2023 (USD MILLION)
             TABLE 94 EUROPE: EDUCATION SMART DISPLAY MARKET, BY COUNTRY, 2024–2029 (USD MILLION)
             TABLE 95 EUROPE: EDUCATION SMART DISPLAY MARKET, BY PRODUCT TYPE, 2020–2023 (USD MILLION)
             TABLE 96 EUROPE: EDUCATION SMART DISPLAY MARKET, BY PRODUCT TYPE, 2024–2029 (USD MILLION)
             10.3.1 IMPACT OF RECESSION ON EUROPE
             10.3.2 UK
                        10.3.2.1 EdTech Strategy launched by Department for Education to drive market
                                     TABLE 97 UK: EDUCATION SMART DISPLAY MARKET, BY PRODUCT TYPE, 2020–2023 (USD MILLION)
                                     TABLE 98 UK: EDUCATION SMART DISPLAY MARKET, BY PRODUCT TYPE, 2024–2029 (USD MILLION)
             10.3.3 GERMANY
                        10.3.3.1 Government initiatives and commitment to technological advancement in education to drive market
                                     TABLE 99 GERMANY: EDUCATION SMART DISPLAY MARKET, BY PRODUCT TYPE, 2020–2023 (USD MILLION)
                                     TABLE 100 GERMANY: EDUCATION SMART DISPLAY MARKET, BY PRODUCT TYPE, 2024–2029 (USD MILLION)
             10.3.4 FRANCE
                        10.3.4.1 Implementing cutting-edge educational tools enabling technology-enhanced education to drive market
                                     TABLE 101 FRANCE: EDUCATION SMART DISPLAY MARKET, BY PRODUCT TYPE, 2020–2023 (USD MILLION)
                                     TABLE 102 FRANCE: EDUCATION SMART DISPLAY MARKET, BY PRODUCT TYPE, 2024–2029 (USD MILLION)
             10.3.5 REST OF EUROPE (ROE)
                        TABLE 103 REST OF EUROPE: EDUCATION SMART DISPLAY MARKET, BY PRODUCT TYPE, 2020–2023 (USD MILLION)
                        TABLE 104 REST OF EUROPE: EDUCATION SMART DISPLAY MARKET, BY PRODUCT TYPE, 2024–2029 (USD MILLION)
     10.4 ASIA PACIFIC 
             FIGURE 47 ASIA PACIFIC: EDUCATION SMART DISPLAY MARKET SNAPSHOT
             TABLE 105 ASIA PACIFIC: EDUCATION SMART DISPLAY MARKET, BY COUNTRY, 2020–2023 (USD MILLION)
             TABLE 106 ASIA PACIFIC: EDUCATION SMART DISPLAY MARKET, BY COUNTRY, 2024–2029 (USD MILLION)
             TABLE 107 ASIA PACIFIC: EDUCATION SMART DISPLAY MARKET, BY PRODUCT TYPE, 2020–2023 (USD MILLION)
             TABLE 108 ASIA PACIFIC: EDUCATION SMART DISPLAY MARKET, BY PRODUCT TYPE, 2024–2029 (USD MILLION)
             10.4.1 IMPACT OF RECESSION ON ASIA PACIFIC
             10.4.2 CHINA
                        10.4.2.1 Implementation of comprehensive national plans focused on integrating technology into education to drive market
                                     TABLE 109 CHINA: EDUCATION SMART DISPLAY MARKET, BY PRODUCT TYPE, 2020–2023 (USD MILLION)
                                     TABLE 110 CHINA: EDUCATION SMART DISPLAY MARKET, BY PRODUCT TYPE, 2024–2029 (USD MILLION)
             10.4.3 JAPAN
                        10.4.3.1 Integration of interactive displays providing students with dynamic and technologically enriched learning environments to drive market
                                     TABLE 111 JAPAN: EDUCATION SMART DISPLAY MARKET, BY PRODUCT TYPE, 2020–2023 (USD MILLION)
                                     TABLE 112 JAPAN: EDUCATION SMART DISPLAY MARKET, BY PRODUCT TYPE, 2024–2029 (USD MILLION)
             10.4.4 SOUTH KOREA
                        10.4.4.1 Educational innovation in government policies encouraging integration of modern teaching tools in classrooms to drive market
                                     TABLE 113 SOUTH KOREA: EDUCATION SMART DISPLAY MARKET, BY PRODUCT TYPE, 2020–2023 (USD MILLION)
                                     TABLE 114 SOUTH KOREA: EDUCATION SMART DISPLAY MARKET, BY PRODUCT TYPE, 2024–2029 (USD MILLION)
             10.4.5 INDIA
                        10.4.5.1 Rising awareness among educators and institutions about multifaceted benefits of interactive displays to drive market
                                     TABLE 115 INDIA: EDUCATION SMART DISPLAY MARKET, BY PRODUCT TYPE, 2020–2023 (USD MILLION)
                                     TABLE 116 INDIA: EDUCATION SMART DISPLAY MARKET, BY PRODUCT TYPE, 2024–2029 (USD MILLION)
             10.4.6 REST OF ASIA PACIFIC
                        TABLE 117 REST OF ASIA PACIFIC: EDUCATION SMART DISPLAY MARKET, BY PRODUCT TYPE, 2020–2023 (USD MILLION)
                        TABLE 118 REST OF ASIA PACIFIC: EDUCATION SMART DISPLAY MARKET, BY PRODUCT TYPE, 2024–2029 (USD MILLION)
     10.5 REST OF THE WORLD (ROW) 
             TABLE 119 REST OF THE WORLD: EDUCATION SMART DISPLAY MARKET, BY REGION, 2020–2023 (USD MILLION)
             TABLE 120 REST OF THE WORLD: EDUCATION SMART DISPLAY MARKET, BY REGION, 2024–2029 (USD MILLION)
             TABLE 121 REST OF THE WORLD: EDUCATION SMART DISPLAY MARKET, BY PRODUCT TYPE, 2020–2023 (USD MILLION)
             TABLE 122 REST OF THE WORLD: EDUCATION SMART DISPLAY MARKET, BY PRODUCT TYPE, 2024–2029 (USD MILLION)
             10.5.1 IMPACT OF RECESSION ON ROW
             10.5.2 SOUTH AMERICA
                        10.5.2.1 Recognition of transformative impact of technology on education and emphasis on preparing students for digital future to drive market
                                     TABLE 123 SOUTH AMERICA: EDUCATION SMART DISPLAY MARKET, BY PRODUCT TYPE, 2020–2023 (USD MILLION)
                                     TABLE 124 SOUTH AMERICA: EDUCATION SMART DISPLAY MARKET, BY PRODUCT TYPE, 2024–2029 (USD MILLION)
             10.5.3 MIDDLE EAST & AFRICA
                        10.5.3.1 Economic prosperity, high education standards, and proactive government policies to drive market
                                     TABLE 125 MIDDLE EAST & AFRICA: EDUCATION SMART DISPLAY MARKET, BY REGION, 2020–2023 (USD MILLION)
                                     TABLE 126 MIDDLE EAST & AFRICA: EDUCATION SMART DISPLAY MARKET, BY REGION, 2024–2029 (USD MILLION)
                                     TABLE 127 MIDDLE EAST & AFRICA: EDUCATION SMART DISPLAY MARKET, BY PRODUCT TYPE, 2020–2023 (USD MILLION)
                                     TABLE 128 MIDDLE EAST & AFRICA: EDUCATION SMART DISPLAY MARKET, BY PRODUCT TYPE, 2024–2029 (USD MILLION)
                        10.5.3.2 GCC countries
                               10.5.3.2.1 Focus on technology-driven solutions for continued growth in education sector to drive market
                                              TABLE 129 GCC COUNTRIES: EDUCATION SMART DISPLAY MARKET, BY PRODUCT TYPE, 2020–2023 (USD MILLION)
                                              TABLE 130 GCC COUNTRIES: EDUCATION SMART DISPLAY MARKET, BY PRODUCT TYPE, 2024–2029 (USD MILLION)
                        10.5.3.3 Rest of Middle East & Africa
                                     TABLE 131 REST OF MIDDLE EAST & AFRICA: EDUCATION SMART DISPLAY MARKET, BY PRODUCT TYPE, 2020–2023 (USD MILLION)
                                     TABLE 132 REST OF MIDDLE EAST & AFRICA: EDUCATION SMART DISPLAY MARKET, BY PRODUCT TYPE, 2024–2029 (USD MILLION)
 
11 COMPETITIVE LANDSCAPE (Page No. - 139)
     11.1 INTRODUCTION 
     11.2 MARKET EVALUATION FRAMEWORK 
             TABLE 133 OVERVIEW OF STRATEGIES ADOPTED BY KEY PLAYERS
             FIGURE 48 COMPANIES ADOPTED PARTNERSHIPS AS KEY GROWTH STRATEGY FROM 2020 TO 2023
             11.2.1 ORGANIC/INORGANIC GROWTH STRATEGIES
             11.2.2 PRODUCT PORTFOLIO
             11.2.3 GEOGRAPHIC PRESENCE
             11.2.4 MANUFACTURING AND DISTRIBUTION FOOTPRINT
     11.3 MARKET SHARE ANALYSIS, 2023 
             TABLE 134 MARKET SHARE ANALYSIS OF TOP 5 PLAYERS IN EDUCATION SMART DISPLAY MARKET, 2023
     11.4 COMPANY EVALUATION MATRIX 
             11.4.1 STARS
             11.4.2 EMERGING LEADERS
             11.4.3 PERVASIVE PLAYERS
             11.4.4 PARTICIPANTS
                        FIGURE 49 COMPANY EVALUATION MATRIX, 2023
     11.5 STARTUP/SME EVALUATION MATRIX 
             11.5.1 COMPETITIVE BENCHMARKING
                        TABLE 135 DETAILED LIST OF KEY STARTUP/SMES
                        TABLE 136 COMPETITIVE BENCHMARKING FOR STARTUPS/SMES: DISPLAY TECHNOLOGY (13 COMPANIES)
                        TABLE 137 COMPETITIVE BENCHMARKING FOR STARTUPS/SMES: PRODUCT TYPE (13 COMPANIES)
                        TABLE 138 COMPETITIVE BENCHMARKING OF STARTUPS/SMES: REGION (13 COMPANIES)
             11.5.2 PROGRESSIVE COMPANIES
             11.5.3 RESPONSIVE COMPANIES
             11.5.4 DYNAMIC COMPANIES
             11.5.5 STARTING BLOCKS
                        FIGURE 50 STARTUP/SME EVALUATION QUADRANT, 2023
     11.6 COMPANY FOOTPRINT 
             TABLE 139 COMPANY FOOTPRINT (25 COMPANIES)
             TABLE 140 COMPANY DISPLAY TECHNOLOGY FOOTPRINT (25 COMPANIES)
             TABLE 141 COMPANY PRODUCT TYPE FOOTPRINT (25 COMPANIES)
             TABLE 142 COMPANY REGION FOOTPRINT (25 COMPANIES)
     11.7 COMPETITIVE SCENARIO 
             11.7.1 PRODUCT LAUNCHES
                        TABLE 143 PRODUCT LAUNCHES, 2020–2023
             11.7.2 DEALS
                        TABLE 144 DEALS, 2020–2023
 
12 COMPANY PROFILES (Page No. - 159)
     12.1 INTRODUCTION 
     12.2 KEY PLAYERS 
(Business overview, Products /Solutions/Services offered, Recent developments, MnM view, Right to win, Strategic choices, and Weaknesses and Competitive threats)*  
             12.2.1 SAMSUNG
                        TABLE 145 SAMSUNG: COMPANY OVERVIEW
                        FIGURE 51 SAMSUNG: COMPANY SNAPSHOT
                        TABLE 146 SAMSUNG: PRODUCT LAUNCHES
                        TABLE 147 SAMSUNG: DEALS
             12.2.2 LG ELECTRONICS
                        TABLE 148 LG ELECTRONICS: COMPANY OVERVIEW
                        FIGURE 52 LG ELECTRONICS: COMPANY SNAPSHOT
                        TABLE 149 LG ELECTRONICS: PRODUCT LAUNCHES
             12.2.3 NEWLINE INTERACTIVE
                        TABLE 150 NEWLINE INTERACTIVE: COMPANY OVERVIEW
                        TABLE 151 NEWLINE INTERACTIVE: PRODUCTS/SOLUTIONS/SERVICES OFFERED
                        TABLE 152 NEWLINE INTERACTIVE: PRODUCT LAUNCHES
                        TABLE 153 NEWLINE INTERACTIVE: DEALS
             12.2.4 PPDS (PHILIPS)
                        TABLE 154 PPDS (PHILIPS): COMPANY OVERVIEW
                        TABLE 155 PPDS (PHILIPS): PRODUCTS/SOLUTIONS/SERVICES OFFERED
                        TABLE 156 PPDS (PHILIPS): DEALS
             12.2.5 SHARP NEC DISPLAY SOLUTIONS
                        TABLE 157 SHARP NEC DISPLAY SOLUTIONS: COMPANY OVERVIEW
                        TABLE 158 SHARP NEC DISPLAY SOLUTIONS: PRODUCTS/SOLUTIONS/SERVICES OFFERED
                        TABLE 159 SHARP NEC DISPLAY SOLUTIONS: PRODUCT LAUNCHES
             12.2.6 LEYARD
                        TABLE 160 LEYARD: COMPANY OVERVIEW
                        FIGURE 53 LEYARD: COMPANY SNAPSHOT
                        TABLE 161 LEYARD: PRODUCTS/SOLUTIONS/SERVICES OFFERED
                        TABLE 162 LEYARD: PRODUCT LAUNCHES & DEVELOPMENTS
                        TABLE 163 LEYARD: DEALS
             12.2.7 SMART TECHNOLOGIES ULC
                        TABLE 164 SMART TECHNOLOGIES ULC: COMPANY OVERVIEW
                        TABLE 165 SMART TECHNOLOGIES ULC: PRODUCTS/SOLUTIONS/SERVICES OFFERED
                        TABLE 166 SMART TECHNOLOGIES ULC: PRODUCTS LAUNCHES & DEVELOPMENTS
                        TABLE 167 SMART TECHNOLOGIES ULC: DEALS
             12.2.8 SONY GROUP CORPORATION
                        TABLE 168 SONY GROUP CORPORATION: COMPANY OVERVIEW
                        FIGURE 54 SONY GROUP CORPORATION: COMPANY SNAPSHOT
                        TABLE 169 SONY GROUP CORPORATION: PRODUCT LAUNCHES
             12.2.9 BARCO
                        TABLE 170 BARCO: COMPANY OVERVIEW
                        FIGURE 55 BARCO: COMPANY SNAPSHOT
                        TABLE 171 BARCO: PRODUCTS/SOLUTIONS/SERVICES OFFERED
                        TABLE 172 BARCO: PRODUCT LAUNCHES & DEVELOPMENTS
             12.2.10 PANASONIC HOLDINGS CORPORATION
                        TABLE 173 PANASONIC HOLDINGS CORPORATION: COMPANY OVERVIEW
                        FIGURE 56 PANASONIC HOLDINGS CORPORATION: COMPANY SNAPSHOT
                        TABLE 174 PANASONIC HOLDINGS CORPORATION: PRODUCTS/SOLUTIONS/SERVICES OFFERED
             12.2.11 BENQ
                        TABLE 175 BENQ: COMPANY OVERVIEW
                        TABLE 176 BENQ: PRODUCTS/SOLUTIONS/SERVICES OFFERED
                        TABLE 177 BENQ: DEALS
             12.2.12 VIEWSONIC CORPORATION
                        TABLE 178 VIEWSONIC CORPORATION: COMPANY OVERVIEW
                        TABLE 179 VIEWSONIC CORPORATION: PRODUCTS/SOLUTIONS/SERVICES OFFERED
                        TABLE 180 VIEWSONIC CORPORATION: PRODUCTS LAUNCHES & DEVELOPMENTS
             12.2.13 PROMETHEAN WORLD LIMITED
                        TABLE 181 PROMETHEAN WORLD LIMITED: COMPANY OVERVIEW
                        TABLE 182 PROMETHEAN WORLD LIMITED: PRODUCTS/SOLUTIONS/SERVICES OFFERED
                        TABLE 183 PROMETHEAN WORLD LIMITED: PRODUCT LAUNCHES & DEVELOPMENTS
             12.2.14 CLEARTOUCH
                        TABLE 184 CLEARTOUCH: COMPANY OVERVIEW
                        TABLE 185 CLEARTOUCH: PRODUCTS/SOLUTIONS/SERVICES OFFERED
                        TABLE 186 CLEARTOUCH: PRODUCT LAUNCHES & DEVELOPMENTS
             12.2.15 OPTOMA CORPORATION
                        TABLE 187 OPTOMA CORPORATION: COMPANY OVERVIEW
                        TABLE 188 OPTOMA CORPORATION: PRODUCTS/SOLUTIONS/SERVICES OFFERED
     12.3 OTHER PLAYERS 
             12.3.1 CLEVERTOUCH (BY BOXLIGHT)
             12.3.2 HDI LTD.
             12.3.3 PEERLESS-AV
             12.3.4 ABSEN INC.
             12.3.5 CHRISTIE DIGITAL SYSTEMS USA, INC.
             12.3.6 RICOH
             12.3.7 HITEVISION TECH ASIA PACIFIC CO., LTD.
             12.3.8 BOXLIGHT
             12.3.9 PRIMEVIEW GLOBAL
             12.3.10 PROMARK TECHSOLUTIONS PVT. LTD.
*Details on Business overview, Products /Solutions/Services offered, Recent developments, MnM view, Right to win, Strategic choices, and Weaknesses and Competitive threats might not be captured in case of unlisted companies.  
 
13 APPENDIX (Page No. - 206)
     13.1 INSIGHTS FROM INDUSTRY EXPERTS 
     13.2 DISCUSSION GUIDE 
     13.3 KNOWLEDGESTORE: MARKETSANDMARKETS’ SUBSCRIPTION PORTAL 
     13.4 CUSTOMIZATION OPTIONS 
     13.5 RELATED REPORTS 
     13.6 AUTHOR DETAILS 
 

The research study involved four major activities in estimating the size of the education smart display market. Exhaustive secondary research has been done to collect important information about the market and peer markets. The validation of these findings, assumptions, and sizing with the help of primary research with industry experts across the value chain has been the next step. Both top-down and bottom-up approaches have been used to estimate the market size. Post which the market breakdown and data triangulation have been adopted to estimate the market sizes of segments and sub-segments.

Secondary Research

In secondary research, various secondary sources have been referred to for obtaining the information that was needed for the study. Various secondary sources that were used for the research include corporate filings such as annual reports, press releases, investor presentations, and financial statements; trade, business, and professional associations; whitepapers, journals, certified publications, and articles from recognized authors and databases.

In the education smart display report, the top-down as well as bottom-up approaches have been used for the estimation of the global market size, along with several other dependent submarkets. The major players in the market were identified with the help of extensive secondary research and their presence in the market was determined using secondary and primary research. All the percentage shares, splits, and breakdowns have been determined using secondary sources and verified through primary sources.

Primary Research

Extensive primary research has been conducted after understanding the education smart display market scenario through secondary research. Several primary interviews have been conducted with key opinion leaders from both demand- and supply-side vendors across four major regions— North America, Europe, Asia Pacific, and the Rest of the World. Approximately 25% of the primary interviews have been conducted with the demand-side vendors and 75% with the supply-side vendors. Primary data has been collected mainly through telephonic interviews, which consist of 80% of the total primary interviews; questionnaires and emails have also been used to collect the data.

After successful interaction with industry experts, brief sessions were conducted with highly experienced independent consultants to reinforce the findings of our primary research. This, along with the in-house subject matter experts’ opinions, has led us to the findings as described in the report.

Education Smart Display Market
 Size, and Share

To know about the assumptions considered for the study, download the pdf brochure

Market Size Estimation

In the market engineering process, both top-down and bottom-up approaches along with data triangulation methods have been used to estimate and validate the size of the education smart display market and other dependent submarkets. The research methodology used to estimate the market sizes includes the following:

  • Initially, the focus was on top line investments and spending in the ecosystem. Further the segment level splits and major developments in the market have been considered.
  • Identifying different stakeholders in the education smart displays market that influence the entire market, along with participants across the supply chain
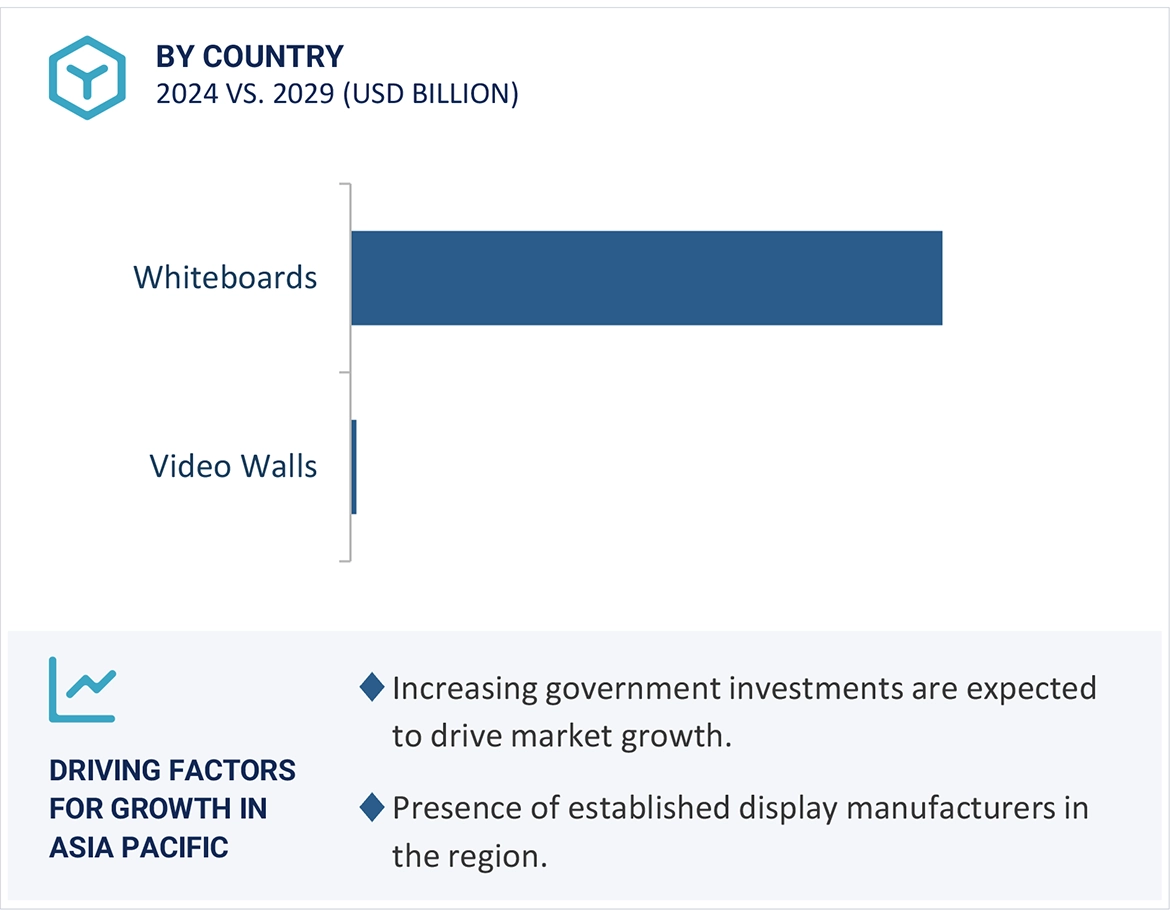
  • Analyzing major manufacturers of whiteboards and video walls for education as well as studying their product portfolios
  • Analyzing trends related to the adoption of whiteboards and video walls
  • Tracking the recent and upcoming developments in the market that include investments, R&D activities, product launches, collaborations, mergers & acquisitions, and partnerships as well as forecasting the market size based on these developments and other critical parameters
  • Carrying out multiple discussions with key opinion leaders to identify the trends in the adoption of whiteboards and video walls
  • Segmenting the overall market into various other market segments
  • Validating the estimates at each level through discussions with key opinion leaders, such as chief executives (CXOs), directors, and operation managers, and finally with the domain experts at MarketsandMarkets

Market Size Estimation Methodology-Bottom-up Approach

Education Smart Display Market
 Size, and Bottom-up approach

Market Size Estimation Methodology-Top-Down Approach

Education Smart Display Market
 Size, and Top-Down Approach

Data Triangulation

After arriving at the overall market size through the market size estimation process explained in the earlier section, the overall education smart displays market has been divided into several segments and subsegments. To complete the overall market engineering process and arrive at the exact statistics for all segments, the data triangulation and market breakdown procedures have been used, wherever applicable. The data has been triangulated by studying various factors and trends from both, the demand and supply side perspectives. Along with the data triangulation and market breakdown procedures, the market has been validated through the top-down and bottom-up approaches.

Market Definition

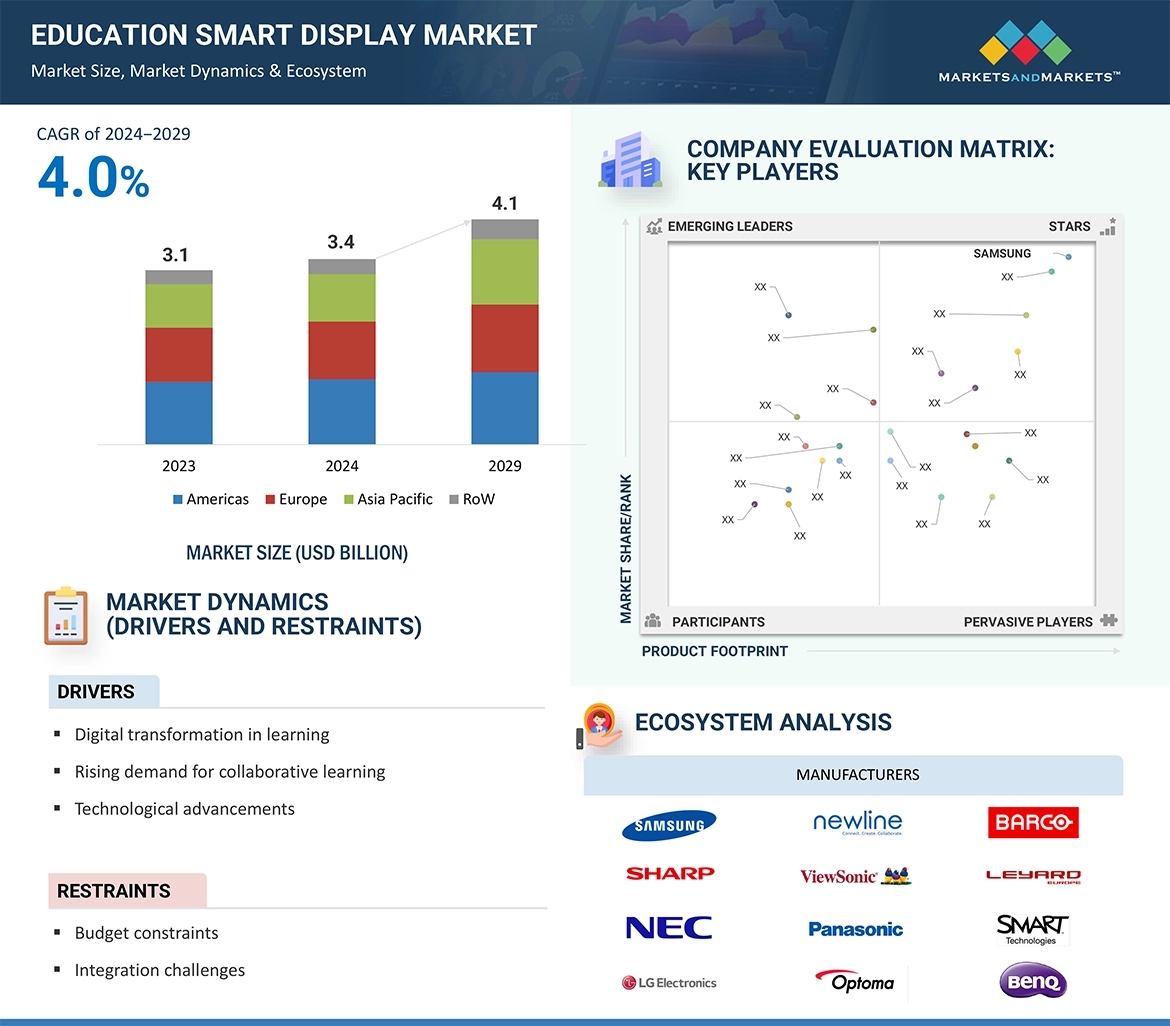
The education smart displays market refers to the industry segment that involves the production, distribution, and adoption of interactive display solutions designed specifically for educational environments. These displays are equipped with advanced technologies such as touchscreens, high resolutions, and interactive functionalities to enhance the learning experience in classrooms and other educational settings.

Education smart displays are tailored to support modern teaching methodologies, foster collaborative learning, and provide interactive content delivery. The market encompasses a range of display sizes, formats, and features that cater to the diverse needs of educational institutions, from primary schools to universities. The primary goal is to leverage technology to create dynamic, engaging, and interactive learning environments, contributing to the digital transformation of education.

Key Stakeholders

  • Raw Material Supplier
  • Manufacturers
  • Technology Providers
  • Government and Regulatory Bodies
  • IT Support and Service Providers
  • Educational Institutions
  • Investors and Financial Institutions
  • Industry Associations
  • Content Developers

The main objectives of this study are as follows:

  • To define, analyze, and forecast the education smart display market size, based on product type, display technology, display size and region in terms of value
  • To define, analyze, and forecast the market size, based on product type, and display size in terms of volume
  • To forecast the market size for various segments with respect to four main regions, namely, North America, Europe, Asia Pacific, and Rest of the World
  • To provide detailed information regarding the major drivers, restraints, opportunities, and challenges influencing the growth of the market
  • To study the complete value chain and related industry segments for the market
  • To strategically analyze the micromarkets1 with respect to individual growth trends, prospects, and contributions to the total market
  • To analyze trends and disruptions; pricing trends; patents and innovations; trade data (export and import data); regulatory environment; Porter's five forces analysis; case studies; key stakeholders & buying criteria; technology trends; the market ecosystem; and key conferences and events related to the education smart displays market
  • To analyze opportunities in the market for various stakeholders by identifying the high-growth segments of the market
  • To strategically profile the key players and comprehensively analyze their market positions in terms of ranking and core competencies2, along with the detailed the competitive landscape for the market leaders
  • To analyze competitive developments such as product launches/developments, expansions, acquisitions, partnerships, collaborations, agreements, and research & development (R&D) activities carried out by players in the market, strategically profile the key players and comprehensively analyze their market position in terms of ranking and core competencies2, along with detailing the competitive landscape for the market leaders
  • To analyze competitive developments such as product launches/developments, expansions, acquisitions, partnerships, collaborations, agreements, and research and development (R&D) activities carried out by players in the education smart display market

Available Customizations:

With the given market data, MarketsandMarkets offers customizations according to the specific requirements of companies. The following customization options are available for the report:

Country-wise Information:

  • Country-wise breakdown for Americas, Europe, Asia Pacific, and Rest of the World

Company Information:

  • Detailed analysis and profiling of additional market players (up to five)
Custom Market Research Services

We will customize the research for you, in case the report listed above does not meet with your exact requirements. Our custom research will comprehensively cover the business information you require to help you arrive at strategic and profitable business decisions.

Request Customization
Report Code
SE 8916
Published ON
Jan, 2024
Choose License Type
BUY NOW
  • SHARE
X
Request Customization
Speak to Analyst
Speak to Analyst
OR FACE-TO-FACE MEETING
PERSONALIZE THIS RESEARCH
  • Triangulate with your Own Data
  • Get Data as per your Format and Definition
  • Gain a Deeper Dive on a Specific Application, Geography, Customer or Competitor
  • Any level of Personalization
REQUEST A FREE CUSTOMIZATION
LET US HELP YOU!
  • What are the Known and Unknown Adjacencies Impacting the Education Smart Display Market
  • What will your New Revenue Sources be?
  • Who will be your Top Customer; what will make them switch?
  • Defend your Market Share or Win Competitors
  • Get a Scorecard for Target Partners
CUSTOMIZED WORKSHOP REQUEST
+1-888-600-6441
  • Call Us
  • +1-888-600-6441 (Corporate office hours)
  • +1-888-600-6441 (US/Can toll free)
  • +44-800-368-9399 (UK office hours)
CONNECT WITH US
ABOUT TRUST ONLINE
©2024 MarketsandMarkets Research Private Ltd. All rights reserved
DMCA.com Protection Status Website Feedback