Drone Sensor Market Size, Share & Trends

Drone Sensor Market Size, Share, Industry Growth & Trends by Sensor Type, Platform (VTOL Type, Fixed Wing Type, Hybrid Type), Application (Navigation, Collision Detection & Avoidance, Data Acquisition, Motion Detection, Power Monitoring), End Users and Region - Global Forecast to 2029

Report Code: SE 6471 May, 2024, by marketsandmarkets.com

Drone Sensor Market Size, Share & Growth 

[241 Pages Report] According to MarketsandMarkets, the drone sensor market size is expected to be valued at USD 1.4 billion in 2024. It is anticipated to be USD 2.5 billion by 2029, growing at a CAGR of 12.1% during the forecast period. Factors such as the increasing adoption of drone sensor include increasing demand for precision agriculture, rising adoption in the media industry for event coverage, and expanding applications in military, defense, and energy& utilities sectors.

Drone Sensor Market

Drone Sensor Market

Drone Sensor Market Forecast to 2029

To know about the assumptions considered for the study, Request for Free Sample Report

Drone Sensor Market Trends

Driver: Growing need for high-resolution imaging and accurate positioning of locations

The demand for high-resolution imaging and accurate positioning in drones is surging for several reasons. Industries are understanding the immense value of data captured by drones with high-resolution cameras and precise location awareness. This translates to better decision-making, improved efficiency, and new applications. In industries such as construction and agriculture, high-resolution imagery allows for detailed inspections and progress tracking, while accurate positioning ensures data is precisely geo-referenced. Similarly, accurately pinpointing a location can be critical for search and rescue operations, and high-resolution imaging can aid in identifying survivors. As drone technology advances and regulations evolve, these capabilities will create avenues for more sophisticated applications, driving the demand for ever-better imaging and positioning systems.

Restraint: Tampering/hacking of drones

Drone movement can be preprogrammed or manually controlled by hand-held devices. Manual control works via radio frequency, and devices can operate in several spectra, such as short-range FM and UHF bands and unregulated (typically 2.4 GHz and 5 GHz), as well as Bluetooth frequency bands. These systems and signals can be tampered with or hacked into, turning the concerned devices into potential threats to humans. Thus, authorities have established stringent regulations governing drones and their related technologies. For instance, the Federal Aviation Administration (FAA) Regulations (United States) has implemented FAA’s Part 107 regulations that govern the commercial operation of small unmanned aircraft systems (sUAS), commonly known as drones, in the US. These regulations include requirements for drone registration, pilot certification (Remote Pilot Certificate), operational limitations (e.g., altitude and airspace restrictions), and safety precautions. Drones are susceptible to various cyber threats and attacks. Drones for nonmilitary use rely on unencrypted data links for command, control, and navigation, which opens up opportunities for hacking, jamming, interception, and manipulation of drone controls by hackers.

Opportunity: Increasing funding for the development of drones, UAVs, and related technologies

According to Crunchbase, nearly USD ~8 billion was invested in companies developing drones and related technologies between 2018 and 2023. Some of the companies that received funding for developing drones include Zipline (US), Skydio (US), Skyports (US), and Wingcopter (Germany). In February 2023, Skydio, a Silicon Valley-based drone manufacturer, secured USD 230 million in Series E funding. Similarly, in May 2023, Germany-based Wingcopter received USD 44 million from the European Investment Bank to expand its electric unmanned aircraft operations. The company has utilized these funds to deliver essential medicines and supplies to rural areas in Malawi. Additionally, it has initiated a pilot project in Germany aimed at delivering groceries and consumer goods.

Challenge: Unclear government laws related to the drone industry

Unclear or ambiguous regulations regarding drones from government authorities present significant challenges for the drone sensor market players. The absence of clear information fosters uncertainty among businesses, leading to difficulties in understanding legal obligations and compliance risks. As a result, companies may face increased compliance costs, inhibit innovation, and compromise safety. Moreover, inconsistencies in regulations between different jurisdictions can fragment the market and pose logistical challenges for companies operating internationally. Additionally, the absence of clear guidelines exposes businesses to legal liabilities, further reducing investment and hampering market expansion. To overcome these challenges, governments must engage stakeholders, establish clear regulatory frameworks, and provide guidance to encourage the responsible and secure utilization of drones, thereby fostering innovation and driving economic expansion.

Drone Sensor Market Map:

India Drone Market by Map

Inertial sensors are expected to have a significantly larger market size during the forecast period

Inertial sensors, also known as inertial measurement units (IMUs), are electronic devices that measure and report a body's specific force (acceleration) and angular rate (rotation). They are commonly used in various applications, including navigation systems for aircraft, spacecraft, drones, and autonomous vehicles. The inertial sensor market for navigation applications has witnessed significant growth with the expansion of the drone industry. Inertial sensors are crucial for drones, providing precise measurements of acceleration, angular velocity, and orientation, which are essential for stable flight control, navigation, and positioning.

Power monitoring application is expected to grow with significantly high CAGR during the forecast period

Many drone manufacturers are introducing intelligent power management systems to accurately calculate remaining flight time through the battery discharge curve, allowing more effective drone energy control. Smart power management systems also prevent over-discharging of batteries and configure automation that will enable them to perform safe maneuvers in case the drones cannot safely finish their missions due to energy issues.

Consumer segment is expected to have significantly large market size during the forecast period

Relaxation of strict norms related to drones and the ready availability of competitively priced drones online are key factors driving the expansion of the consumer end-user industry in the market. Hobbyist drones that meet specific weight criteria and adhere to established rules can be operated legally without legal consequences. Consumer drones do not need FAA approval in the US if flown in private spaces. As enthusiasts increasingly use drones for photography, data collection, and drone racing, the technology, particularly the sensors within these personal drones, continues to advance significantly. The rising need for sensors for better navigation and quick response by consumer drones is expected to boost the growth of the IMU sensor segment. The increasing demand for autopilot mode in personal drones will drive the markets for collision detection & avoidance and speed & distance sensors used in consumer drones during the forecast period.

Asia Pacific to grow with highest CAGR during the forecast period.

The growth of the drone sensor market in the Asia Pacific can be attributed to the rise in military spending (defense and homeland security) of the countries in the region to enhance their defense capabilities. Moreover, political tensions in countries of Asia Pacific have led to the deployment of drones to ensure the security of their borders. This is one of the most significant factors driving the growth of the drone sensor industry in the region. The retail and e-commerce sectors dominate Asia Pacific, followed by the healthcare and pharmaceutical sectors. China and Japan are critical markets for drones used in commercial applications.

Drone Sensor Market by Region

Drone Sensor Market by Region

To know about the assumptions considered for the study, download the pdf brochure

Key Drone Sensor Market Players 

The drone sensor companies is dominated by a few globally established players such

Want to explore hidden markets that can drive new revenue in Drone Sensor Market?

Scope of the Report
- Drone Sensor Market

Report Metric

Details

Estimated Market Size USD 1.4 billion in 2024
Projected Market Size
USD 2.5 billion by 2029
Market Growth Rate at a CAGR of 12.1% 

Market size available for years

2020-2029

Base year considered

2023

Forecast period

2024–2029

Forecast units

Value (USD Million/Billion)

Segments Covered

By Sensor Type, By Application, By Platform Type, By End User Industry, By Region

Region covered

North America, Europe, Asia Pacific, and RoW

Companies covered

The major players include TE Connectivity (US), Drone Nerds Enterprise (US), RTX (US), Trimble Inc. (US), InvenSense (US), Bosch Sensortec GmbH (Germany), Sparton (US), ams-OSRAM AG (Austria), Teledyne FLIR LLC. (US), Hottinger Brüel & Kjær (HBK) (Denmark), LeddarTech (Canada), YOST LABS (US), SBG SYSTEMS (France), Velodyne Lidar Inc. (US), Sony Semiconductor Manufacturing Corporation (Japan), QuestUAV (UK), Sensirion AG (Switzerland), Aerotenna (US), Swift Navigation Inc. (US), Unmanned Experts Inc. (US), Dynetics, Inc. (US), Kespry (US), GRIFFON AEROSPACE (US), MICRODRONES (Germany), and  Autel Robotics (US). 

Drone Sensor Market Highlights

This research report categorizes the overall drone sensor market on the basis of sensor type, platform type, application type, End User Industries, and geography.

Segment

Subsegment

By Sensor Type

  • Inertial Sensors
  • Image Sensors
  • Speed and Distance Sensors
  • Position Sensors
  • Pressure Sensors
  • Current Sensors
  • Ultrasonic Sensors
  • Light Sensors
  • Altimeter Sensors
  • Flow Sensors
  • Other Sensors

By Platform Type

  • VTOL
  • Fixed Wing
  • Hybrid

By Application Type

  • Navigation
  • Collision Detection and Avoidance
  • Data Acquisition
  • Motion Detection
  • Air Pressure Measurement
  • Power Monitoring
  • Other Applications

By End-User Industry

  • Energy & Utilities
  • Precision Agriculture
  • Media & Entertainment
  • Defense
  • Consumer
  • Law Enforcement
  • Security & Surveillance
  • Others End User Industry

By Geography

  • North America
  • Europe
  • Asia Pacific
  • RoW

Recent Developments

  • In April 2024, InvenSense announced the complete distribution availability of its InvenSense SmartSonic ICU-10201 ultrasonic time-of-flight (ToF) sensor featuring on-chip processing. This advancement enables the development of high-performance, low-power Internet of Things (IoT) and robotics products. The ICU-10201 sensor provides the necessary sensitivity for precise obstacle avoidance or proximity sensing, commonly utilized in robotics, drones, and robot vacuum cleaners (RVC) devices. Additionally, it is highly applicable for products requiring level sensing, such as liquid dispensers or coffee machines.
  • In January 2024, Bosch Sensortec GmbH launched the BMA530 and BMA580, the world’s smallest accelerometers. These new accelerometers give manufacturers more ways to create powerful features in super-small devices.
  • In October 2022, Teledyne acquired ETM-Electromatic Inc., based in Newark, US. Specializing in high-voltage, high-power microwave, and high-energy X-ray products, ETM brings expertise to diverse markets, including medical, security, communications, radar/EW, and test/measurement.
  • In April 2022, Bosch acquired Arioso Systems, a German company specializing in MEMS micro speakers, aiming to solidify its dominance in sensor solutions for consumer electronics.

Frequently Asked Questions (FAQs) Addressed by the Report:

To speak to our analyst for a discussion on the above findings, click Speak to Analyst

Exclusive indicates content/data unique to MarketsandMarkets and not available with any competitors.

INTRODUCTION
24
RESEARCH METHODOLOGY
29
EXECUTIVE SUMMARY
39
PREMIUM INSIGHTS
44
MARKET OVERVIEW
49
  • 5.1 INTRODUCTION
  • 5.2 MARKET DYNAMICS
    DRIVERS
    - Growing need for high-resolution imaging and accurate positioning of locations
    - Increasing demand for drones in agriculture industry
    - Incorporation of safety features into drones
    - Rising use of drones and UAVs for payload delivery
    RESTRAINTS
    - Tampering/hacking of drones
    OPPORTUNITIES
    - Increasing funding for development of drones, UAVs, and related technologies
    CHALLENGES
    - Unclear government laws related to drone industry
  • 5.3 TRENDS/DISRUPTIONS IMPACTING CUSTOMERS’ BUSINESSES
  • 5.4 PRICING ANALYSIS
    AVERAGE SELLING PRICE (ASP) TREND, BY SENSOR TYPE
    AVERAGE SELLING PRICE (ASP) TREND OF KEY PLAYERS, BY END-USER INDUSTRY
  • 5.5 OPERATIONAL DATA
  • 5.6 VALUE CHAIN ANALYSIS
  • 5.7 ECOSYSTEM ANALYSIS
  • 5.8 INVESTMENT AND FUNDING SCENARIO
  • 5.9 TECHNOLOGY ANALYSIS
    KEY TECHNOLOGY
    - RF communication
    COMPLIMENTARY TECHNOLOGY
    - Satellite communication
    ADJACENT TECHNOLOGY
    - Wi-Fi
  • 5.10 TECHNOLOGY ROADMAP
  • 5.11 PATENT ANALYSIS
  • 5.12 TRADE ANALYSIS
    IMPORT SCENARIO (HS CODE 8806)
    EXPORT SCENARIO (HS CODE 8806)
  • 5.13 KEY CONFERENCES AND EVENTS, 2024–2025
  • 5.14 CASE STUDY ANALYSIS
    TATA POWER USED DRONES FOR GIS MAPPING OF ASSETS IN DISCOM, ODISHA, INDIA
    LANCASTER FARMING USED PRECISIONHAWK DRONE EQUIPPED WITH MULTI-SPECTRAL SENSOR TO MONITOR HEALTH AND YIELD OF CROPS
    FLIR PROVIDES THERMAL IMAGING SENSORS FOR DRONES USED IN SEARCH AND RESCUE OPERATIONS
  • 5.15 REGULATORY LANDSCAPE
    REGULATORY BODIES, GOVERNMENT AGENCIES, AND OTHER ORGANIZATIONS
  • 5.16 PORTER’S FIVE FORCES ANALYSIS
    INTENSITY OF COMPETITIVE RIVALRY
    BARGAINING POWER OF SUPPLIERS
    BARGAINING POWER OF BUYERS
    THREAT OF SUBSTITUTES
    THREAT OF NEW ENTRANTS
  • 5.17 KEY STAKEHOLDERS AND BUYING CRITERIA
    KEY STAKEHOLDERS IN BUYING PROCESS
    BUYING CRITERIA
  • 5.18 TECHNOLOGICAL TRENDS IN DRONE SENSOR MARKET
  • 5.19 IMPACT OF MEGATRENDS
  • 5.20 TECHNICAL SPECIFICATIONS OF DRONES
  • 5.21 DRONE SENSOR TECHNOLOGY ANALYSIS
DRONE SENSOR MARKET, BY SENSOR TYPE
77
  • 6.1 INTRODUCTION
  • 6.2 INERTIAL SENSORS
    NAVIGATIONAL IMPORTANCE AND ABILITY TO ENABLE STABLE FLIGHT TO DRIVE DEMAND
    - Accelerometer
    - Gyroscope
    - Magnetometer
    - Tilt
  • 6.3 IMAGE SENSORS
    GROWING USE IN LOW-COST CONSUMER DRONES TO DRIVE MARKET
    - Infrared
    - Thermal
    - Multi-spectral
    - 3D image
  • 6.4 SPEED & DISTANCE SENSORS
    INCREASING APPLICATIONS TO GATHER DETAILED INFORMATION ABOUT ENVIRONMENT AND CREATE 3D TERRAIN MAPS FOR SURVEYING TO FUEL MARKET GROWTH
    - Radar
    - LiDAR
    - Proximity
  • 6.5 POSITION SENSORS
    ABILITY TO BETTER POSITION AND PRECISELY PERFORM LOCATION MAPPING TO FUEL DEMAND
    - Global positioning system (GPS)
    - Global navigation satellite system (GNSS)
  • 6.6 PRESSURE SENSORS
    CAPABILITY TO OFFER ESSENTIAL ALTITUDE DATA FOR IMPROVING FLIGHT STABILITY AND LANDING ACCURACY TO DRIVE DEMAND
    - Barometric
    - Differential
  • 6.7 CURRENT SENSORS
    ABILITY TO MONITOR CURRENT USAGE OF DRONES AND ENSURE SAFE RETURN TO DRIVE DEMAND
  • 6.8 ULTRASONIC SENSORS
    POTENTIAL TO AVOID COLLISION IN COMPLEX ENVIRONMENTS TO DRIVE MARKET
  • 6.9 LIGHT SENSORS
    INCREASING APPLICATIONS IN INDOOR UNITS SUCH AS WAREHOUSES TO FUEL MARKET GROWTH
  • 6.10 ALTIMETER SENSORS
    RISING USE FOR SURVEYING, MAPPING, AND PRECISION AGRICULTURE APPLICATIONS TO DRIVE MARKET
  • 6.11 FLOW SENSORS
    INCREASING APPLICATIONS IN MONITORING SMALL GAS ENGINES USED TO POWER DRONES TO FUEL MARKET GROWTH
  • 6.12 OTHER SENSOR TYPES
    FOURIER-TRANSFORM INFRARED (FTIR) SPECTROSCOPY
    INFRARED (IR) LINE SCANNER
    GAS IMAGING
DRONE SENSOR MARKET, BY APPLICATION
99
  • 7.1 INTRODUCTION
  • 7.2 NAVIGATION
    GROWING ADOPTION OF ACCELEROMETER, PYROMETER, MAGNETOMETER, AND TILT DRONE SENSORS FOR NAVIGATION AND COLLECTION OF REAL-TIME DATA TO DRIVE MARKET
  • 7.3 COLLISION DETECTION & AVOIDANCE
    RISING USE OF DIFFERENT SENSORS IN COMBINATION TO AVOID COLLISION AND ENSURE RELIABLE DRONE OPERATION TO DRIVE MARKET
    - Sensor fusion
    - Obstacle avoidance algorithm
    - Slam technology
  • 7.4 DATA ACQUISITION
    SURGING DEMAND FOR DATA TO IMPROVE DECISION-MAKING, OPTIMIZE PROCESSES, AND GAIN VALUABLE INSIGHTS TO DRIVE DEMAND
  • 7.5 MOTION DETECTION
    INCREASING APPLICATIONS IN SECURITY & SURVEILLANCE INDUSTRY TO DRIVE MARKET
  • 7.6 AIR PRESSURE MEASUREMENT
    GROWING DEMAND FOR STABLE, PRECISE, AND AUTONOMOUS DRONES IN VARIOUS APPLICATIONS TO DRIVE MARKET
    - Altitude calculation
    - Air speed measurement
  • 7.7 POWER MONITORING
    GROWING NEED FOR LONG-RANGE AND LONG-DURATION DRONE FLIGHTS TO DRIVE MARKET
  • 7.8 OTHER APPLICATIONS
DRONE SENSOR MARKET, BY PLATFORM TYPE
110
  • 8.1 INTRODUCTION
  • 8.2 VERTICAL TAKE-OFF AND LANDING (VTOL)
    ABILITY TO NAVIGATE IN DIFFICULT TERRAIN AND PROVIDE AERIAL VIEW DURING SEARCH AND RESCUE OPERATIONS TO DRIVE DEMAND
  • 8.3 FIXED WING
    GROWING USE IN PRECISION AGRICULTURE APPLICATIONS TO DRIVE MARKET
  • 8.4 HYBRID
    EXTENDED FLIGHT TIME FEATURE TO DRIVE DEMAND
DRONE SENSOR MARKET, BY END-USER INDUSTRY
116
  • 9.1 INTRODUCTION
  • 9.2 MEDIA & ENTERTAINMENT
    TREND OF LIVE PERFORMANCES AND EXPERIENTIAL MARKETING TO DRIVE MARKET
  • 9.3 ENERGY & UTILITIES
    GROWING NEED FOR SURVEILLANCE AND INSPECTION TO DRIVE DEMAND
  • 9.4 PRECISION AGRICULTURE
    INTEGRATION OF ADVANCED SENSORS AND IMAGING TECHNOLOGIES INTO DRONES TO FUEL DEMAND
  • 9.5 CONSUMER
    RELAXATION OF STRICT REGULATIONS RELATED TO DRONES AND ADVANCEMENTS IN DRONE TECHNOLOGY TO DRIVE MARKET
  • 9.6 DEFENSE
    RISING NEED FOR COST-EFFECTIVE DEFENSE SYSTEMS AND EVOLVING WARFARE TECHNIQUES TO DRIVE DEMAND
  • 9.7 LAW ENFORCEMENT
    INCREASING DEMAND FOR ADVANCED UAV DRONES TO DRIVE MARKET
  • 9.8 SECURITY & SURVEILLANCE
    GROWING NEED FOR ENHANCED SECURITY MEASURES AND REAL-TIME SURVEILLANCE TO DRIVE MARKET
  • 9.9 OTHERS END-USER INDUSTRIES
DRONE SENSOR MARKET, BY REGION
133
  • 10.1 INTRODUCTION
  • 10.2 NORTH AMERICA
    PESTEL ANALYSIS: NORTH AMERICA
    US
    - Increasing investments in development of new weapon systems and platforms to drive market
    CANADA
    - Strict government regulations and continuous development of energy sector to fuel market growth
    MEXICO
    - Increasing applications in border security to drive market
    IMPACT OF RECESSION ON DRONE SENSOR MARKET IN NORTH AMERICA
  • 10.3 EUROPE
    PESTEL ANALYSIS: EUROPE
    FRANCE
    - Government-led initiatives to increase security across borders and improve surveillance and intelligence units to boost market growth
    UK
    - Technological advancements in drone technology to drive demand
    GERMANY
    - Increased adoption of drones in defense sector to drive market
    ITALY
    - Rising use of drones for ultra-fast deliveries to drive market
    RUSSIA
    - Increased defense spending to boost demand
    REST OF EUROPE
    IMPACT OF RECESSION ON DRONE SENSOR MARKET IN EUROPE
  • 10.4 ASIA PACIFIC
    PESTLE ANALYSIS: ASIA PACIFIC
    CHINA
    - Booming drone industry to drive market
    JAPAN
    - Rising applications in package delivery to drive market
    INDIA
    - Consistent efforts to develop frameworks for drone applications to drive market
    SOUTH KOREA
    - Rising funding for research and development and establishment of drone testbed infrastructure to drive market
    AUSTRALIA
    - Increasing commercial applications of drones to fuel market growth
    REST OF ASIA PACIFIC
    IMPACT OF RECESSION ON DRONE SENSOR MARKET IN ASIA PACIFIC
  • 10.5 ROW
    PESTEL ANALYSIS: ROW
    SOUTH AMERICA
    - Rising applications in drug trafficking monitoring to fuel market growth
    GCC
    - Increasing demand for security & surveillance applications to propel market
    REST OF MIDDLE EAST & AFRICA
    IMPACT OF RECESSION ON DRONE SENSOR MARKET IN ROW
COMPETITIVE LANDSCAPE
171
  • 11.1 OVERVIEW
  • 11.2 KEY STRENGTHS/RIGHT TO WIN, 2020–2023
  • 11.3 REVENUE ANALYSIS, 2023
  • 11.4 MARKET SHARE ANALYSIS, 2023
  • 11.5 COMPANY VALUATION AND FINANCIAL METRICS, 2024
  • 11.6 BRAND/PRODUCT COMPARATIVE ANALYSIS
  • 11.7 COMPANY EVALUATION MATRIX: KEY PLAYERS, 2023
    STARS
    EMERGING LEADERS
    PERVASIVE PLAYERS
    PARTICIPANTS
    COMPANY FOOTPRINT: KEY PLAYERS, 2023
    - Overall footprint
    - Sensor type footprint
    - Application footprint
    - End-user industry footprint
    - Region footprint
  • 11.8 COMPANY EVALUATION MATRIX: KEY STARTUPS/SMES, 2023
    PROGRESSIVE COMPANIES
    RESPONSIVE COMPANIES
    DYNAMIC COMPANIES
    STARTING BLOCKS
    COMPETITIVE BENCHMARKING: KEY STARTUPS/SMES, 2023
    - List of key startups/SMEs
    - Competitive benchmarking of key startups/SMEs
  • 11.9 COMPETITIVE SCENARIOS AND TRENDS
    PRODUCT LAUNCHES
    DEALS
    OTHERS
COMPANY PROFILES
191
  • 12.1 KEY PLAYERS
    TE CONNECTIVITY
    - Business overview
    - Products/Solutions/Services offered
    - Recent developments
    - MnM view
    DRONE NERDS ENTERPRISE
    - Business overview
    - Products/Solutions/Services offered
    RTX
    - Business overview
    - Products/Solutions/Services offered
    - Recent developments
    - MnM view
    TRIMBLE INC.
    - Business overview
    - Products/Solutions/Services offered
    - Recent developments
    - MnM view
    INVENSENSE
    - Business overview
    - Products/Solutions/Services offered
    - Recent developments
    - MnM view
    BOSCH SENSORTEC GMBH
    - Business overview
    - Products/Solutions/Services offered
    - Recent developments
    - MnM view
    SPARTON
    - Business overview
    - Products/Solutions/Services offered
    - Recent developments
    AMS-OSRAM AG
    - Business overview
    - Products/Solutions/Services offered
    - Recent developments
    TELEDYNE FLIR LLC
    - Business overview
    - Products/Solutions/Services offered
    - Recent developments
    HBK, INC.
    - Business overview
    - Products/Solutions/Services offered
    - Recent developments
  • 12.2 OTHER PLAYERS
    LEDDARTECH HOLDINGS INC.
    YOST LABS
    SBS SYSTEMS
    VELODYNE LIDAR, INC.
    SONY SEMICONDUCTOR MANUFACTURING CORPORATION
    QUESTUAV
    SENSIRION AG
    AEROTENNA
    SWIFT NAVIGATION INC.
    UNMANNED EXPERTS INC. (UMEX)
    DYNETICS, INC.
    KESPRY
    GRIFFON AEROSPACE
    MICRODRONES
    AUTEL ROBOTICS
APPENDIX
234
  • 13.1 DISCUSSION GUIDE
  • 13.2 KNOWLEDGESTORE: MARKETSANDMARKETS’ SUBSCRIPTION PORTAL
  • 13.3 CUSTOMIZATION OPTIONS
  • 13.4 RELATED REPORTS
  • 13.5 AUTHOR DETAILS
LIST OF TABLES
 
  • TABLE 1 AVERAGE SELLING PRICE (ASP) TREND OF DRONE SENSORS, BY SENSOR TYPE, 2020–2029 (USD)
  • TABLE 2 ROLES OF COMPANIES IN DRONE SENSOR ECOSYSTEM
  • TABLE 3 PATENT REGISTRATIONS RELATED TO DRONE SENSORS, 2020–2024
  • TABLE 4 TOP 20 PATENT OWNERS IN LAST 10 YEARS, 2014–2024
  • TABLE 5 DRONE SENSOR MARKET: KEY CONFERENCES AND EVENTS, 2024–2025
  • TABLE 6 NORTH AMERICA: REGULATORY BODIES, GOVERNMENT AGENCIES, AND OTHER ORGANIZATIONS
  • TABLE 7 EUROPE: REGULATORY BODIES, GOVERNMENT AGENCIES, AND OTHER ORGANIZATIONS
  • TABLE 8 ASIA PACIFIC: REGULATORY BODIES, GOVERNMENT AGENCIES, AND OTHER ORGANIZATIONS
  • TABLE 9 MIDDLE EAST: REGULATORY BODIES, GOVERNMENT AGENCIES, AND OTHER ORGANIZATIONS
  • TABLE 10 DRONE SENSOR MARKET: PORTER’S FIVE FORCES ANALYSIS
  • TABLE 11 INFLUENCE OF STAKEHOLDERS ON BUYING PROCESS FOR TOP THREE END-USER INDUSTRIES (%)
  • TABLE 12 KEY BUYING CRITERIA FOR TOP THREE END-USER INDUSTRIES
  • TABLE 13 TECHNICAL SPECIFICATIONS OF DRONES BY SIZE, WEIGHT, AND PAYLOAD CAPACITY
  • TABLE 14 DRONE SENSOR MARKET, BY SENSOR TYPE, 2020–2023 (USD MILLION)
  • TABLE 15 DRONE SENSOR MARKET, BY SENSOR TYPE, 2024–2029 (USD MILLION)
  • TABLE 16 DRONE SENSOR MARKET, BY SENSOR TYPE, 2020–2023 (MILLION UNITS)
  • TABLE 17 DRONE SENSOR MARKET, BY SENSOR TYPE, 2024–2029 (MILLION UNITS)
  • TABLE 18 INERTIAL SENSORS: DRONE SENSOR MARKET, BY APPLICATION, 2020–2023 (USD MILLION)
  • TABLE 19 INERTIAL SENSORS: DRONE SENSOR MARKET, BY APPLICATION, 2024–2029 (USD MILLION)
  • TABLE 20 IMAGE SENSORS: DRONE SENSOR MARKET, BY APPLICATION, 2020–2023 (USD MILLION)
  • TABLE 21 IMAGE SENSORS: DRONE SENSOR MARKET, BY APPLICATION, 2024–2029 (USD MILLION)
  • TABLE 22 SPEED & DISTANCE SENSORS: DRONE SENSOR MARKET, BY APPLICATION, 2020–2023 (USD MILLION)
  • TABLE 23 SPEED & DISTANCE SENSORS: DRONE SENSOR MARKET, BY APPLICATION, 2024–2029 (USD MILLION)
  • TABLE 24 POSITION SENSORS: DRONE SENSOR MARKET, BY APPLICATION, 2020–2023 (USD MILLION)
  • TABLE 25 POSITION SENSORS: DRONE SENSOR MARKET, BY APPLICATION, 2024–2029 (USD MILLION)
  • TABLE 26 PRESSURE SENSORS: DRONE SENSOR MARKET, BY APPLICATION, 2020–2023 (USD MILLION)
  • TABLE 27 PRESSURE SENSORS: DRONE SENSOR MARKET, BY APPLICATION, 2024–2029 (USD MILLION)
  • TABLE 28 CURRENT SENSORS: DRONE SENSOR MARKET, BY APPLICATION, 2020–2023 (USD MILLION)
  • TABLE 29 CURRENT SENSORS: DRONE SENSOR MARKET, BY APPLICATION, 2024–2029 (USD MILLION)
  • TABLE 30 ULTRASONIC SENSORS: DRONE SENSOR MARKET, BY APPLICATION, 2020–2023 (USD MILLION)
  • TABLE 31 ULTRASONIC SENSORS: DRONE SENSOR MARKET, BY APPLICATION, 2024–2029 (USD MILLION)
  • TABLE 32 LIGHT SENSORS: DRONE SENSOR MARKET, BY APPLICATION, 2020–2023 (USD MILLION)
  • TABLE 33 LIGHT SENSORS: DRONE SENSOR MARKET, BY APPLICATION, 2024–2029 (USD MILLION)
  • TABLE 34 ALTIMETER SENSORS: DRONE SENSOR MARKET, BY APPLICATION, 2020–2023 (USD MILLION)
  • TABLE 35 ALTIMETER SENSORS: DRONE SENSOR MARKET, BY APPLICATION, 2024–2029 (USD MILLION)
  • TABLE 36 FLOW SENSORS: DRONE SENSOR MARKET, BY APPLICATION, 2020–2023 (USD MILLION)
  • TABLE 37 FLOW SENSORS: DRONE SENSOR MARKET, BY APPLICATION, 2024–2029 (USD MILLION)
  • TABLE 38 OTHER SENSOR TYPES: DRONE SENSOR MARKET, BY APPLICATION, 2020–2023 (USD MILLION)
  • TABLE 39 OTHER SENSOR TYPES: DRONE SENSOR MARKET, BY APPLICATION, 2024–2029 (USD MILLION)
  • TABLE 40 DRONE SENSOR MARKET, BY APPLICATION, 2020–2023 (USD MILLION)
  • TABLE 41 DRONE SENSOR MARKET, BY APPLICATION, 2024–2029 (USD MILLION)
  • TABLE 42 NAVIGATION: DRONE SENSOR MARKET, BY SENSOR TYPE, 2020–2023 (USD MILLION)
  • TABLE 43 NAVIGATION: DRONE SENSOR MARKET, BY SENSOR TYPE, 2024–2029 (USD MILLION)
  • TABLE 44 COLLISION DETECTION & AVOIDANCE: DRONE SENSOR MARKET, BY SENSOR TYPE, 2020–2023 (USD MILLION)
  • TABLE 45 COLLISION DETECTION & AVOIDANCE: DRONE SENSOR MARKET, BY SENSOR TYPE, 2024–2029 (USD MILLION)
  • TABLE 46 DATA ACQUISITION: DRONE SENSOR MARKET, BY SENSOR TYPE, 2020–2023 (USD MILLION)
  • TABLE 47 DATA ACQUISITION: DRONE SENSOR MARKET, BY SENSOR TYPE, 2024–2029 (USD MILLION)
  • TABLE 48 MOTION DETECTION: DRONE SENSOR MARKET, BY SENSOR TYPE, 2020–2023 (USD MILLION)
  • TABLE 49 MOTION DETECTION: DRONE SENSOR MARKET, BY SENSOR TYPE, 2024–2029 (USD MILLION)
  • TABLE 50 AIR PRESSURE MEASUREMENT: DRONE SENSOR MARKET, BY SENSOR TYPE, 2020–2023 (USD MILLION)
  • TABLE 51 AIR PRESSURE MEASUREMENT: DRONE SENSOR MARKET, BY SENSOR TYPE, 2024–2029 (USD MILLION)
  • TABLE 52 POWER MONITORING: DRONE SENSOR MARKET, BY SENSOR TYPE, 2020–2023 (USD MILLION)
  • TABLE 53 POWER MONITORING: DRONE SENSOR MARKET, BY SENSOR TYPE, 2024–2029 (USD MILLION)
  • TABLE 54 OTHER APPLICATIONS: DRONE SENSOR MARKET, BY SENSOR TYPE, 2020–2023 (USD MILLION)
  • TABLE 55 OTHER APPLICATIONS: DRONE SENSOR MARKET, BY SENSOR TYPE, 2024–2029 (USD MILLION)
  • TABLE 56 DRONE SENSOR MARKET, BY PLATFORM TYPE, 2020–2023 (USD MILLION)
  • TABLE 57 DRONE SENSOR MARKET, BY PLATFORM TYPE, 2024–2029 (USD MILLION)
  • TABLE 58 DRONE SENSOR MARKET, BY PLATFORM TYPE, 2020–2023 (MILLION UNITS)
  • TABLE 59 DRONE SENSOR MARKET, BY PLATFORM TYPE, 2024–2029 (MILLION UNITS)
  • TABLE 60 VTOL: DRONE SENSOR MARKET, BY REGION, 2020–2023 (USD MILLION)
  • TABLE 61 VTOL: DRONE SENSOR MARKET, BY REGION, 2024–2029 (USD MILLION)
  • TABLE 62 FIXED WING: DRONE SENSOR MARKET, BY REGION, 2020–2023 (USD MILLION)
  • TABLE 63 FIXED WING: DRONE SENSOR MARKET, BY REGION, 2024–2029 (USD MILLION)
  • TABLE 64 HYBRID: DRONE SENSOR MARKET, BY REGION, 2020–2023 (USD MILLION)
  • TABLE 65 HYBRID: DRONE SENSOR MARKET, BY REGION, 2024–2029 (USD MILLION)
  • TABLE 66 DRONE SENSOR MARKET, BY END-USER INDUSTRY, 2020–2023 (USD MILLION)
  • TABLE 67 DRONE SENSOR MARKET, BY END-USER INDUSTRY, 2024–2029 (USD MILLION)
  • TABLE 68 DRONE SENSOR MARKET, BY END-USER INDUSTRY, 2020–2023 (MILLION UNITS)
  • TABLE 69 DRONE SENSOR MARKET, BY END-USER INDUSTRY, 2024–2029 (MILLION UNITS)
  • TABLE 70 MEDIA & ENTERTAINMENT: DRONE SENSOR MARKET, BY SENSOR TYPE, 2020–2023 (USD MILLION)
  • TABLE 71 MEDIA & ENTERTAINMENT: DRONE SENSOR MARKET, BY SENSOR TYPE, 2024–2029 (USD MILLION)
  • TABLE 72 ENERGY & UTILITIES: DRONE SENSOR MARKET, BY SENSOR TYPE, 2020–2023 (USD MILLION)
  • TABLE 73 ENERGY & UTILITIES: DRONE SENSOR MARKET, BY SENSOR TYPE, 2024–2029 (USD MILLION)
  • TABLE 74 PRECISION AGRICULTURE: DRONE SENSOR MARKET, BY SENSOR TYPE, 2020–2023 (USD MILLION)
  • TABLE 75 PRECISION AGRICULTURE: DRONE SENSOR MARKET, BY SENSOR TYPE, 2024–2029 (USD MILLION)
  • TABLE 76 PRECISION AGRICULTURE: DRONE SENSOR MARKET, BY APPLICATION, 2020–2023 (USD MILLION)
  • TABLE 77 PRECISION AGRICULTURE: DRONE SENSOR MARKET, BY APPLICATION, 2024–2029 (USD MILLION)
  • TABLE 78 CONSUMER: DRONE SENSOR MARKET, BY SENSOR TYPE, 2020–2023 (USD MILLION)
  • TABLE 79 CONSUMER: DRONE SENSOR MARKET, BY SENSOR TYPE, 2024–2029 (USD MILLION)
  • TABLE 80 DEFENSE: DRONE SENSOR MARKET, BY SENSOR TYPE, 2020–2023 (USD MILLION)
  • TABLE 81 DEFENSE: DRONE SENSOR MARKET, BY SENSOR TYPE, 2024–2029 (USD MILLION)
  • TABLE 82 LAW ENFORCEMENT: DRONE SENSOR MARKET, BY SENSOR TYPE, 2020–2023 (USD MILLION)
  • TABLE 83 LAW ENFORCEMENT: DRONE SENSOR MARKET, BY SENSOR TYPE, 2024–2029 (USD MILLION)
  • TABLE 84 SECURITY & SURVEILLANCE: DRONE SENSOR MARKET, BY SENSOR TYPE, 2020–2023 (USD MILLION)
  • TABLE 85 SECURITY & SURVEILLANCE: DRONE SENSOR MARKET, BY SENSOR TYPE, 2024–2029 (USD MILLION)
  • TABLE 86 OTHER END-USER INDUSTRIES: DRONE SENSOR MARKET, BY SENSOR TYPE, 2020–2023 (USD MILLION)
  • TABLE 87 OTHER END-USER INDUSTRIES: DRONE SENSOR MARKET, BY SENSOR TYPE, 2024–2029 (USD MILLION)
  • TABLE 88 DRONE SENSOR MARKET, BY REGION, 2020–2023 (USD MILLION)
  • TABLE 89 DRONE SENSOR MARKET, BY REGION, 2024–2029 (USD MILLION)
  • TABLE 90 NORTH AMERICA: DRONE SENSOR MARKET, BY END-USER INDUSTRY, 2020–2023 (USD MILLION)
  • TABLE 91 NORTH AMERICA: DRONE SENSOR MARKET, BY END-USER INDUSTRY, 2024–2029 (USD MILLION)
  • TABLE 92 NORTH AMERICA: DRONE SENSOR MARKET, BY PLATFORM TYPE, 2020–2023 (USD MILLION)
  • TABLE 93 NORTH AMERICA: DRONE SENSOR MARKET, BY PLATFORM TYPE, 2024–2029 (USD MILLION)
  • TABLE 94 NORTH AMERICA: DRONE SENSOR MARKET, BY COUNTRY, 2020–2023 (USD MILLION)
  • TABLE 95 NORTH AMERICA: DRONE SENSOR MARKET, BY COUNTRY, 2024–2029 (USD MILLION)
  • TABLE 96 US: DRONE SENSOR MARKET, BY PLATFORM TYPE, 2020–2023 (USD MILLION)
  • TABLE 97 US: DRONE SENSOR MARKET, BY PLATFORM TYPE, 2024–2029 (USD MILLION)
  • TABLE 98 CANADA: DRONE SENSOR MARKET, BY PLATFORM TYPE, 2020–2023 (USD MILLION)
  • TABLE 99 CANADA: DRONE SENSOR MARKET, BY PLATFORM TYPE, 2024–2029 (USD MILLION)
  • TABLE 100 MEXICO: DRONE SENSOR MARKET, BY PLATFORM TYPE, 2020–2023 (USD MILLION)
  • TABLE 101 MEXICO: DRONE SENSOR MARKET, BY PLATFORM TYPE, 2024–2029 (USD MILLION)
  • TABLE 102 EUROPE: DRONE SENSOR MARKET, BY END-USER INDUSTRY, 2020–2023 (USD MILLION)
  • TABLE 103 EUROPE: DRONE SENSOR MARKET, BY END-USER INDUSTRY, 2024–2029 (USD MILLION)
  • TABLE 104 EUROPE: DRONE SENSOR MARKET, BY PLATFORM TYPE, 2020–2023 (USD MILLION)
  • TABLE 105 EUROPE: DRONE SENSOR MARKET, BY PLATFORM TYPE, 2024–2029 (USD MILLION)
  • TABLE 106 EUROPE: DRONE SENSOR MARKET, BY COUNTRY, 2020–2023 (USD MILLION)
  • TABLE 107 EUROPE: DRONE SENSOR MARKET, BY COUNTRY, 2024–2029 (USD MILLION)
  • TABLE 108 FRANCE: DRONE SENSOR MARKET, BY PLATFORM TYPE, 2020–2023 (USD MILLION)
  • TABLE 109 FRANCE: DRONE SENSOR MARKET, BY PLATFORM TYPE, 2024–2029 (USD MILLION)
  • TABLE 110 UK: DRONE SENSOR MARKET, BY PLATFORM TYPE, 2020–2023 (USD MILLION)
  • TABLE 111 UK: DRONE SENSOR MARKET, BY PLATFORM TYPE, 2024–2029 (USD MILLION)
  • TABLE 112 GERMANY: DRONE SENSOR MARKET, BY PLATFORM TYPE, 2020–2023 (USD MILLION)
  • TABLE 113 GERMANY: DRONE SENSOR MARKET, BY PLATFORM TYPE, 2024–2029 (USD MILLION)
  • TABLE 114 ITALY: DRONE SENSOR MARKET, BY PLATFORM TYPE, 2020–2023 (USD MILLION)
  • TABLE 115 ITALY: DRONE SENSOR MARKET, BY PLATFORM TYPE, 2024–2029 (USD MILLION)
  • TABLE 116 RUSSIA: DRONE SENSOR MARKET, BY PLATFORM TYPE, 2020–2023 (USD MILLION)
  • TABLE 117 RUSSIA: DRONE SENSOR MARKET, BY PLATFORM TYPE, 2024–2029 (USD MILLION)
  • TABLE 118 REST OF EUROPE: DRONE SENSOR MARKET, BY PLATFORM TYPE, 2020–2023 (USD MILLION)
  • TABLE 119 REST OF EUROPE: DRONE SENSOR MARKET, BY PLATFORM TYPE, 2024–2029 (USD MILLION)
  • TABLE 120 ASIA PACIFIC: DRONE SENSOR MARKET, BY END-USER INDUSTRY, 2020–2023 (USD MILLION)
  • TABLE 121 ASIA PACIFIC: DRONE SENSOR MARKET, BY END-USER INDUSTRY, 2024–2029 (USD MILLION)
  • TABLE 122 ASIA PACIFIC: DRONE SENSOR MARKET, BY PLATFORM TYPE, 2020–2023 (USD MILLION)
  • TABLE 123 ASIA PACIFIC: DRONE SENSOR MARKET, BY PLATFORM TYPE, 2024–2029 (USD MILLION)
  • TABLE 124 ASIA PACIFIC: DRONE SENSOR MARKET, BY COUNTRY, 2020–2023 (USD MILLION)
  • TABLE 125 ASIA PACIFIC: DRONE SENSOR MARKET, BY COUNTRY, 2024–2029 (USD MILLION)
  • TABLE 126 CHINA: DRONE SENSOR MARKET, BY PLATFORM TYPE, 2020–2023 (USD MILLION)
  • TABLE 127 CHINA: DRONE SENSOR MARKET, BY PLATFORM TYPE, 2024–2029 (USD MILLION)
  • TABLE 128 JAPAN: DRONE SENSOR MARKET, PLATFORM TYPE, 2020–2023 (USD MILLION)
  • TABLE 129 JAPAN: DRONE SENSOR MARKET, PLATFORM TYPE, 2024–2029 (USD MILLION)
  • TABLE 130 INDIA: DRONE SENSOR MARKET, BY PLATFORM TYPE, 2020–2023 (USD MILLION)
  • TABLE 131 INDIA: DRONE SENSOR MARKET, BY PLATFORM TYPE, 2024–2029 (USD MILLION)
  • TABLE 132 SOUTH KOREA: DRONE SENSOR MARKET, BY PLATFORM TYPE, 2020–2023 (USD MILLION)
  • TABLE 133 SOUTH KOREA: DRONE SENSOR MARKET, BY PLATFORM TYPE, 2024–2029 (USD MILLION)
  • TABLE 134 AUSTRALIA: DRONE SENSOR MARKET, BY PLATFORM TYPE, 2020–2023 (USD MILLION)
  • TABLE 135 AUSTRALIA: DRONE SENSOR MARKET, BY PLATFORM TYPE, 2024–2029 (USD MILLION)
  • TABLE 136 REST OF ASIA PACIFIC: DRONE SENSOR MARKET, BY PLATFORM TYPE, 2020–2023 (USD MILLION)
  • TABLE 137 REST OF ASIA PACIFIC: DRONE SENSOR MARKET, BY PLATFORM TYPE, 2024–2029 (USD MILLION)
  • TABLE 138 ROW: DRONE SENSOR MARKET, BY END-USER INDUSTRY, 2020–2023 (USD MILLION)
  • TABLE 139 ROW: DRONE SENSOR MARKET, BY END-USER INDUSTRY, 2024–2029 (USD MILLION)
  • TABLE 140 ROW: DRONE SENSOR MARKET, BY PLATFORM TYPE, 2020–2023 (USD MILLION)
  • TABLE 141 ROW: DRONE SENSOR MARKET, BY PLATFORM TYPE, 2024–2029 (USD MILLION)
  • TABLE 142 ROW: DRONE SENSOR MARKET, BY REGION/COUNTRY, 2020–2023 (USD MILLION)
  • TABLE 143 ROW: DRONE SENSOR MARKET, BY REGION/COUNTRY, 2024–2029 (USD MILLION)
  • TABLE 144 SOUTH AMERICA: DRONE SENSOR MARKET, BY PLATFORM TYPE, 2020–2023 (USD MILLION)
  • TABLE 145 SOUTH AMERICA: DRONE SENSOR MARKET, BY PLATFORM TYPE, 2024–2029 (USD MILLION)
  • TABLE 146 GCC: DRONE SENSOR MARKET, BY PLATFORM TYPE, 2020–2023 (USD MILLION)
  • TABLE 147 GCC: DRONE SENSOR MARKET, BY PLATFORM TYPE, 2024–2029 (USD MILLION)
  • TABLE 148 REST OF MIDDLE EAST & AFRICA: DRONE SENSOR MARKET, BY PLATFORM TYPE, 2020–2023 (USD MILLION)
  • TABLE 149 REST OF MIDDLE EAST & AFRICA: DRONE SENSOR MARKET, BY PLATFORM TYPE, 2024–2029 (USD MILLION)
  • TABLE 150 DRONE SENSOR MARKET: OVERVIEW OF STRATEGIES ADOPTED BY KEY PLAYERS, 2020–2023
  • TABLE 151 DRONE SENSOR MARKET: DEGREE OF COMPETITION, 2023
  • TABLE 152 DRONE SENSOR MARKET: RANKING ANALYSIS, 2023
  • TABLE 153 DRONE SENSOR MARKET: SENSOR TYPE FOOTPRINT
  • TABLE 154 DRONE SENSOR MARKET: APPLICATION FOOTPRINT
  • TABLE 155 DRONE SENSOR MARKET: END-USER INDUSTRY FOOTPRINT
  • TABLE 156 DRONE SENSOR MARKET: REGION FOOTPRINT
  • TABLE 157 DRONE SENSOR MARKET: LIST OF KEY STARTUPS/SMES
  • TABLE 158 DRONE SENSOR MARKET: COMPETITIVE BENCHMARKING OF KEY STARTUPS/SMES
  • TABLE 159 DRONE SENSOR MARKET: PRODUCT LAUNCHES, JANUARY 2020–APRIL 2024
  • TABLE 160 DRONE SENSOR MARKET: DEALS, JANUARY 2020–APRIL 2024
  • TABLE 161 DRONE SENSOR MARKET: OTHERS, JANUARY 2020–APRIL 2024
  • TABLE 162 TE CONNECTIVITY: COMPANY OVERVIEW
  • TABLE 163 TE CONNECTIVITY: PRODUCTS/SOLUTIONS/SERVICES OFFERED
  • TABLE 164 TE CONNECTIVITY: PRODUCT LAUNCHES
  • TABLE 165 TE CONNECTIVITY: DEALS
  • TABLE 166 DRONE NERDS ENTERPRISE: COMPANY OVERVIEW
  • TABLE 167 DRONE NERDS ENTERPRISE: PRODUCTS/SOLUTIONS/SERVICES OFFERED
  • TABLE 168 RTX: COMPANY OVERVIEW
  • TABLE 169 RTX: PRODUCTS/SOLUTIONS/SERVICES OFFERED
  • TABLE 170 RTX: OTHERS
  • TABLE 171 RTX: EXPANSIONS
  • TABLE 172 TRIMBLE INC.: COMPANY OVERVIEW
  • TABLE 173 TRIMBLE INC.: PRODUCTS/SOLUTIONS/SERVICES OFFERED
  • TABLE 174 TRIMBLE INC.: PRODUCT LAUNCHES
  • TABLE 175 TRIMBLE INC.: DEALS
  • TABLE 176 INVENSENSE: COMPANY OVERVIEW
  • TABLE 177 INVENSENSE: PRODUCTS/SOLUTIONS/SERVICES OFFERED
  • TABLE 178 INVENSENSE: PRODUCT LAUNCHES
  • TABLE 179 INVENSENSE: OTHERS
  • TABLE 180 BOSCH SENSORTEC GMBH: COMPANY OVERVIEW
  • TABLE 181 BOSCH SENSORTEC GMBH: PRODUCTS/SOLUTIONS/SERVICES OFFERED
  • TABLE 182 BOSCH SENSORTEC GMBH: PRODUCT LAUNCHES
  • TABLE 183 BOSCH SENSORTEC GMBH: DEALS
  • TABLE 184 SPARTON: COMPANY OVERVIEW
  • TABLE 185 SPARTON: PRODUCTS/SOLUTIONS/SERVICES OFFERED
  • TABLE 186 SPARTON: DEALS
  • TABLE 187 SPARTON: OTHERS
  • TABLE 188 AMS-OSRAM AG: COMPANY OVERVIEW
  • TABLE 189 AMS-OSRAM AG: PRODUCTS/SOLUTIONS/SERVICES OFFERED
  • TABLE 190 AMS-OSRAM AG: PRODUCT LAUNCHES
  • TABLE 191 AMS-OSRAM AG: OTHERS
  • TABLE 192 TELEDYNE FLIR LLC.: COMPANY OVERVIEW
  • TABLE 193 TELEDYNE FLIR LLC.: PRODUCTS/SOLUTIONS/SERVICES OFFERED
  • TABLE 194 TELEDYNE FLIR LLC.: PRODUCT LAUNCHES
  • TABLE 195 TELEDYNE FLIR LLC.: DEALS
  • TABLE 196 TELEDYNE FLIR LLC.: OTHERS
  • TABLE 197 HBK, INC.: COMPANY OVERVIEW
  • TABLE 198 HBK, INC.: PRODUCTS/SOLUTIONS/SERVICES OFFERED
  • TABLE 199 HBK, INC.: PRODUCT LAUNCHES
LIST OF FIGURES
 
  • FIGURE 1 DRONE SENSOR MARKET SEGMENTATION
  • FIGURE 2 DRONE SENSOR MARKET ESTIMATION: PROCESS FLOW
  • FIGURE 3 RESEARCH DESIGN
  • FIGURE 4 MARKET SIZE ESTIMATION METHODOLOGY: BOTTOM-UP APPROACH
  • FIGURE 5 MARKET SIZE ESTIMATION METHODOLOGY: TOP-DOWN APPROACH
  • FIGURE 6 DATA TRIANGULATION
  • FIGURE 7 SPEED & DISTANCE SENSOR SEGMENT TO ACCOUNT FOR LARGEST SHARE OF DRONE SENSOR MARKET IN 2029
  • FIGURE 8 VTOL SEGMENT TO ACCOUNT FOR LARGEST SHARE OF DRONE SENSOR MARKET IN 2029
  • FIGURE 9 DEFENSE SEGMENT TO ACCOUNT FOR LARGEST SHARE OF DRONE SENSOR MARKET IN 2029
  • FIGURE 10 DATA ACQUISITION SEGMENT TO REGISTER HIGHEST CAGR DURING FORECAST PERIOD
  • FIGURE 11 ASIA PACIFIC DRONE SENSOR MARKET TO REGISTER HIGHEST CAGR DURING FORECAST PERIOD
  • FIGURE 12 TECHNOLOGICAL ADVANCEMENTS IN DRONES AND RISING USE IN DEFENSE AND PRECISION AGRICULTURE END-USER INDUSTRIES TO CREATE LUCRATIVE OPPORTUNITIES FOR MARKET PLAYERS
  • FIGURE 13 SPEED & DISTANCE SENSORS SEGMENT TO ACCOUNT FOR LARGEST MARKET SHARE IN 2029
  • FIGURE 14 VTOL SEGMENT AND CHINA HELD LARGEST SHARES OF ASIA PACIFIC DRONE SENSOR MARKET IN 2023
  • FIGURE 15 DATA ACQUISITION SEGMENT TO ACCOUNT FOR LARGEST MARKET SHARE IN 2029
  • FIGURE 16 DEFENSE SEGMENT TO ACCOUNT FOR LARGEST MARKET SHARE IN 2029
  • FIGURE 17 INDIA TO REGISTER HIGHEST CAGR DURING FORECAST PERIOD
  • FIGURE 18 DRONE SENSOR MARKET: DRIVERS, RESTRAINTS, OPPORTUNITIES, AND CHALLENGES
  • FIGURE 19 DRONE SENSOR MARKET: DRIVERS AND THEIR IMPACT
  • FIGURE 20 DRONE SENSOR MARKET: RESTRAINTS AND THEIR IMPACT
  • FIGURE 21 DRONE SENSOR MARKET: OPPORTUNITIES AND THEIR IMPACT
  • FIGURE 22 DRONE SENSOR MARKET: CHALLENGES AND THEIR IMPACT
  • FIGURE 23 TRENDS/DISRUPTIONS IMPACTING CUSTOMERS’ BUSINESSES
  • FIGURE 24 AVERAGE SELLING PRICE (ASP) TREND OF DRONE SENSORS, BY SENSOR TYPE, 2020–2029 (USD)
  • FIGURE 25 AVERAGE SELLING PRICE (ASP) OF DRONES OFFERED BY KEY PLAYERS, BY END-USER INDUSTRY (USD)
  • FIGURE 26 CONSUMER DRONE SHIPMENT, 2020–2029 (MILLION UNITS)
  • FIGURE 27 DRONE SENSOR MARKET: VALUE CHAIN ANALYSIS
  • FIGURE 28 KEY PLAYERS IN DRONE SENSOR ECOSYSTEM
  • FIGURE 29 DRONE-RELATED STARTUP EQUITY FUNDING, 2023 (USD MILLION)
  • FIGURE 30 MATURITY STAGES OF DRONE TECHNOLOGY
  • FIGURE 31 COMPANIES WITH HIGHEST NUMBER OF PATENT APPLICANTS IN LAST 10 YEARS, 2014–2024
  • FIGURE 32 NUMBER OF PATENTS GRANTED PER YEAR, 2014–2024
  • FIGURE 33 IMPORT DATA FOR HS CODE 8806-COMPLIANT PRODUCTS, BY COUNTRY, 2022–2023 (USD THOUSAND)
  • FIGURE 34 EXPORT DATA FOR HS CODE 8806-COMPLIANT PRODUCTS, BY COUNTRY, 2022–2023 (USD THOUSAND)
  • FIGURE 35 PORTER’S FIVE FORCES ANALYSIS
  • FIGURE 36 INFLUENCE OF STAKEHOLDERS ON BUYING PROCESS FOR TOP THREE END-USER INDUSTRIES
  • FIGURE 37 KEY BUYING CRITERIA FOR TOP THREE END-USER INDUSTRIES
  • FIGURE 38 SPEED & DISTANCE SENSOR SEGMENT TO HOLD LARGEST MARKET SHARE IN 2029
  • FIGURE 39 DATA ACQUISITION SEGMENT TO HOLD LARGEST MARKET SHARE IN 2024
  • FIGURE 40 FIXED-WING SEGMENT TO REGISTER HIGHEST CAGR DURING FORECAST PERIOD
  • FIGURE 41 DEFENSE SEGMENT TO HOLD LARGEST SHARE OF DRONE SENSOR MARKET IN 2024
  • FIGURE 42 DRONE SENSOR MARKET IN INDIA TO REGISTER HIGHEST CAGR DURING FORECAST PERIOD
  • FIGURE 43 NORTH AMERICA TO HOLD LARGEST SHARE OF DRONE SENSOR MARKET IN 2024
  • FIGURE 44 NORTH AMERICA: DRONE SENSOR MARKET SNAPSHOT
  • FIGURE 45 EUROPE: DRONE SENSOR MARKET SNAPSHOT
  • FIGURE 46 ASIA PACIFIC: DRONE SENSOR MARKET SNAPSHOT
  • FIGURE 47 DRONE SENSOR MARKET: REVENUE ANALYSIS OF TOP FIVE PLAYERS, 2021–2023 (USD BILLION)
  • FIGURE 48 DRONE SENSOR MARKET SHARE ANALYSIS, 2023
  • FIGURE 49 COMPANY VALUATION AND FINANCIAL METRICS, 2024
  • FIGURE 50 EV/EBITDA OF KEY VENDORS, 2024
  • FIGURE 51 TOP TRENDING BRANDS/PRODUCTS
  • FIGURE 52 DRONE SENSOR MARKET: COMPANY EVALUATION MATRIX (KEY PLAYERS), 2023
  • FIGURE 53 OVERALL FOOTPRINT
  • FIGURE 54 DRONE SENSOR MARKET: COMPANY EVALUATION MATRIX (STARTUPS/SMES), 2023
  • FIGURE 55 TE CONNECTIVITY: COMPANY SNAPSHOT
  • FIGURE 56 RTX: COMPANY SNAPSHOT
  • FIGURE 57 TRIMBLE INC.: COMPANY SNAPSHOT
  • FIGURE 58 AMS-OSRAM AG: COMPANY SNAPSHOT
  • FIGURE 59 HBK, INC.: COMPANY SNAPSHOT

Four main activities were undertaken to determine the size of the drone sensor market. Initial extensive secondary research gathered data on the market, peer market, and parent market. Following this, validation of these findings, assumptions, and sizing occurred through primary research involving industry experts across the value chain. Utilizing both top-down and bottom-up approaches, the global market size was estimated. Subsequently, market breakdown and data triangulation were employed to determine the sizes of segments and subsegments within the market.

Secondary Research

Secondary sources for this research study encompass corporate filings (including annual reports, investor presentations, and financial statements), trade publications, professional associations, white papers, accredited publications, articles authored by reputable sources, directories, and databases. Secondary data was gathered and analyzed to ascertain the overall market size, subsequently corroborated through primary research.

Primary Research

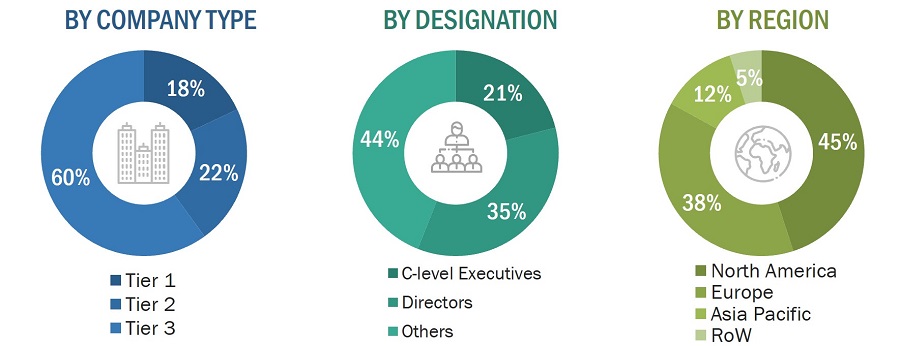
Following a comprehensive secondary research phase to comprehend and analyze the drone sensor market landscape, extensive primary research was conducted. This involved numerous interviews with key opinion leaders representing both demand- and supply-side vendors across four primary regions: North America, Asia Pacific, Europe, and RoW (comprising the GCC, Rest of Middle East & Africa, and South America). Subsequent to engaging with industry experts, concise sessions were held with seasoned independent consultants to validate the primary findings. These efforts, combined with insights from in-house subject matter experts, culminated in the findings detailed in the remainder of this report.
Drone Sensor Market
 Size, and Share

To know about the assumptions considered for the study, download the pdf brochure

Market Size Estimation

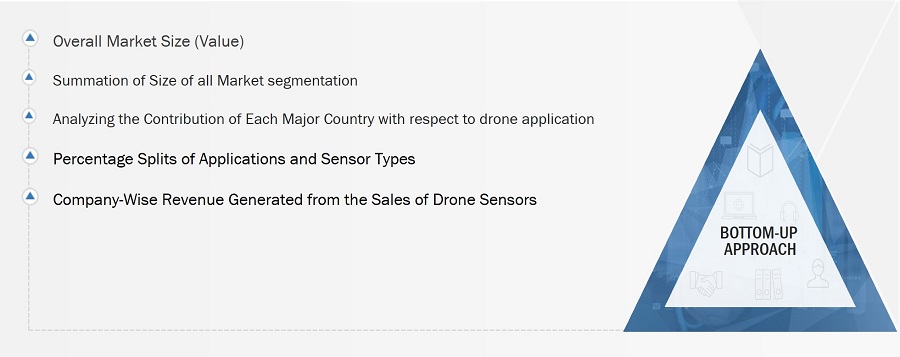
Both top-down and bottom-up methodologies have been employed to estimate and validate the overall size of the drone sensor market. These approaches were also extensively utilized to determine the sizes of various market subsegments. The research methodology utilized to estimate the market sizes encompasses the following:

Market Size Estimation Methodology-Top-Down Approach

Drone Sensor Market
 Size, and Top-Down Approach

Market Size Estimation Methodology-Bottom-up Approach
Drone Sensor Market
 Size, and Bottom-up Approach

Data Triangulation

After determining the overall market size through the previously outlined market size estimation processes, the market has been subdivided into multiple segments and subsegments. Data triangulation and market breakdown procedures were used to finalize the overall market engineering process and ascertain precise statistics for each market segment and subsegment. This triangulation involved examining various factors and trends from both the demand and supply perspectives.

The market has been divided into multiple segments and subsegments following the determination of the overall market size, utilizing the market size estimation methodologies outlined previously. Data triangulation and market breakdown techniques were used to finalize the overall market engineering process and attain precise statistics for each market segment and subsegment. Triangulation of data has been achieved through an examination of diverse factors and trends from both demand and supply perspectives.  

Market Definition

A sensor functions as a mechanism to identify alterations in electrical, physical, or various parameters, generating an output in response to such alterations. Typically, this output manifests as an electrical or optical signal. Drone sensors perceive modifications in their environment, enhancing their navigation capabilities and enabling them to gather vital information regarding the objects they observe.

Key Stakeholders

  • Raw material and manufacturing equipment suppliers
  • Integrated device manufacturers (IDMs)
  • Drone sensor manufacturers
  • Original device manufacturers (ODMs)
  • Original equipment manufacturers (OEMs)
  • Drone sensor-related technology providers
  • Distributors and traders
  • Research & education organizations
  • End users

Report Objectives

  • To describe and forecast the drone sensor market based on sensor type, platform type, application, and end-user industry in terms of value
  • To forecast the drone sensor market based on sensor type, platform type, and end-user industry in terms of volume
  • To forecast the size of the market for North America, Europe, Asia Pacific, and the Rest of the World (RoW) in terms of value
  • To provide detailed information regarding drivers, restraints, opportunities, and challenges influencing the growth of the drone sensor market
  • To strategically analyze micromarkets1 with respect to individual growth trends, prospects, and contributions to the drone sensor market
  • To describe the pricing analysis, value chain analysis, ecosystem analysis, investment and funding scenario, technology analysis, technology roadmap, patent analysis, trade analysis, the impact of megatrends, key conferences and events, case study analysis, regulatory landscape, Porter’s Five Forces analysis, and key stakeholder buying criteria
  • To analyze opportunities in the market for the stakeholders and provide a detailed competitive landscape of the drone sensor market
  • To strategically profile the key players and comprehensively analyze their market rankings and core competencies2.
  • To analyze competitive developments such as product launches, partnerships, and collaborations in the drone sensor market

Available Customizations:

With the given market data, MarketsandMarkets offers customizations according to the specific requirements of companies. The following customization options are available for the report:

Company Information

  • Detailed analysis and profiling of 25 market players

Custom Market Research Services

We will customize the research for you, in case the report listed above does not meet with your exact requirements. Our custom research will comprehensively cover the business information you require to help you arrive at strategic and profitable business decisions.

Request Customization
Report Code
SE 6471
Published ON
May, 2024
Choose License Type
BUY NOW
  • SHARE
X
Request Customization
Speak to Analyst
Speak to Analyst
OR FACE-TO-FACE MEETING
PERSONALIZE THIS RESEARCH
  • Triangulate with your Own Data
  • Get Data as per your Format and Definition
  • Gain a Deeper Dive on a Specific Application, Geography, Customer or Competitor
  • Any level of Personalization
REQUEST A FREE CUSTOMIZATION
LET US HELP YOU!
  • What are the Known and Unknown Adjacencies Impacting the Drone Sensor Market
  • What will your New Revenue Sources be?
  • Who will be your Top Customer; what will make them switch?
  • Defend your Market Share or Win Competitors
  • Get a Scorecard for Target Partners
CUSTOMIZED WORKSHOP REQUEST
knowledgestore logo

Want to explore hidden markets that can drive new revenue in Drone Sensor Market?

Find Hidden Markets
  • Call Us
  • +1-888-600-6441 (Corporate office hours)
  • +1-888-600-6441 (US/Can toll free)
  • +44-800-368-9399 (UK office hours)
CONNECT WITH US
ABOUT TRUST ONLINE
©2024 MarketsandMarkets Research Private Ltd. All rights reserved
DMCA.com Protection Status
Website Feedback