Digital Key Cabinet Market

Digital Key Cabinet Market by Offering (Hardware, Software & Services), Application (Commercial, Residential, Government & Military), Capacity (Up to 50 Keys, 51-100 Keys, Above 100 Keys) and Region - Global Forecast to 2029

Report Code: SE 9027 May, 2024, by marketsandmarkets.com

[213 Pages Report] The global digital key cabinet market size is projected to grow from USD 160 million in 2024 to USD 225 million by 2029, registering a CAGR of 7.1% during the forecast period. The digital key cabinet market is growing due to several key factors. Increased emphasis on security across industries like healthcare, finance, and government drives demand for advanced key management solutions. Rising incidents of security breaches and thefts necessitate enhanced protection, prompting adoption of digital key cabinets. Urbanization and smart city development also boost demand for integrated, automated security systems. Technological advancements, including IoT integration and remote access control, enhance the appeal of digital key cabinets.

Digital Key Cabinet Market

Digital Key Cabinet Market

Digital Key Cabinet Market Forecast to 2029

To know about the assumptions considered for the study, Request for Free Sample Report

Market Dynamics
:

Driver: Mounting demand for security solutions to safeguard critical assets

The digital key cabinet market size is experiencing significant growth due to the increasing demand for safety and security solutions. Businesses, organizations, and institutions are placing greater emphasis on security measures to safeguard their assets, leading to a notable uptick in the requirement for advanced key management systems, such as digital key cabinets. These cabinets are equipped with advanced security features, including electronic locking mechanisms, biometric authentication, and remote access control, providing heightened control and monitoring capabilities.

Government regulations and initiatives are crucial in driving the digital key cabinet industry . For example, in sectors, such as real estate, automotive, and healthcare, where security is of utmost importance, government regulations frequently mandate the adoption of robust security measures, including secure key management systems. These regulations compel organizations to procure digital key cabinets to adhere to security standards and safeguard sensitive information and assets.

Furthermore, the increasing threat of theft is prompting organizations to invest in digital key cabinets as a proactive measure to strengthen their security defenses. According to a report by the National Insurance Crime Bureau (NICB), analysis of vehicle theft data from 2019 to 2021 revealed a notable surge of over 20% in thefts involving keys in the US. This category encompasses instances of vehicle thefts where key fobs were left inside the vehicle. As of the end of 2021, slightly more than 100,000 thefts enabled by keys or key fobs were reported nationwide. This equates to roughly 11% of all vehicle thefts reported in the US during 2021.

Restraint: Growing popularity of keyless entry systems

The increasing popularity of keyless systems in various industries, including automotive and commercial sectors, causes a hindrance to the steady growth of the digital key cabinet market. Keyless access technologies, such as keyless entry systems, smart locks, and mobile-based access solutions, offer convenience, flexibility, and improved security than traditional key-based systems. This has led to a growing adoption of keyless technologies by organizations and consumers, reducing the demand for traditional digital key cabinets.

In the automotive sector, keyless entry systems are common in modern vehicles, allowing drivers to unlock and start their vehicles without physical keys. These systems often use proximity sensors, RFID technology, or smartphone apps to authenticate users and provide seamless access. Similarly, in commercial sectors, such as hospitality, keyless access solutions enable guests to access their rooms using smartphones or RFID cards, simplifying check-in and eliminating the need for physical keys.

Some keyless technologies used in the automotive sector include passive keyless entry systems (PKES), remote keyless entry (RKE) systems, and remote keyless ignition (RKI) systems. passive keyless entry systems (PKES) automatically unlock the vehicle as the driver approaches with the key fob and lock it when the driver moves away, providing exceptional convenience. remote keyless entry (RKE) systems use a remote control to lock and unlock the vehicle within a certain range. In contrast, remote keyless ignition (RKI) systems enable the driver to start the engine remotely using the key fob, offering added convenience in various situations.

One of the main advantages of keyless access technologies is their convenience. Users no longer need to carry bulky keychains or worry about losing keys, as access is granted through digital authentication methods, such as biometric scans, PIN codes, or smartphone apps. This convenience extends to organizations, where keyless systems streamline access management processes, reduce administrative burdens, and enhance operational efficiency. Additionally, keyless access technologies offer enhanced security features compared with traditional key-based systems, with biometric authentication methods, such as fingerprint or facial recognition, providing robust identity verification and reducing the risk of unauthorized access.

Opportunity: Rapid advancement in IoT and biometric authentication technologies

Integrating technologies, such as IoT, biometric authentication, and RFID, drives the digital key cabinet market. These technologies offer advanced functionalities and enhanced security features. With IoT, digital key cabinets can connect to the Internet, enabling remote monitoring, management, and access control. This connectivity enhances security by providing real-time alerts for unauthorized access attempts and allowing administrators to revoke access remotely.

Additionally, IoT integration enables seamless connection with other security systems, streamlining overall security management processes. Key cabinets enabled with IoT, such as those used in fleet management applications, can monitor key removals, returns, vehicle mileage, fuel levels, and routes, providing valuable insights to administrators. For example, fleetster in Germany offers a complete key management system for fleet vehicles, facilitating comprehensive control over the fleet through seamless communication between the electronic key cabinet, fleet management software, and the OBD-Plug installed in the vehicle.

Biometric authentication adds an extra layer of security by verifying the identity of users through unique biological traits, such as fingerprints, facial recognition, or iris scans. By integrating biometric authentication into digital key cabinets, organizations can ensure that only authorized individuals can access keys or valuable assets stored within the cabinets, significantly reducing the risk of unauthorized access or theft.

RFID technology allows efficient tracking and management of keys and assets. Each key or asset can be equipped with an RFID tag, which can be easily detected and identified by RFID readers integrated into the digital key cabinets. This enables organizations to quickly locate and retrieve keys as needed, minimizing the time spent searching for misplaced or lost keys. Additionally, RFID technology enhances security by providing detailed audit trails, allowing administrators to track key usage and identify any suspicious activities.

Challenge: High installation and management costs

The high initial costs associated with digital key cabinets can be a significant barrier to market growth. Implementing a digital key cabinet system involves various expenses, including purchasing hardware, such as the cabinet, electronic locking mechanisms, and authentication devices, such as biometric scanners or RFID readers.

Additionally, there are costs related to software acquisition and installation and any necessary integration with existing security systems or databases. Furthermore, ongoing expenses, such as software subscription fees, can further hinder market growth. Many digital key cabinet solutions require users to pay recurring fees to access cloud-based management software or remote monitoring capabilities. These subscription costs can add up over time, particularly for organizations managing large-scale key management systems or operating multiple cabinet units across different locations.

Digital key cabinet Market Ecosystem

Key companies in this market include well-established, financially stable providers of digital key cabinet products. These companies have been operating in the market for several years and possess a diversified portfolio of digital key cabinets which cater to a wide range of applications. Prominent companies in this market include ASSA ABLOY (Sweden), Carrier (US), Godrej & Boyce Manufacturing Company Limited (India), KeyGuard (Lithuania), Landwell (China), Morse Watchmans (US), Creone (Sweden), Securikey (UK), Keytracker Ltd. (UK), and Key Systems, Inc. (US) among others.

Digital Key Cabinet Market by Ecosystem

By Offering, Software & Services segment likely to exhibit the highest CAGR during the forecast period

Advancements in technology have facilitated the integration of sophisticated software solutions with digital key cabinets, offering features, such as remote access control, real-time monitoring, and audit trail tracking. These software platforms enhance the functionality and security of digital key cabinets, providing users greater flexibility and control over access management. Additionally, the growing emphasis on security and compliance across various industries, including healthcare, finance, and government, has spurred the adoption of digital key cabinet solutions powered by robust software and services to meet stringent regulatory requirements. Furthermore, the increasing trend toward automation and digitization in key management processes, driven by the need for efficiency and accountability, is fueling the demand for comprehensive software & services to streamline key tracking, allocation, and reporting tasks.

By Capacity, Above 100 Keys are expected to account for largest share between 2024 and 2029.

The above 100 keys segment is anticipated to hold the largest market share. This is driven by large organizations, government facilities, and industrial complexes with extensive key management needs due to their size and operational complexity. These entities require advanced solutions to handle a high volume of keys, integrate with other security systems, and provide detailed access control and audit capabilities. The ability to manage many keys securely and efficiently is critical for these organizations, making high-capacity digital key cabinets a vital component of their security infrastructure.

By Application, commercial segment to exhibit highest CAGR from 2024 to 2029

The commercial segment is expected to grow at the highest CAGR in the digital key cabinet market. Increasing security concerns and the need for efficient key management solutions are boosting the adoption of digital key cabinets among businesses of all sizes. Commercial enterprises, including office buildings, retail stores, and hospitality venues, require robust security measures to protect assets, manage access control, and ensure employee and customer safety. The growing digital transformation trend within the commercial sector further boosts the demand for advanced digital key cabinets that offer features, such as real-time monitoring, automated key tracking, and integration with existing security systems.

Asia Pacific region is projected to experience the highest growth in the overall digital key cabinet market during the forecast period

The Asia Pacific region is expected to exhibit the highest growth rate in the global digital key cabinet market. The increasing rate of digitalization and automation across various industries, coupled with rising awareness regarding security vulnerabilities, is fueling the need for advanced access control systems.

Furthermore, government initiatives aimed at improving infrastructure and implementing stringent data security and access control regulations are propelling the market in Asia Pacific. Moreover, the growing trend of smart homes and smart cities creates opportunities for providers of digital key cabinet solutions to integrate with IoT devices and home automation systems, further driving adoption.

Digital Key Cabinet Market by Region

Digital Key Cabinet Market by Region

To know about the assumptions considered for the study, download the pdf brochure

Top Digital Key Cabinet Companies -
Key Market Players:

ASSA ABLOY (Sweden), Carrier (US), Godrej & Boyce Manufacturing Company Limited (India), KeyGuard (Lithuania), Landwell (China), Morse Watchmans (US), Creone (Sweden) are some of the key players in the digital key cabinet companies

Digital Key Cabinet Report Scope: 

Report Metric

Details

Estimated Market Size USD 160 million in 2024
Projected Market Size USD 225 million by 2029
Growth Rate CAGR of 7.1%

Market Size Availability for Years

2020–2029

Base Year

2023

Forecast Period

2024–2029

Forecast Units

Value (USD Million)

Segments Covered

  • By offering,
  • By capacity,
  • By application, and
  • By region

Geographies Covered

  • North America,
  • Europe,
  • Asia Pacific, and
  • Rest of the World

Companies Covered

ASSA ABLOY (Sweden), Carrier (US), Godrej & Boyce Manufacturing Company Limited (India), KeyGuard (Lithuania), Landwell (China), Morse Watchmans (US), Creone (Sweden), Securikey (UK), Keytracker Ltd. (UK), and Key Systems, Inc. (US)

25 companies profiled

Digital Key Cabinet Market Highlights

This research report categorizes the digital key cabinet market based on offering, capacity, application, and region.

Segment

Subsegment

By Offering:

  • Hardware
  • Software & Services

By Capacity

  • Up to 50 Keys
  • 51–100 Keys
  • Above 100 Keys

By Application:

  • Commercial
    • Corporate Offices
    • Banks
    • Data Centers
    • Hospitals
    • Education
    • Utilities
    • Public Transport
    • Construction
  • Residential
  • Government & Military

By Region:

  • North America
  • Europe
  • Asia Pacific
  • Rest of the World

Recent Developments in Digital Key Cabinet Industry : 

  • In March 2024, ASSA ABLOY finalized the acquisition of Messerschmitt Systems, a German company renowned for developing and producing access control hardware and software solutions tailored for the hospitality sector, including access control and in-room control products. This acquisition reflects their strategic initiative to enhance their presence in developed markets by incorporating complementary products and solutions into their core business.
  • In October 2023, Traka, a part of the ASSA ABLOY, unveiled an electronic key cabinet solution tailored for residential properties. Traka LT presents a budget-friendly option featuring smart lock technology and mobile interaction, offering convenience and efficiency for property managers in accessing the essential physical keys they need on a daily basis.
  • In September 2023, ASSA ABLOY acquired Omni-ID, a prominent manufacturer specializing in RFID tags and industrial IoT devices for various applications, including passive and active tagging, tracking, monitoring, and alerting. This strategic acquisition positions Omni-ID as a valuable technological asset within the ASSA ABLOY Group, enhancing their existing radio frequency identification (RFID) and  Internet of Things (IoT) portfolio while presenting additional avenues for complementary growth.
  • In March 2022, Godrej & Boyce Manufacturing Company Limited unveiled a technologically advanced product through its business division, Godrej Security Solutions. This product, the Electronic Key Management System (KMS), integrates innovative RFID technology to securely regulate access to traditional mechanical keys for a team of individuals..

Frequently Asked Questions (FAQs):

To speak to our analyst for a discussion on the above findings, click Speak to Analyst

TABLE OF CONTENTS
 
1 INTRODUCTION (Page No. - 27)
    1.1 STUDY OBJECTIVES 
    1.2 MARKET DEFINITION 
    1.3 STUDY SCOPE 
           1.3.1 MARKETS COVERED
                    FIGURE 1 DIGITAL KEY CABINET MARKET SEGMENTATION
           1.3.2 INCLUSIONS AND EXCLUSIONS
           1.3.3 REGIONAL SCOPE
           1.3.4 YEARS CONSIDERED
    1.4 CURRENCY CONSIDERED 
    1.5 UNITS CONSIDERED 
    1.6 LIMITATIONS 
    1.7 STAKEHOLDERS 
    1.8 IMPACT OF RECESSION 
 
2 RESEARCH METHODOLOGY (Page No. - 31)
    2.1 RESEARCH DATA 
           FIGURE 2 DIGITAL KEY CABINET MARKET: RESEARCH DESIGN
           2.1.1 SECONDARY AND PRIMARY RESEARCH
           2.1.2 SECONDARY DATA
                    2.1.2.1 Key data from secondary sources
                    2.1.2.2 List of key secondary sources
           2.1.3 PRIMARY DATA
                    2.1.3.1 Key data from primary sources
                    2.1.3.2 Key industry insights
                    2.1.3.3 Breakdown of primaries
                    2.1.3.4 List of primary interview participants
    2.2 MARKET SIZE ESTIMATION METHODOLOGY 
           2.2.1 BOTTOM-UP APPROACH
                    2.2.1.1 Approach to arrive at market size using bottom-up analysis (demand side)
                               FIGURE 3 DIGITAL KEY CABINET MARKET: BOTTOM-UP APPROACH
           2.2.2 TOP-DOWN APPROACH
                    2.2.2.1 Approach to arrive at market size using top-down analysis (supply side)
                               FIGURE 4 MARKET: TOP-DOWN APPROACH
                               FIGURE 5 MARKET SIZE ESTIMATION METHODOLOGY
    2.3 MARKET BREAKDOWN AND DATA TRIANGULATION 
           FIGURE 6 MARKET: DATA TRIANGULATION
    2.4 RISK ASSESSMENT 
           TABLE 1 MARKET: RISK ASSESSMENT
    2.5 RESEARCH ASSUMPTIONS 
           FIGURE 7 MARKET: RESEARCH ASSUMPTIONS
    2.6 RESEARCH LIMITATIONS 
           FIGURE 8 DIGITAL KEY CABINET MARKET: RESEARCH LIMITATIONS
    2.7 RECESSION IMPACT 
 
3 EXECUTIVE SUMMARY (Page No. - 43)
    FIGURE 9 DIGITAL KEY CABINET MARKET SIZE, 2020–2029 (USD MILLION)
    FIGURE 10 SOFTWARE & SERVICES OFFERINGS TO EXHIBIT HIGHER CAGR THAN HARDWARE OFFERINGS DURING FORECAST PERIOD
    FIGURE 11 ABOVE 100 KEYS SEGMENT TO HOLD LARGEST MARKET SHARE IN 2029
    FIGURE 12 COMMERCIAL APPLICATION TO DOMINATE MARKET FROM 2024 TO 2029
    FIGURE 13 ASIA PACIFIC TO RECORD HIGHEST CAGR DURING FORECAST PERIOD
 
4 PREMIUM INSIGHTS (Page No. - 47)
    4.1 ATTRACTIVE OPPORTUNITIES FOR PLAYERS IN DIGITAL KEY CABINET MARKET 
           FIGURE 14 RISING INCIDENCE OF SECURITY BREACHES TO CREATE LUCRATIVE OPPORTUNITIES FOR PLAYERS IN MARKET
    4.2  MARKET, BY OFFERING 
           FIGURE 15 HARDWARE SEGMENT TO ACCOUNT FOR LARGEST SHARE OF MARKET, BY OFFERING, IN 2029
    4.3 MARKET, BY CAPACITY 
           FIGURE 16 ABOVE 100 KEYS SEGMENT HELD LARGEST SHARE OF MARKET, BY CAPACITY, IN 2023
    4.4 MARKET, BY APPLICATION 
           FIGURE 17 COMMERCIAL SEGMENT TO DOMINATE MARKET, BY APPLICATION, BETWEEN 2024 AND 2029
    4.5 DIGITAL KEY CABINET MARKET, BY REGION 
           FIGURE 18 NORTH AMERICA TO ACCOUNT FOR LARGEST SHARE OF GLOBAL MARKET IN 2029
 
5 MARKET OVERVIEW (Page No. - 50)
    5.1 INTRODUCTION 
    5.2 MARKET DYNAMICS 
           FIGURE 19 DIGITAL KEY CABINET MARKET: DRIVERS, RESTRAINTS, OPPORTUNITIES, AND CHALLENGES
           5.2.1 DRIVERS
                    5.2.1.1 Mounting demand for security solutions to safeguard critical assets
                    5.2.1.2 Increasing construction of residential and commercial buildings in emerging economies
                    5.2.1.3 Rising adoption of cloud-based digital key management solutions
                               FIGURE 20 IMPACT ANALYSIS: DRIVERS
           5.2.2 RESTRAINTS
                    5.2.2.1 Growing preference for keyless entry systems
                    5.2.2.2 Increasing vulnerability of digital key cabinets to hacking
                               FIGURE 21 IMPACT ANALYSIS: RESTRAINTS
           5.2.3 OPPORTUNITIES
                    5.2.3.1 Rapid advancement in IoT and RFID technologies
                    5.2.3.2 Surging demand for intelligent key cabinets with real-time monitoring features
                               FIGURE 22 IMPACT ANALYSIS: OPPORTUNITIES
           5.2.4 CHALLENGES
                    5.2.4.1 High installation and management costs
                    5.2.4.2 Complexity in integrating digital key cabinets into existing legacy systems
                               FIGURE 23 IMPACT ANALYSIS: CHALLENGES
    5.3 SUPPLY CHAIN ANALYSIS 
           FIGURE 24 DIGITAL KEY CABINETMARKET: SUPPLY CHAIN ANALYSIS
    5.4 ECOSYSTEM ANALYSIS 
           FIGURE 25 DIGITAL KEY CABINET ECOSYSTEM
           TABLE 2 ROLE OF COMPANIES IN DIGITAL KEY CABINET ECOSYSTEM
    5.5 PRICING ANALYSIS 
           5.5.1 AVERAGE SELLING PRICE TREND OF KEY PLAYERS, BY CAPACITY
                    FIGURE 26 AVERAGE SELLING PRICE TREND OF DIGITAL KEY CABINETS OFFERED BY KEY PLAYERS, BY CAPACITY (USD)
                    TABLE 3 AVERAGE SELLING PRICE TREND OF DIGITAL KEY CABINETS OFFERED BY KEY PLAYERS, BY CAPACITY (USD)
           5.5.2 AVERAGE SELLING PRICE TREND, BY REGION
                    FIGURE 27 AVERAGE SELLING PRICE TREND OF DIGITAL KEY CABINETS OF UP TO 50 KEYS, BY REGION, 2019–2023 (USD)
                    FIGURE 28 AVERAGE SELLING PRICE TREND OF DIGITAL KEY CABINETS OF 51–100 KEYS, BY REGION, 2019–2023 (USD)
                    FIGURE 29 AVERAGE SELLING PRICE TREND OF DIGITAL KEY CABINETS OF ABOVE 100 KEYS, BY REGION, 2019–2023 (USD)
    5.6 INVESTMENT AND FUNDING SCENARIO 
           FIGURE 30 INVESTMENT AND FUNDING SCENARIO
    5.7 TRENDS/DISRUPTIONS IMPACTING CUSTOMERS’ BUSINESSES 
           FIGURE 31 DIGITAL KEY CABINET MARKET: TRENDS/DISRUPTIONS IMPACTING CUSTOMERS’ BUSINESSES
    5.8 TECHNOLOGY ANALYSIS 
           5.8.1 KEY TECHNOLOGIES
                    5.8.1.1 Radio frequency identification
                    5.8.1.2 Near-field communication
           5.8.2 COMPLEMENTARY TECHNOLOGIES
                    5.8.2.1 Smart locks
           5.8.3 ADJACENT TECHNOLOGIES
                    5.8.3.1 Surveillance systems
    5.9 PORTER’S FIVE FORCES ANALYSIS 
           TABLE 4 PORTER’S FIVE FORCES ANALYSIS
           FIGURE 32 PORTER’S FIVE FORCES ANALYSIS
           5.9.1 THREAT OF NEW ENTRANTS
           5.9.2 THREAT OF SUBSTITUTES
           5.9.3 BARGAINING POWER OF SUPPLIERS
           5.9.4 BARGAINING POWER OF BUYERS
           5.9.5 INTENSITY OF COMPETITIVE RIVALRY
    5.10 KEY STAKEHOLDERS AND BUYING CRITERIA 
           5.10.1 KEY STAKEHOLDERS IN BUYING PROCESS
                    FIGURE 33 INFLUENCE OF STAKEHOLDERS ON BUYING PROCESS, BY APPLICATION
                    TABLE 5 INFLUENCE OF STAKEHOLDERS ON BUYING PROCESS, BY APPLICATION (%)
           5.10.2 BUYING CRITERIA
                    FIGURE 34 KEY BUYING CRITERIA, BY APPLICATION
                    TABLE 6 KEY BUYING CRITERIA, BY APPLICATION
    5.11 CASE STUDIES 
           5.11.1 ARDEN MAIDSTONE IMPLEMENTS KEYTRACKER’S ELECTRONIC KEY SYSTEMS TO ADDRESS DISORGANIZATION AND DISRUPTION ISSUES CAUSED BY OLD KEY SYSTEMS
           5.11.2 MERCEDES-BENZ PANAVTO ADOPTS ECOS SYSTEM’S KEY MANAGEMENT SYSTEMS FOR EFFICIENT ORGANIZATIONAL OPERATIONS
           5.11.3 MÖVENPICK HOTEL AMSTERDAM CITY CENTRE INSTALLS KEYCONDUCTOR CONTROL SYSTEM TO ORGANIZE ISSUING AND RETURN OF KEYS
           5.11.4 WYLIE POLICE DEPARTMENT ADOPTS TRAKA PRO S KEY CABINET AND TRAKAWEB SOFTWARE TO PREVENT SECURITY THREATS
           5.11.5 WALWORTH COUNTY PUBLIC WORKS DEPARTMENT USES KEYWATCHER TOUCH SOLUTION TO MANAGE VEHICLE AND BUILDING KEYS
    5.12 TRADE ANALYSIS 
           5.12.1 IMPORT SCENARIO (HS CODE 8303)
                    FIGURE 35 IMPORT DATA FOR HS CODE 8303-COMPLIANT PRODUCTS, 2018–2022
           5.12.2 EXPORT SCENARIO (HS CODE 8303)
                    FIGURE 36 EXPORT DATA FOR HS CODE 8303-COMPLIANT PRODUCTS, 2018–2022
    5.13 PATENT ANALYSIS 
           FIGURE 37 PATENTS APPLIED AND GRANTED, 2014–2023
           TABLE 7 LIST OF KEY PATENTS, 2021–2023
    5.14 KEY CONFERENCES AND EVENTS, 2024–2025 
           TABLE 8 LIST OF CONFERENCES AND EVENTS, 2024–2025
    5.15 REGULATORY LANDSCAPE 
           5.15.1 REGULATORY BODIES, GOVERNMENT AGENCIES, AND OTHER ORGANIZATIONS
                    TABLE 9 NORTH AMERICA: REGULATORY BODIES, GOVERNMENT AGENCIES, AND OTHER ORGANIZATIONS
                    TABLE 10 EUROPE: REGULATORY BODIES, GOVERNMENT AGENCIES, AND OTHER ORGANIZATIONS
                    TABLE 11 ASIA PACIFIC: REGULATORY BODIES, GOVERNMENT AGENCIES, AND OTHER ORGANIZATIONS
                    TABLE 12 ROW: REGULATORY BODIES, GOVERNMENT AGENCIES, AND OTHER ORGANIZATIONS
           5.15.2 STANDARDS
 
6 DIGITAL KEY CABINET TECHNOLOGIES (Page No. - 83)
    6.1 INTRODUCTION 
    6.2 BIOMETRIC ACCESS CONTROL 
    6.3 KEYPAD ACCESS CONTROL 
    6.4 RFID/NFC ACCESS CONTROL 
 
7 DIGITAL KEY CABINET MARKET, BY OFFERING (Page No. - 86)
    7.1 INTRODUCTION 
           FIGURE 38 SOFTWARE & SERVICES SEGMENT TO RECORD HIGHER CAGR IN MARKET, BY OFFERING, BETWEEN 2024 AND 2029
           TABLE 13 MARKET, BY OFFERING, 2020–2023 (USD MILLION)
           TABLE 14 MARKET, BY OFFERING, 2024–2029 (USD MILLION)
    7.2 HARDWARE 
           7.2.1 REQUIREMENT FOR DURABLE MATERIALS WITHSTANDING PHYSICAL TEMPERING OF KEY CABINETS TO BOOST SEGMENTAL GROWTH
                    TABLE 15 HARDWARE: DIGITAL KEY CABINET MARKET, BY REGION, 2020–2023 (USD MILLION)
                    TABLE 16 HARDWARE: MARKET, BY REGION, 2024–2029 (USD MILLION)
                    TABLE 17 HARDWARE: MARKET IN NORTH AMERICA, BY COUNTRY, 2020–2023 (USD MILLION)
                    TABLE 18 HARDWARE: MARKET IN NORTH AMERICA, BY COUNTRY, 2024–2029 (USD MILLION)
                    TABLE 19 HARDWARE: MARKET IN EUROPE, BY COUNTRY, 2020–2023 (USD MILLION)
                    TABLE 20 HARDWARE: MARKET IN EUROPE, BY COUNTRY, 2024–2029 (USD MILLION)
                    TABLE 21 HARDWARE: MARKET IN ASIA PACIFIC, BY COUNTRY, 2020–2023 (USD MILLION)
                    TABLE 22 HARDWARE: DIGITAL KEY CABINET MARKET IN ASIA PACIFIC, BY COUNTRY, 2024–2029 (USD MILLION)
                    TABLE 23 HARDWARE: MARKET IN ROW, BY REGION, 2020–2023 (USD MILLION)
                    TABLE 24 HARDWARE: MARKET IN ROW, BY REGION, 2024–2029 (USD MILLION)
    7.3 SOFTWARE & SERVICES 
           7.3.1 RELIANCE ON CENTRALIZED PLATFORM TO STREAMLINE KEY MANAGEMENT AND ENHANCE SECURITY TO FUEL SEGMENTAL GROWTH
                    TABLE 25 SOFTWARE & SERVICES: MARKET, BY REGION, 2020–2023 (USD MILLION)
                    TABLE 26 SOFTWARE & SERVICES: MARKET, BY REGION, 2024–2029 (USD MILLION)
                    TABLE 27 SOFTWARE & SERVICES: MARKET IN NORTH AMERICA, BY COUNTRY, 2020–2023 (USD MILLION)
                    TABLE 28 SOFTWARE & SERVICES: MARKET IN NORTH AMERICA, BY COUNTRY, 2024–2029 (USD MILLION)
                    TABLE 29 SOFTWARE & SERVICES: DIGITAL KEY CABINET MARKET IN EUROPE, BY COUNTRY, 2020–2023 (USD MILLION)
                    TABLE 30 SOFTWARE & SERVICES: MARKET IN EUROPE, BY COUNTRY, 2024–2029 (USD MILLION)
                    TABLE 31 SOFTWARE & SERVICES: MARKET IN ASIA PACIFIC, BY COUNTRY, 2020–2023 (USD MILLION)
                    TABLE 32 SOFTWARE & SERVICES: MARKET IN ASIA PACIFIC, BY COUNTRY, 2024–2029 (USD MILLION)
                    TABLE 33 SOFTWARE & SERVICES: MARKET IN ROW, BY REGION, 2020–2023 (USD MILLION)
                    TABLE 34 SOFTWARE & SERVICES: MARKET IN ROW, BY REGION, 2024–2029 (USD MILLION)
 
8 DIGITAL KEY CABINET MARKET, BY CAPACITY (Page No. - 97)
    8.1 INTRODUCTION 
           FIGURE 39 ABOVE 100 KEYS SEGMENT TO DOMINATE MARKET, BY CAPACITY, DURING FORECAST PERIOD
           TABLE 35 DIGITAL KEY CABINET MARKET, BY CAPACITY, 2020–2023 (USD MILLION)
           TABLE 36 MARKET, BY CAPACITY, 2024–2029 (USD MILLION)
           TABLE 37 MARKET, BY CAPACITY, 2020–2023 (THOUSAND UNITS)
           TABLE 38 MARKET, BY CAPACITY, 2024–2029 (THOUSAND UNITS)
    8.2 UP TO 50 KEYS 
           8.2.1 ADVANCED ENCRYPTION AND USER AUTHENTICATION FEATURES TO CONTRIBUTE TO SEGMENTAL GROWTH
    8.3 51–100 KEYS 
           8.3.1 ENHANCED STORAGE CAPACITY AND SECURITY TO FOSTER SEGMENTAL GROWTH
    8.4 ABOVE 100 KEYS 
           8.4.1 UNPARALLELED SCALABILITY AND FUNCTIONALITY TO ACCELERATE SEGMENTAL GROWTH
 
9 DIGITAL KEY CABINET MARKET, BY APPLICATION (Page No. - 101)
    9.1 INTRODUCTION 
           FIGURE 40 COMMERCIAL APPLICATION TO EXHIBIT HIGHEST CAGR FROM 2024 TO 2029
           TABLE 39 DIGITAL KEY CABINET MARKET, BY APPLICATION, 2020–2023 (USD MILLION)
           TABLE 40 MARKET, BY APPLICATION, 2024–2029 (USD MILLION)
    9.2 COMMERCIAL 
           TABLE 41 COMMERCIAL: MARKET, BY TYPE, 2020–2023 (USD MILLION)
           TABLE 42 COMMERCIAL: MARKET, BY TYPE, 2024–2029 (USD MILLION)
           TABLE 43 COMMERCIAL: MARKET, BY REGION, 2020–2023 (USD MILLION)
           TABLE 44 COMMERCIAL: MARKET, BY REGION, 2024–2029 (USD MILLION)
           9.2.1 CORPORATE OFFICES
                    9.2.1.1 Increasing focus on enhancing server room security to augment segmental growth
           9.2.2 BANKS
                    9.2.2.1 Rising need for comprehensive audit trail to prevent security breaches to foster segmental growth
           9.2.3 DATA CENTERS
                    9.2.3.1 Increasing implementation of strict regulatory frameworks to safeguard sensitive data to drive market
           9.2.4 HOSPITALS
                    9.2.4.1 Growing emphasis on protecting vital assets and optimizing healthcare workflows to facilitate segmental growth
           9.2.5 UTILITIES
                    9.2.5.1 Rising focus on streamlining operations and complying with regulatory standards to boost segmental growth
           9.2.6 EDUCATIONAL INSTITUTIONS
                    9.2.6.1 Increasing need to optimize workflows and allocate resources effectively to contribute to segmental growth
           9.2.7 PUBLIC TRANSPORTATION HUBS
                    9.2.7.1 Growing focus on simplifying access management to accelerate segmental growth
           9.2.8 CONSTRUCTION SITES
                    9.2.8.1 Rising need to track key usage patterns and optimize resource allocation to fuel segmental growth
    9.3 RESIDENTIAL 
           9.3.1 MOUNTING DEMAND FOR KEY CABINETS FOR SHORT-TERM RENTAL MANAGEMENT TO AUGMENT SEGMENTAL GROWTH
                    TABLE 45 RESIDENTIAL: DIGITAL KEY CABINET MARKET, BY REGION, 2020–2023 (USD MILLION)
                    TABLE 46 RESIDENTIAL: MARKET, BY REGION, 2024–2029 (USD MILLION)
    9.4 GOVERNMENT & MILITARY 
           9.4.1 INCREASING NEED TO PROTECT SENSITIVE AREAS, EQUIPMENT, AND VEHICLES TO BOOST SEGMENTAL GROWTH
                    TABLE 47 GOVERNMENT & MILITARY: MARKET, BY REGION, 2020–2023 (USD MILLION)
                    TABLE 48 GOVERNMENT & MILITARY: MARKET, BY REGION, 2024–2029 (USD MILLION)
 
10 DIGITAL KEY CABINET MARKET, BY REGION (Page No. - 111)
     10.1 INTRODUCTION 
             FIGURE 41 DIGITAL KEY CABINET MARKET, BY REGION
             FIGURE 42 CHINA TO RECORD HIGHEST CAGR IN GLOBAL MARKET DURING FORECAST PERIOD
             FIGURE 43 NORTH AMERICA TO DOMINATE GLOBAL MARKET DURING FORECAST PERIOD
             TABLE 49 MARKET, BY REGION, 2020–2023 (USD MILLION)
             TABLE 50 MARKET, BY REGION, 2024–2029 (USD MILLION)
     10.2 NORTH AMERICA 
             FIGURE 44 NORTH AMERICA: MARKET SNAPSHOT
             10.2.1 RECESSION IMPACT ON MARKET IN NORTH AMERICA
                        TABLE 51 NORTH AMERICA: MARKET, BY COUNTRY, 2020–2023 (USD MILLION)
                        TABLE 52 NORTH AMERICA: DIGITAL KEY CABINET MARKET, BY COUNTRY, 2024–2029 (USD MILLION)
                        TABLE 53 NORTH AMERICA: MARKET, BY APPLICATION, 2020–2023 (USD MILLION)
                        TABLE 54 NORTH AMERICA: MARKET, BY APPLICATION, 2024–2029 (USD MILLION)
                        TABLE 55 NORTH AMERICA: MARKET, BY OFFERING, 2020–2023 (USD MILLION)
                        TABLE 56 NORTH AMERICA: MARKET, BY OFFERING, 2024–2029 (USD MILLION)
             10.2.2 US
                        10.2.2.1 Growing crime rates and security threats to contribute to market growth
                                     TABLE 57 US: DIGITAL KEY CABINET MARKET, BY OFFERING, 2020–2023 (USD MILLION)
                                     TABLE 58 US: MARKET, BY OFFERING, 2024–2029 (USD MILLION)
             10.2.3 CANADA
                        10.2.3.1 Availability of interest-free loans to boost technological advancement to drive market
                                     TABLE 59 CANADA: MARKET, BY OFFERING, 2020–2023 (USD MILLION)
                                     TABLE 60 CANADA: MARKET, BY OFFERING, 2024–2029 (USD MILLION)
             10.2.4 MEXICO
                        10.2.4.1 Rising adoption of home automation and security solutions to fuel market growth
                                     TABLE 61 MEXICO: MARKET, BY OFFERING, 2020–2023 (USD MILLION)
                                     TABLE 62 MEXICO:  MARKET, BY OFFERING, 2024–2029 (USD MILLION)
     10.3 EUROPE 
             FIGURE 45 EUROPE: DIGITAL KEY CABINET MARKET SNAPSHOT
             10.3.1 RECESSION IMPACT ON MARKET IN EUROPE
                        TABLE 63 EUROPE: MARKET, BY COUNTRY, 2020–2023 (USD MILLION)
                        TABLE 64 EUROPE: MARKET, BY COUNTRY, 2024–2029 (USD MILLION)
                        TABLE 65 EUROPE: MARKET, BY APPLICATION, 2020–2023 (USD MILLION)
                        TABLE 66 EUROPE: MARKET, BY APPLICATION, 2024–2029 (USD MILLION)
                        TABLE 67 EUROPE: DIGITAL KEY CABINET MARKET, BY OFFERING, 2020–2023 (USD MILLION)
                        TABLE 68 EUROPE: MARKET, BY OFFERING, 2024–2029 (USD MILLION)
             10.3.2 UK
                        10.3.2.1 Installation of integrated security systems to prevent robbery to boost market growth
                                     TABLE 69 UK: MARKET, BY OFFERING, 2020–2023 (USD MILLION)
                                     TABLE 70 UK: MARKET, BY OFFERING, 2024–2029 (USD MILLION)
             10.3.3 GERMANY
                        10.3.3.1 Technological advances and evolving security needs to foster market growth
                                     TABLE 71 GERMANY: MARKET, BY OFFERING, 2020–2023 (USD MILLION)
                                     TABLE 72 GERMANY: DIGITAL KEY CABINET MARKET, BY OFFERING, 2024–2029 (USD MILLION)
             10.3.4 FRANCE
                        10.3.4.1 Rise in tourism and defense spending to contribute to market growth
                                     TABLE 73 FRANCE: MARKET, BY OFFERING, 2020–2023 (USD MILLION)
                                     TABLE 74 FRANCE: MARKET, BY OFFERING, 2024–2029 (USD MILLION)
             10.3.5 REST OF EUROPE
                        TABLE 75 REST OF EUROPE: MARKET, BY OFFERING, 2020–2023 (USD MILLION)
                        TABLE 76 REST OF EUROPE: MARKET, BY OFFERING, 2024–2029 (USD MILLION)
     10.4 ASIA PACIFIC 
             FIGURE 46 ASIA PACIFIC: DIGITAL KEY CABINET MARKET SNAPSHOT
             10.4.1 RECESSION IMPACT ON MARKET IN ASIA PACIFIC
                        TABLE 77 ASIA PACIFIC: MARKET, BY COUNTRY, 2020–2023 (USD MILLION)
                        TABLE 78 ASIA PACIFIC: MARKET, BY COUNTRY, 2024–2029 (USD MILLION)
                        TABLE 79 ASIA PACIFIC: MARKET, BY APPLICATION, 2020–2023 (USD MILLION)
                        TABLE 80 ASIA PACIFIC: MARKET, BY APPLICATION, 2024–2029 (USD MILLION)
                        TABLE 81 ASIA PACIFIC: MARKET, BY OFFERING, 2020–2023 (USD MILLION)
                        TABLE 82 ASIA PACIFIC: DIGITAL KEY CABINET MARKET, BY OFFERING, 2024–2029 (USD MILLION)
             10.4.2 CHINA
                        10.4.2.1 Growing emphasis on technological innovation and infrastructure development to accelerate market growth
                                     TABLE 83 CHINA: MARKET, BY OFFERING, 2020–2023 (USD MILLION)
                                     TABLE 84 CHINA: MARKET, BY OFFERING, 2024–2029 (USD MILLION)
             10.4.3 JAPAN
                        10.4.3.1 Increasing expansion of automotive manufacturing facilities to boost market growth
                                     TABLE 85 JAPAN: MARKET, BY OFFERING, 2020–2023 (USD MILLION)
                                     TABLE 86 JAPAN: DIGITAL KEY CABINET MARKET, BY OFFERING, 2024–2029 (USD MILLION)
             10.4.4 SOUTH KOREA
                        10.4.4.1 Rising integration of AI and IoT technologies into industrial operations to fuel market growth
                                     TABLE 87 SOUTH KOREA: MARKET, BY OFFERING, 2020–2023 (USD MILLION)
                                     TABLE 88 SOUTH KOREA: MARKET, BY OFFERING, 2024–2029 (USD MILLION)
             10.4.5 AUSTRALIA & NEW ZEALAND
                        10.4.5.1 Growing emphasis on workplace safety to bolster market growth
                                     TABLE 89 AUSTRALIA & NEW ZEALAND: MARKET, BY OFFERING, 2020–2023 (USD MILLION)
                                     TABLE 90 AUSTRALIA & NEW ZEALAND: DIGITAL KEY CABINET MARKET, BY OFFERING, 2024–2029 (USD MILLION)
             10.4.6 REST OF ASIA PACIFIC
                        TABLE 91 REST OF ASIA PACIFIC: MARKET, BY OFFERING, 2020–2023 (USD MILLION)
                        TABLE 92 REST OF ASIA PACIFIC: MARKET, BY OFFERING, 2024–2029 (USD MILLION)
     10.5 ROW 
             FIGURE 47 ROW: DIGITAL KEY CABINET MARKET SNAPSHOT
             10.5.1 RECESSION IMPACT ON MARKET IN ROW
                        TABLE 93 ROW: MARKET, BY REGION, 2020–2023 (USD MILLION)
                        TABLE 94 ROW: MARKET, BY REGION, 2024–2029 (USD MILLION)
                        TABLE 95 ROW: MARKET, BY APPLICATION, 2020–2023 (USD MILLION)
                        TABLE 96 ROW: MARKET, BY APPLICATION, 2024–2029 (USD MILLION)
                        TABLE 97 ROW: MARKET, BY OFFERING, 2020–2023 (USD MILLION)
                        TABLE 98 ROW: DIGITAL KEY CABINET MARKET, BY OFFERING, 2024–2029 (USD MILLION)
             10.5.2 SOUTH AMERICA
                        10.5.2.1 Increased spending on security solutions to prevent data theft to accelerate market growth
                                     TABLE 99 SOUTH AMERICA: MARKET, BY OFFERING, 2020–2023 (USD MILLION)
                                     TABLE 100 SOUTH AMERICA: MARKET, BY OFFERING, 2024–2029 (USD MILLION)
             10.5.3 MIDDLE EAST & AFRICA
                        10.5.3.1 Rising emphasis on enhancing security in educational institutions and healthcare facilities to contribute to market growth
                                     TABLE 101 MIDDLE EAST & AFRICA:  MARKET, BY COUNTRY, 2020–2023 (USD MILLION)
                                     TABLE 102 MIDDLE EAST & AFRICA: DIGITAL KEY CABINET MARKET, BY COUNTRY, 2024–2029 (USD MILLION)
                                     TABLE 103 MIDDLE EAST & AFRICA: MARKET, BY OFFERING, 2020–2023 (USD MILLION)
                                     TABLE 104 MIDDLE EAST & AFRICA: MARKET, BY OFFERING, 2024–2029 (USD MILLION)
                        10.5.3.2 GCC countries
                                     TABLE 105 GCC COUNTRIES: MARKET, BY OFFERING, 2020–2023 (USD MILLION)
                                     TABLE 106 GCC COUNTRIES: MARKET, BY OFFERING, 2024–2029 (USD MILLION)
                        10.5.3.3 Rest of Middle East & Africa
                                     TABLE 107 REST OF MIDDLE EAST & AFRICA: MARKET, BY OFFERING, 2020–2023 (USD MILLION)
                                     TABLE 108 REST OF MIDDLE EAST & AFRICA: MARKET, BY OFFERING, 2024–2029 (USD MILLION)
 
11 COMPETITIVE LANDSCAPE (Page No. - 142)
     11.1 INTRODUCTION 
     11.2 KEY PLAYER STRATEGIES/RIGHT TO WIN, 2020–2023 
             TABLE 109 MARKET: OVERVIEW OF STRATEGIES ADOPTED BY KEY PLAYERS, 2020–2023
     11.3 MARKET SHARE ANALYSIS, 2023 
             TABLE 110 MARKET: DEGREE OF COMPETITION
             FIGURE 48 MARKET SHARE ANALYSIS, 2023
     11.4 REVENUE ANALYSIS, 2019–2023 
             FIGURE 49 DIGITAL KEY CABINET MARKET: REVENUE ANALYSIS OF TOP THREE PLAYERS, 2019–2023
     11.5 COMPANY VALUATION AND FINANCIAL METRICS 
             FIGURE 50 COMPANY VALUATION, 2023 (USD BILLION)
             FIGURE 51 FINANCIAL METRICS, 2023
     11.6 BRAND/PRODUCT COMPARISON 
             FIGURE 52 BRAND/PRODUCT COMPARISON
     11.7 COMPANY EVALUATION MATRIX: KEY PLAYERS, 2023 
             11.7.1 STARS
             11.7.2 EMERGING LEADERS
             11.7.3 PERVASIVE PLAYERS
             11.7.4 PARTICIPANTS
                        FIGURE 53 DIGITAL KEY CABINET MARKET: COMPANY EVALUATION MATRIX (KEY PLAYERS), 2023
             11.7.5 COMPANY FOOTPRINT: KEY PLAYERS, 2023
                        11.7.5.1 Company footprint
                                     FIGURE 54 MARKET: COMPANY FOOTPRINT
                        11.7.5.2 Offering footprint
                                     TABLE 111 MARKET: OFFERING FOOTPRINT
                        11.7.5.3 Capacity footprint
                                     TABLE 112 MARKET: CAPACITY FOOTPRINT
                        11.7.5.4 Application footprint
                                     TABLE 113 DIGITAL KEY CABINET MARKET: APPLICATION FOOTPRINT
                        11.7.5.5 Region footprint
                                     TABLE 114 MARKET: REGION FOOTPRINT
     11.8 COMPANY EVALUATION MATRIX: START-UPS/SMES, 2023 
             11.8.1 PROGRESSIVE COMPANIES
             11.8.2 RESPONSIVE COMPANIES
             11.8.3 DYNAMIC COMPANIES
             11.8.4 STARTING BLOCKS
                        FIGURE 55 DIGITAL KEY CABINET MARKET: COMPANY EVALUATION MATRIX (START-UPS/SMES), 2023
             11.8.5 COMPETITIVE BENCHMARKING: START-UPS/SMES, 2023
                        11.8.5.1 Detailed list of key start-ups/SMEs
                                     TABLE 115 MARKET: DETAILED LIST OF KEY START-UPS/SMES
                        11.8.5.2 Competitive benchmarking of key start-ups/SMEs
                                     TABLE 116 MARKET: COMPETITIVE BENCHMARKING OF KEY START-UPS/SMES
     11.9 COMPETITIVE SCENARIO AND TRENDS 
             11.9.1 PRODUCT LAUNCHES
                        TABLE 117 DIGITAL KEY CABINET MARKET: PRODUCT LAUNCHES, MARCH 2021–MARCH 2024
             11.9.2 DEALS
                        TABLE 118 MARKET: DEALS, MARCH 2021–MARCH 2024
             11.9.3 EXPANSIONS
                        TABLE 119 MARKET: EXPANSIONS, MARCH 2021–MARCH 2024
 
12 COMPANY PROFILES (Page No. - 163)
     12.1 INTRODUCTION 
     12.2 KEY PLAYERS 
(Business Overview, Products/Services/Solutions Offered, Recent Developments, MnM View, Key Strengths and Right to Win, Strategic Choices Made, Weaknesses and Competitive Threats)*  
             12.2.1 ASSA ABLOY
                        TABLE 120 ASSA ABLOY: COMPANY OVERVIEW
                        FIGURE 56 ASSA ABLOY: COMPANY SNAPSHOT
                        TABLE 121 ASSA ABLOY: PRODUCTS/SOLUTIONS/SERVICES OFFERED
                        TABLE 122 ASSA ABLOY: PRODUCT LAUNCHES
                        TABLE 123 ASSA ABLOY: DEALS
             12.2.2 CARRIER
                        TABLE 124 CARRIER: COMPANY OVERVIEW
                        FIGURE 57 CARRIER: COMPANY SNAPSHOT
                        TABLE 125 CARRIER: PRODUCTS/SOLUTIONS/SERVICES OFFERED
             12.2.3 GODREJ & BOYCE MANUFACTURING COMPANY LIMITED
                        TABLE 126 GODREJ & BOYCE MANUFACTURING COMPANY LIMITED: COMPANY OVERVIEW
                        FIGURE 58 GODREJ & BOYCE MANUFACTURING COMPANY LIMITED: COMPANY SNAPSHOT
                        TABLE 127 GODREJ & BOYCE MANUFACTURING COMPANY LIMITED: PRODUCTS/SOLUTIONS/SERVICES OFFERED
                        TABLE 128 GODREJ & BOYCE MANUFACTURING COMPANY LIMITED: PRODUCT LAUNCHES
                        TABLE 129 GODREJ & BOYCE MANUFACTURING COMPANY LIMITED: EXPANSIONS
             12.2.4 KEYGUARD
                        TABLE 130 KEYGUARD: COMPANY OVERVIEW
                        TABLE 131 KEYGUARD: PRODUCTS/SOLUTIONS/SERVICES OFFERED
             12.2.5 LANDWELL
                        TABLE 132 LANDWELL: COMPANY OVERVIEW
                        TABLE 133 LANDWELL: PRODUCTS/SOLUTIONS/SERVICES OFFERED
             12.2.6 MORSE WATCHMANS
                        TABLE 134 MORSE WATCHMANS: COMPANY OVERVIEW
                        TABLE 135 MORSE WATCHMANS: PRODUCTS/SOLUTIONS/SERVICES OFFERED
                        TABLE 136 MORSE WATCHMANS: DEALS
             12.2.7 CREONE
                        TABLE 137 CREONE: COMPANY OVERVIEW
                        TABLE 138 CREONE: PRODUCTS/SOLUTIONS/SERVICES OFFERED
             12.2.8 DEISTER ELECTRONIC GMBH
                        TABLE 139 DEISTER ELECTRONIC GMBH: COMPANY OVERVIEW
                        TABLE 140 DEISTER ELECTRONIC GMBH: PRODUCTS/SOLUTIONS/SERVICES OFFERED
             12.2.9 SECURIKEY
                        TABLE 141 SECURIKEY: COMPANY OVERVIEW
                        TABLE 142 SECURIKEY: PRODUCTS/SOLUTIONS/SERVICES OFFERED
             12.2.10 LOTO SAFETY REQUISITES TRADING LLC
                        TABLE 143 LOTO SAFETY REQUISITES TRADING LLC: COMPANY OVERVIEW
                        TABLE 144 LOTO SAFETY REQUISITES TRADING LLC: PRODUCTS/SOLUTIONS/SERVICES OFFERED
             12.2.11 KEYTRACKER LTD.
                        TABLE 145 KEYTRACKER LTD.: COMPANY OVERVIEW
                        TABLE 146 KEYTRACKER LTD.: PRODUCTS/SOLUTIONS/SERVICES OFFERED
             12.2.12 KEY SYSTEMS, INC.
                        TABLE 147 KEY SYSTEMS, INC.: COMPANY OVERVIEW
                        TABLE 148 KEY SYSTEMS, INC.: PRODUCTS/SOLUTIONS/SERVICES OFFERED
             12.2.13 DIPLOMAT CO., LTD.
                        TABLE 149 DIPLOMAT CO., LTD.: COMPANY OVERVIEW
                        TABLE 150 DIPLOMAT CO., LTD.: PRODUCTS/SOLUTIONS/SERVICES OFFERED
             12.2.14 ECOS SYSTEMS
                        TABLE 151 ECOS SYSTEMS: COMPANY OVERVIEW
                        TABLE 152 ECOS SYSTEMS: PRODUCTS/SOLUTIONS/SERVICES OFFERED
*Business Overview, Products/Services/Solutions Offered, Recent Developments, MnM View, Key Strengths and Right to Win, Strategic Choices Made, Weaknesses and Competitive Threats might not be captured in case of unlisted companies.  
     12.3 OTHER PLAYERS 
             12.3.1 NINGBO RAYONICS TECHNOLOGY CO., LTD.
             12.3.2 LOXTOP
             12.3.3 TORUS
             12.3.4 UBERGARD
             12.3.5 SAFEWELL
             12.3.6 PRAVEEN INDUSTRIES
             12.3.7 ROTTNER TRESOR GMBH
             12.3.8 ALPINE INDUSTRIES
             12.3.9 NAUTA CONNECT BV
             12.3.10 PROWAY INDUSTRIES CO LTD.
             12.3.11 PHOENIX SAFE CO. LTD.
 
13 APPENDIX (Page No. - 207)
     13.1 INSIGHTS FROM INDUSTRY EXPERTS 
     13.2 DISCUSSION GUIDE 
     13.3 KNOWLEDGESTORE: MARKETSANDMARKETS’ SUBSCRIPTION PORTAL 
     13.4 CUSTOMIZATION OPTIONS 
     13.5 RELATED REPORTS 
     13.6 AUTHOR DETAILS 
 

The study involved four major activities in estimating the digital key cabinet market size. Exhaustive secondary research has been carried out to collect information on the market, the peer markets, and the parent market. Both top-down and bottom-up approaches have been employed to estimate the total market size. Market breakdown and data triangulation methods have also been used to estimate the market for segments and subsegments.

Secondary Research

In the secondary research process, various secondary sources have been referred to for identifying and collecting information relevant to this study on the digital key cabinet market. The secondary sources included the Security Industry Association (SIA), Electronic Security Association (ESA), Association for Biometrics (AFB), International Biometric Society (IBS), annual reports, press releases, and investor presentations of companies; white papers, certified publications, and articles by recognized authors; directories; and databases.

The global size of the digital key cabinet market has been obtained from the secondary data available through paid and unpaid sources. It has also been determined by analyzing the product portfolios of the leading companies and rating them based on the quality of their offerings.

Secondary research has been used to gather key information about the industry's supply chain, the market’s monetary chain, the total number of key players, and market segmentation according to the industry trends to the bottom-most level, geographic markets, and key developments from both the market- and technology-oriented perspectives. It has also been conducted to identify and analyze the industry trends and key developments undertaken from both the market- and technology perspectives.

Primary Research

In the primary research process, various primary sources have been interviewed to obtain qualitative and quantitative information about the market across four main regions-Asia Pacific, North America, Europe, and the Rest of the World (the Middle East & Africa, and South America). Primary sources from the supply side include industry experts such as CEOs, vice presidents, marketing directors, technology directors, and other related key executives from major companies and organizations operating in the digital key cabinet market or related markets.

After completing market engineering, primary research was conducted to gather information and verify and validate critical numbers from other sources. Primary research has also been conducted to identify various market segments; industry trends; key players; competitive landscape; and key market dynamics, such as drivers, restraints, opportunities, and challenges, along with key strategies adopted by market players. Most primary interviews have been conducted with the market's supply side. This primary data has been collected through questionnaires, emails, and telephonic interviews.

Digital Key Cabinet Market
 Size, and Share

To know about the assumptions considered for the study, download the pdf brochure

Market Size Estimation

In the complete engineering process, both top-down and bottom-up approaches and several data triangulation methods have been used to estimate and validate the size of the overall digital key cabinet market and other dependent submarkets. Key players in the market have been identified through secondary research, and their market positions in the respective geographies have been determined through both primary and secondary research. This entire procedure includes studying top market players’ annual and financial reports and extensive interviews with industry leaders such as CEOs, VPs, directors, and marketing executives for key insights (qualitative and quantitative).

All percentage shares and breakdowns have been determined using secondary sources and verified through primary sources. All the possible parameters that affect the markets covered in this research study have been accounted for, viewed in detail, verified through primary research, and analyzed to obtain the final quantitative and qualitative data. This data has been consolidated and supplemented with detailed inputs and analysis from MarketsandMarkets and presented in this report.

Global Digital key cabinet Market Size: Bottom-Up Approach

Digital Key Cabinet Market
 Size, and Bottom-Up Approach

Global Digital key cabinet Market Size: Top-Down Approach

Digital Key Cabinet Market
 Size, and Top-Down Approach

Data Triangulation

After arriving at the overall market size from the estimation process explained above, the overall market has been split into several segments and subsegments. To complete the overall market engineering process and arrive at the exact statistics for all segments and subsegments, the market breakdown and data triangulation procedures have been employed, wherever applicable. Data has been triangulated by studying various factors and trends from both the demand and supply sides. Along with this, the market size has been validated using top-down and bottom-up approaches.

Market Definition

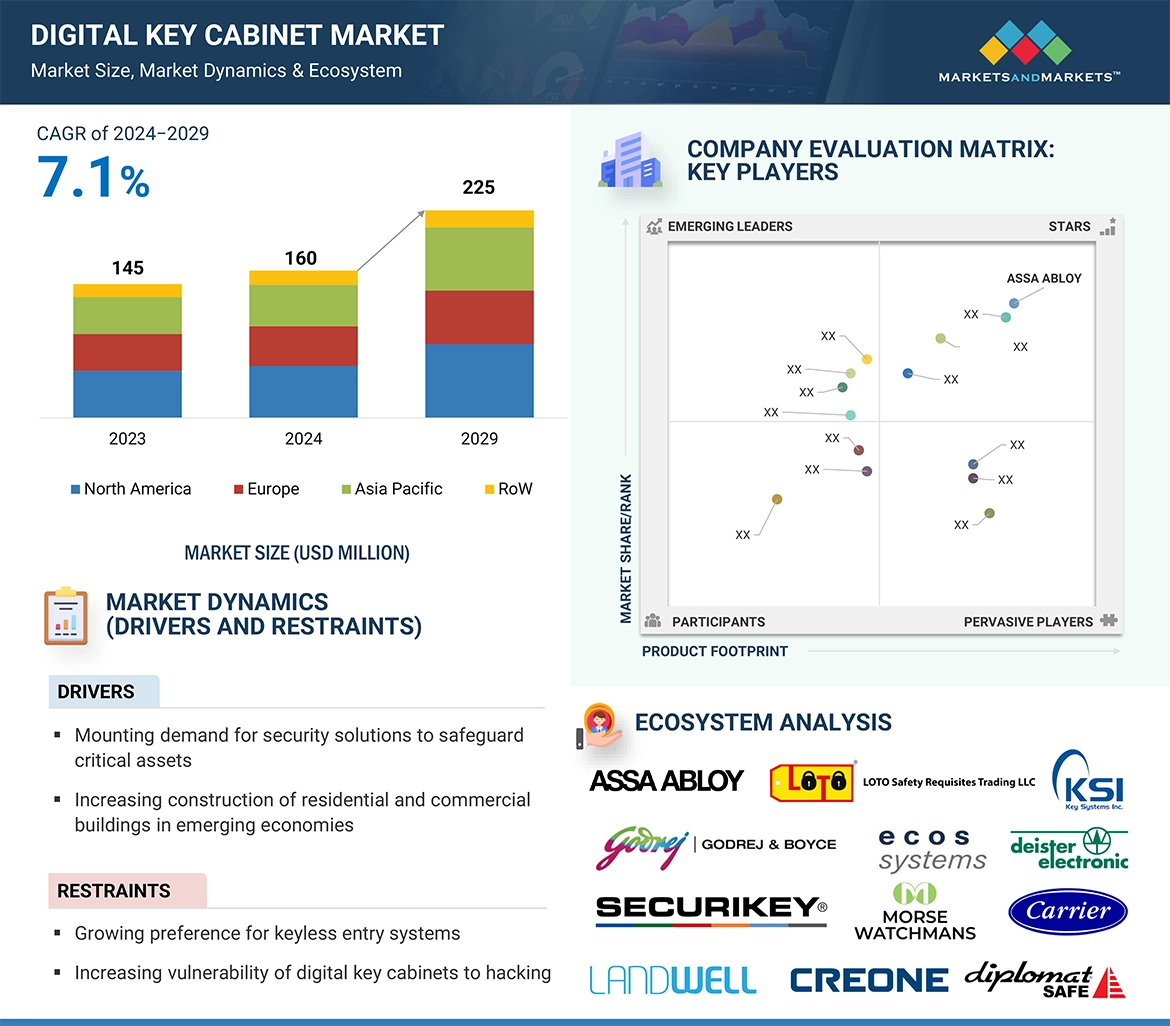
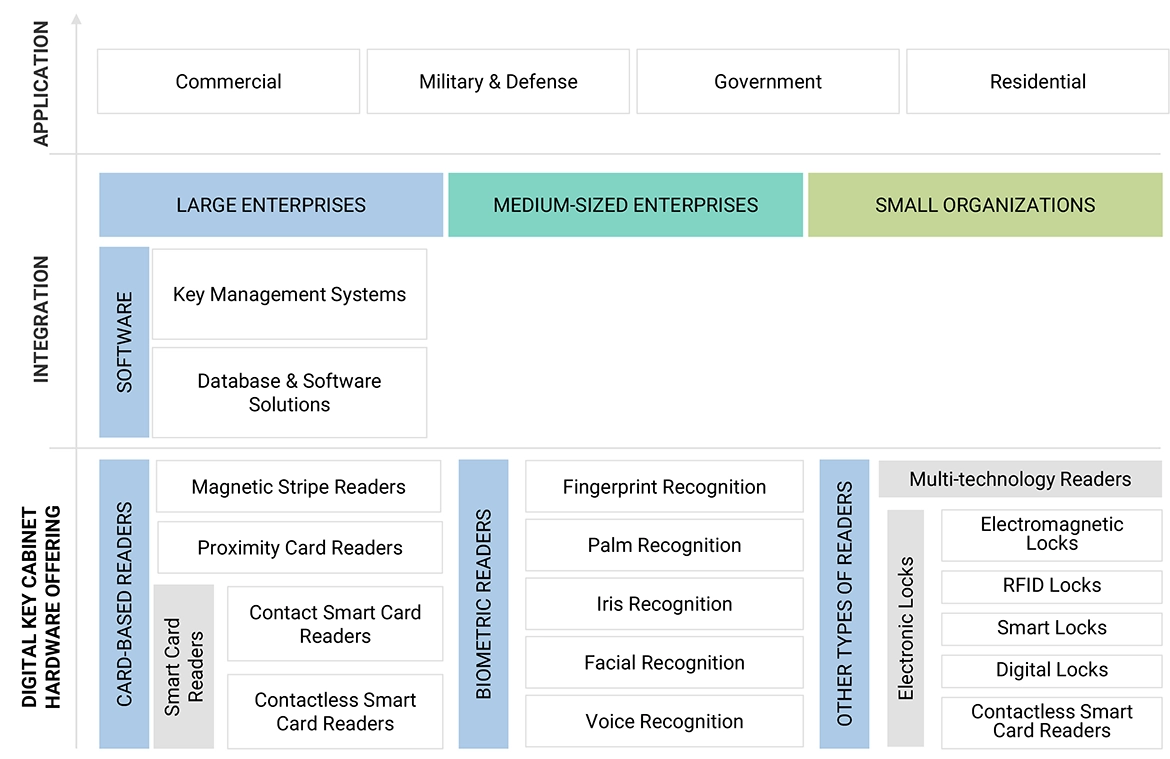
A digital key cabinet is a secure, electronically managed system designed for storing and controlling access to physical keys. It uses advanced technology such as RFID, biometrics, PIN codes, or card readers to track key usage, ensure authorized access, and provide detailed audit trails. These cabinets are often integrated with software that allows administrators to manage keys remotely, set access permissions, and receive alerts in case of unauthorized access or anomalies. Digital key cabinets enhance security, improve accountability, and streamline key management processes in various settings, including corporate offices, government institutions, hospitals, educational institutions, and industrial facilities.

Key Stakeholders

  • Raw material suppliers
  • Research organizations
  • Original equipment manufacturers (OEMs)
  • Technology investors
  • Analysts and strategic business planners
  • Government bodies, venture capitalists, and private equity firms
  • End users

Report Objectives

  • To define, describe, estimate, and forecast the digital key cabinet market, in terms of value, on the basis of offering, capacity, application, and geography
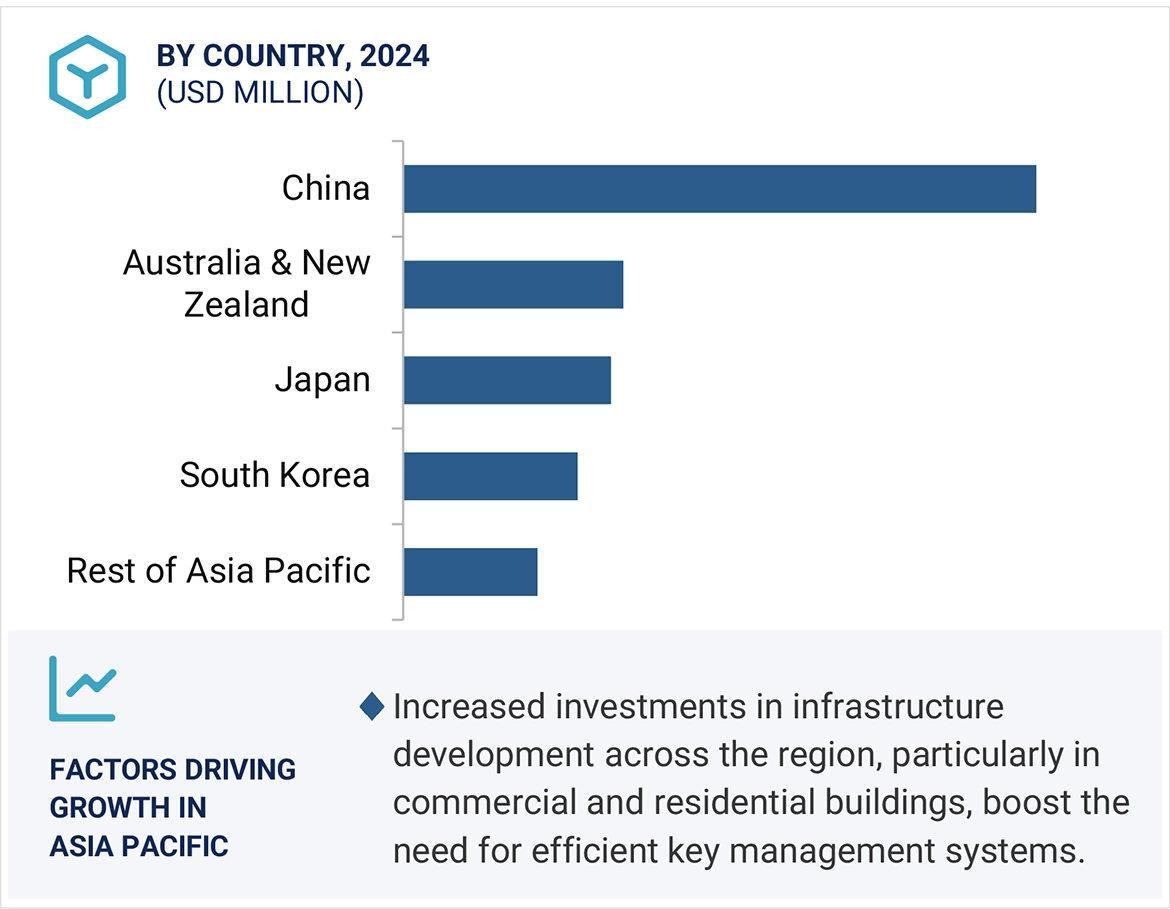
  • To forecast the market size of concerned segments with respect to 4 main regions—North America, Europe, Asia Pacific (APAC), and the Rest of the World (RoW)
  • To provide a detailed information regarding the major drivers, restraints, opportunities, and challenges influencing the growth of the market
  • To analyze micromarkets1 with respect to individual growth trends, prospects, and contribution to the overall market
  • To analyze the value chain, market ecosystem; trends/disruptions impacting customer’s business; technology analysis; pricing analysis; Porter’s five forces model; key stakeholders & buying criteria; case study analysis; trade analysis; patent analysis; key conferences & events, 2024–2025; regulations related to the digital key cabinet market; and investment and funding scenario.
  • To profile key players and comprehensively analyze their market ranks and core competencies2, along with detailing the competitive landscape for market leaders
  • To benchmark players within the market using the proprietary Company Evaluation Matrix framework, which analyzes market players on various parameters within the broad categories of market rank and product offering
  • To track and analyze competitive developments such as product launches and acquisitions, and research and development (R&D) activities in the digital key cabinet market
  • To analyze the opportunities in the market for stakeholders and provide details of the competitive landscape to the market leaders

Available customizations:

With the given market data, MarketsandMarkets offers customizations according to the specific requirements of companies. The following customization options are available for the report:

  • Detailed analysis and profiling of additional market players (up to 5 players) based on various blocks of the supply chain
Custom Market Research Services

We will customize the research for you, in case the report listed above does not meet with your exact requirements. Our custom research will comprehensively cover the business information you require to help you arrive at strategic and profitable business decisions.

Request Customization
Report Code
SE 9027
Published ON
May, 2024
Choose License Type
BUY NOW
  • SHARE
X
Request Customization
Speak to Analyst
Speak to Analyst
OR FACE-TO-FACE MEETING
PERSONALIZE THIS RESEARCH
  • Triangulate with your Own Data
  • Get Data as per your Format and Definition
  • Gain a Deeper Dive on a Specific Application, Geography, Customer or Competitor
  • Any level of Personalization
REQUEST A FREE CUSTOMIZATION
LET US HELP YOU!
  • What are the Known and Unknown Adjacencies Impacting the Digital Key Cabinet Market
  • What will your New Revenue Sources be?
  • Who will be your Top Customer; what will make them switch?
  • Defend your Market Share or Win Competitors
  • Get a Scorecard for Target Partners
CUSTOMIZED WORKSHOP REQUEST
  • Call Us
  • +1-888-600-6441 (Corporate office hours)
  • +1-888-600-6441 (US/Can toll free)
  • +44-800-368-9399 (UK office hours)
CONNECT WITH US
ABOUT TRUST ONLINE
©2024 MarketsandMarkets Research Private Ltd. All rights reserved
DMCA.com Protection Status Website Feedback