The study involved four major activities in estimating the size of the data center containment market. Exhaustive secondary research has been conducted to collect information on the market, the peer markets, and the parent market. Both top-down and bottom-up approaches have been employed to estimate the total market size. Market breakdown and data triangulation methods have also been used to estimate the market for segments and subsegments.
Secondary Research
Revenues of companies offering data center containment solutions have been obtained from the secondary data available through paid and unpaid sources. The revenues have also been derived by analyzing the product portfolio of key companies, and these companies have been rated according to the performance and quality of their products.
Various secondary sources have been referred to in the secondary research process for identifying and collecting information important for this study. Secondary sources include corporate filings (such as annual reports, investor presentations, and financial statements); trade, business, and professional associations; white papers; IoT technologies journals and certified publications; articles by recognized authors; gold-standard and silver-standard websites; directories; and databases.
Secondary research has been conducted mainly to obtain critical information about the market’s value chain, the total pool of key players, market classification and segmentation according to the industry trends to the bottom-most level, geographic markets, and key developments from both demand- and technology-oriented perspectives. Secondary data has been collected and analyzed to determine the overall market size, further validated by primary research.
Primary Research
Extensive primary research has been conducted after understanding and analyzing the current scenario of the data center containment market through secondary research. Several primary interviews have been conducted with key opinion leaders from both demand and supply sides across 4 major regions: North America, Europe, Asia Pacific, and RoW. Approximately 25% of the primary interviews have been conducted with the demand side, while 75% have been conducted with the supply side. Primary data has been collected mainly through telephonic interviews, which consist of 80% of the total primary interviews. questionnaires and e-mails have also been used to collect data.
After interacting with industry experts, brief sessions were conducted with highly experienced independent consultants to reinforce the findings from our primary. This along with the in-house subject matter experts’ opinions, has led us to the findings as described in the remainder of this report. The breakdown of primary respondents is as follows:

To know about the assumptions considered for the study, download the pdf brochure
Market Size Estimation
The bottom-up procedure has been employed to arrive at the overall size of the data center containment market.
-
Analyzing the size of the global data center containment market by identifying data centers in terms of size/type, i.e., hyperscale, enterprise, colocation, and other data centers (sqft)
-
The total data center area across different types of data centers was tracked.
-
The setup cost per sqft for data center containment solutions was estimated through primary and secondary sources.
-
Setup cost multiplied with the total data center area to arrive at the global data center containment market.
-
The global data center containment market value was calculated by data center type.
-
Identifying the upcoming projects related to data center containment by various companies in different regions and forecasting the market size based on these developments and other important parameters.

The top-down approach has been used to estimate and validate the total size of the data center containment market.
-
Initially, MarketsandMarkets focused on the top-line investment and expenditure in the ecosystems of data center technology, which also includes data center containment. The data center containment market was further split by new installations, upgrades, and major developments in the key market area.
-
Further information was derived from the market revenue generated by the key data center containment solution providers.
-
Multiple on-field discussions were carried out with key opinion leaders across each major company involved in the development of data center containment
-
The geographic splits were estimated using secondary sources based on various factors, such as the number of players in a specific country and region, the level of solutions offered, and the type of solution implemented.

Data Triangulation
After arriving at the overall size of the data center containment market through the process explained, the total market has been split into several segments and subsegments. Market breakdown and data triangulation procedures have been employed, wherever applicable, to complete the overall market engineering process and arrive at the exact statistics for all segments and subsegments. The data has been triangulated by studying various factors and trends from the demand and supply sides. The market has also been validated using the top-down and bottom-up approaches.
Market Definition
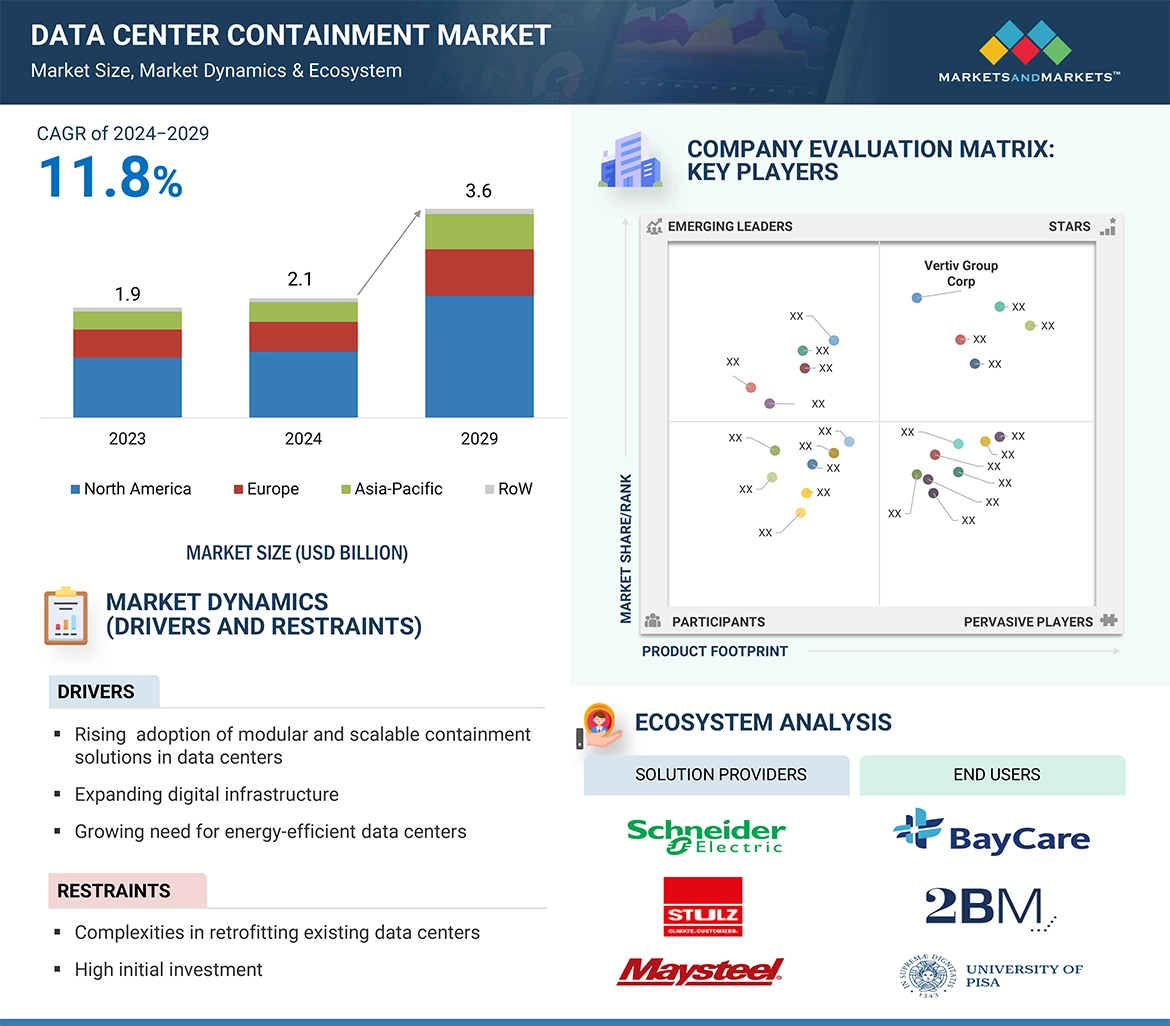
Data center containment involves managing airflow within a data center to enhance cooling efficiency and decrease energy usage. This is achieved through the implementation of physical barriers like partitions, doors, and ceilings, which separate hot and cold airflows. By containing the hot air emitted by servers and diverting it away from the cool air intake, containment systems ensure a uniform temperature across the data center. This practice is especially crucial in large-scale data centers, where effective heat management is essential for sustained performance and minimal downtime.
Key Stakeholders
-
NGOs, Governments, Investment Banks, Venture Capitalists, and Private Equity Firms
-
Telecom Services Providers
-
Original Equipment Manufacturers
-
Value-added Service Providers
-
Data Center Containment Solution Vendors
-
Data Center Operators
-
Data Center Colocation Service Providers
-
System Integrators
-
Cloud Service Providers
-
Colocation Service Providers
Report Objectives
-
To define, describe, segment, and forecast the size of the data center containment market, by containment type, arrangement, data center type in terms of value
-
To forecast the market size for various segments with respect to four main regions, namely, the North America, Europe, Asia Pacific, and Rest of the World (RoW), in terms of value
-
To forecast the size of the data center containment market by containment type, in terms of volume
-
To provide detailed information regarding the drivers, restraints, opportunities, and challenges influencing the growth of the data center containment market
-
To study the complete supply chain and allied industry segments and perform a supply chain analysis of the data center containment market landscape
-
To strategically analyze macro and micromarkets1 with respect to growth trends, prospects, and their contributions to the overall market
-
To analyze industry trends, average selling price, patents and innovations, and trade data (export and import data) in the data center containment market
-
To analyze opportunities in the market for stakeholders and provide a detailed competitive landscape of the market
-
To strategically profile key players in the market and comprehensively analyze their market share/ranking and core competencies2
-
To analyze competitive developments such as contracts, product launches/developments, expansions, and research & development (R&D) activities carried out by players in the data center containment market
Available customizations:
With the given market data, MarketsandMarkets offers customizations according to the specific requirements of companies. The following customization options are available for the report:
-
Detailed analysis and profiling of additional market players based on various blocks of the supply chain


 LARGEST MARKET SHARE IN 2023
 CANADA FASTER-GROWING MARKET IN REGION
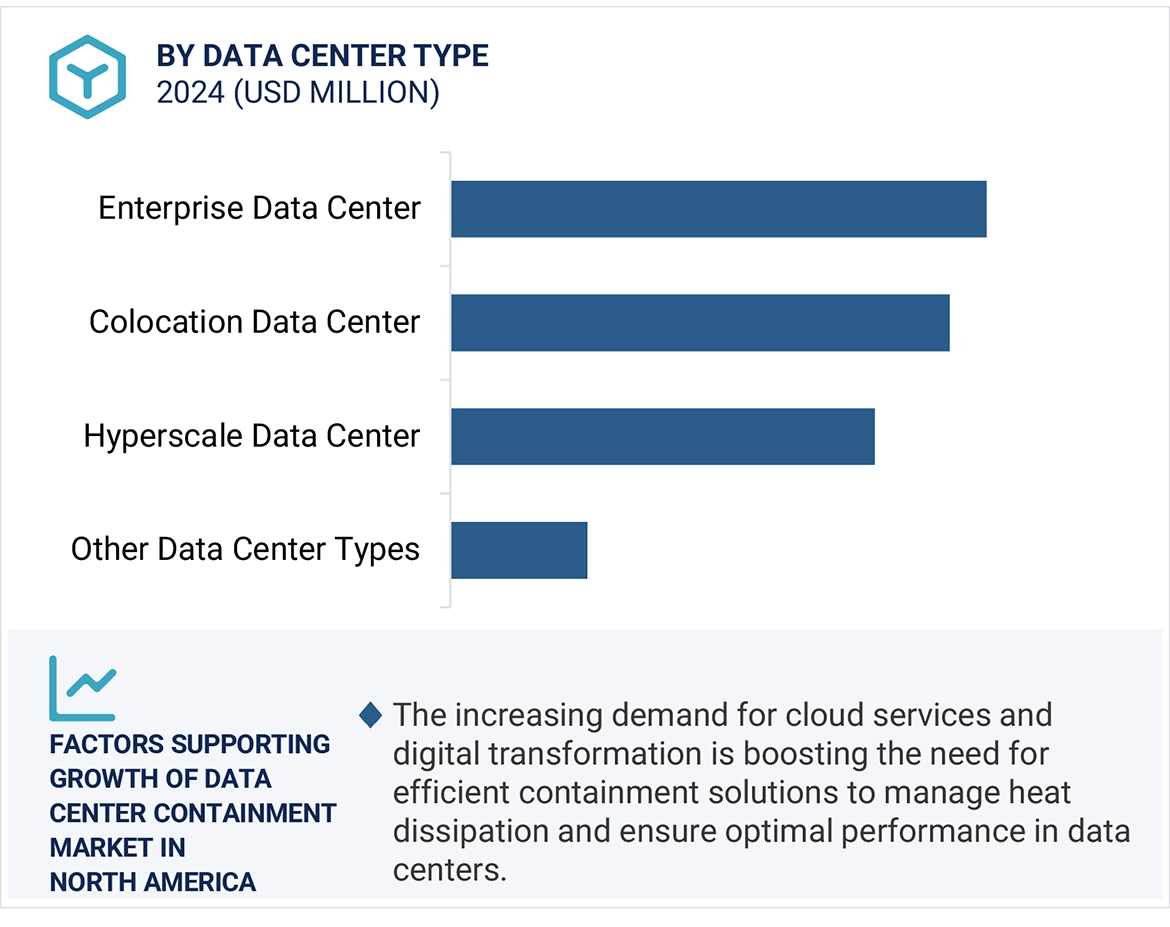


Kevin
Apr, 2026
Does the report include country-level insights for major markets like the USA, China, India, Germany, and UAE, especially regarding hyperscale data center expansion?.
Mark
Apr, 2026
This report seems extremely valuable as it clearly covers multi-layer segmentation and real-world growth drivers in the data center ecosystem..