Facial Recognition Market by Offering (Hardware, Software Solutions, Services), Application, Organization Size, Deployment Mode (Cloud, On-premises), Vertical (BFSI, Government, Retail & E-commerce) and Region - Global Forecast to 2028
The global Facial Recognition market size accounted for USD 6.3 Billion in 2023 and is estimated to achieve a market size of USD 13.4 Billion by 2028 growing at a CAGR of 16.3% from 2023 to 2028. Facial recognition technology streamlines and automates processes to increase efficiency and productivity. Whether applied in attendance tracking in educational institutions, monitoring patient identification in healthcare settings, or automating payment systems in retail, facial recognition minimizes manual efforts and enhances overall operational efficiency. The speed and accuracy with which it can perform tasks contribute to time savings and improved workflow, making it an attractive solution for organizations seeking streamlined and automated processes across various domains. This efficiency-driven aspect of facial recognition continues to propel its adoption in education, healthcare, and retail sectors aiming for enhanced operational effectiveness.
To know about the assumptions considered for the study, Request for Free Sample Report
To know about the assumptions considered for the study, download the pdf brochure
Facial Recognition Market Trends
Driver: Growing concerns about security and the rising need for robust surveillance systems
Facial recognition technology is increasingly being adopted due to security concerns, particularly in airports and critical infrastructure sectors. These technologies streamline security procedures, reduce processing times, and enhance safety. In public spaces, facial recognition helps identify and track individuals in crowded areas, preventing potential security threats or criminal activities. In critical infrastructure, such as power plants and transportation hubs, facial recognition provides an additional layer of authentication and monitoring to mitigate security risks. However, utilizing facial recognition with privacy considerations and addressing potential ethical and legal implications is crucial. Facial recognition technology surges efficiency and reliability within biometric verification to avoid human error. Traditional security systems require personnel to monitor premises and movement to verify guests and spot intruders. Smart surveillance systems using facial recognition technology verify identities and provide real-time alerts when pre-defined events occur, like a block-listed person entering a restricted area or a VIP guest arriving at the reception area. This high accuracy rate and speed allow organizations to allocate resources better, shorten reaction time, and reduce operational costs in the long term.
For instance, in February 2024, American Chemical Society (ACS) researchers reported a more streamlined 3D surface imaging system with flatter, simpler optics. The new system could identify Michelangelo's David's face with the same accuracy as an existing smartphone system.
Restraint: Privacy concerns
Privacy concerns are a significant barrier to the broad use of facial recognition technology because they create concerns about potential misuse of privacy. This might lead to worry about illegal monitoring, in which people could be watched without their knowledge or agreement, which is one of the main restraints. Moreover, a severe risk is associated with possibly misusing the biometric information gathered by facial recognition systems. Identity theft or unlawful access to private information can result from data breaches, hacking, or the unapproved exchange of biometric data. The deployment of facial recognition in public spaces and its integration with surveillance cameras raise concerns about mass surveillance. Critics argue that constant monitoring infringes upon individuals' civil liberties, creating a society where people feel constantly observed, eroding the expectation of privacy in public areas.
Opportunity: Integration of facial recognition in mobile devices for authentication and security
Incorporating facial recognition technology into mobile devices presents a significant potential for expansion, carrying substantial consequences for security and identification. Facial recognition technology for device identification improves user ease and security as cell phones have become commonplace. By exposing their faces to the device, users can unlock their phones, conduct safe transactions, and access sensitive data without needing more cumbersome procedures like PINs or fingerprint scans with mobile device integration.
This opportunity goes beyond convenience because facial recognition gives mobile devices an extra security layer. The distinct biometric information obtained by facial recognition algorithms increases the security of sensitive data and personal information kept on the device by making it harder for unwanted users to access.
Mobile facial recognition technology is essential for secure mobile payments, app access, identity verification, and device unlocking. Because safe face recognition authentication is so convenient, it may become widely used in various industries, such as finance, e-commerce, and healthcare, where user-friendliness and security are critical requirements.
Challenge: Vulnerability to hacking and rising deep fakes
A significant challenge that needs to be addressed to maintain the integrity and security of facial recognition systems is the susceptibility of facial recognition systems to hacking and cyber threats. Facial recognition systems are vulnerable to various cyberattacks, such as data breaches, unauthorized access, and manipulation of biometric data, just like any other technology. Hackers may take advantage of flaws in the software of face recognition systems to obtain private information without authorization or to undermine the system's operation. Malicious actors could, for instance, alter facial photos to evade authentication procedures and intercept facial recognition data. At the same time, it is being transmitted or interfered with the system's algorithms to yield unreliable results. Furthermore, facial recognition systems centralized biometric data storage makes them an attractive target for fraudsters.
Presently, Deepfakes are being used to circumvent facial recognition systems. Deepfake involves manipulating or fabricating video sequences, making camera injection feasible. Cybercriminals use camera injection attacks to insert modified video footage into facial recognition systems, taking advantage of flaws in these systems.
Camera injection attacks have emerged amid increasing reliance on facial recognition security, posing a new threat to facial recognition security. This can be concerning as an attacker successfully evades detection. They can gain unauthorized access to accounts.
Organizations can defend against camera injection attacks by implementing a comprehensive identity verification and fraud prevention approach.
The major players in the facial recognition market are NEC, Microsoft, Thales, and AWS. The market for facial recognition is dominated by well-known businesses that have made a name for themselves as domain leaders. These businesses are prominent, secure financially, and have a track record of offering cutting-edge facial recognition services and software solutions. They can respond to the market's changing needs owing to their broad range of products, including hardware, software solutions, applications, and services. These businesses are leading the way in the advancement of facial recognition technology with their expansive capabilities and innovative technology.
By application, the finance and payments segment registered the highest growth rate during the forecast period.
By application, the finance and payments segment is set to achieve the highest growth rate in the facial recognition market during the forecast period. There is a surge in facial recognition technology usage for particular financial and payment operations made via digital wallets and smartphone applications. Currently, computerized Know all international financial institutions use Know Your Customer (KYC) systems that utilize facial recognition technology. This technology offers safe transactions, quick and easy identification verification, and improved security against identity theft, driving the growth of the facial recognition market.
Based on vertical, the Government segment accounts for the largest market size in the forecast period.
The government segment is poised to command the largest market size in the facial recognition market. This financial services sector increasingly utilizes biometric technologies to improve physical security and public safety. For instance, banks often use facial recognition to verify a client's identification for online or mobile banking apps. To control admission and access to restricted building portions, banks also utilize facial recognition technology known as "contained access control." The bank aims to provide customers with a secure and convenient authentication method through facial recognition, ensuring a smooth and fast mobile banking experience.
Asia Pacific will register the highest growth rate during the forecast period.
During the forecast period, the Asia Pacific region is set to register the highest growth rate in the facial recognition market. Facial recognition technology has seen significant adoption in Asia, driven by technological advancements and a growing focus on modernization. The technology finds facial recognition applications in various sectors, including security, retail, and finance. From access control systems to consumer electronics, facial recognition is increasingly integrated into daily life. However, its proliferation has sparked concerns about privacy, data security, and potential misuse, leading to ongoing considerations about ethical and regulatory frameworks. As technology evolves, balancing its benefits with privacy safeguards remains a key challenge in the Asia Pacific's broader embrace of facial recognition solutions.
Key Market Players:
The major players in the facial recognition market companies are NEC (Japan), Microsoft (US), Thales (France), AWS (US), IDEMIA (France), Aware (US), Daon (Ireland), Megvii (China), Facephi (Spain), Herta Security (Spain), OneSpan (US), Q3 Technologies (US), Neurotechnology (Lithuania), Cognitec Systems (Germany), Ayonix (Japan), NVISO.ai (Switzerland), FaceFirst (US), Clarifai (US), Iproov (UK), Oosto (Israel), Pangiam (US), Clearview AI (US), Corsight AI (Israel), Facia (UK) Veridium (US), and Visage Technology (Sweden).
Want to explore hidden markets that can drive new revenue in Facial Recognition Market?
Scope of the Report
Want to explore hidden markets that can drive new revenue in Facial Recognition Market?
Report Metrics |
Details |
Market size available for years |
2017-2028 |
Base year considered |
2022 |
Forecast period |
2023-2028 |
Forecast units |
Value (USD) Billion |
Segments Covered |
By offering, organization size, deployment mode, applications, and vertical |
Region covered |
North America, Europe, Asia Pacific, Middle East and Africa, and Latin America |
Companies covered |
NEC (Japan), Microsoft (US), Thales (France), AWS (US), IDEMIA (France), Aware (US), Daon (Ireland), Megvii (China), Facephi (Spain), Herta Security (Spain), OneSpan (US), Q3 Technologies (US), Neurotechnology (Lithuania), Cognitec Systems (Germany), Ayonix (Japan), NVISO.ai (Switzerland), FaceFirst (US), Clarifai (US), Iproov (UK), Oosto (Israel), Pangiam (US), Clearview AI (US), Corsight AI (Israel), Facia (UK) Veridium (US), and Visage Technology (Sweden). |
This research report categorizes the facial recognition market to forecast revenues and analyze trends in each of the following submarkets:
Based on the offering:
- Hardware
- Solutions
- Facial Verification
- Facial Identiification
- Facial Analytics
- Facial Liveness Detection
- Services
-
Professional
- Consulting Services
- Design and Implementation Services
- Deployment and Support Services
- Managed
Based on Organization size:
- SMEs
- Large enterprises
Based on Deployment mode:
- Cloud
- On-premises
Based on the vertical:
- BFSI
- Retail and eCommerce
- Government
- Media and Entertainment
- Healthcare
- Education
- Manufacturing
- Transportation and Utilities
- Others
Based on the region:
-
North America
- US
- Canada
-
Europe
- UK
- Germany
- France
- Italy
- Rest of Europe
-
Asia Pacific
- China
- Japan
- India
- AnZ
- Rest of Asia Pacific
-
Middle East and Africa
-
Middle East
- Gulf Cooperation Council (GCC)
- Rest of the Middle East
- Africa
-
Middle East
-
Latin America
- Brazil
- Mexico
- Rest of Latin America
Recent Developments
- In November 2023, NEC entered into an agreement with Ideal Innovations Inc. (I3) regarding user training, system and software development, and operations support. This collaboration aims to promote the responsible use of face recognition systems and enhance professionals' skills in the field.
- In June 2023, Thales agreed with Australian cybersecurity vendor Tesserent to acquire all of its shares to increase the biometrics and digital identity giant's footprint in Australia and New Zealand.
- In March 2023, AWS and NVIDIA announced a multi-part collaboration to build the world's most scalable, on-demand AI infrastructure optimized for training increasingly complex large language models (LLMs) and developing generative AI applications.
- In March 2023, Aware partnered with Anyline to integrate Knomi, Aware's mobile biometric authentication framework, into the Electronic Know Your Customer (eKYC) identity verification process for one of the largest banks in Pakistan.
Frequently Asked Questions (FAQ):
What is facial recognition?
Facial recognition is a biometric technology that involves individuals' identification, authentication, or verification based on their facial features. This advanced system uses complex algorithms to analyze unique facial patterns, such as the distance between eyes, nose shape, and jawline, creating a facial template for each person.
What is the market size of the managed facial recognition market?
The global facial recognition market is estimated to be worth USD 6.3 billion in 2023 and is projected to reach USD 13.4 billion by 2028, at a CAGR of 16.3% during the forecast period.
What are the major drivers in the facial recognition market?
The major drivers in the facial recognition market include growing concerns about security and the rising need for robust surveillance systems, advancements in facial recognition algorithms, machine learning, AI, and contactless technologies post-COVID-19.
Who are the major players operating in the facial recognition market?
The major players in the facial recognition market are NEC (Japan), Microsoft (US), Thales (France), AWS (US), IDEMIA (France), Aware (US), Daon (Ireland), Megvii (China), Facephi (Spain), Herta Security (Spain), OneSpan (US), Q3 Technologies (US), Neurotechnology (Lithuania), Cognitec Systems (Germany), Ayonix (Japan), NVISO.ai (Switzerland), FaceFirst (US), Clarifai (US), Iproov (UK), Oosto (Israel), Pangiam (US), Clearview AI (US), Corsight AI (Israel), Facia (UK) Veridium (US), and Visage Technology (Sweden).
Which key technology trends prevail in the facial recognition market?
Primarily, deep learning and artificial intelligence advancements have significantly improved facial recognition accuracy, enabling systems to handle complex scenarios and diverse datasets more effectively. Secondly, the shift towards edge computing has allowed for processing facial recognition data closer to the source, reducing latency and enhancing real-time applications. Additionally, there's a growing emphasis on ethical considerations, with increased attention on mitigating biases in facial recognition algorithms and addressing privacy concerns. Integrating facial recognition with other biometric modalities, such as voice recognition or iris scanning, is also a notable trend, offering more robust and multi-modal authentication solutions. .
To speak to our analyst for a discussion on the above findings, click Speak to Analyst
Exclusive indicates content/data unique to MarketsandMarkets and not available with any competitors.
- 5.1 INTRODUCTION
-
5.2 MARKET DYNAMICSDRIVERS- Growth in security concerns and rise in need for robust surveillance systems- Advancements in facial recognition algorithms, ML, and AI- Rise in contactless technologies post-COVID-19RESTRAINTS- Privacy concerns- Rise in false positives and negativesOPPORTUNITIES- Emerging use cases/applications in various sectors- Integration of facial recognition in mobile devices for authentication and securityCHALLENGES- Lack of global standards- Vulnerability to hacking and rising deep fakes
-
5.3 FACIAL RECOGNITION TECHNOLOGY EVOLUTIONFACIAL RECOGNITION PIONEERSAUTOMATIC FACIAL RECOGNITIONSTANDARDIZATION AND ADVANCEMENTRAPID DEVELOPMENT AND EXPANSIONPRESENT AND FUTURE
- 5.4 FACIAL RECOGNITION TOOLS, FRAMEWORKS, AND TECHNIQUES
-
5.5 CASE STUDY ANALYSISSTAR ALLIANCE SMOOTHENED TRAVEL EXPERIENCE WITH NEC I: DELIGHT PLATFORMAELLA CREDIT LEVERAGED AMAZON’S FACIAL RECOGNITION SOLUTION FOR FASTER LOAN APPROVALSNERO USED COGNITEC’S FACE RECOGNITION TECHNOLOGY TO SORT PHOTOS
-
5.6 VALUE CHAIN ANALYSISCOMPONENT PROVIDERSSOFTWARE PROVIDERSSERVICE PROVIDERSSYSTEM INTEGRATORSDISTRIBUTIONEND USERS
- 5.7 ECOSYSTEM ANALYSIS
-
5.8 PORTER’S FIVE FORCES ANALYSISTHREAT OF NEW ENTRANTSBARGAINING POWER OF SUPPLIERSBARGAINING POWER OF BUYERSTHREAT OF SUBSTITUTESINTENSITY OF COMPETITIVE RIVALRY
-
5.9 PRICING ANALYSISAVERAGE SELLING PRICE TREND OF KEY PLAYERS, BY SOFTWARE SOLUTIONINDICATIVE PRICING ANALYSIS- Indicative pricing analysis of facial recognition solutions
-
5.10 TECHNOLOGY ANALYSISKEY TECHNOLOGIES- Facial detection and extraction- Facial feature representation- Deep learning and neural networks- Facial matching algorithms- 3D facial recognitionCOMPLEMENTARY TECHNOLOGIES- Liveness detection- Facial database management- Privacy protection mechanismsADJACENT TECHNOLOGIES- Biometric integration- IoT and edge computing- Artificial intelligence- Machine learning
- 5.11 TRADE ANALYSIS
-
5.12 PATENT ANALYSISMETHODOLOGY
- 5.13 TRENDS/DISRUPTIONS IMPACTING CUSTOMERS’ BUSINESSES
-
5.14 TECHNOLOGY ROADMAPFACIAL RECOGNITION TECHNOLOGY ROADMAP TILL 2030- Short-term roadmap (2023–2025)- Mid-term roadmap (2026–2028)- Long-term roadmap (2029–2030)
-
5.15 BEST PRACTICES IN FACIAL RECOGNITION MARKETTRAINING MODEL ENSURING DATASET QUALITYENSURING HIGH-QUALITY DATA ANNOTATIONCONSIDERING ETHICAL FACTORS
- 5.16 CURRENT AND EMERGING BUSINESS MODELS
-
5.17 TARIFF AND REGULATORY LANDSCAPETARIFF RELATED TO FACIAL RECOGNITION PRODUCTSREGULATORY LANDSCAPE- Regulatory bodies, government agencies, and other organizations
-
5.18 KEY STAKEHOLDERS & BUYING CRITERIAKEY STAKEHOLDERS IN BUYING PROCESSBUYING CRITERIA
- 5.19 KEY CONFERENCES & EVENTS
- 5.20 INVESTMENT LANDSCAPE
- 6.1 INTRODUCTION
- 6.2 2D FACIAL RECOGNITION
- 6.3 3D FACIAL RECOGNITION
- 6.4 FACIAL THERMOGRAPHY
- 6.5 SKIN TEXTURE ANALYSIS
- 6.6 FACIAL EXPRESSION RECOGNITION
- 6.7 FACIAL ATTRIBUTE RECOGNITION
-
7.1 INTRODUCTIONOFFERINGS: MARKET DRIVERS
-
7.2 HARDWAREINCREASED DEMAND FOR REAL-TIME PROCESSING AND REDUCED DEPENDENCE ON EXTERNAL NETWORKS TO FUEL DEMAND FOR FACIAL RECOGNITION HARDWARE
-
7.3 SOFTWARE SOLUTIONSTECHNOLOGICAL ADVANCEMENTS, INCREASED COMPUTING POWER, AND GROWING NEED FOR SEAMLESS IDENTITY VERIFICATION TO DRIVE MARKETFACE IDENTIFICATIONFACE VERIFICATIONFACIAL ANALYTICSFACE LIVENESS DETECTION
-
7.4 SERVICESFACIAL RECOGNITION SERVICES TO ENSURE ACCURACY AND EFFICIENCY IN IDENTIFYING INDIVIDUALS BASED ON FACIAL FEATURESPROFESSIONAL SERVICES- Consulting services- Design & implementation services- Deployment & support servicesMANAGED SERVICES
-
8.1 INTRODUCTIONDEPLOYMENT MODES: MARKET DRIVERS
-
8.2 ON-PREMISESON-PREMISE DEPLOYMENT TO ENSURE GREATER CONTROL OVER INFRASTRUCTURE AND MAINTENANCE OF SENSITIVE DATA
-
8.3 CLOUDCLOUD-BASED FACIAL RECOGNITION SOLUTIONS TO OFFER SCALABILITY, FLEXIBILITY, COST-EFFECTIVENESS, AND ACCESSIBILITY
-
9.1 INTRODUCTIONORGANIZATION SIZES: MARKET DRIVERS
-
9.2 LARGE ENTERPRISESFACIAL RECOGNITION TO IMPROVE SECURITY AND EFFICIENCY, STREAMLINE WORKFLOWS, AND ENHANCE SECURITY PROTOCOLS IN LARGE ENTERPRISES
-
9.3 SMALL AND MEDIUM-SIZED ENTERPRISESSMALL AND MEDIUM-SIZED ENTERPRISES TO IMPLEMENT AFFORDABLE FACIAL RECOGNITION SOLUTIONS FOR ACCESS CONTROL, CUSTOMER IDENTIFICATION, AND EMPLOYEE ATTENDANCE TRACKING
-
10.1 INTRODUCTIONAPPLICATIONS: MARKET DRIVERS
-
10.2 SECURITY & ACCESS CONTROLFACIAL RECOGNITION TECHNOLOGY TO HELP MONITOR PEOPLE, IDENTIFY INDIVIDUALS IN CROWDED AREAS, AND LOCATE SUSPECTS QUICKLYBIOMETRIC AUTHENTICATIONPERIMETER SECURITYLAW ENFORCEMENT INVESTIGATIONSACCESS CONTROLATTENDANCE TRACKING & MONITORING
-
10.3 FINANCE & PAYMENTSFACIAL RECOGNITION TO OFFER SAFE TRANSACTIONS, QUICK AND EASY IDENTIFICATION VERIFICATION, AND IMPROVED SECURITY AGAINST IDENTITY THEFTDIGITAL TRANSACTION SECURITYFRAUD PREVENTION & IDENTITY VERIFICATIONMOBILE & CONTACTLESS TRANSACTION SECURITY
-
10.4 RETAIL & MARKETINGRETAIL & MARKETING INDUSTRIES TO HARNESS FACIAL RECOGNITION INSIGHTS TO IMPROVE BUYING EXPERIENCETAILORED SHOPPING, CUSTOMER-CENTRIC ADS, AND PROMOTIONLOYALTY PROGRAMS & REWARDSSENTIMENT ANALYSISTHEFT DETECTION & PREVENTION
-
11.1 INTRODUCTIONVERTICALS: MARKET DRIVERS
-
11.2 BFSIFACIAL RECOGNITION IN BFSI SECTOR TO IMPROVE CUSTOMER SATISFACTION, EXPEDITE PROCEDURES, AND STRENGTHEN SECURITY MEASURES
-
11.3 GOVERNMENTFACIAL RECOGNITION TO AID IN CRIMINAL IDENTIFICATION AND INVESTIGATION, EXPEDITE ADMINISTRATIVE PROCEDURES, AND ENHANCE SECURITY ON BORDERS
-
11.4 HEALTHCAREFACIAL RECOGNITION TO REDUCE ERRORS, ACCESS CONTROL, AND EXPEDITE MEDICAL PROCEDURES
-
11.5 RETAIL & ECOMMERCERETAILERS TO UTILIZE FACIAL RECOGNITION FOR PERSONALIZED SHOPPING EXPERIENCES, ANALYZE CUSTOMER DEMOGRAPHICS AND PREFERENCES, AND TAILOR ADS AND PROMOTIONS
-
11.6 MANUFACTURINGFACIAL RECOGNITION TECHNOLOGY TO PROVIDE SECURITY, PRODUCTIVITY, ACCESS CONTROL, AND EASE OF USE IN MANUFACTURING SECTOR
-
11.7 EDUCATIONFACIAL RECOGNITION TECHNOLOGY TO AUTOMATE ATTENDANCE RECORDING, CONTROL ACCESS, VERIFY IDENTITIES DURING EXAMS, AND ENHANCE CAMPUS SAFETY
-
11.8 MEDIA & ENTERTAINMENTFACIAL RECOGNITION TECHNOLOGY TO PERSONALIZE CONTENT RECOMMENDATIONS, ENHANCE VIEWER EXPERIENCE, AND PROVIDE INSIGHTS INTO AUDIENCE ENGAGEMENT AND PREFERENCES
-
11.9 TRANSPORTATION & UTILITIESFACIAL RECOGNITION TO HELP IN BOARDING PROCESSES AND PASSENGER VERIFICATION IN AIRPORTS
- 11.10 OTHER VERTICALS
- 12.1 INTRODUCTION
-
12.2 NORTH AMERICANORTH AMERICA: RECESSION IMPACTNORTH AMERICA: MARKET DRIVERSNORTH AMERICA: REGULATORY LANDSCAPEUS- Need for adopting advanced technologies and adhering to regulatory compliance to propel marketCANADA- Utilization of FRT and emerging trends & concerns regarding facial recognition technology to drive market
-
12.3 EUROPEEUROPE: RECESSION IMPACTEUROPE: MARKET DRIVERSEUROPE: REGULATORY LANDSCAPEUK- Focus of law enforcement sector on adopting facial recognition solutions to fuel its demandGERMANY- Need to comply with regulations and address evolving threats to boost demand for facial recognition solutionsFRANCE- AI innovation and rising terrorist threats to fuel demand for facial recognition solutionsITALY- Rising public safety interests, organized crime, and terrorism to accelerate demand for facial recognition solutionsREST OF EUROPE
-
12.4 ASIA PACIFICASIA PACIFIC: RECESSION IMPACTASIA PACIFIC: MARKET DRIVERSASIA PACIFIC: REGULATORY LANDSCAPECHINA- Rapid adoption of facial recognition by payment giants Alipay and WeChat to popularize selfie-based financial transactionsJAPAN- Law enforcement sector to utilize facial recognition technology for its efficiency and reliability in locating criminal suspectsINDIA- Government initiatives for implementing best facial recognition to drive marketAUSTRALIA AND NEW ZEALAND- Need to maintain security priorities with data privacy to spur growth of facial recognition technologiesREST OF ASIA PACIFIC
-
12.5 MIDDLE EAST & AFRICAMIDDLE EAST & AFRICA: RECESSION IMPACTMIDDLE EAST & AFRICA: MARKET DRIVERSMIDDLE EAST & AFRICA: REGULATORY LANDSCAPEMIDDLE EAST- Heightened security measures and ambitious smart city initiatives to spur demand for facial recognition solutions- GCC Countries- Rest of Middle EastAFRICA- Technological innovation and need for enhanced safety measures to accelerate demand for facial recognition solutions
-
12.6 LATIN AMERICALATIN AMERICA: RECESSION IMPACTLATIN AMERICA: MARKET DRIVERSLATIN AMERICA: REGULATORY LANDSCAPEBRAZIL- Rising concerns about privacy and potential for misuse of technology to accelerate market growthMEXICO- Rising adoption of facial recognition in law enforcement and government agencies lacking stringent privacy laws to drive marketREST OF LATIN AMERICA
- 13.1 OVERVIEW
- 13.2 KEY PLAYER STRATEGIES/RIGHT TO WIN
- 13.3 HISTORICAL REVENUE ANALYSIS
- 13.4 VALUATION AND FINANCIAL METRICS OF KEY FACIAL RECOGNITION VENDORS
- 13.5 MARKET SHARE ANALYSIS
- 13.6 PRODUCT/BRAND COMPARISON
-
13.7 COMPANY EVALUATION MATRIX: KEY PLAYERSSTARSEMERGING LEADERSPERVASIVE PLAYERSPARTICIPANTSCOMPANY FOOTPRINT: KEY PLAYERS- Company footprint- Product footprint- Application footprint- Vertical footprint- Regional footprint
-
13.8 COMPANY EVALUATION MATRIX: START-UP/SMESPROGRESSIVE COMPANIESRESPONSIVE COMPANIESDYNAMIC COMPANIESSTARTING BLOCKSCOMPETITIVE BENCHMARKING: START-UPS/SMES- Detailed list of key start-ups/SMEs- Competitive benchmarking of key start-ups/SMEs
-
13.9 COMPETITIVE SCENARIO AND TRENDSPRODUCT LAUNCHESDEALS
-
14.1 KEY PLAYERSNEC- Business overview- Products/Solutions/Services offered- Recent developments- MnM viewMICROSOFT- Business overview- Products/Solutions/Services offered- Recent developments- MnM viewTHALES- Business overview- Products/Solutions/Services offered- Recent developments- MnM viewAWS- Business overview- Products/Solutions/Services offered- Recent developments- MnM viewIDEMIA- Business overview- Products/Solutions/Services offered- Recent developments- MnM viewAWARE- Business overview- Products/Solutions/Services offered- Recent developments- MnM viewDAON- Business overview- Products/Solutions/Services offered- Recent developmentsMEGVII- Business overview- Products/Solutions/Services offered- Recent developmentsFACEPHI- Business overview- Products/Solutions/Services offered- Recent developmentsHERTA SECURITY- Business overview- Products/Solutions/Services offered- Recent developmentsONESPAN- Business overview- Products/Solutions/Services offered- Recent developmentsQ3 TECHNOLOGIES- Business overview- Products/Solutions/Services offeredNEUROTECHNOLOGY- Business overview- Products/Solutions/Services offered- Recent developmentsCOGNITEC SYSTEMS- Business overview- Products/Solutions/Services offered- Recent developments
-
14.2 OTHER PLAYERSAYONIXNVISO.AIFACEFIRSTCLARIFAIIPROOVOOSTOVISAGE TECHNOLOGYPANGIAMCLEARVIEW AICORSIGHT.AIFACIAVERIDIUM
-
15.1 INTRODUCTION TO ADJACENT MARKETSLIMITATIONS
- 15.2 EMOTION DETECTION AND RECOGNITION MARKET
- 15.3 CONTACTLESS BIOMETRICS MARKET
- 15.4 BIOMETRICS-AS-A-SERVICE MARKET
- 16.1 DISCUSSION GUIDE
- 16.2 KNOWLEDGESTORE: MARKETSANDMARKETS’ SUBSCRIPTION PORTAL
- 16.3 CUSTOMIZATION OPTIONS
- 16.4 RELATED REPORTS
- 16.5 AUTHOR DETAILS
- TABLE 1 USD EXCHANGE RATES, 2017–2022
- TABLE 2 FACTOR ANALYSIS
- TABLE 3 FACIAL RECOGNITION MARKET: ECOSYSTEM
- TABLE 4 MARKET: PORTER’S FIVE FORCES’ IMPACT
- TABLE 5 AVERAGE SELLING PRICES OF KEY PLAYERS FOR TOP THREE SOFTWARE SOLUTIONS
- TABLE 6 INDICATIVE PRICING LEVELS OF FACIAL RECOGNITION SOLUTIONS
- TABLE 7 IMPORT DATA, BY COUNTRY, 2017–2022 (USD BILLION)
- TABLE 8 EXPORT DATA, BY COUNTRY, 2017–2022 (USD BILLION)
- TABLE 9 FACIAL RECOGNITION MARKET: LIST OF MAJOR PATENTS
- TABLE 10 TARIFFS RELATED TO FACIAL RECOGNITION PRODUCTS, 2022
- TABLE 11 NORTH AMERICA: LIST OF REGULATORY BODIES, GOVERNMENT AGENCIES, AND OTHER ORGANIZATIONS
- TABLE 12 EUROPE: LIST OF REGULATORY BODIES, GOVERNMENT AGENCIES, AND OTHER ORGANIZATIONS
- TABLE 13 ASIA PACIFIC: LIST OF REGULATORY BODIES, GOVERNMENT AGENCIES, AND OTHER ORGANIZATIONS
- TABLE 14 ROW: LIST OF REGULATORY BODIES, GOVERNMENT AGENCIES, AND OTHER ORGANIZATIONS
- TABLE 15 INFLUENCE OF STAKEHOLDERS ON BUYING PROCESS FOR TOP THREE VERTICALS
- TABLE 16 KEY BUYING CRITERIA FOR TOP THREE VERTICALS
- TABLE 17 MARKET: DETAILED LIST OF CONFERENCES & EVENTS, 2024–2025
- TABLE 18 MARKET, BY OFFERING, 2017–2022 (USD MILLION)
- TABLE 19 FACIAL RECOGNITION MARKET, BY OFFERING, 2023–2028 (USD MILLION)
- TABLE 20 HARDWARE: MARKET, BY REGION, 2017–2022 (USD MILLION)
- TABLE 21 HARDWARE: MARKET, BY REGION, 2023–2028 (USD MILLION)
- TABLE 22 MARKET, BY SOFTWARE SOLUTION, 2017–2022 (USD MILLION)
- TABLE 23 FACIAL RECOGNITION MARKET, BY SOFTWARE SOLUTION, 2023–2028 (USD MILLION)
- TABLE 24 SOFTWARE SOLUTIONS: MARKET, BY REGION, 2017–2022 (USD MILLION)
- TABLE 25 SOFTWARE SOLUTIONS: MARKET, BY REGION, 2023–2028 (USD MILLION)
- TABLE 26 FACE IDENTIFICATION: MARKET, BY REGION, 2017–2022 (USD MILLION)
- TABLE 27 FACE IDENTIFICATION: MARKET, BY REGION, 2023–2028 (USD MILLION)
- TABLE 28 FACE VERIFICATION: MARKET, BY REGION, 2017–2022 (USD MILLION)
- TABLE 29 FACE VERIFICATION: MARKET, BY REGION, 2023–2028 (USD MILLION)
- TABLE 30 FACIAL ANALYTICS: MARKET, BY REGION, 2017–2022 (USD MILLION)
- TABLE 31 FACIAL ANALYTICS: MARKET, BY REGION, 2023–2028 (USD MILLION)
- TABLE 32 FACE LIVENESS DETECTION: MARKET, BY REGION, 2017–2022 (USD MILLION)
- TABLE 33 FACE LIVENESS DETECTION: MARKET, BY REGION, 2023–2028 (USD MILLION)
- TABLE 34 MARKET, BY SERVICE, 2017–2022 (USD MILLION)
- TABLE 35 FACIAL RECOGNITION MARKET, BY SERVICE, 2023–2028 (USD MILLION)
- TABLE 36 SERVICES: MARKET, BY REGION, 2017–2022 (USD MILLION)
- TABLE 37 SERVICES: MARKET, BY REGION, 2023–2028 (USD MILLION)
- TABLE 38 FACIAL RECOGNITION MARKET, BY DEPLOYMENT MODE, 2017–2022 (USD MILLION)
- TABLE 39 MARKET, BY DEPLOYMENT MODE, 2023–2028 (USD MILLION)
- TABLE 40 ON-PREMISES: MARKET, BY REGION, 2017–2022 (USD MILLION)
- TABLE 41 ON-PREMISES: MARKET, BY REGION, 2023–2028 (USD MILLION)
- TABLE 42 CLOUD: MARKET, BY REGION, 2017–2022 (USD MILLION)
- TABLE 43 CLOUD: MARKET, BY REGION, 2023–2028 (USD MILLION)
- TABLE 44 MARKET, BY ORGANIZATION SIZE, 2017–2022 (USD MILLION)
- TABLE 45 FACIAL RECOGNITION MARKET, BY ORGANIZATION SIZE, 2023–2028 (USD MILLION)
- TABLE 46 LARGE ENTERPRISES: MARKET, BY REGION, 2017–2022 (USD MILLION)
- TABLE 47 LARGE ENTERPRISES: MARKET, BY REGION, 2023–2028 (USD MILLION)
- TABLE 48 SMALL AND MEDIUM-SIZED ENTERPRISES: MARKET, BY REGION, 2017–2022 (USD MILLION)
- TABLE 49 SMALL AND MEDIUM-SIZED ENTERPRISES: MARKET, BY REGION, 2023–2028 (USD MILLION)
- TABLE 50 MARKET, BY APPLICATION, 2017–2022 (USD MILLION)
- TABLE 51 FACIAL RECOGNITION MARKET, BY APPLICATION, 2023–2028 (USD MILLION)
- TABLE 52 SECURITY & ACCESS CONTROL: MARKET, BY REGION, 2017–2022 (USD MILLION)
- TABLE 53 SECURITY & ACCESS CONTROL: MARKET, BY REGION, 2023–2028 (USD MILLION)
- TABLE 54 FINANCE & PAYMENTS: MARKET, BY REGION, 2017–2022 (USD MILLION)
- TABLE 55 FINANCE & PAYMENTS: MARKET, BY REGION, 2023–2028 (USD MILLION)
- TABLE 56 RETAIL & MARKETING: MARKET, BY REGION, 2017–2022 (USD MILLION)
- TABLE 57 RETAIL & MARKETING: MARKET, BY REGION, 2023–2028 (USD MILLION)
- TABLE 58 MARKET, BY VERTICAL, 2017–2022 (USD MILLION)
- TABLE 59 FACIAL RECOGNITION MARKET, BY VERTICAL, 2023–2028 (USD MILLION)
- TABLE 60 BFSI: MARKET, BY REGION, 2017–2022 (USD MILLION)
- TABLE 61 BFSI: MARKET, BY REGION, 2023–2028 (USD MILLION)
- TABLE 62 GOVERNMENT: MARKET, BY REGION, 2017–2022 (USD MILLION)
- TABLE 63 GOVERNMENT: MARKET, BY REGION, 2023–2028 (USD MILLION)
- TABLE 64 HEALTHCARE: MARKET, BY REGION, 2017–2022 (USD MILLION)
- TABLE 65 HEALTHCARE: MARKET, BY REGION, 2023–2028 (USD MILLION)
- TABLE 66 RETAIL & ECOMMERCE: MARKET, BY REGION, 2017–2022 (USD MILLION)
- TABLE 67 RETAIL & ECOMMERCE: MARKET, BY REGION, 2023–2028 (USD MILLION)
- TABLE 68 MANUFACTURING: MARKET, BY REGION, 2017–2022 (USD MILLION)
- TABLE 69 MANUFACTURING: MARKET, BY REGION, 2023–2028 (USD MILLION)
- TABLE 70 EDUCATION: MARKET, BY REGION, 2017–2022 (USD MILLION)
- TABLE 71 EDUCATION: MARKET, BY REGION, 2023–2028 (USD MILLION)
- TABLE 72 MEDIA & ENTERTAINMENT: MARKET, BY REGION, 2017–2022 (USD MILLION)
- TABLE 73 MEDIA & ENTERTAINMENT: MARKET, BY REGION, 2023–2028 (USD MILLION)
- TABLE 74 TRANSPORTATION & UTILITIES: MARKET, BY REGION, 2017–2022 (USD MILLION)
- TABLE 75 TRANSPORTATION & UTILITIES: MARKET, BY REGION, 2023–2028 (USD MILLION)
- TABLE 76 MARKET, BY REGION, 2017–2022 (USD MILLION)
- TABLE 77 MARKET, BY REGION, 2023–2028 (USD MILLION)
- TABLE 78 NORTH AMERICA: FACIAL RECOGNITION MARKET, BY OFFERING, 2017–2022 (USD MILLION)
- TABLE 79 NORTH AMERICA: MARKET, BY OFFERING, 2023–2028 (USD MILLION)
- TABLE 80 NORTH AMERICA: MARKET, BY SOFTWARE SOLUTION, 2017–2022 (USD MILLION)
- TABLE 81 NORTH AMERICA: MARKET, BY SOFTWARE SOLUTION, 2023–2028 (USD MILLION)
- TABLE 82 NORTH AMERICA: MARKET, BY SERVICE, 2017–2022 (USD MILLION)
- TABLE 83 NORTH AMERICA: MARKET, BY SERVICE, 2023–2028 (USD MILLION)
- TABLE 84 NORTH AMERICA: MARKET, BY DEPLOYMENT MODE, 2017–2022 (USD MILLION)
- TABLE 85 NORTH AMERICA: MARKET, BY DEPLOYMENT MODE, 2023–2028 (USD MILLION)
- TABLE 86 NORTH AMERICA: MARKET, BY ORGANIZATION SIZE, 2017–2022 (USD MILLION)
- TABLE 87 NORTH AMERICA: MARKET, BY ORGANIZATION SIZE, 2023–2028 (USD MILLION)
- TABLE 88 NORTH AMERICA: MARKET, BY APPLICATION, 2017–2022 (USD MILLION)
- TABLE 89 NORTH AMERICA: MARKET, BY APPLICATION, 2023–2028 (USD MILLION)
- TABLE 90 NORTH AMERICA: MARKET, BY VERTICAL, 2017–2022 (USD MILLION)
- TABLE 91 NORTH AMERICA: MARKET, BY VERTICAL, 2023–2028 (USD MILLION)
- TABLE 92 NORTH AMERICA: MARKET, BY COUNTRY, 2017–2022 (USD MILLION)
- TABLE 93 NORTH AMERICA: MARKET, BY COUNTRY, 2023–2028 (USD MILLION)
- TABLE 94 US: MARKET, BY OFFERING, 2017–2022 (USD MILLION)
- TABLE 95 US: MARKET, BY OFFERING, 2023–2028 (USD MILLION)
- TABLE 96 US: MARKET, BY SOFTWARE SOLUTION, 2017–2022 (USD MILLION)
- TABLE 97 US: MARKET, BY SOFTWARE SOLUTION, 2023–2028 (USD MILLION)
- TABLE 98 US: MARKET, BY SERVICE, 2017–2022 (USD MILLION)
- TABLE 99 US: MARKET, BY SERVICE, 2023–2028 (USD MILLION)
- TABLE 100 US: MARKET, BY DEPLOYMENT MODE, 2017–2022 (USD MILLION)
- TABLE 101 US: MARKET, BY DEPLOYMENT MODE, 2023–2028 (USD MILLION)
- TABLE 102 US: MARKET, BY ORGANIZATION SIZE, 2017–2022 (USD MILLION)
- TABLE 103 US: MARKET, BY ORGANIZATION SIZE, 2023–2028 (USD MILLION)
- TABLE 104 US: MARKET, BY APPLICATION, 2017–2022 (USD MILLION)
- TABLE 105 US: MARKET, BY APPLICATION, 2023–2028 (USD MILLION)
- TABLE 106 US: MARKET, BY VERTICAL, 2017–2022 (USD MILLION)
- TABLE 107 US: MARKET, BY VERTICAL, 2023–2028 (USD MILLION)
- TABLE 108 CANADA: MARKET, BY OFFERING, 2017–2022 (USD MILLION)
- TABLE 109 CANADA: MARKET, BY OFFERING, 2023–2028 (USD MILLION)
- TABLE 110 CANADA: MARKET, BY SOFTWARE SOLUTION, 2017–2022 (USD MILLION)
- TABLE 111 CANADA: MARKET, BY SOFTWARE SOLUTION, 2023–2028 (USD MILLION)
- TABLE 112 CANADA: MARKET, BY SERVICE, 2017–2022 (USD MILLION)
- TABLE 113 CANADA: MARKET, BY SERVICE, 2023–2028 (USD MILLION)
- TABLE 114 CANADA: MARKET, BY DEPLOYMENT MODE, 2017–2022 (USD MILLION)
- TABLE 115 CANADA: MARKET, BY DEPLOYMENT MODE, 2023–2028 (USD MILLION)
- TABLE 116 CANADA: MARKET, BY ORGANIZATION SIZE, 2017–2022 (USD MILLION)
- TABLE 117 CANADA: MARKET, BY ORGANIZATION SIZE, 2023–2028 (USD MILLION)
- TABLE 118 CANADA: MARKET, BY APPLICATION, 2017–2022 (USD MILLION)
- TABLE 119 CANADA: MARKET, BY APPLICATION, 2023–2028 (USD MILLION)
- TABLE 120 CANADA: MARKET, BY VERTICAL, 2017–2022 (USD MILLION)
- TABLE 121 CANADA: MARKET, BY VERTICAL, 2023–2028 (USD MILLION)
- TABLE 122 EUROPE: MARKET, BY OFFERING, 2017–2022 (USD MILLION)
- TABLE 123 EUROPE: FACIAL RECOGNITION MARKET, BY OFFERING, 2023–2028 (USD MILLION)
- TABLE 124 EUROPE: MARKET, BY SOFTWARE SOLUTION, 2017–2022 (USD MILLION)
- TABLE 125 EUROPE: MARKET, BY SOFTWARE SOLUTION, 2023–2028 (USD MILLION)
- TABLE 126 EUROPE: MARKET, BY SERVICE, 2017–2022 (USD MILLION)
- TABLE 127 EUROPE: MARKET, BY SERVICE, 2023–2028 (USD MILLION)
- TABLE 128 EUROPE: MARKET, BY DEPLOYMENT MODE, 2017–2022 (USD MILLION)
- TABLE 129 EUROPE: MARKET, BY DEPLOYMENT MODE, 2023–2028 (USD MILLION)
- TABLE 130 EUROPE: MARKET, BY ORGANIZATION SIZE, 2017–2022 (USD MILLION)
- TABLE 131 EUROPE: MARKET, BY ORGANIZATION SIZE, 2023–2028 (USD MILLION)
- TABLE 132 EUROPE: MARKET, BY APPLICATION, 2017–2022 (USD MILLION)
- TABLE 133 EUROPE: MARKET, BY APPLICATION, 2023–2028 (USD MILLION)
- TABLE 134 EUROPE: MARKET, BY VERTICAL, 2017–2022 (USD MILLION)
- TABLE 135 EUROPE: MARKET, BY VERTICAL, 2023–2028 (USD MILLION)
- TABLE 136 EUROPE: MARKET, BY COUNTRY, 2017–2022 (USD MILLION)
- TABLE 137 EUROPE: MARKET, BY COUNTRY, 2023–2028 (USD MILLION)
- TABLE 138 UK: MARKET, BY OFFERING, 2017–2022 (USD MILLION)
- TABLE 139 UK: MARKET, BY OFFERING, 2023–2028 (USD MILLION)
- TABLE 140 UK: MARKET, BY SOFTWARE SOLUTION, 2017–2022 (USD MILLION)
- TABLE 141 UK: MARKET, BY SOFTWARE SOLUTION, 2023–2028 (USD MILLION)
- TABLE 142 UK: MARKET, BY SERVICE, 2017–2022 (USD MILLION)
- TABLE 143 UK: MARKET, BY SERVICE, 2023–2028 (USD MILLION)
- TABLE 144 UK: MARKET, BY DEPLOYMENT MODE, 2017–2022 (USD MILLION)
- TABLE 145 UK: MARKET, BY DEPLOYMENT MODE, 2023–2028 (USD MILLION)
- TABLE 146 UK: MARKET, BY ORGANIZATION SIZE, 2017–2022 (USD MILLION)
- TABLE 147 UK: MARKET, BY ORGANIZATION SIZE, 2023–2028 (USD MILLION)
- TABLE 148 UK: MARKET, BY APPLICATION, 2017–2022 (USD MILLION)
- TABLE 149 UK: MARKET, BY APPLICATION, 2023–2028 (USD MILLION)
- TABLE 150 UK: MARKET, BY VERTICAL, 2017–2022 (USD MILLION)
- TABLE 151 UK: MARKET, BY VERTICAL, 2023–2028 (USD MILLION)
- TABLE 152 GERMANY: MARKET, BY OFFERING, 2017–2022 (USD MILLION)
- TABLE 153 GERMANY: MARKET, BY OFFERING, 2023–2028 (USD MILLION)
- TABLE 154 GERMANY: MARKET, BY SOFTWARE SOLUTION, 2017–2022 (USD MILLION)
- TABLE 155 GERMANY: MARKET, BY SOFTWARE SOLUTION, 2023–2028 (USD MILLION)
- TABLE 156 GERMANY: MARKET, BY SERVICE, 2017–2022 (USD MILLION)
- TABLE 157 GERMANY: MARKET, BY SERVICE, 2023–2028 (USD MILLION)
- TABLE 158 GERMANY: MARKET, BY DEPLOYMENT MODE, 2017–2022 (USD MILLION)
- TABLE 159 GERMANY: MARKET, BY DEPLOYMENT MODE, 2023–2028 (USD MILLION)
- TABLE 160 GERMANY: MARKET, BY ORGANIZATION SIZE, 2 017–2022 (USD MILLION)
- TABLE 161 GERMANY: MARKET, BY ORGANIZATION SIZE, 2023–2028 (USD MILLION)
- TABLE 162 GERMANY: MARKET, BY APPLICATION, 2017–2022 (USD MILLION)
- TABLE 163 GERMANY: MARKET, BY APPLICATION, 2023–2028 (USD MILLION)
- TABLE 164 GERMANY: MARKET, BY VERTICAL, 2017–2022 (USD MILLION)
- TABLE 165 GERMANY: MARKET, BY VERTICAL, 2023–2028 (USD MILLION)
- TABLE 166 FRANCE: FACIAL RECOGNITION MARKET, BY OFFERING, 2017–2022 (USD MILLION)
- TABLE 167 FRANCE: MARKET, BY OFFERING, 2023–2028 (USD MILLION)
- TABLE 168 FRANCE: MARKET, BY SOFTWARE SOLUTION, 2017–2022 (USD MILLION)
- TABLE 169 FRANCE: MARKET, BY SOFTWARE SOLUTION, 2023–2028 (USD MILLION)
- TABLE 170 FRANCE: MARKET, BY SERVICE, 2017–2022 (USD MILLION)
- TABLE 171 FRANCE: MARKET, BY SERVICE, 2023–2028 (USD MILLION)
- TABLE 172 FRANCE: MARKET, BY DEPLOYMENT MODE, 2017–2022 (USD MILLION)
- TABLE 173 FRANCE: MARKET, BY DEPLOYMENT MODE, 2023–2028 (USD MILLION)
- TABLE 174 FRANCE: MARKET, BY ORGANIZATION SIZE, 2017–2022 (USD MILLION)
- TABLE 175 FRANCE: MARKET, BY ORGANIZATION SIZE, 2023–2028 (USD MILLION)
- TABLE 176 FRANCE: MARKET, BY APPLICATION, 2017–2022 (USD MILLION)
- TABLE 177 FRANCE: MARKET, BY APPLICATION, 2023–2028 (USD MILLION)
- TABLE 178 FRANCE: MARKET, BY VERTICAL, 2017–2022 (USD MILLION)
- TABLE 179 FRANCE: MARKET, BY VERTICAL, 2023–2028 (USD MILLION)
- TABLE 180 ITALY: MARKET, BY OFFERING, 2017–2022 (USD MILLION)
- TABLE 181 ITALY: MARKET, BY OFFERING, 2023–2028 (USD MILLION)
- TABLE 182 ITALY: MARKET, BY SOFTWARE SOLUTION, 2017–2022 (USD MILLION)
- TABLE 183 ITALY: MARKET, BY SOFTWARE SOLUTION, 2023–2028 (USD MILLION)
- TABLE 184 ITALY: MARKET, BY SERVICE, 2017–2022 (USD MILLION)
- TABLE 185 ITALY: MARKET, BY SERVICE, 2023–2028 (USD MILLION)
- TABLE 186 ITALY: MARKET, BY DEPLOYMENT MODE, 2017–2022 (USD MILLION)
- TABLE 187 ITALY: MARKET, BY DEPLOYMENT MODE, 2023–2028 (USD MILLION)
- TABLE 188 ITALY: MARKET, BY ORGANIZATION SIZE, 2017–2022 (USD MILLION)
- TABLE 189 ITALY: MARKET, BY ORGANIZATION SIZE, 2023–2028 (USD MILLION)
- TABLE 190 ITALY: MARKET, BY APPLICATION, 2017–2022 (USD MILLION)
- TABLE 191 ITALY: MARKET, BY APPLICATION, 2023–2028 (USD MILLION)
- TABLE 192 ITALY: MARKET, BY VERTICAL, 2017–2022 (USD MILLION)
- TABLE 193 ITALY: MARKET, BY VERTICAL, 2023–2028 (USD MILLION)
- TABLE 194 REST OF EUROPE: MARKET, BY OFFERING, 2017–2022 (USD MILLION)
- TABLE 195 REST OF EUROPE: FACIAL RECOGNITION MARKET, BY OFFERING, 2023–2028 (USD MILLION)
- TABLE 196 REST OF EUROPE: MARKET, BY SOFTWARE SOLUTION, 2017–2022 (USD MILLION)
- TABLE 197 REST OF EUROPE: MARKET, BY SOFTWARE SOLUTION, 2023–2028 (USD MILLION)
- TABLE 198 REST OF EUROPE: MARKET, BY SERVICE, 2017–2022 (USD MILLION)
- TABLE 199 REST OF EUROPE: MARKET, BY SERVICE, 2023–2028 (USD MILLION)
- TABLE 200 REST OF EUROPE: MARKET, BY DEPLOYMENT MODE, 2017–2022 (USD MILLION)
- TABLE 201 REST OF EUROPE: MARKET, BY DEPLOYMENT MODE, 2023–2028 (USD MILLION)
- TABLE 202 REST OF EUROPE: MARKET, BY ORGANIZATION SIZE, 2017–2022 (USD MILLION)
- TABLE 203 REST OF EUROPE: MARKET, BY ORGANIZATION SIZE, 2023–2028 (USD MILLION)
- TABLE 204 REST OF EUROPE: MARKET, BY APPLICATION, 2017–2022 (USD MILLION)
- TABLE 205 REST OF EUROPE: MARKET, BY APPLICATION, 2023–2028 (USD MILLION)
- TABLE 206 REST OF EUROPE: MARKET, BY VERTICAL, 2017–2022 (USD MILLION)
- TABLE 207 REST OF EUROPE: MARKET, BY VERTICAL, 2023–2028 (USD MILLION)
- TABLE 208 ASIA PACIFIC: FACIAL RECOGNITION MARKET, BY OFFERING, 2017–2022 (USD MILLION)
- TABLE 209 ASIA PACIFIC: MARKET, BY OFFERING, 2023–2028 (USD MILLION)
- TABLE 210 ASIA PACIFIC: MARKET, BY SOFTWARE SOLUTION, 2017–2022 (USD MILLION)
- TABLE 211 ASIA PACIFIC: MARKET, BY SOFTWARE SOLUTION, 2023–2028 (USD MILLION)
- TABLE 212 ASIA PACIFIC: MARKET, BY SERVICE, 2017–2022 (USD MILLION)
- TABLE 213 ASIA PACIFIC: MARKET, BY SERVICE, 2023–2028 (USD MILLION)
- TABLE 214 ASIA PACIFIC: MARKET, BY DEPLOYMENT MODE, 2017–2022 (USD MILLION)
- TABLE 215 ASIA PACIFIC: MARKET, BY DEPLOYMENT MODE, 2023–2028 (USD MILLION)
- TABLE 216 ASIA PACIFIC: MARKET, BY ORGANIZATION SIZE, 2017–2022 (USD MILLION)
- TABLE 217 ASIA PACIFIC: MARKET, BY ORGANIZATION SIZE, 2023–2028 (USD MILLION)
- TABLE 218 ASIA PACIFIC: MARKET, BY APPLICATION, 2017–2022 (USD MILLION)
- TABLE 219 ASIA PACIFIC: MARKET, BY APPLICATION, 2023–2028 (USD MILLION)
- TABLE 220 ASIA PACIFIC: MARKET, BY VERTICAL, 2017–2022 (USD MILLION)
- TABLE 221 ASIA PACIFIC: MARKET, BY VERTICAL, 2023–2028 (USD MILLION)
- TABLE 222 ASIA PACIFIC: MARKET, BY COUNTRY, 2017–2022 (USD MILLION)
- TABLE 223 ASIA PACIFIC: MARKET, BY COUNTRY, 2023–2028 (USD MILLION)
- TABLE 224 CHINA: MARKET, BY OFFERING, 2017–2022 (USD MILLION)
- TABLE 225 CHINA: MARKET, BY OFFERING, 2023–2028 (USD MILLION)
- TABLE 226 CHINA: MARKET, BY SOFTWARE SOLUTION, 2017–2022 (USD MILLION)
- TABLE 227 CHINA: MARKET, BY SOFTWARE SOLUTION, 2023–2028 (USD MILLION)
- TABLE 228 CHINA: MARKET, BY SERVICE, 2017–2022 (USD MILLION)
- TABLE 229 CHINA: MARKET, BY SERVICE, 2023–2028 (USD MILLION)
- TABLE 230 CHINA: MARKET, BY DEPLOYMENT MODE, 2017–2022 (USD MILLION)
- TABLE 231 CHINA: MARKET, BY DEPLOYMENT MODE, 2023–2028 (USD MILLION)
- TABLE 232 CHINA: MARKET, BY ORGANIZATION SIZE, 2017–2022 (USD MILLION)
- TABLE 233 CHINA: MARKET, BY ORGANIZATION SIZE, 2023–2028 (USD MILLION)
- TABLE 234 CHINA: MARKET, BY APPLICATION, 2017–2022 (USD MILLION)
- TABLE 235 CHINA: MARKET, BY APPLICATION, 2023–2028 (USD MILLION)
- TABLE 236 CHINA: MARKET, BY VERTICAL, 2017–2022 (USD MILLION)
- TABLE 237 CHINA: MARKET, BY VERTICAL, 2023–2028 (USD MILLION)
- TABLE 238 JAPAN: MARKET, BY OFFERING, 2017–2022 (USD MILLION)
- TABLE 239 JAPAN: FACIAL RECOGNITION MARKET, BY OFFERING, 2023–2028 (USD MILLION)
- TABLE 240 JAPAN: MARKET, BY SOFTWARE SOLUTION, 2017–2022 (USD MILLION)
- TABLE 241 JAPAN: MARKET, BY SOFTWARE SOLUTION, 2023–2028 (USD MILLION)
- TABLE 242 JAPAN: MARKET, BY SERVICE, 2017–2022 (USD MILLION)
- TABLE 243 JAPAN: MARKET, BY SERVICE, 2023–2028 (USD MILLION)
- TABLE 244 JAPAN: MARKET, BY DEPLOYMENT MODE, 2017–2022 (USD MILLION)
- TABLE 245 JAPAN: MARKET, BY DEPLOYMENT MODE, 2023–2028 (USD MILLION)
- TABLE 246 JAPAN: MARKET, BY ORGANIZATION SIZE, 2017–2022 (USD MILLION)
- TABLE 247 JAPAN: MARKET, BY ORGANIZATION SIZE, 2023–2028 (USD MILLION)
- TABLE 248 JAPAN: MARKET, BY APPLICATION, 2017–2022 (USD MILLION)
- TABLE 249 JAPAN: MARKET, BY APPLICATION, 2023–2028 (USD MILLION)
- TABLE 250 JAPAN: MARKET, BY VERTICAL, 2017–2022 (USD MILLION)
- TABLE 251 JAPAN: MARKET, BY VERTICAL, 2023–2028 (USD MILLION)
- TABLE 252 INDIA: MARKET, BY OFFERING, 2017–2022 (USD MILLION)
- TABLE 253 INDIA: MARKET, BY OFFERING, 2023–2028 (USD MILLION)
- TABLE 254 INDIA: MARKET, BY SOFTWARE SOLUTION, 2017–2022 (USD MILLION)
- TABLE 255 INDIA: MARKET, BY SOFTWARE SOLUTION, 2023–2028 (USD MILLION)
- TABLE 256 INDIA: MARKET, BY SERVICE, 2017–2022 (USD MILLION)
- TABLE 257 INDIA: MARKET, BY SERVICE, 2023–2028 (USD MILLION)
- TABLE 258 INDIA: MARKET, BY DEPLOYMENT MODE, 2017–2022 (USD MILLION)
- TABLE 259 INDIA: MARKET, BY DEPLOYMENT MODE, 2023–2028 (USD MILLION)
- TABLE 260 INDIA: MARKET, BY ORGANIZATION SIZE, 2017–2022 (USD MILLION)
- TABLE 261 INDIA: MARKET, BY ORGANIZATION SIZE, 2023–2028 (USD MILLION)
- TABLE 262 INDIA: MARKET, BY APPLICATION, 2017–2022 (USD MILLION)
- TABLE 263 INDIA: MARKET, BY APPLICATION, 2023–2028 (USD MILLION)
- TABLE 264 INDIA: MARKET, BY VERTICAL, 2017–2022 (USD MILLION)
- TABLE 265 INDIA: MARKET, BY VERTICAL, 2023–2028 (USD MILLION)
- TABLE 266 AUSTRALIA AND NEW ZEALAND: MARKET, BY OFFERING, 2017–2022 (USD MILLION)
- TABLE 267 AUSTRALIA AND NEW ZEALAND: FACIAL RECOGNITION MARKET, BY OFFERING, 2023–2028 (USD MILLION)
- TABLE 268 AUSTRALIA AND NEW ZEALAND: MARKET, BY SOFTWARE SOLUTION, 2017–2022 (USD MILLION)
- TABLE 269 AUSTRALIA AND NEW ZEALAND: MARKET, BY SOFTWARE SOLUTION, 2023–2028 (USD MILLION)
- TABLE 270 AUSTRALIA AND NEW ZEALAND: MARKET, BY SERVICE, 2017–2022 (USD MILLION)
- TABLE 271 AUSTRALIA AND NEW ZEALAND: MARKET, BY SERVICE, 2023–2028 (USD MILLION)
- TABLE 272 AUSTRALIA AND NEW ZEALAND: MARKET, BY DEPLOYMENT MODE, 2017–2022 (USD MILLION)
- TABLE 273 AUSTRALIA AND NEW ZEALAND: MARKET, BY DEPLOYMENT MODE, 2023–2028 (USD MILLION)
- TABLE 274 AUSTRALIA AND NEW ZEALAND: MARKET, BY ORGANIZATION SIZE, 2017–2022 (USD MILLION)
- TABLE 275 AUSTRALIA AND NEW ZEALAND: MARKET, BY ORGANIZATION SIZE, 2023–2028 (USD MILLION)
- TABLE 276 AUSTRALIA AND NEW ZEALAND: MARKET, BY APPLICATION, 2017–2022 (USD MILLION)
- TABLE 277 AUSTRALIA AND NEW ZEALAND: MARKET, BY APPLICATION, 2023–2028 (USD MILLION)
- TABLE 278 AUSTRALIA AND NEW ZEALAND: MARKET, BY VERTICAL, 2017–2022 (USD MILLION)
- TABLE 279 AUSTRALIA AND NEW ZEALAND: MARKET, BY VERTICAL, 2023–2028 (USD MILLION)
- TABLE 280 REST OF ASIA PACIFIC: MARKET, BY OFFERING, 2017–2022 (USD MILLION)
- TABLE 281 REST OF ASIA PACIFIC: MARKET, BY OFFERING, 2023–2028 (USD MILLION)
- TABLE 282 REST OF ASIA PACIFIC: FACIAL RECOGNITION MARKET, BY SOFTWARE SOLUTION, 2017–2022 (USD MILLION)
- TABLE 283 REST OF ASIA PACIFIC: MARKET, BY SOFTWARE SOLUTION, 2023–2028 (USD MILLION)
- TABLE 284 REST OF ASIA PACIFIC: MARKET, BY SERVICE, 2017–2022 (USD MILLION)
- TABLE 285 REST OF ASIA PACIFIC: MARKET, BY SERVICE, 2023–2028 (USD MILLION)
- TABLE 286 REST OF ASIA PACIFIC: MARKET, BY DEPLOYMENT MODE, 2017–2022 (USD MILLION)
- TABLE 287 REST OF ASIA PACIFIC: MARKET, BY DEPLOYMENT MODE, 2023–2028 (USD MILLION)
- TABLE 288 REST OF ASIA PACIFIC: MARKET, BY ORGANIZATION SIZE, 2017–2022 (USD MILLION)
- TABLE 289 REST OF ASIA PACIFIC: MARKET, BY ORGANIZATION SIZE, 2023–2028 (USD MILLION)
- TABLE 290 REST OF ASIA PACIFIC: MARKET, BY APPLICATION, 2017–2022 (USD MILLION)
- TABLE 291 REST OF ASIA PACIFIC: MARKET, BY APPLICATION, 2023–2028 (USD MILLION)
- TABLE 292 REST OF ASIA PACIFIC: MARKET, BY VERTICAL, 2017–2022 (USD MILLION)
- TABLE 293 REST OF ASIA PACIFIC: MARKET, BY VERTICAL, 2023–2028 (USD MILLION)
- TABLE 294 MIDDLE EAST & AFRICA: MARKET, BY OFFERING, 2017–2022 (USD MILLION)
- TABLE 295 MIDDLE EAST & AFRICA: FACIAL RECOGNITION MARKET, BY OFFERING, 2023–2028 (USD MILLION)
- TABLE 296 MIDDLE EAST & AFRICA: MARKET, BY SOFTWARE SOLUTION, 2017–2022 (USD MILLION)
- TABLE 297 MIDDLE EAST & AFRICA: MARKET, BY SOFTWARE SOLUTION, 2023–2028 (USD MILLION)
- TABLE 298 MIDDLE EAST & AFRICA: MARKET, BY SERVICE, 2017–2022 (USD MILLION)
- TABLE 299 MIDDLE EAST & AFRICA: MARKET, BY SERVICE, 2023–2028 (USD MILLION)
- TABLE 300 MIDDLE EAST & AFRICA: MARKET, BY DEPLOYMENT MODE, 2017–2022 (USD MILLION)
- TABLE 301 MIDDLE EAST & AFRICA: MARKET, BY DEPLOYMENT MODE, 2023–2028 (USD MILLION)
- TABLE 302 MIDDLE EAST & AFRICA: MARKET, BY ORGANIZATION SIZE, 2017–2022 (USD MILLION)
- TABLE 303 MIDDLE EAST & AFRICA: MARKET, BY ORGANIZATION SIZE, 2023–2028 (USD MILLION)
- TABLE 304 MIDDLE EAST & AFRICA: MARKET, BY APPLICATION, 2017–2022 (USD MILLION)
- TABLE 305 MIDDLE EAST & AFRICA: MARKET, BY APPLICATION, 2023–2028 (USD MILLION)
- TABLE 306 MIDDLE EAST & AFRICA: MARKET, BY VERTICAL, 2017–2022 (USD MILLION)
- TABLE 307 MIDDLE EAST & AFRICA: MARKET, BY VERTICAL, 2023–2028 (USD MILLION)
- TABLE 308 MIDDLE EAST & AFRICA: MARKET, BY REGION, 2017–2022 (USD MILLION)
- TABLE 309 MIDDLE EAST & AFRICA: MARKET, BY REGION, 2023–2028 (USD MILLION)
- TABLE 310 MIDDLE EAST: MARKET, BY OFFERING, 2017–2022 (USD MILLION)
- TABLE 311 MIDDLE EAST: MARKET, BY OFFERING, 2023–2028 (USD MILLION)
- TABLE 312 MIDDLE EAST: FACIAL RECOGNITION MARKET, BY SOFTWARE SOLUTION, 2017–2022 (USD MILLION)
- TABLE 313 MIDDLE EAST: MARKET, BY SOFTWARE SOLUTION, 2023–2028 (USD MILLION)
- TABLE 314 MIDDLE EAST: MARKET, BY SERVICE, 2017–2022 (USD MILLION)
- TABLE 315 MIDDLE EAST: MARKET, BY SERVICE, 2023–2028 (USD MILLION)
- TABLE 316 MIDDLE EAST: MARKET, BY DEPLOYMENT MODE, 2017–2022 (USD MILLION)
- TABLE 317 MIDDLE EAST: MARKET, BY DEPLOYMENT MODE, 2023–2028 (USD MILLION)
- TABLE 318 MIDDLE EAST: MARKET, BY ORGANIZATION SIZE, 2017–2022 (USD MILLION)
- TABLE 319 MIDDLE EAST: MARKET, BY ORGANIZATION SIZE, 2023–2028 (USD MILLION)
- TABLE 320 MIDDLE EAST: MARKET, BY APPLICATION, 2017–2022 (USD MILLION)
- TABLE 321 MIDDLE EAST: MARKET, BY APPLICATION, 2023–2028 (USD MILLION)
- TABLE 322 MIDDLE EAST: MARKET, BY VERTICAL, 2017–2022 (USD MILLION)
- TABLE 323 MIDDLE EAST: MARKET, BY VERTICAL, 2023–2028 (USD MILLION)
- TABLE 324 MIDDLE EAST: MARKET, BY COUNTRY, 2017–2022 (USD MILLION)
- TABLE 325 MIDDLE EAST: MARKET, BY COUNTRY, 2023–2028 (USD MILLION)
- TABLE 326 GCC COUNTRIES: MARKET, BY OFFERING, 2017–2022 (USD MILLION)
- TABLE 327 GCC COUNTRIES: FACIAL RECOGNITION MARKET, BY OFFERING, 2023–2028 (USD MILLION)
- TABLE 328 GCC COUNTRIES: MARKET, BY SOFTWARE SOLUTION, 2017–2022 (USD MILLION)
- TABLE 329 GCC COUNTRIES: MARKET, BY SOFTWARE SOLUTION, 2023–2028 (USD MILLION)
- TABLE 330 GCC COUNTRIES: MARKET, BY SERVICE, 2017–2022 (USD MILLION)
- TABLE 331 GCC COUNTRIES: MARKET, BY SERVICE, 2023–2028 (USD MILLION)
- TABLE 332 GCC COUNTRIES: MARKET, BY DEPLOYMENT MODE, 2017–2022 (USD MILLION)
- TABLE 333 GCC COUNTRIES: MARKET, BY DEPLOYMENT MODE, 2023–2028 (USD MILLION)
- TABLE 334 GCC COUNTRIES: MARKET, BY ORGANIZATION SIZE, 2017–2022 (USD MILLION)
- TABLE 335 GCC COUNTRIES: MARKET, BY ORGANIZATION SIZE, 2023–2028 (USD MILLION)
- TABLE 336 GCC COUNTRIES: MARKET, BY APPLICATION, 2017–2022 (USD MILLION)
- TABLE 337 GCC COUNTRIES: MARKET, BY APPLICATION, 2023–2028 (USD MILLION)
- TABLE 338 GCC COUNTRIES: MARKET, BY VERTICAL, 2017–2022 (USD MILLION)
- TABLE 339 GCC COUNTRIES: MARKET, BY VERTICAL, 2023–2028 (USD MILLION)
- TABLE 340 REST OF MIDDLE EAST: MARKET, BY OFFERING, 2017–2022 (USD MILLION)
- TABLE 341 REST OF MIDDLE EAST: MARKET, BY OFFERING, 2023–2028 (USD MILLION)
- TABLE 342 REST OF MIDDLE EAST: FACIAL RECOGNITION MARKET, BY SOFTWARE SOLUTION, 2017–2022 (USD MILLION)
- TABLE 343 REST OF MIDDLE EAST: MARKET, BY SOFTWARE SOLUTION, 2023–2028 (USD MILLION)
- TABLE 344 REST OF MIDDLE EAST: MARKET, BY SERVICE, 2017–2022 (USD MILLION)
- TABLE 345 REST OF MIDDLE EAST: MARKET, BY SERVICE, 2023–2028 (USD MILLION)
- TABLE 346 REST OF MIDDLE EAST: MARKET, BY DEPLOYMENT MODE, 2017–2022 (USD MILLION)
- TABLE 347 REST OF MIDDLE EAST: MARKET, BY DEPLOYMENT MODE, 2023–2028 (USD MILLION)
- TABLE 348 REST OF MIDDLE EAST: MARKET, BY ORGANIZATION SIZE, 2017–2022 (USD MILLION)
- TABLE 349 REST OF MIDDLE EAST: MARKET, BY ORGANIZATION SIZE, 2023–2028 (USD MILLION)
- TABLE 350 REST OF MIDDLE EAST: MARKET, BY APPLICATION, 2017–2022 (USD MILLION)
- TABLE 351 REST OF MIDDLE EAST: MARKET, BY APPLICATION, 2023–2028 (USD MILLION)
- TABLE 352 REST OF MIDDLE EAST: MARKET, BY VERTICAL, 2017–2022 (USD MILLION)
- TABLE 353 REST OF MIDDLE EAST: MARKET, BY VERTICAL, 2023–2028 (USD MILLION)
- TABLE 354 AFRICA: MARKET, BY OFFERING, 2017–2022 (USD MILLION)
- TABLE 355 AFRICA: MARKET, BY OFFERING, 2023–2028 (USD MILLION)
- TABLE 356 AFRICA: FACIAL RECOGNITION MARKET, BY SOFTWARE SOLUTION, 2017–2022 (USD MILLION)
- TABLE 357 AFRICA: MARKET, BY SOFTWARE SOLUTION, 2023–2028 (USD MILLION)
- TABLE 358 AFRICA: MARKET, BY SERVICE, 2017–2022 (USD MILLION)
- TABLE 359 AFRICA: MARKET, BY SERVICE, 2023–2028 (USD MILLION)
- TABLE 360 AFRICA: MARKET, BY DEPLOYMENT MODE, 2017–2022 (USD MILLION)
- TABLE 361 AFRICA: MARKET, BY DEPLOYMENT MODE, 2023–2028 (USD MILLION)
- TABLE 362 AFRICA: MARKET, BY ORGANIZATION SIZE, 2017–2022 (USD MILLION)
- TABLE 363 AFRICA: MARKET, BY ORGANIZATION SIZE, 2023–2028 (USD MILLION)
- TABLE 364 AFRICA: MARKET, BY APPLICATION, 2017–2022 (USD MILLION)
- TABLE 365 AFRICA: MARKET, BY APPLICATION, 2023–2028 (USD MILLION)
- TABLE 366 AFRICA: MARKET, BY VERTICAL, 2017–2022 (USD MILLION)
- TABLE 367 AFRICA: MARKET, BY VERTICAL, 2023–2028 (USD MILLION)
- TABLE 368 LATIN AMERICA: MARKET, BY OFFERING, 2017–2022 (USD MILLION)
- TABLE 369 LATIN AMERICA: MARKET, BY OFFERING, 2023–2028 (USD MILLION)
- TABLE 370 LATIN AMERICA: MARKET, BY SOFTWARE SOLUTION, 2017–2022 (USD MILLION)
- TABLE 371 LATIN AMERICA: MARKET, BY SOFTWARE SOLUTION, 2023–2028 (USD MILLION)
- TABLE 372 LATIN AMERICA: FACIAL RECOGNITION MARKET, BY SERVICE, 2017–2022 (USD MILLION)
- TABLE 373 LATIN AMERICA: MARKET, BY SERVICE, 2023–2028 (USD MILLION)
- TABLE 374 LATIN AMERICA: MARKET, BY DEPLOYMENT MODE, 2017–2022 (USD MILLION)
- TABLE 375 LATIN AMERICA: MARKET, BY DEPLOYMENT MODE, 2023–2028 (USD MILLION)
- TABLE 376 LATIN AMERICA: MARKET, BY ORGANIZATION SIZE, 2017–2022 (USD MILLION)
- TABLE 377 LATIN AMERICA: MARKET, BY ORGANIZATION SIZE, 2023–2028 (USD MILLION)
- TABLE 378 LATIN AMERICA: MARKET, BY APPLICATION, 2017–2022 (USD MILLION)
- TABLE 379 LATIN AMERICA: MARKET, BY APPLICATION, 2023–2028 (USD MILLION)
- TABLE 380 LATIN AMERICA: MARKET, BY VERTICAL, 2017–2022 (USD MILLION)
- TABLE 381 LATIN AMERICA: MARKET, BY VERTICAL, 2023–2028 (USD MILLION)
- TABLE 382 LATIN AMERICA: MARKET, BY COUNTRY, 2017–2022 (USD MILLION)
- TABLE 383 LATIN AMERICA: MARKET, BY COUNTRY, 2023–2028 (USD MILLION)
- TABLE 384 BRAZIL: MARKET, BY OFFERING, 2017–2022 (USD MILLION)
- TABLE 385 BRAZIL: MARKET, BY OFFERING, 2023–2028 (USD MILLION)
- TABLE 386 BRAZIL: MARKET, BY SOFTWARE SOLUTION, 2017–2022 (USD MILLION)
- TABLE 387 BRAZIL: MARKET, BY SOFTWARE SOLUTION, 2023–2028 (USD MILLION)
- TABLE 388 BRAZIL: MARKET, BY SERVICE, 2017–2022 (USD MILLION)
- TABLE 389 BRAZIL: MARKET, BY SERVICE, 2023–2028 (USD MILLION)
- TABLE 390 BRAZIL: MARKET, BY DEPLOYMENT MODE, 2017–2022 (USD MILLION)
- TABLE 391 BRAZIL: MARKET, BY DEPLOYMENT MODE, 2023–2028 (USD MILLION)
- TABLE 392 BRAZIL: MARKET, BY ORGANIZATION SIZE, 2017–2022 (USD MILLION)
- TABLE 393 BRAZIL: MARKET, BY ORGANIZATION SIZE, 2023–2028 (USD MILLION)
- TABLE 394 BRAZIL: MARKET, BY APPLICATION, 2017–2022 (USD MILLION)
- TABLE 395 BRAZIL: MARKET, BY APPLICATION, 2023–2028 (USD MILLION)
- TABLE 396 BRAZIL: MARKET, BY VERTICAL, 2017–2022 (USD MILLION)
- TABLE 397 BRAZIL: MARKET, BY VERTICAL, 2023–2028 (USD MILLION)
- TABLE 398 MEXICO: MARKET, BY OFFERING, 2017–2022 (USD MILLION)
- TABLE 399 MEXICO: MARKET, BY OFFERING, 2023–2028 (USD MILLION)
- TABLE 400 MEXICO: MARKET, BY SOFTWARE SOLUTION, 2017–2022 (USD MILLION)
- TABLE 401 MEXICO: MARKET, BY SOFTWARE SOLUTION, 2023–2028 (USD MILLION)
- TABLE 402 MEXICO: MARKET, BY SERVICE, 2017–2022 (USD MILLION)
- TABLE 403 MEXICO: MARKET, BY SERVICE, 2023–2028 (USD MILLION)
- TABLE 404 MEXICO: MARKET, BY DEPLOYMENT MODE, 2017–2022 (USD MILLION)
- TABLE 405 MEXICO: MARKET, BY DEPLOYMENT MODE, 2023–2028 (USD MILLION)
- TABLE 406 MEXICO: MARKET, BY ORGANIZATION SIZE, 2017–2022 (USD MILLION)
- TABLE 407 MEXICO: MARKET, BY ORGANIZATION SIZE, 2023–2028 (USD MILLION)
- TABLE 408 MEXICO: MARKET, BY APPLICATION, 2017–2022 (USD MILLION)
- TABLE 409 MEXICO: MARKET, BY APPLICATION, 2023–2028 (USD MILLION)
- TABLE 410 MEXICO: MARKET, BY VERTICAL, 2017–2022 (USD MILLION)
- TABLE 411 MEXICO: MARKET, BY VERTICAL, 2023–2028 (USD MILLION)
- TABLE 412 REST OF LATIN AMERICA: MARKET, BY OFFERING, 2017–2022 (USD MILLION)
- TABLE 413 REST OF LATIN AMERICA: FACIAL RECOGNITION MARKET, BY OFFERING, 2023–2028 (USD MILLION)
- TABLE 414 REST OF LATIN AMERICA: MARKET, BY SOFTWARE SOLUTION, 2017–2022 (USD MILLION)
- TABLE 415 REST OF LATIN AMERICA: MARKET, BY SOFTWARE SOLUTION, 2023–2028 (USD MILLION)
- TABLE 416 REST OF LATIN AMERICA: MARKET, BY SERVICE, 2017–2022 (USD MILLION)
- TABLE 417 REST OF LATIN AMERICA: MARKET, BY SERVICE, 2023–2028 (USD MILLION)
- TABLE 418 REST OF LATIN AMERICA: MARKET, BY DEPLOYMENT MODE, 2017–2022 (USD MILLION)
- TABLE 419 REST OF LATIN AMERICA: MARKET, BY DEPLOYMENT MODE, 2023–2028 (USD MILLION)
- TABLE 420 REST OF LATIN AMERICA: MARKET, BY ORGANIZATION SIZE, 2017–2022 (USD MILLION)
- TABLE 421 REST OF LATIN AMERICA: MARKET, BY ORGANIZATION SIZE, 2023–2028 (USD MILLION)
- TABLE 422 REST OF LATIN AMERICA: MARKET, BY APPLICATION, 2017–2022 (USD MILLION)
- TABLE 423 REST OF LATIN AMERICA: MARKET, BY APPLICATION, 2023–2028 (USD MILLION)
- TABLE 424 REST OF LATIN AMERICA: MARKET, BY VERTICAL, 2017–2022 (USD MILLION)
- TABLE 425 REST OF LATIN AMERICA: MARKET, BY VERTICAL, 2023–2028 (USD MILLION)
- TABLE 426 OVERVIEW OF STRATEGIES ADOPTED BY KEY FACIAL RECOGNITION VENDORS
- TABLE 427 FACIAL RECOGNITION MARKET: DEGREE OF COMPETITION
- TABLE 428 MARKET: PRODUCT FOOTPRINT
- TABLE 429 MARKET: APPLICATION FOOTPRINT
- TABLE 430 MARKET: VERTICAL FOOTPRINT
- TABLE 431 MARKET: REGIONAL FOOTPRINT
- TABLE 432 MARKET: KEY START-UPS/SMES
- TABLE 433 MARKET: START-UPS/SMES VERTICAL FOOTPRINT
- TABLE 434 MARKET: START-UPS/SMES REGIONAL FOOTPRINT
- TABLE 435 FACIAL RECOGNITION MARKET: PRODUCT LAUNCHES, JANUARY 2021–FEBRUARY 2024
- TABLE 436 FACIAL RECOGNITION MARKET: DEALS, JANUARY 2021–FEBRUARY 2024
- TABLE 437 NEC: COMPANY OVERVIEW
- TABLE 438 NEC: PRODUCTS/SOLUTIONS/SERVICES OFFERED
- TABLE 439 NEC: PRODUCT LAUNCHES
- TABLE 440 NEC: DEALS
- TABLE 441 MICROSOFT: COMPANY OVERVIEW
- TABLE 442 MICROSOFT: PRODUCTS/SOLUTIONS/SERVICES OFFERED
- TABLE 443 MICROSOFT: PRODUCT LAUNCHES
- TABLE 444 MICROSOFT: DEALS
- TABLE 445 THALES: COMPANY OVERVIEW
- TABLE 446 THALES: PRODUCTS/SOLUTIONS/SERVICES OFFERED
- TABLE 447 THALES: PRODUCT LAUNCHES
- TABLE 448 THALES: DEALS
- TABLE 449 AWS: COMPANY OVERVIEW
- TABLE 450 AWS: PRODUCTS/SOLUTIONS/SERVICES OFFERED
- TABLE 451 AWS: PRODUCT LAUNCHES
- TABLE 452 AWS: DEALS
- TABLE 453 IDEMIA: COMPANY OVERVIEW
- TABLE 454 IDEMIA: PRODUCTS/SOLUTIONS/SERVICES OFFERED
- TABLE 455 IDEMIA: PRODUCT LAUNCHES
- TABLE 456 IDEMIA: DEALS
- TABLE 457 AWARE: COMPANY OVERVIEW
- TABLE 458 AWARE: PRODUCTS/SOLUTIONS/SERVICES OFFERED
- TABLE 459 AWARE: PRODUCT LAUNCHES
- TABLE 460 AWARE: DEALS
- TABLE 461 DAON: COMPANY OVERVIEW
- TABLE 462 DAON: PRODUCTS/SOLUTIONS/SERVICES OFFERED
- TABLE 463 DAON: PRODUCT LAUNCHES
- TABLE 464 DAON: DEALS
- TABLE 465 MEGVII: COMPANY OVERVIEW
- TABLE 466 MEGVII: PRODUCTS/SOLUTIONS/SERVICES OFFERED
- TABLE 467 MEGVII: PRODUCT LAUNCHES
- TABLE 468 FACEPHI: COMPANY OVERVIEW
- TABLE 469 FACEPHI: PRODUCTS/SOLUTIONS/SERVICES OFFERED
- TABLE 470 FACEPHI: PRODUCT LAUNCHES
- TABLE 471 FACEPHI: DEALS
- TABLE 472 HERTA SECURITY: COMPANY OVERVIEW
- TABLE 473 HERTA SECURITY: PRODUCTS/SOLUTIONS/SERVICES OFFERED
- TABLE 474 HERTA SECURITY: PRODUCT LAUNCHES
- TABLE 475 ONESPAN: COMPANY OVERVIEW
- TABLE 476 ONESPAN: PRODUCTS/SOLUTIONS/SERVICES OFFERED
- TABLE 477 ONESPAN: PRODUCT LAUNCHES
- TABLE 478 ONESPAN: DEALS
- TABLE 479 Q3 TECHNOLOGIES: COMPANY OVERVIEW
- TABLE 480 Q3 TECHNOLOGIES: PRODUCTS/SOLUTIONS/SERVICES OFFERED
- TABLE 481 NEUROTECHNOLOGY: COMPANY OVERVIEW
- TABLE 482 NEUROTECHNOLOGY: PRODUCTS/SOLUTIONS/SERVICES OFFERED
- TABLE 483 NEUROTECHNOLOGY: PRODUCT LAUNCHES
- TABLE 484 COGNITEC SYSTEMS: COMPANY OVERVIEW
- TABLE 485 COGNITEC SYSTEMS: PRODUCTS/SOLUTIONS/SERVICES OFFERED
- TABLE 486 COGNITEC SYSTEMS: PRODUCT LAUNCHES
- TABLE 487 COGNITEC SYSTEMS: DEALS
- TABLE 488 ADJACENT MARKETS AND FORECASTS
- TABLE 489 EMOTION DETECTION AND RECOGNITION MARKET, BY COMPONENT, 2016–2021 (USD MILLION)
- TABLE 490 EMOTION DETECTION AND RECOGNITION MARKET, BY COMPONENT, 2022–2027 (USD MILLION)
- TABLE 491 EMOTION DETECTION AND RECOGNITION MARKET, BY SOFTWARE, 2016–2021 (USD MILLION)
- TABLE 492 EMOTION DETECTION AND RECOGNITION MARKET, BY SOFTWARE, 2022–2027 (USD MILLION)
- TABLE 493 EMOTION DETECTION AND RECOGNITION MARKET, BY APPLICATION AREA, 2016–2021 (USD MILLION)
- TABLE 494 EMOTION DETECTION AND RECOGNITION MARKET, BY APPLICATION AREA, 2022–2027 (USD MILLION)
- TABLE 495 EMOTION DETECTION AND RECOGNITION MARKET, BY END USER, 2016–2021 (USD MILLION)
- TABLE 496 EMOTION DETECTION AND RECOGNITION MARKET, BY END USER, 2022–2027 (USD MILLION)
- TABLE 497 EMOTION DETECTION AND RECOGNITION MARKET, BY VERTICAL, 2016–2021 (USD MILLION)
- TABLE 498 EMOTION DETECTION AND RECOGNITION MARKET, BY VERTICAL, 2022–2027 (USD MILLION)
- TABLE 499 EMOTION DETECTION AND RECOGNITION MARKET, BY REGION, 2016–2021 (USD MILLION)
- TABLE 500 EMOTION DETECTION AND RECOGNITION MARKET, BY REGION, 2022–2027 (USD MILLION)
- TABLE 501 CONTACTLESS BIOMETRICS MARKET, BY OFFERING, 2018–2021 (USD MILLION)
- TABLE 502 CONTACTLESS BIOMETRICS MARKET, BY OFFERING, 2022–2027 (USD MILLION)
- TABLE 503 CONTACTLESS BIOMETRICS MARKET, BY APPLICATION, 2018–2021 (USD MILLION)
- TABLE 504 CONTACTLESS BIOMETRICS MARKET, BY APPLICATION, 2022–2027 (USD MILLION)
- TABLE 505 CONTACTLESS BIOMETRICS MARKET, BY VERTICAL, 2018–2021 (USD MILLION)
- TABLE 506 CONTACTLESS BIOMETRICS MARKET, BY VERTICAL, 2022–2027 (USD MILLION)
- TABLE 507 CONTACTLESS BIOMETRICS MARKET, BY REGION, 2018–2021 (USD MILLION)
- TABLE 508 CONTACTLESS BIOMETRICS MARKET, BY REGION, 2022–2027 (USD MILLION)
- TABLE 509 BIOMETRICS-AS-A-SERVICE MARKET, BY OFFERING, 2014–2019 (USD MILLION)
- TABLE 510 PRE-COVID-19: BIOMETRICS-AS-A-SERVICE MARKET, BY OFFERING, 2019–2025 (USD MILLION)
- TABLE 511 POST-COVID-19: BIOMETRICS-AS-A-SERVICE MARKET, BY OFFERING, 2019–2025 (USD MILLION)
- TABLE 512 BIOMETRICS-AS-A-SERVICE SOLUTIONS MARKET, BY TYPE, 2014–2019 (USD MILLION)
- TABLE 513 PRE-COVID-19: BIOMETRICS-AS-A-SERVICE SOLUTIONS MARKET, BY TYPE, 2019–2025 (USD MILLION)
- TABLE 514 POST-COVID-19: BIOMETRICS-AS-A-SERVICE SOLUTIONS MARKET, BY TYPE, 2019–2025 (USD MILLION)
- TABLE 515 BIOMETRICS-AS-A-SERVICE MARKET, BY TRAIT, 2014–2019 (USD MILLION)
- TABLE 516 PRE-COVID-19: BIOMETRICS-AS-A-SERVICE MARKET, BY TRAIT, 2019–2025 (USD MILLION)
- TABLE 517 POST-COVID-19: BIOMETRICS-AS-A-SERVICE MARKET, BY TRAIT, 2019–2025 (USD MILLION)
- TABLE 518 BIOMETRICS-AS-A-SERVICE MARKET, BY MODALITY TYPE, 2014–2019 (USD MILLION)
- TABLE 519 PRE-COVID-19: BIOMETRICS-AS-A-SERVICE MARKET, BY MODALITY TYPE, 2019–2025 (USD MILLION)
- TABLE 520 POST-COVID-19: BIOMETRICS-AS-A-SERVICE MARKET, BY MODALITY TYPE, 2019–2025 (USD MILLION)
- TABLE 521 BIOMETRICS-AS-A-SERVICE MARKET, BY ORGANIZATION SIZE, 2014–2019 (USD MILLION)
- TABLE 522 PRE-COVID-19: BIOMETRICS-AS-A-SERVICE MARKET, BY ORGANIZATION SIZE, 2019–2025 (USD MILLION)
- TABLE 523 POST-COVID-19: BIOMETRICS-AS-A-SERVICE MARKET, BY ORGANIZATION SIZE, 2019–2025 (USD MILLION)
- TABLE 524 BIOMETRICS-AS-A-SERVICE MARKET, BY VERTICAL, 2014–2019 (USD MILLION)
- TABLE 525 PRE-COVID-19: BIOMETRICS-AS-A-SERVICE MARKET, BY VERTICAL, 2019–2025 (USD MILLION)
- TABLE 526 POST-COVID-19: BIOMETRICS-AS-A-SERVICE MARKET, BY VERTICAL, 2019–2025 (USD MILLION)
- TABLE 527 BIOMETRICS-AS-A-SERVICE MARKET, BY REGION, 2014–2019 (USD MILLION)
- TABLE 528 PRE-COVID-19: BIOMETRICS-AS-A-SERVICE MARKET, BY REGION, 2019–2025 (USD MILLION)
- TABLE 529 POST-COVID-19: BIOMETRICS-AS-A-SERVICE MARKET, BY REGION, 2019–2025 (USD MILLION)
- FIGURE 1 FACIAL RECOGNITION MARKET: RESEARCH DESIGN
- FIGURE 2 APPROACH 1 (SUPPLY SIDE): REVENUE FROM HARDWARE, SOFTWARE SOLUTIONS, AND SERVICES OF FACIAL RECOGNITION VENDORS
- FIGURE 3 APPROACH 1 (SUPPLY SIDE) ANALYSIS
- FIGURE 4 APPROACH 2: BOTTOM-UP (DEMAND SIDE)
- FIGURE 5 MARKET: DATA TRIANGULATION
- FIGURE 6 FACIAL RECOGNITION MARKET ESTIMATION: RESEARCH FLOW
- FIGURE 7 COMPANY EVALUATION MATRIX (KEY PLAYERS): CRITERIA WEIGHTAGE
- FIGURE 8 COMPANY EVALUATION MATRIX (START-UPS/SMES): CRITERIA WEIGHTAGE
- FIGURE 9 GLOBAL FACIAL RECOGNITION MARKET TO WITNESS SIGNIFICANT GROWTH DURING FORECAST PERIOD
- FIGURE 10 MARKET: SEGMENTS SNAPSHOT
- FIGURE 11 MARKET: REGIONAL SNAPSHOT
- FIGURE 12 ADVANCEMENTS IN AI AND ML TECHNOLOGIES AND INCREASING APPLICATIONS OF FACIAL RECOGNITION TO BOOST MARKET GROWTH
- FIGURE 13 SOFTWARE SOLUTIONS SEGMENT TO ACCOUNT FOR LARGEST MARKET DURING FORECAST PERIOD
- FIGURE 14 FACE IDENTIFICATION SEGMENT TO ACCOUNT FOR LARGEST MARKET DURING FORECAST PERIOD
- FIGURE 15 PROFESSIONAL SERVICES SEGMENT TO ACCOUNT FOR LARGER MARKET DURING FORECAST PERIOD
- FIGURE 16 SECURITY & ACCESS CONTROL APPLICATION SEGMENT TO ACCOUNT FOR LARGEST MARKET DURING FORECAST PERIOD
- FIGURE 17 ON-PREMISES DEPLOYMENT MODE TO ACCOUNT FOR LARGER MARKET DURING FORECAST PERIOD
- FIGURE 18 LARGE ENTERPRISES SEGMENT TO ACCOUNT FOR LARGER MARKET DURING FORECAST PERIOD
- FIGURE 19 GOVERNMENT VERTICAL TO ACCOUNT FOR LARGEST MARKET DURING FORECAST PERIOD
- FIGURE 20 ASIA PACIFIC TO EMERGE AS BEST MARKET FOR INVESTMENTS IN NEXT FIVE YEARS
- FIGURE 21 FACIAL RECOGNITION MARKET: DRIVERS, RESTRAINTS, OPPORTUNITIES, AND CHALLENGES
- FIGURE 22 MARKET: EVOLUTION
- FIGURE 23 MARKET: VALUE CHAIN ANALYSIS
- FIGURE 24 MARKET: ECOSYSTEM
- FIGURE 25 MARKET: PORTER’S FIVE FORCES ANALYSIS
- FIGURE 26 AVERAGE SELLING PRICES OF KEY PLAYERS FOR TOP THREE SOFTWARE SOLUTIONS
- FIGURE 27 IMPORT DATA, BY KEY COUNTRY, 2017–2022 (USD BILLION)
- FIGURE 28 EXPORT DATA, BY KEY COUNTRY, 2017–2022 (USD BILLION)
- FIGURE 29 LIST OF MAJOR PATENTS FOR FACIAL RECOGNITION
- FIGURE 30 FACIAL RECOGNITION MARKET: TRENDS/DISRUPTIONS IMPACTING CUSTOMERS’ BUSINESSES
- FIGURE 31 INFLUENCE OF STAKEHOLDERS ON BUYING PROCESS FOR TOP THREE VERTICALS
- FIGURE 32 KEY BUYING CRITERIA FOR TOP THREE VERTICALS
- FIGURE 33 LEADING GLOBAL FACIAL RECOGNITION INVESTMENT ROUNDS AND FUNDING RAISED BY COMPANIES, 2017–2022
- FIGURE 34 SOFTWARE SOLUTIONS SEGMENT TO GROW AT HIGHEST CAGR DURING FORECAST PERIOD
- FIGURE 35 FACE VERIFICATION SEGMENT TO GROW AT HIGHEST CAGR DURING FORECAST PERIOD
- FIGURE 36 PROFESSIONAL SERVICES SEGMENT TO GROW AT HIGHER CAGR DURING FORECAST PERIOD
- FIGURE 37 CLOUD SEGMENT TO GROW AT HIGHER CAGR DURING FORECAST PERIOD
- FIGURE 38 LARGE ENTERPRISES SEGMENT TO GROW AT HIGHER CAGR DURING FORECAST PERIOD
- FIGURE 39 FINANCE & PAYMENTS SEGMENT TO GROW AT HIGHEST CAGR DURING FORECAST PERIOD
- FIGURE 40 TRANSPORTATION & UTILITIES SEGMENT TO GROW AT HIGHEST CAGR DURING FORECAST PERIOD
- FIGURE 41 ASIA PACIFIC TO GROW AT HIGHEST CAGR DURING FORECAST PERIOD
- FIGURE 42 NORTH AMERICA: MARKET SNAPSHOT
- FIGURE 43 ASIA PACIFIC: MARKET SNAPSHOT
- FIGURE 44 HISTORICAL REVENUE ANALYSIS OF KEY FACIAL RECOGNITION VENDORS, 2018–2022 (USD MILLION)
- FIGURE 45 VALUATION AND FINANCIAL METRICS OF KEY FACIAL RECOGNITION VENDORS
- FIGURE 46 FACIAL RECOGNITION MARKET SHARE, 2022
- FIGURE 47 BRAND COMPARISON/VENDOR PRODUCT LANDSCAPE
- FIGURE 48 FACIAL RECOGNITION MARKET: COMPANY EVALUATION MATRIX FOR KEY PLAYERS, 2023
- FIGURE 49 MARKET: OVERALL COMPANY FOOTPRINT
- FIGURE 50 FACIAL RECOGNITION MARKET: COMPANY EVALUATION MATRIX FOR START-UPS/SMES, 2023
- FIGURE 51 NEC: COMPANY SNAPSHOT
- FIGURE 52 MICROSOFT: COMPANY SNAPSHOT
- FIGURE 53 THALES: COMPANY SNAPSHOT
- FIGURE 54 AWS: COMPANY SNAPSHOT
- FIGURE 55 AWARE: COMPANY SNAPSHOT
- FIGURE 56 FACEPHI: COMPANY SNAPSHOT
- FIGURE 57 ONESPAN: COMPANY SNAPSHOT
The research study involved four major activities in estimating the size of the facial recognition market. Exhaustive secondary research has been done to collect important information about the market and peer markets. The next step has been to validate these findings, assumptions, and sizing with the help of primary research with industry experts across the value chain. Both top-down and bottom-up approaches have been used to estimate the market size. Post which the market breakdown and data triangulation have been adopted to estimate the market sizes of segments and sub-segments.
Secondary Research
In the secondary research process, various secondary sources were referred to identify and collect information for the study. These included journals, annual reports, press releases, investor presentations of companies and white papers, certified publications, and articles from recognized associations and government publishing sources. Secondary research was mainly used to obtain key information about industry insights, the market's monetary chain, the overall pool of key players, market classification, and segmentation according to industry trends to the bottom-most level, regional markets, and key developments from both market and technology-oriented perspectives.
Primary Research
In the primary research process, various primary sources from both the supply and demand sides were interviewed to obtain qualitative and quantitative information for the report. The primary sources from the supply side included industry experts, such as Chief Executive Officers (CEOs), Chief Technology Officers (CTOs), Chief Operating Officers (COOs), Vice Presidents (VPs), marketing directors, technology and innovation directors, and related key executives from various companies and organizations operating in the facial recognition market. The primary sources from the demand side included consultants/specialists, Chief Information Officers (CIOs), and subject-matter experts.
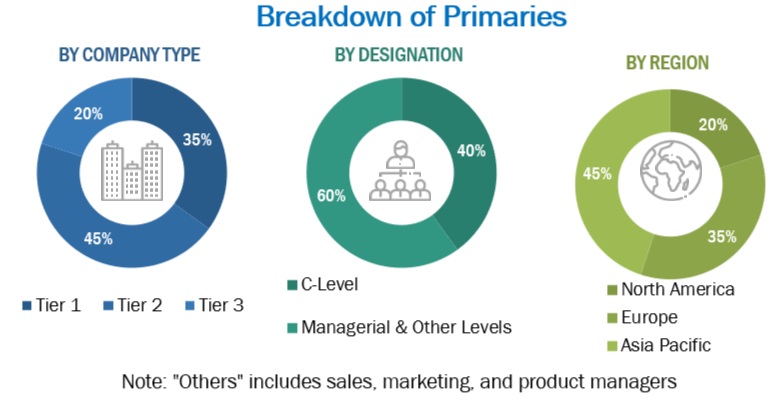
To know about the assumptions considered for the study, download the pdf brochure
Market Size Estimation
Multiple approaches were adopted to estimate and forecast the facial recognition market. The first approach involved estimating the market size by summating companies' revenue generated through facial recognition solutions.
Both top-down and bottom-up approaches were used to estimate and validate the total size of the facial recognition market. The research methodology used to estimate the market size includes the following:
- Key players in the market have been identified through extensive secondary research.
- Regarding value, the industry's supply chain and market size have been determined through primary and secondary research processes.
- All percentage shares, splits, and breakups have been determined using secondary sources and verified through primary sources.
Market Size Estimation Methodology-Bottom-up approach
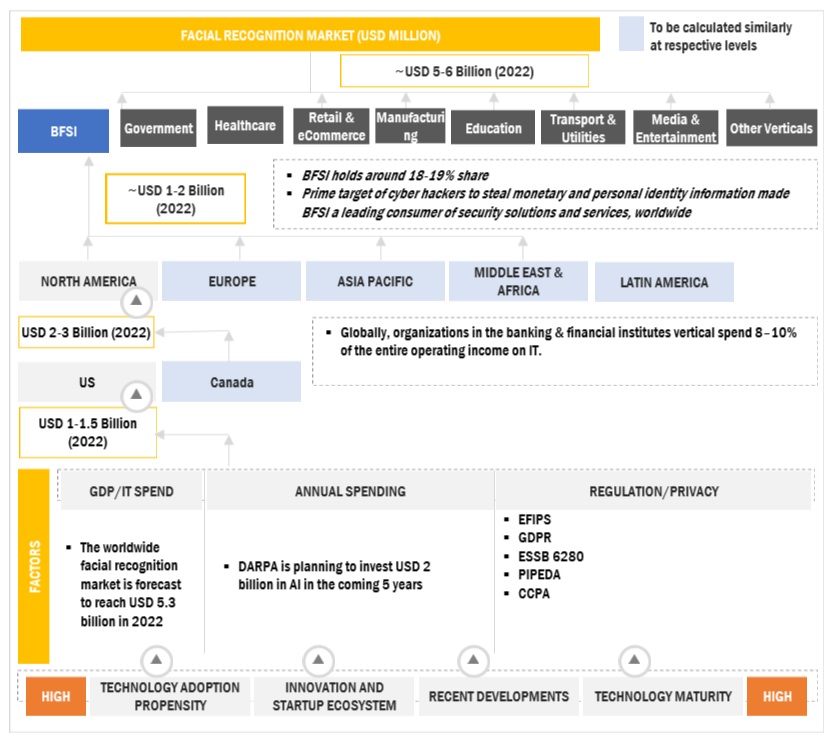
To know about the assumptions considered for the study, Request for Free Sample Report
Market Size Estimation Methodology-top-down approach
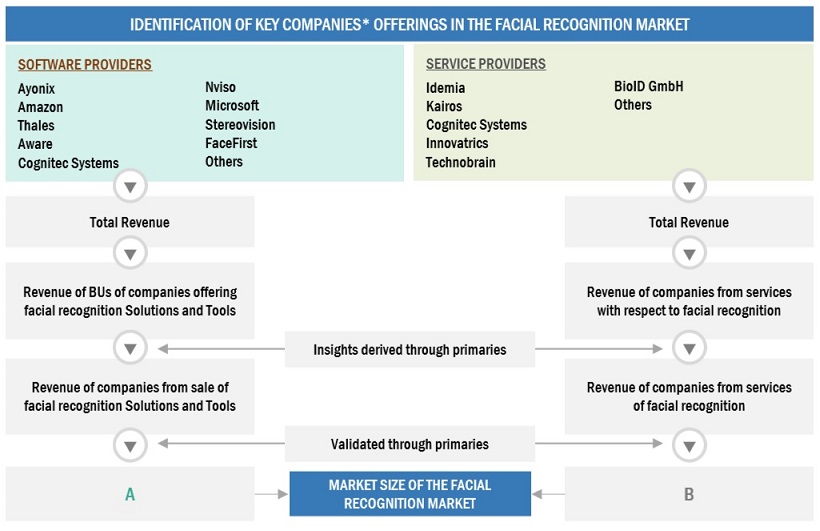
Data Triangulation
The data triangulation procedures were used to complete the overall market engineering process and arrive at the exact statistics for all segments and subsegments. The data was triangulated by studying various factors and trends from the demand and supply sides. Along with data triangulation and market breakdown, the market size was validated by the top-down and bottom-up approaches.
Market Definition
According to Thales, "Facial recognition is the process of identifying or verifying a person's identity using their face. It captures, analyzes, and compares patterns based on the person's facial details."
According to Aware Inc., "Facial recognition technology applies the science of biometrics to a user's facial features. Facial recognition algorithms create a biometric template by detecting and measuring various characteristics or feature points of human faces, including the location of the eyes, eyebrows, nose, mouth, chin, and ears."
According to Cognitec Systems, "facial recognition technology can detect people's faces in live video streams or video footage and store anonymous information for each person's appearance in front of a camera."
Key Stakeholders
- Chief technology and data officers
- Software and solution developers
- Integration and deployment service providers
- Business analysts
- Information Technology (IT) professionals
- Investors and venture capitalists
- Third-party providers
- Consultants/consultancies/advisory firms
- Cyber-security firms
The main objectives of this study are as follows:
- To define, describe, and forecast the facial recognition market based on segment By offering, organization size, deployment mode, applications, and vertical with regions covered.
- To forecast the size of the market segments with respect to five regions: North America, Europe, Asia Pacific (APAC), Middle East and Africa (MEA), and Latin America.
- To provide detailed information on the major factors (drivers, opportunities, threats, and challenges) influencing the growth of the market.
- To analyze each submarket with respect to individual growth trends, prospects, and contributions to the global market.
- To analyze opportunities in the market for stakeholders by identifying high-growth segments of the global market.
- To profile the key market players, such as top and emerging vendors; provide a comparative analysis based on their business overviews, product offerings, and business strategies; and illustrate the market's competitive landscape.
- To track and analyze competitive developments in the market, such as new product launches, product enhancements, partnerships, acquisitions, and agreements and collaborations.
Available Customizations
With the given market data, MarketsandMarkets offers customizations per the company's specific needs. The following customization options are available for the report:
Company Information
- Detailed analysis and profiling of additional market players (up to 5)
Growth opportunities and latent adjacency in Facial Recognition Market
Need insights into the global growth of face recognition.
Need insights into employment by region in the facial recognition market
Need insight into artificial intelligence.
Need insights into building security based market.
Interested in the market potntial of the facial recognition.
Need content for a story on Facial recognition market
Interested in the facial recognition market and their market players.
Detailed understanding of the facial recognition market.
Interested in facial recognition technology used by the US, Europe, The Middle East regions.
Need content for a podcast session on Facial recognition market
Insights on Facial Recognition Technology market from Educational Use cases perspective
Gather insights into Identity Verification Market by Application Area and it's Global Forecast to 2024.
Understand the round B investment in Facial recognition platform for CRM and Face Pay.
Gather insights into android, ios, linux & windows specifically looking for enterprise and smb market sizing for North America.
Gather insights into Facial Recognition Market by End User segments (Government and Utilities, Consumer and Home)
Need insights on market opportunities on Facial Recognition market for M&A purpose
Assessment of the attractiveness of the face recognition market.
Analyse the market scope of AI and Tech Market.
Interested in the market share and main industries and main customers for each of the market players.
Interested in the facial recognition market, it's advancement in the future and the areas that are already covered by the market.
Indepth understanding of the Facial analysis market information.
Need insights on market opportunities on Facial Recognition market for M&A purpose
Interested in the industry dynamics of the Facial Recognition market by Application areas.
Interested in the industry trends, market ecosystem and dynamics, market size and forecast for Mobile facial recognition and Cloud-based facial recognition.
Need insights into the customers emotions & segment its first impression and identify if its existing customer or a new customer and also the pros & cons for the same.
Looking for new opportunities in facial recognition market,.
Deep-dive understanding of the facial recognition in the luxury industry.
Indepth understanding of the computer vision, including face detection, tracking and recognition markets.