Chromatography Reagents Market: Growth, Size, Share, and Trends

Report Code AST 3802
Published in Feb, 2024, By MarketsandMarkets™
Download PDF

Choose License Type

Buy Report Now Inquire Before Buying

Chromatography Reagents Market by Technology (LC (HPLC, UPLC, LPLC), GC, SFC, TLC), Type (Solvent (LC, GC), Derivatization Reagent (Acylation, Silylation), Ion-Pair Reagent, Buffer), Mechanism, End User (Pharma, Academia, Hospital) & Region - Global Forecast to 2029

Overview

The global chromatography reagents market growth forecasted to transform from USD 6.8 billion in 2024 to USD 11.5 billion by 2029, driven by a CAGR of 11.0%. This notable growth driven by various factors. Enhanced research and development efforts in pharmaceutical and biotechnology fields are increasing the demand for advanced chromatography techniques to facilitate drug development and ensure quality control. Moreover, the significance of chromatography tests in maintaining product safety and quality standards in the food and beverage industry is growing, contributing to market expansion. Additionally, the increasing utilization of chromatography in clinical diagnostics, particularly for disease diagnosis and monitoring, is driving demand for chromatography reagents. These factors underscore the growing significance of chromatography reagents across industries, fueling market growth.

Attractive Opportunities in the Chromatography Reagents Market

NORTH AMERICA:

North America is expected to be the largest regional market for chromatography reagents owing to the presence of major pharmaceutical and biotechnology companies and increasing investments in technological advancements in this region.

The chromatography reagent market is expected to significant growth going to the factors increased r and investments in pharmaceutical industries and growing concerns over food safety.

Product launches, collaboration, acquisitions, and partnerships are expected to offer lucrative opportunities for market players in the next five years.

The North American chromatography reagent market is expected to be worth USD 11.5 billion by 2029, growing at a CAGR of 11.0% during the forecast period.

Europe is the second largest market for chromatography reagents owing to the direct indirect financial investment, increasing healthcare expenditure and increasing research activity and academia industry partnership in this region

Global Chromatography Reagents Market Dynamics

DRIVER: Growing pharmaceutical and biopharmaceutical R & D activities

The market is driven by expanding research and development (R&D) activities in pharmaceutical and biotechnology sectors. Companies like Pfizer and Novartis are investing heavily in discovering novel therapeutics. Chromatography techniques such as HPLC are widely used in pharmaceutical labs for drug analysis and quality control. In the food and beverage industry, chromatography tests ensure product safety. For example, LC-MS/MS detects contaminants in food samples. Additionally, chromatography aids clinical diagnostics, with LC-MS/MS quantifying therapeutic drugs in patient samples, supporting personalized medicine. These factors collectively propel the growth of the market.Rising Concerns for Food safetyThe rising concerns for food safety are poised to drive market growth for chromatography reagents. As regulatory standards become more stringent and consumers demand higher quality and safety assurances in their food products, there is a growing need for advanced analytical techniques to detect contaminants and ensure compliance. Chromatography reagents play a crucial role in this process by enabling accurate and reliable analysis of food samples for various contaminants, including pesticides, additives, and adulterants. This increasing demand for chromatography reagents in food safety testing is expected to propel market growth as food manufacturers and regulatory agencies prioritize stringent quality control measures to safeguard public health and maintain consumer trust.

RESTRAINT: Lack of skilled professionals

The lack of skilled professionals poses a significant challenge that could hamper market growth for chromatography reagents. As demand for chromatography techniques continues to rise across various industries, including pharmaceuticals, food and beverage, and environmental testing, there is a growing need for trained personnel proficient in operating chromatography equipment and interpreting analytical results accurately. However, the shortage of skilled professionals in this field can hinder the adoption and utilization of chromatography technologies, leading to delays in research and development activities, quality control processes, and regulatory compliance efforts. Addressing this skills gap through training programs, educational initiatives, and talent development strategies will be essential to overcome this obstacle and sustain market growth for chromatography reagents

OPPORTUNITY: Increasing use of chromatography in proteomics and the purification of monoclonal antibodies

The increasing use of chromatography in proteomics and the purification of monoclonal antibodies presents a significant opportunity in the market. Proteomics, the study of proteins and their functions, relies heavily on chromatography techniques for separating and analyzing complex protein mixtures. Similarly, the purification of monoclonal antibodies, a critical step in biopharmaceutical production, often involves chromatography processes for isolating and purifying these therapeutic proteins.As the fields of proteomics and biopharmaceuticals continue to expand, driven by advancements in research and the development of new therapeutic modalities, the demand for chromatography reagents is expected to rise substantially. Chromatography reagents play a vital role in these applications by enabling precise separations, high-resolution analysis, and efficient purification of proteins and antibodies.Moreover, the increasing adoption of chromatography techniques in proteomics and antibody purification presents opportunities for innovation and product development in the market. Companies can capitalize on this trend by introducing specialized reagents tailored to the unique requirements of proteomic analysis and antibody purification, thereby catering to the evolving needs of researchers and biopharmaceutical manufacturers.Overall, the growing use of chromatography in proteomics and monoclonal antibody purification represents a promising avenue for market expansion in the chromatography reagents segment, offering opportunities for growth, innovation, and competitive differentiation.

CHALLENGE: Premium prices of organic solvents

The premium prices of organic solvents and reagents present a significant challenge in the market. High costs can hinder adoption, especially for users with budget constraints. Fluctuations in prices further exacerbate the issue, leading to unpredictability in procurement costs. Addressing this challenge requires optimizing production processes, exploring innovative solutions, and fostering collaboration among industry stakeholders. By overcoming the hurdle of premium prices, the market can better serve the needs of researchers and industries relying on chromatographic analyses.

Global Chromatography Reagents Market Ecosystem Analysis

The market ecosystem comprises entities responsible for the end-to-end workflow of chromatography reagents and techniques. The major stakeholders present in this market include chromatography reagent manufacturers, third-party chromatography reagent suppliers, reagent raw material suppliers, pharmaceutical, biopharmaceutical, and biotechnology companies, food and beverage industry, environment protection and forensic institutes, clinicians, researchers, hospitals, and pharmaceutical research laboratories, research institutes and academic centers, and government bodies/municipal corporations. The suppliers in the industry continue to enhance and mature their offerings to add value.

The Chromatography Reagents industry, is projected to grow at a CAGR of 11.0% between 2024 and 2029.

The Chromatography Reagents market is projected to reach USD 11.5 billion by 2029 from USD 6.8 billion in 2023, at a CAGR of 11.0% during the forecast period. The rising aging population, increased chronic conditions, rising awareness and government initiatives will provide lucrative opportunities to the market during the forecast period.Solvents segment accounted for a substantial share of the Chromatography Reagents industry, by type in 2023.The solvents segment is positioned to lead the chromatography reagents market owing to its vital role in chromatographic processes. Solvents facilitate sample movement and ensure precise separations of complex mixtures. They enable analytes to interact with the stationary phase, resulting in selective retention and elution of target compounds. Moreover, solvents optimize chromatographic separations, enhancing the accuracy and reliability of analytical results. Given their fundamental importance and extensive use across chromatographic techniques like liquid chromatography (LC) and gas chromatography (GC), the solvents segment is anticipated to remain dominant in the market.

Liquid Chromatography segment accounted for a considerable share in the Chromatography Reagents industry, by technology in 2023

The liquid chromatography segment is poised to lead the chromatography reagents market, attributed to its versatility, efficiency, and widespread adoption across various industries. It encompasses techniques like high-performance liquid chromatography (HPLC), ultra-high-performance liquid chromatography (UHPLC), and liquid chromatography-mass spectrometry (LC-MS), offering high resolution, sensitivity, and reproducibility. Liquid chromatography is adaptable to different sample matrices and analyte types, enhancing its utility in pharmaceutical, biotechnology, food and beverage, environmental, and clinical research. With its robust performance and broad applicability, the liquid chromatography segment is expected to maintain dominance in the market.Adsorption Chromatography accounted for the largest share in Chromatography Reagents industry by Separation mechanism in 2023The adsorption chromatography segment is poised for dominance in the chromatography reagents market, thanks to its versatile separation mechanism. This technique, also referred to as liquid-solid chromatography, relies on the adsorption and desorption of analytes onto a solid stationary phase. Offering high selectivity and sensitivity, it finds applications across various industries. Moreover, the competitive binding of analytes to both the stationary and mobile phases enhances the efficiency and resolution of target compounds' separation. With its widespread adoption in pharmaceuticals, biotechnology, and environmental sectors, the adsorption chromatography segment is primed for significant growth and market leadership in chromatography reagents.

NORTH AMERICA Region Holds the Largest Share of the Chromatography Reagents Market.

Throughout the forecast period, North America is anticipated to maintain its leading position in the chromatography reagents market. This region, comprising primarily the United States and Canada, is at the forefront of this market study. North America boasts a diverse and robust research and development (R&D) infrastructure, leading to the rapid adoption of chromatography techniques across various industries. In 2023, North America held the largest global market share at 37.0%. This growth is fueled by factors such as increased drug development activities, government funding for life science R&D, widespread adoption of advanced technological solutions, and numerous ongoing clinical research studies. These elements collectively propel the growth of the market in North America.

Recent Developments of Chromatography Reagents Market industry

  • In September 2023, Restek Corporation (US) entered into a partnership with Mastek Limites (US), The partnership allowed Restek to enhance chromatography online solutions by leveraging Oracle expertise from Mastek. In june 2023, Merck KGaA (Germany) formed a partenership with Nantong Economic and Technological Development Area (NETDA)(China) aiming to increase the production capacity of highly purified reagents for biopharma quality control, resulting in a significant boost to annual output by several thousand tons.
  • In April 2023, Agilent Technologies, Inc. (US) partnered with PathAI (US), The partnership combined Agilent's assay expertise with PathAI's algorithms, focusing on integrated solutions and companion diagnostics in digital pathology. In June 2022, Waters Corporation (US) collaborated with BioInfra, Inc. (Korea), aiming to enhance regional scientific competitiveness and the quality of pharmaceutical research and testing. The academy will provide hands-on training for scientists in bioanalytical methods crucial for drug discovery and development. With a focus on bioequivalence trials, the training will support the growing demand for lower-cost generic drugs in Southeast Asia

Key Market Players

KEY PLAYERS IN THE Chromatography Reagents Market INCLUDE

  • Thermo Fisher Scientific Inc. (US)
  • Merck KGaA (Germany)
  • Avantor Inc. (US)
  • Waters Corporation (US)
  • Agilent Technologies Inc.(US)
  • Bio-Rad Laboratories Inc. (US)
  • Danaher Corporation (US)
  • Chiron AS (Norway)
  • Loba Chemie (India)
  • GFS Chemicals Inc. (US)
  • Regis Technologies Inc. (US)
  • Tokyo Chemical Industry Co. Ltd (TCI) (Japan)
  • Honeywell International Inc. (US)
  • Shimadzu Corporation (Japan)
  • Santa Cruz Biotechnology Inc. (US)
  • Restek Corporation (US)
  • Spectrum Chemical Mfg. Corp. (US)
  • Kanto Kagaku (Japan)
  • Tedia Company Inc. (US)
  • ITW Reagents Division (Spain)
  • Tosoh Corporation (Japan)
  • Concord Technology Co. Ltd. (Tianjin)
  • Thomas Baker (Chemicals) Pvt. Ltd.(India)
  • Alpha Laboratories Ltd. (Hampshire)
  • Spectrochem (India)
  • Columbus Chemical Industry (WI)

Want to explore hidden markets that can drive new revenue in Chromatography Reagents Market?

Scope of the Report

Report Attribute Details
Market Revenue Size in 2024 USD 6.8 billion
Projected Revenue Size by 2029 USD 11.5 billion
Industry Growth Rate Poised to Grow at a CAGR of 11.0%
Market Driver Growing pharmaceutical and biopharmaceutical R & D activities
Market Opportunity Increasing use of chromatography in proteomics and the purification of monoclonal antibodies


Key Questions Addressed by the Report

What is the projected market revenue value of the global chromatography reagents Market?
The global chromatography reagents market boasts a total revenue value of USD 11.5 billion by 2029.
What is the estimated growth rate (CAGR) of the global chromatography reagents Market?
The global chromatography reagents market has an estimated compound annual growth rate (CAGR) of 11.0% and a revenue size in the region of USD 6.8 billion in 2024. 


Personalize This Research

  • Triangulate with your Own Data
  • Get Data as per your Format and Definition
  • Gain a Deeper Dive on a Specific Application, Geography, Customer or Competitor
  • Any level of Personalization
Request A Free Customisation

Let Us Help You

  • What are the Known and Unknown Adjacencies Impacting the Chromatography Reagents Market
  • What will your New Revenue Sources be?
  • Who will be your Top Customer; what will make them switch?
  • Defend your Market Share or Win Competitors
  • Get a Scorecard for Target Partners
Customized Workshop Request

Table of Contents

Exclusive indicates content/data unique to MarketsandMarkets and not available with any competitors.

TITLE
PAGE NO
INTRODUCTION
24
RESEARCH METHODOLOGY
30
EXECUTIVE SUMMARY
42
PREMIUM INSIGHTS
47
MARKET OVERVIEW
51
  • 5.1 INTRODUCTION
  • 5.2 MARKET DYNAMICS
    DRIVERS
    - Growing R&D activities in pharmaceutical and biopharmaceutical companies
    - Rising concerns for food safety
    - Growing utilization of chromatography in drug development and omics research
    - Increasing demand for monoclonal antibodies for therapeutic treatments
    RESTRAINTS
    - Lack of skilled professionals
    OPPORTUNITIES
    - High demand for chromatography to purify and separate monoclonal antibodies
    - Growing use of chromatography in proteomics
    CHALLENGES
    - Premium cost of organic solvents
  • 5.3 INDUSTRY TRENDS
  • 5.4 TECHNOLOGY ANALYSIS
    ARTIFICIAL INTELLIGENCE AND MACHINE LEARNING
  • 5.5 ECOSYSTEM ANALYSIS
  • 5.6 VALUE CHAIN ANALYSIS
  • 5.7 PORTER’S FIVE FORCES ANALYSIS
    THREAT OF NEW ENTRANTS
    THREAT OF SUBSTITUTES
    BARGAINING POWER OF BUYERS
    BARGAINING POWER OF SUPPLIERS
    INTENSITY OF COMPETITIVE RIVALRY
  • 5.8 PATENT ANALYSIS
    LIST OF KEY PATENTS IN CHROMATOGRAPHY REAGENTS MARKET
  • 5.9 TRADE ANALYSIS
    EXPORT SCENARIO OF CHROMATOGRAPHY REAGENTS
    IMPORT SCENARIO OF CHROMATOGRAPHY REAGENTS
  • 5.10 REGULATORY ANALYSIS
    REGULATORY SCENARIO
    - North America
    - Europe
    - Emerging markets
    REGULATORY BODIES, GOVERNMENT AGENCIES, AND OTHER ORGANIZATIONS
  • 5.11 INVESTMENT AND FUNDING SCENARIO
  • 5.12 PRICING ANALYSIS
    AVERAGE SELLING PRICE OF KEY PLAYERS, BY PRODUCT AND TECHNOLOGY
    AVERAGE SELLING PRICE TREND, BY REGION
  • 5.13 KEY CONFERENCES AND EVENTS, 2024–2025
  • 5.14 TRENDS/DISRUPTIONS IMPACTING CUSTOMERS’ BUSINESSES
  • 5.15 KEY STAKEHOLDERS & BUYING CRITERIA
    KEY STAKEHOLDERS IN BUYING PROCESS
    BUYING CRITERIA
  • 5.16 UNMET NEEDS
  • 5.17 END USER EXPECTATIONS
CHROMATOGRAPHY REAGENTS MARKET, BY TECHNOLOGY
81
  • 6.1 INTRODUCTION
  • 6.2 LIQUID CHROMATOGRAPHY
    LOW PRESSURE LIQUID CHROMATOGRAPHY
    - Rising demand for small-to-medium scale organic synthesis to drive segment
    HIGH PERFORMANCE LIQUID CHROMATOGRAPHY
    - Increasing user preference for early and efficient sample analysis to support segment growth
    ULTRA-HIGH PRESSURE LIQUID CHROMATOGRAPHY
    - Rising focus on analytical processes for high-resolution component separation to boost segment growth
  • 6.3 GAS CHROMATOGRAPHY
    SUPERIOR TECHNICAL NEEDS FOR SEPARATING VOLATILE AND COMPLEX SAMPLES TO SUPPORT MARKET GROWTH
  • 6.4 THIN-LAYER CHROMATOGRAPHY
    SUPERIOR ANALYTICAL CAPABILITY FOR EVALUATING HERBAL PRODUCTS TO AID MARKET GROWTH
  • 6.5 SUPERCRITICAL FLUID CHROMATOGRAPHY
    INCREASING USE IN CHIRAL CHEMISTRY RESEARCH TO DRIVE MARKET
  • 6.6 OTHER TECHNOLOGIES
CHROMATOGRAPHY REAGENTS MARKET, BY TYPE
89
  • 7.1 INTRODUCTION
  • 7.2 SOLVENTS
    LC-GRADE SOLVENTS
    - Rising demand for chemical separation of sample components to drive segment
    GC-GRADE SOLVENTS
    - Growing need for separation tools in environmental testing to aid market growth
    OTHER SOLVENTS
  • 7.3 BUFFERS
    EFFECTIVE MAINTENANCE OF PH IN SAMPLES AND DETECTION OF AMINES TO BOOST MARKET GROWTH
  • 7.4 DERIVATIZATION REAGENTS
    SILYLATION REAGENTS
    - Increasing need to enhance chromatographic separation of non-volatile samples to drive segment growth
    ALKYLATION & ESTERIFICATION REAGENTS
    - High availability and ease of usage in extractive procedures to support segment growth
    ACYLATION REAGENTS
    - Increased detectability by electrochemical and hydrolytically stable derivatives to boost segment growth
  • 7.5 ION-PAIR REAGENTS
    ACIDIC ION-PAIR REAGENTS
    - Increased focus on versatility and effectiveness in separating charged analytes to aid segment growth
    BASIC ION-PAIR REAGENTS
    - High R&D investments and stringent regulatory requirements to propel segment growth
  • 7.6 OTHER REAGENTS
CHROMATOGRAPHY REAGENTS MARKET, BY SEPARATION MECHANISM
103
  • 8.1 INTRODUCTION
  • 8.2 ADSORPTION CHROMATOGRAPHY
    INCREASING USE IN DIFFERENT INDUSTRIES AND APPLICATIONS TO SUPPORT MARKET GROWTH
  • 8.3 PARTITION CHROMATOGRAPHY
    INCREASED DEVELOPMENT OF BONDED PHASES IN PACKED COLUMNS TO LIMIT MARKET GROWTH
  • 8.4 ION-EXCHANGE CHROMATOGRAPHY
    EASY SEPARATION OF CHARGED BIOLOGICAL MOLECULES TO DRIVE MARKET
  • 8.5 SIZE-EXCLUSION CHROMATOGRAPHY
    EASY SIZE PROFILING OF PROTEIN SAMPLES TO SUPPORT MARKET GROWTH
  • 8.6 AFFINITY CHROMATOGRAPHY
    INCREASING PHARMACEUTICAL R&D FOR BETTER PROTEIN PURIFICATION RESEARCH TO BOOST MARKET GROWTH
  • 8.7 OTHER SEPARATION MECHANISMS
CHROMATOGRAPHY REAGENTS MARKET, BY END USER
112
  • 9.1 INTRODUCTION
  • 9.2 PHARMACEUTICAL COMPANIES
    GROWING INDUSTRIAL MANUFACTURING AND RESEARCH CAPABILITIES TO DRIVE MARKET
  • 9.3 BIOPHARMACEUTICAL COMPANIES
    INCREASING UTILIZATION OF BIOMOLECULE ANALYSIS TO BOOST MARKET GROWTH
  • 9.4 RESEARCH & ACADEMIC LABORATORIES
    INCREASED USE OF HIGH-END CHROMATOGRAPHY TOOLS IN ACADEMIA TO SUPPORT MARKET GROWTH
  • 9.5 FOOD & BEVERAGE INDUSTRY
    STRICT ADHERENCE TO FOOD QUALITY STANDARDS AND REGULATORY REFORMS TO SUPPORT MARKET GROWTH
  • 9.6 HOSPITALS & CLINICAL TESTING LABORATORIES
    INCREASING NUMBER OF DIAGNOSTIC TESTS TO SUPPORT MARKET GROWTH
  • 9.7 ENVIRONMENTAL TESTING LABORATORIES
    GROWING USE BY GOVERNMENT AGENCIES FOR MEASURING POLLUTION LEVELS TO PROPEL MARKET GROWTH
  • 9.8 FORENSIC TESTING LABORATORIES
    EASY IDENTIFICATION OF FLUIDS AND COMPOUNDS IN BLOOD SAMPLES TO AID MARKET GROWTH
  • 9.9 PETROCHEMICAL INDUSTRY
    INCREASED USE IN REFINERY OPERATIONS TO DRIVE MARKET
  • 9.10 OTHER END USERS
CHROMATOGRAPHY REAGENTS MARKET, BY REGION
123
  • 10.1 INTRODUCTION
  • 10.2 NORTH AMERICA
    NORTH AMERICA: RECESSION IMPACT
    US
    - Increased government investments for biomedical research to drive market
    CANADA
    - Increasing funding for research and growing food testing industry to drive market
  • 10.3 EUROPE
    EUROPE: RECESSION IMPACT
    GERMANY
    - Growing biotechnology sector and rising research pipeline to propel market growth
    FRANCE
    - Increased investments in capability expansion for life sciences research to aid market growth
    UK
    - Growing investments in pharmaceutical development to support market growth
    ITALY
    - Increasing number of biotechnology firms to aid market growth
    SPAIN
    - Rising availability of research funds and grants for life sciences and pharmaceutical drug development to boost market growth
    REST OF EUROPE
  • 10.4 ASIA PACIFIC
    ASIA PACIFIC: RECESSION IMPACT
    JAPAN
    - Growing focus on biomedical and medical research to boost market growth
    CHINA
    - Rising R&D investment in pharmaceutical industry to aid market growth
    INDIA
    - Growing pharmaceutical and biotechnology industries to drive market
    AUSTRALIA
    - Rising number of public-private research collaborations to propel market growth
    SOUTH KOREA
    - Increasing applications of chromatography in life sciences research to aid market growth
    REST OF ASIA PACIFIC
  • 10.5 LATIN AMERICA
    LATIN AMERICA: RECESSION IMPACT
    BRAZIL
    - Increasing focus on R&D for drug discovery to drive market
    MEXICO
    - Growing government initiatives to promote entry of foreign manufacturers to support market growth
    REST OF LATIN AMERICA
  • 10.6 MIDDLE EAST & AFRICA
    MIDDLE EAST & AFRICA: RECESSION IMPACT
    GCC COUNTRIES
    - Increasing investment in healthcare infrastructure and rising focus on personalized medicines to drive market
    REST OF MIDDLE EAST & AFRICA
COMPETITIVE LANDSCAPE
167
  • 11.1 INTRODUCTION
  • 11.2 RIGHT-TO-WIN APPROACHES ADOPTED BY KEY PLAYERS
  • 11.3 REVENUE SHARE ANALYSIS
  • 11.4 MARKET SHARE ANALYSIS
  • 11.5 COMPANY EVALUATION MATRIX: KEY PLAYERS
    STARS
    EMERGING LEADERS
    PERVASIVE PLAYERS
    PARTICIPANTS
    COMPANY FOOTPRINT
  • 11.6 COMPANY EVALUATION MATRIX: START-UPS/SMES
    PROGRESSIVE COMPANIES
    RESPONSIVE COMPANIES
    DYNAMIC COMPANIES
    STARTING BLOCKS
    COMPETITIVE BENCHMARKING
  • 11.7 VALUATION AND FINANCIAL METRICS
  • 11.8 BRAND/PRODUCT COMPARATIVE ANALYSIS
  • 11.9 COMPETITIVE SCENARIO
    PRODUCT LAUNCHES
    DEALS
    EXPANSIONS
COMPANY PROFILES
188
  • 12.1 KEY PLAYERS
    THERMO FISHER SCIENTIFIC INC.
    - Business overview
    - Products/Services/Solutions offered
    - Recent developments
    - MnM view
    MERCK KGAA
    - Business overview
    - Products/Services/Solutions offered
    - Recent developments
    - MnM view
    AVANTOR, INC.
    - Business overview
    - Products/Services/Solutions offered
    - Recent developments
    - MnM view
    WATERS CORPORATION
    - Business overview
    - Products/Services/Solutions offered
    - Recent developments
    - MnM view
    BIO-RAD LABORATORIES, INC.
    - Business overview
    - Products/Services/Solutions offered
    - Recent developments
    DANAHER CORPORATION
    - Business overview
    - Products/Services/Solutions offered
    - Recent developments
    REGIS TECHNOLOGIES INC.
    - Business overview
    - Products/Services/Solutions offered
    - Recent developments
    LOBACHEMIE PVT. LTD.
    - Business overview
    - Products/Services/Solutions offered
    SANTA CRUZ BIOTECHNOLOGY, INC.
    - Business overview
    - Products/Services/Solutions offered
    AGILENT TECHNOLOGIES, INC.
    - Business overview
    - Products/Services/Solutions offered
    - Recent developments
    RESTEK CORPORATION
    - Business overview
    - Products/Services/Solutions offered
    - Recent developments
    GFS CHEMICALS, INC.
    - Business overview
    - Products/Services/Solutions offered
    CHIRON AS
    - Business overview
    - Products/Services/Solutions offered
    TOKYO CHEMICAL INDUSTRY CO., LTD.
    - Business overview
    - Products/Services/Solutions offered
    TOSOH CORPORATION
    - Business overview
    - Products/Services/Solutions offered
    HONEYWELL INTERNATIONAL INC.
    - Business overview
    - Products/Services/Solutions offered
    SHIMADZU CORPORATION
    - Business overview
    - Products/Services/Solutions offered
    KANTO KAGAKU
    - Business overview
    - Products/Services/Solutions offered
    SPECTRUM CHEMICAL MFG. CORP.
    - Business overview
    - Products/Services/Solutions offered
    TEDIA COMPANY, INC.
    - Business overview
    - Products/Services/Solutions offered
    ITW REAGENTS DIVISION
    - Business overview
    - Products/Services/Solutions offered
  • 12.2 OTHER PLAYERS
    CONCORD TECHNOLOGY (TIANJIN) CO., LTD.
    THOMAS BAKER (CHEMICALS) PVT. LTD.
    ALPHA LABORATORIES
    SPECTROCHEM
    COLUMBUS CHEMICALS
APPENDIX
242
  • 13.1 DISCUSSION GUIDE
  • 13.2 KNOWLEDGESTORE: MARKETSANDMARKETS’ SUBSCRIPTION PORTAL
  • 13.3 CUSTOMIZATION OPTIONS
  • 13.4 RELATED REPORTS
  • 13.5 AUTHOR DETAILS
LIST OF TABLES
 
  • TABLE 1 MARKET DYNAMICS: IMPACT ANALYSIS
  • TABLE 2 INDUSTRY TRENDS: CHROMATOGRAPHY REAGENTS MARKET
  • TABLE 3 ROLE IN ECOSYSTEM: CHROMATOGRAPHY REAGENTS MARKET
  • TABLE 4 PORTER’S FIVE FORCES ANALYSIS: CHROMATOGRAPHY REAGENTS MARKET
  • TABLE 5 KEY PATENTS IN CHROMATOGRAPHY REAGENTS MARKET, JANUARY 2020–DECEMBER 2022
  • TABLE 6 NORTH AMERICA: REGULATORY BODIES, GOVERNMENT AGENCIES, AND OTHER ORGANIZATIONS
  • TABLE 7 EUROPE: REGULATORY BODIES, GOVERNMENT AGENCIES, AND OTHER ORGANIZATIONS
  • TABLE 8 ASIA PACIFIC: REGULATORY BODIES, GOVERNMENT AGENCIES, AND OTHER ORGANIZATIONS
  • TABLE 9 REGULATORY STANDARDS IN CHROMATOGRAPHY REAGENTS MARKET
  • TABLE 10 AVERAGE SELLING PRICE FOR CHROMATOGRAPHY SOLVENTS, BY PRODUCT AND TECHNOLOGY
  • TABLE 11 LIST OF KEY CONFERENCES AND EVENTS IN CHROMATOGRAPHY REAGENTS MARKET, 2024–2025
  • TABLE 12 INFLUENCE OF STAKEHOLDERS ON BUYING PROCESS (%)
  • TABLE 13 KEY BUYING CRITERIA FOR CHROMATOGRAPHY REAGENTS
  • TABLE 14 UNMET NEEDS IN CHROMATOGRAPHY REAGENTS MARKET
  • TABLE 15 END USER EXPECTATIONS IN CHROMATOGRAPHY REAGENTS MARKET
  • TABLE 16 CHROMATOGRAPHY REAGENTS MARKET, BY TECHNOLOGY, 2022–2029 (USD MILLION)
  • TABLE 17 CHROMATOGRAPHY REAGENTS MARKET FOR TECHNOLOGY, BY REGION, 2022–2029 (USD MILLION)
  • TABLE 18 DIFFERENTIATION OF LIQUID CHROMATOGRAPHY SYSTEMS
  • TABLE 19 CHROMATOGRAPHY REAGENTS MARKET FOR LIQUID CHROMATOGRAPHY, BY TYPE, 2022–2029 (USD MILLION)
  • TABLE 20 CHROMATOGRAPHY REAGENTS MARKET FOR LIQUID CHROMATOGRAPHY, BY REGION, 2022–2029 (USD MILLION)
  • TABLE 21 CHROMATOGRAPHY REAGENTS MARKET FOR GAS CHROMATOGRAPHY, BY REGION, 2022–2029 (USD MILLION)
  • TABLE 22 CHROMATOGRAPHY REAGENTS MARKET FOR THIN-LAYER CHROMATOGRAPHY, BY REGION, 2022–2029 (USD MILLION)
  • TABLE 23 CHROMATOGRAPHY REAGENTS MARKET FOR SUPERCRITICAL FLUID CHROMATOGRAPHY, BY REGION, 2022–2029 (USD MILLION)
  • TABLE 24 CHROMATOGRAPHY REAGENTS MARKET FOR OTHER TECHNOLOGIES, BY REGION, 2022–2029 (USD MILLION)
  • TABLE 25 CHROMATOGRAPHY REAGENTS MARKET, BY TYPE, 2022–2029 (USD MILLION)
  • TABLE 26 CHROMATOGRAPHY REAGENTS MARKET FOR SOLVENTS, BY TYPE, 2022–2029 (USD MILLION)
  • TABLE 27 CHROMATOGRAPHY REAGENTS MARKET FOR SOLVENTS, BY REGION, 2022–2029 (USD MILLION)
  • TABLE 28 LC-GRADE SOLVENTS MARKET, BY REGION, 2022–2029 (USD MILLION)
  • TABLE 29 GC-GRADE SOLVENTS MARKET, BY REGION, 2022–2029 (USD MILLION)
  • TABLE 30 OTHER SOLVENTS MARKET, BY REGION, 2022–2029 (USD MILLION)
  • TABLE 31 CHROMATOGRAPHY REAGENTS MARKET FOR BUFFERS, BY REGION, 2022–2029 (USD MILLION)
  • TABLE 32 CHROMATOGRAPHY REAGENTS MARKET FOR DERIVATIZATION REAGENTS, BY TYPE, 2022–2029 (USD MILLION)
  • TABLE 33 CHROMATOGRAPHY REAGENTS MARKET FOR DERIVATIZATION REAGENTS, BY REGION, 2022–2029 (USD MILLION)
  • TABLE 34 SILYLATION REAGENTS MARKET, BY REGION, 2022–2029 (USD MILLION)
  • TABLE 35 ALKYLATION & ESTERIFICATION REAGENTS MARKET, BY REGION, 2022–2029 (USD MILLION)
  • TABLE 36 ACYLATION REAGENTS MARKET, BY REGION, 2022–2029 (USD MILLION)
  • TABLE 37 CHROMATOGRAPHY REAGENTS MARKET FOR ION-PAIR REAGENTS, BY TYPE, 2022–2029 (USD MILLION)
  • TABLE 38 CHROMATOGRAPHY REAGENTS MARKET FOR ION-PAIR REAGENTS, BY REGION, 2022–2029 (USD MILLION)
  • TABLE 39 ACIDIC ION-PAIR REAGENTS MARKET, BY REGION, 2022–2029 (USD MILLION)
  • TABLE 40 BASIC ION-PAIR REAGENTS MARKET, BY REGION, 2022–2029 (USD MILLION)
  • TABLE 41 CHROMATOGRAPHY REAGENTS MARKET FOR OTHER REAGENTS, BY REGION, 2022–2029 (USD MILLION)
  • TABLE 42 PRINCIPLES OF SEPARATION TECHNIQUES
  • TABLE 43 CHROMATOGRAPHY REAGENTS MARKET, BY SEPARATION MECHANISM, 2022–2029 (USD MILLION)
  • TABLE 44 CHROMATOGRAPHY REAGENTS MARKET FOR SEPARATION MECHANISMS, BY REGION 2022–2029 (USD MILLION)
  • TABLE 45 CHROMATOGRAPHY REAGENTS MARKET FOR ADSORPTION CHROMATOGRAPHY, BY REGION, 2022–2029 (USD MILLION)
  • TABLE 46 CHROMATOGRAPHY REAGENTS MARKET FOR PARTITION CHROMATOGRAPHY, BY REGION, 2022–2029 (USD MILLION)
  • TABLE 47 CHROMATOGRAPHY REAGENTS MARKET FOR ION-EXCHANGE CHROMATOGRAPHY, BY REGION, 2022–2029 (USD MILLION)
  • TABLE 48 CHROMATOGRAPHY REAGENTS MARKET FOR SIZE-EXCLUSION CHROMATOGRAPHY, BY REGION, 2022–2029 (USD MILLION)
  • TABLE 49 CHROMATOGRAPHY REAGENTS MARKET FOR AFFINITY CHROMATOGRAPHY, BY REGION, 2022–2029 (USD MILLION)
  • TABLE 50 CHROMATOGRAPHY REAGENTS MARKET FOR OTHER SEPARATION MECHANISMS, BY REGION, 2022–2029 (USD MILLION)
  • TABLE 51 CHROMATOGRAPHY REAGENTS MARKET, BY END USER, 2022–2029 (USD MILLION)
  • TABLE 52 CHROMATOGRAPHY REAGENTS MARKET FOR END USERS, BY REGION, 2022–2029 (USD MILLION)
  • TABLE 53 CHROMATOGRAPHY REAGENTS MARKET FOR PHARMACEUTICAL COMPANIES, BY REGION, 2022–2029 (USD MILLION)
  • TABLE 54 CHROMATOGRAPHY REAGENTS MARKET FOR BIOPHARMACEUTICAL COMPANIES, BY REGION, 2022–2029 (USD MILLION)
  • TABLE 55 CHROMATOGRAPHY REAGENTS MARKET FOR RESEARCH & ACADEMIC LABORATORIES, BY REGION, 2022–2029 (USD MILLION)
  • TABLE 56 CHROMATOGRAPHY REAGENTS MARKET FOR FOOD & BEVERAGE INDUSTRY, BY REGION, 2022–2029 (USD MILLION)
  • TABLE 57 CHROMATOGRAPHY REAGENTS MARKET FOR HOSPITALS & CLINICAL TESTING LABORATORIES, BY REGION, 2022–2029 (USD MILLION)
  • TABLE 58 CHROMATOGRAPHY REAGENTS MARKET FOR ENVIRONMENTAL TESTING LABORATORIES, BY REGION, 2022–2029 (USD MILLION)
  • TABLE 59 CHROMATOGRAPHY REAGENTS MARKET FOR FORENSIC TESTING LABORATORIES, BY REGION, 2022–2029 (USD MILLION)
  • TABLE 60 CHROMATOGRAPHY REAGENTS MARKET FOR PETROCHEMICAL INDUSTRY, BY REGION, 2022–2029
  • TABLE 61 CHROMATOGRAPHY REAGENTS MARKET FOR OTHER END USERS, BY REGION, 2022–2029 (USD MILLION)
  • TABLE 62 CHROMATOGRAPHY REAGENTS MARKET, BY REGION, 2022–2029 (USD MILLION)
  • TABLE 63 NORTH AMERICA: CHROMATOGRAPHY REAGENTS MARKET, BY COUNTRY, 2022–2029 (USD MILLION)
  • TABLE 64 NORTH AMERICA: CHROMATOGRAPHY REAGENTS MARKET, BY TYPE, 2022–2029 (USD MILLION)
  • TABLE 65 NORTH AMERICA: CHROMATOGRAPHY REAGENTS MARKET FOR SOLVENTS, BY TYPE, 2022–2029 (USD MILLION)
  • TABLE 66 NORTH AMERICA: CHROMATOGRAPHY REAGENTS MARKET FOR DERIVATIZATION REAGENTS, BY TYPE, 2022–2029 (USD MILLION)
  • TABLE 67 NORTH AMERICA: CHROMATOGRAPHY REAGENTS MARKET FOR ION-PAIR REAGENTS, BY TYPE, 2022–2029 (USD MILLION)
  • TABLE 68 NORTH AMERICA: CHROMATOGRAPHY REAGENTS MARKET, BY TECHNOLOGY, 2022–2029 (USD MILLION)
  • TABLE 69 NORTH AMERICA: CHROMATOGRAPHY REAGENTS MARKET, BY SEPARATION MECHANISM, 2022–2029 (USD MILLION)
  • TABLE 70 NORTH AMERICA: CHROMATOGRAPHY REAGENTS MARKET, BY END USER, 2022–2029 (USD MILLION)
  • TABLE 71 US: CHROMATOGRAPHY REAGENTS MARKET, BY TYPE, 2022–2029 (USD MILLION)
  • TABLE 72 CANADA: CHROMATOGRAPHY REAGENTS MARKET, BY TYPE, 2022–2029 (USD MILLION)
  • TABLE 73 EUROPE: CHROMATOGRAPHY REAGENTS MARKET, BY TYPE, 2022–2029 (USD MILLION)
  • TABLE 74 EUROPE: CHROMATOGRAPHY REAGENTS MARKET FOR SOLVENTS, BY TYPE, 2022–2029 (USD MILLION)
  • TABLE 75 EUROPE: CHROMATOGRAPHY REAGENTS MARKET FOR DERIVATIZATION REAGENTS, BY TYPE, 2022–2029 (USD MILLION)
  • TABLE 76 EUROPE: CHROMATOGRAPHY REAGENTS MARKEY FOR ION-PAIR REAGENTS, BY TYPE, 2022–2029 (USD MILLION)
  • TABLE 77 EUROPE: CHROMATOGRAPHY REAGENTS MARKET, BY TECHNOLOGY, 2022–2029 (USD MILLION)
  • TABLE 78 EUROPE: CHROMATOGRAPHY REAGENTS MARKET, BY SEPARATION MECHANISM, 2022–2029 (USD MILLION)
  • TABLE 79 EUROPE: CHROMATOGRAPHY REAGENTS MARKET, BY END USER, 2022–2029 (USD MILLION)
  • TABLE 80 GERMANY: CHROMATOGRAPHY REAGENTS MARKET, BY TYPE, 2022–2029 (USD MILLION)
  • TABLE 81 FRANCE: CHROMATOGRAPHY REAGENTS MARKET, BY TYPE, 2022–2029 (USD MILLION)
  • TABLE 82 UK: CHROMATOGRAPHY REAGENTS MARKET, BY TYPE, 2022–2029 (USD MILLION)
  • TABLE 83 ITALY: CHROMATOGRAPHY REAGENTS MARKET, BY TYPE, 2022–2029 (USD MILLION)
  • TABLE 84 SPAIN: CHROMATOGRAPHY REAGENTS MARKET, BY TYPE, 2022–2029 (USD MILLION)
  • TABLE 85 REST OF EUROPE: CHROMATOGRAPHY REAGENTS MARKET, BY TYPE, 2022–2029 (USD MILLION)
  • TABLE 86 ASIA PACIFIC: CHROMATOGRAPHY REAGENTS MARKET, BY COUNTRY, 2022–2029 (USD MILLION)
  • TABLE 87 ASIA PACIFIC: CHROMATOGRAPHY REAGENTS MARKET, BY TYPE, 2022–2029 (USD MILLION)
  • TABLE 88 ASIA PACIFIC: CHROMATOGRAPHY REAGENTS MARKET FOR SOLVENTS, BY TYPE, 2022–2029 (USD MILLION)
  • TABLE 89 ASIA PACIFIC: CHROMATOGRAPHY REAGENTS MARKET FOR DERIVATIZATION REAGENTS, BY TYPE, 2022–2029 (USD MILLION)
  • TABLE 90 ASIA PACIFIC: CHROMATOGRAPHY REAGENTS MARKET FOR ION-PAIR REAGENTS, BY TYPE, 2022–2029 (USD MILLION)
  • TABLE 91 ASIA PACIFIC: CHROMATOGRAPHY REAGENTS MARKET, BY TECHNOLOGY, 2022–2029 (USD MILLION)
  • TABLE 92 ASIA PACIFIC: CHROMATOGRAPHY REAGENTS MARKET, BY SEPARATION MECHANISM, 2022–2029 (USD MILLION)
  • TABLE 93 ASIA PACIFIC: CHROMATOGRAPHY REAGENTS MARKET, BY END USER, 2022–2029 (USD MILLION)
  • TABLE 94 JAPAN: CHROMATOGRAPHY REAGENTS MARKET, BY TYPE, 2022–2029 (USD MILLION)
  • TABLE 95 CHINA: CHROMATOGRAPHY REAGENTS MARKET, BY TYPE, 2022–2029 (USD MILLION)
  • TABLE 96 INDIA: CHROMATOGRAPHY REAGENTS MARKET, BY TYPE, 2022–2029 (USD MILLION)
  • TABLE 97 AUSTRALIA: CHROMATOGRAPHY REAGENTS MARKET, BY TYPE, 2022–2029 (USD MILLION)
  • TABLE 98 SOUTH KOREA: CHROMATOGRAPHY REAGENTS MARKET, BY TYPE, 2022–2029 (USD MILLION)
  • TABLE 99 REST OF ASIA PACIFIC: CHROMATOGRAPHY REAGENTS MARKET, BY TYPE, 2022–2029 (USD MILLION)
  • TABLE 100 LATIN AMERICA: CHROMATOGRAPHY REAGENTS MARKET, BY COUNTRY, 2022–2029 (USD MILLION)
  • TABLE 101 LATIN AMERICA: CHROMATOGRAPHY REAGENTS MARKET, BY TYPE, 2022–2029 (USD MILLION)
  • TABLE 102 LATIN AMERICA: CHROMATOGRAPHY REAGENTS MARKET FOR SOLVENTS, BY TYPE, 2022–2029 (USD MILLION)
  • TABLE 103 LATIN AMERICA: CHROMATOGRAPHY REAGENTS MARKET FOR DERIVATIZATION REAGENTS, BY TYPE, 2022–2029 (USD MILLION)
  • TABLE 104 LATIN AMERICA: CHROMATOGRAPHY REAGENTS MARKET FOR ION-PAIR REAGENTS, BY TYPE, 2022–2029 (USD MILLION)
  • TABLE 105 LATIN AMERICA: CHROMATOGRAPHY REAGENTS MARKET, BY TECHNOLOGY, 2022–2029 (USD MILLION)
  • TABLE 106 LATIN AMERICA: CHROMATOGRAPHY REAGENTS MARKET, BY SEPARATION MECHANISM, 2022–2029 (USD MILLION)
  • TABLE 107 LATIN AMERICA: CHROMATOGRAPHY REAGENTS MARKET, BY END USER, 2022–2029 (USD MILLION)
  • TABLE 108 BRAZIL: CHROMATOGRAPHY REAGENTS MARKET, BY TYPE, 2022–2029 (USD MILLION)
  • TABLE 109 MEXICO: CHROMATOGRAPHY REAGENTS MARKET, BY TYPE, 2022–2029 (USD MILLION)
  • TABLE 110 REST OF LATIN AMERICA: CHROMATOGRAPHY REAGENTS MARKET, BY TYPE, 2022–2029 (USD MILLION)
  • TABLE 111 MIDDLE EAST & AFRICA: CHROMATOGRAPHY REAGENTS MARKET, BY REGION, 2022–2029 (USD MILLION)
  • TABLE 112 MIDDLE EAST & AFRICA: CHROMATOGRAPHY REAGENTS MARKET, BY TYPE, 2022–2029 (USD MILLION)
  • TABLE 113 MIDDLE EAST & AFRICA: CHROMATOGRAPHY REAGENTS MARKET FOR SOLVENTS, BY TYPE, 2022–2029 (USD MILLION)
  • TABLE 114 MIDDLE EAST & AFRICA: CHROMATOGRAPHY REAGENTS MARKET FOR DERIVATIZATION REAGENTS, BY TYPE, 2022–2029 (USD MILLION)
  • TABLE 115 MIDDLE EAST & AFRICA: CHROMATOGRAPHY REAGENTS MARKET FOR ION-PAIR REAGENTS, BY TYPE, 2022–2029 (USD MILLION)
  • TABLE 116 MIDDLE EAST & AFRICA: CHROMATOGRAPHY REAGENTS MARKET, BY TECHNOLOGY, 2022–2029 (USD MILLION)
  • TABLE 117 MIDDLE EAST & AFRICA: CHROMATOGRAPHY REAGENTS MARKET, BY SEPARATION MECHANISM, 2022–2029 (USD MILLION)
  • TABLE 118 MIDDLE EAST & AFRICA: CHROMATOGRAPHY REAGENTS MARKET, BY END USER, 2022–2029 (USD MILLION)
  • TABLE 119 GCC COUNTRIES: CHROMATOGRAPHY REAGENTS MARKET, BY TYPE, 2022–2029 (USD MILLION)
  • TABLE 120 REST OF MIDDLE EAST & AFRICA: CHROMATOGRAPHY REAGENTS MARKET, BY TYPE, 2022–2029 (USD MILLION)
  • TABLE 121 CHROMATOGRAPHY REAGENTS MARKET: DEGREE OF COMPETITION
  • TABLE 122 CHROMATOGRAPHY REAGENTS MARKET: PRODUCT FOOTPRINT
  • TABLE 123 CHROMATOGRAPHY REAGENTS MARKET: SEPARATION MECHANISM FOOTPRINT
  • TABLE 124 CHROMATOGRAPHY REAGENTS MARKET: REGIONAL FOOTPRINT
  • TABLE 125 CHROMATOGRAPHY REAGENTS MARKET: DETAILED LIST OF KEY START-UPS/SMES
  • TABLE 126 CHROMATOGRAPHY REAGENTS MARKET: COMPETITIVE BENCHMARKING OF KEY START-UPS/SMES
  • TABLE 127 CHROMATOGRAPHY REAGENTS MARKET: PRODUCT LAUNCHES, JANUARY 2020–FEBRUARY 2024
  • TABLE 128 CHROMATOGRAPHY REAGENTS MARKET: DEALS, JANUARY 2020–FEBRUARY 2024
  • TABLE 129 CHROMATOGRAPHY REAGENTS MARKET: EXPANSIONS, JANUARY 2020–FEBRUARY 2024
  • TABLE 130 THERMO FISHER SCIENTIFIC INC.: COMPANY OVERVIEW
  • TABLE 131 THERMO FISHER SCIENTIFIC INC.: DEALS
  • TABLE 132 THERMO FISHER SCIENTIFIC INC.: EXPANSIONS
  • TABLE 133 MERCK KGAA: COMPANY OVERVIEW
  • TABLE 134 MERCK KGAA: DEALS
  • TABLE 135 AVANTOR, INC.: COMPANY OVERVIEW
  • TABLE 136 AVANTOR, INC.: DEALS
  • TABLE 137 WATERS CORPORATION: COMPANY OVERVIEW
  • TABLE 138 WATERS CORPORATION: DEALS
  • TABLE 139 BIO-RAD LABORATORIES, INC.: COMPANY OVERVIEW
  • TABLE 140 BIO-RAD LABORATORIES, INC.: DEALS
  • TABLE 141 DANAHER CORPORATION: COMPANY OVERVIEW
  • TABLE 142 DANAHER CORPORATION: DEALS
  • TABLE 143 REGIS TECHNOLOGIES INC.: COMPANY OVERVIEW
  • TABLE 144 REGIS TECHNOLOGIES INC.: EXPANSIONS
  • TABLE 145 LOBACHEMIE: COMPANY OVERVIEW
  • TABLE 146 SANTA CRUZ BIOTECHNOLOGY, INC.: COMPANY OVERVIEW
  • TABLE 147 AGILENT TECHNOLOGIES, INC.: COMPANY OVERVIEW
  • TABLE 148 AGILENT TECHNOLOGIES, INC.: DEALS
  • TABLE 149 RESTEK CORPORATION: COMPANY OVERVIEW
  • TABLE 150 RESTEK CORPORATION: DEALS
  • TABLE 151 GFS CHEMICALS, INC.: COMPANY OVERVIEW
  • TABLE 152 CHIRON AS: COMPANY OVERVIEW
  • TABLE 153 TOKYO CHEMICAL INDUSTRY CO., LTD.: COMPANY OVERVIEW
  • TABLE 154 TOSOH CORPORATION: COMPANY OVERVIEW
  • TABLE 155 HONEYWELL INTERNATIONAL INC.: COMPANY OVERVIEW
  • TABLE 156 SHIMADZU CORPORATION: COMPANY OVERVIEW
  • TABLE 157 KANTO KAGAKU: COMPANY OVERVIEW
  • TABLE 158 SPECTRUM CHEMICAL MFG. CORP.: COMPANY OVERVIEW
  • TABLE 159 TEDIA COMPANY INC.: COMPANY OVERVIEW
  • TABLE 160 ITW REAGENTS DIVISION: COMPANY OVERVIEW
LIST OF FIGURES
 
  • FIGURE 1 MARKET SEGMENTATION: CHROMATOGRAPHY REAGENTS MARKET
  • FIGURE 2 REGIONAL SEGMENTATION: CHROMATOGRAPHY REAGENTS MARKET
  • FIGURE 3 RESEARCH DESIGN
  • FIGURE 4 PRIMARY SOURCES
  • FIGURE 5 BREAKDOWN OF PRIMARY INTERVIEWS: BY COMPANY TYPE, DESIGNATION, AND REGION
  • FIGURE 6 SUPPLY-SIDE MARKET SIZE ESTIMATION: REVENUE SHARE ANALYSIS
  • FIGURE 7 REVENUE SHARE ANALYSIS ILLUSTRATION
  • FIGURE 8 CAGR PROJECTIONS: SUPPLY-SIDE ANALYSIS
  • FIGURE 9 CAGR PROJECTIONS FROM ANALYSIS OF DRIVERS, RESTRAINTS, OPPORTUNITIES, AND CHALLENGES OF CHROMATOGRAPHY REAGENTS MARKET, 2024–2029
  • FIGURE 10 TOP-DOWN APPROACH
  • FIGURE 11 MARKET DATA TRIANGULATION METHODOLOGY
  • FIGURE 12 CHROMATOGRAPHY REAGENTS MARKET, BY TECHNOLOGY, 2024 VS. 2029
  • FIGURE 13 CHROMATOGRAPHY REAGENTS MARKET, BY TYPE, 2024 VS. 2029 (USD MILLION)
  • FIGURE 14 CHROMATOGRAPHY REAGENTS MARKET, BY SEPARATION MECHANISM, 2024 VS. 2029
  • FIGURE 15 CHROMATOGRAPHY REAGENTS MARKET, BY END USER, 2024 VS. 2029 (USD MILLION)
  • FIGURE 16 REGIONAL SNAPSHOT OF CHROMATOGRAPHY REAGENTS MARKET
  • FIGURE 17 GROWING FOOD SAFETY CONCERNS AND INCREASING R&D INVESTMENTS IN PHARMACEUTICAL INDUSTRY TO DRIVE MARKET
  • FIGURE 18 SOLVENTS TO COMMAND LARGEST SHARE IN EUROPEAN CHROMATOGRAPHY REAGENTS MARKET IN 2024
  • FIGURE 19 CHINA TO GROW AT HIGHEST CAGR DURING FORECAST PERIOD
  • FIGURE 20 ASIA PACIFIC TO WITNESS HIGHEST GROWTH RATE DURING STUDY PERIOD
  • FIGURE 21 EMERGING ECONOMIES TO REGISTER HIGHER GROWTH RATES DURING FORECAST PERIOD
  • FIGURE 22 DRIVERS, RESTRAINTS, OPPORTUNITIES AND CHALLENGES: CHROMATOGRAPHY REAGENTS MARKET
  • FIGURE 23 PHARMACEUTICAL R&D SPENDING OF EFPIA MEMBERS, 1990–2022 (BILLION EUROS)
  • FIGURE 24 ECOSYSTEM/MARKET MAP: CHROMATOGRAPHY REAGENTS MARKET
  • FIGURE 25 VALUE CHAIN ANALYSIS: CHROMATOGRAPHY REAGENTS MARKET
  • FIGURE 26 PORTER’S FIVE FORCES ANALYSIS: CHROMATOGRAPHY REAGENTS MARKET
  • FIGURE 27 TOP 15 PATENT OWNERS FOR CHROMATOGRAPHY REAGENTS MARKET, 2013–2024
  • FIGURE 28 EXPORT OF CHROMATOGRAPHY REAGENTS, BY COUNTRY, 2018–2022 (USD MILLION)
  • FIGURE 29 IMPORT OF CHROMATOGRAPHY REAGENTS, BY COUNTRY, 2018–2022 (USD MILLION)
  • FIGURE 30 NUMBER OF INVESTOR DEALS IN CHROMATOGRAPHY REAGENTS MARKET, B Y KEY PLAYER, 2018–2022
  • FIGURE 31 VALUE OF INVESTOR DEALS IN CHROMATOGRAPHY REAGENTS MARKET, BY KEY PLAYER, 2018–2022 (USD MILLION)
  • FIGURE 32 AVERAGE SELLING PRICE OF CHROMATOGRAPHY SOLVENTS, BY KEY PLAYER
  • FIGURE 33 REVENUE SHIFT IN CHROMATOGRAPHY REAGENTS MARKET
  • FIGURE 34 INFLUENCE OF KEY STAKEHOLDERS ON BUYING PROCESS
  • FIGURE 35 KEY BUYING CRITERIA FOR CHROMATOGRAPHY REAGENTS
  • FIGURE 36 GEOGRAPHIC GROWTH OPPORTUNITIES: CHROMATOGRAPHY REAGENTS MARKET (2023)
  • FIGURE 37 NORTH AMERICA: CHROMATOGRAPHY REAGENTS MARKET SNAPSHOT (2023)
  • FIGURE 38 ASIA PACIFIC: CHROMATOGRAPHY REAGENTS MARKET SNAPSHOT (2023)
  • FIGURE 39 CHROMATOGRAPHY REAGENTS MARKET: STRATEGIES ADOPTED
  • FIGURE 40 REVENUE ANALYSIS OF KEY PLAYERS (2020–2022)
  • FIGURE 41 MARKET SHARE ANALYSIS OF KEY PLAYERS (2023)
  • FIGURE 42 COMPANY EVALUATION MATRIX (KEY PLAYERS), 2022
  • FIGURE 43 CHROMATOGRAPHY REAGENTS MARKET: COMPANY FOOTPRINT
  • FIGURE 44 COMPANY EVALUATION MATRIX (START-UPS/SMES), 2022
  • FIGURE 45 EV/EBITDA OF KEY VENDORS
  • FIGURE 46 5-YEAR STOCK BETA OF KEY VENDORS
  • FIGURE 47 BRAND/PRODUCT COMPARATIVE ANALYSIS, BY MODEL
  • FIGURE 48 THERMO FISHER SCIENTIFIC INC.: COMPANY SNAPSHOT (2022)
  • FIGURE 49 MERCK KGAA: COMPANY SNAPSHOT (2022)
  • FIGURE 50 AVANTOR, INC.: COMPANY SNAPSHOT (2022)
  • FIGURE 51 WATERS CORPORATION: COMPANY SNAPSHOT (2022)
  • FIGURE 52 BIO-RAD LABORATORIES, INC.: COMPANY SNAPSHOT (2022)
  • FIGURE 53 DANAHER CORPORATION: COMPANY SNAPSHOT (2022)
  • FIGURE 54 AGILENT TECHNOLOGIES, INC.: COMPANY SNAPSHOT (2023)
  • FIGURE 55 TOSOH CORPORATION: COMPANY SNAPSHOT (2022)
  • FIGURE 56 HONEYWELL INTERNATIONAL INC.: COMPANY SNAPSHOT (2022)
  • FIGURE 57 SHIMADZU CORPORATION: COMPANY SNAPSHOT (2022)

This research study involved the extensive use of both primary and secondary sources. It involved the study of various factors affecting the industry to identify the segmentation types, industry trends, key players, the competitive landscape of market players, and key market dynamics such as drivers, opportunities, challenges, restraints, and key player strategies.

Secondary Research:

This research study involved the wide use of secondary sources, directories, databases such as Dun & Bradstreet, Bloomberg Businessweek, and Factiva, white papers, and companies’ house documents. Secondary research was undertaken to identify and collect information for this extensive, technical, market-oriented, and commercial study of the Chromatography reagents market. It was also used to obtain important information about the top players, market classification, and segmentation according to industry trends to the bottom-most level, geographic markets, and key developments related to the market. A database of the key industry leaders was also prepared using secondary research.

Primary Research:

In the primary research process, various supply side and demand side sources were interviewed to obtain qualitative and quantitative information for this report. Primary sources from the supply side included industry experts such as CEOs, vice presidents, marketing and sales directors, technology & innovation directors, engineers, and related key executives from various companies and organizations operating in the Chromatography reagents market. Primary sources from the demand side included researchers, lab technicians, reagent suppliers, purchase managers etc, and stakeholders in corporate & government bodies.

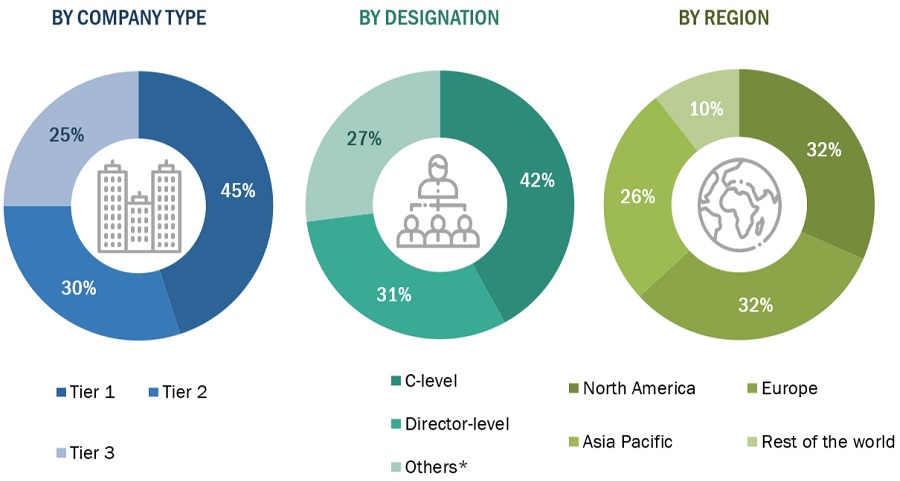
A breakdown of the primary respondents is provided below:
Chromatography Reagents Market Size, and Share

*Others include sales managers, marketing managers, and product managers.

Note: Tiers are defined based on a company’s total revenue, as of 2020: Tier 1 = >USD 1 billion, Tier 2 = USD 500 million to USD 1 billion, and Tier 3 = <USD 500 million.

To know about the assumptions considered for the study, download the pdf brochure

Market Size Estimation:

The total size of the Chromatography reagents was arrived at after data triangulation through the two approaches mentioned below. After the completion of each approach, the weighted average of these approaches was taken based on the level of assumptions used in each approach.

Data Triangulation:

The size of the Chromatography reagents was estimated through segmental extrapolation using the bottom-up approach. The methodology used is as given below:

  • Shares of leading players in the Chromatography reagents market were gathered from secondary sources to the extent available. In some instances, shares of Chromatography reagents have been ascertained after a detailed analysis of various parameters, including product portfolios, market positioning, selling price, and geographic reach & strength.
  • Individual shares or revenue estimates were validated through interviews with experts.

The total revenue in the Chromatography reagents was determined by extrapolating the Market share data of major companies.

Global Chromatography reagents market Size: Top-Down Approach

Chromatography Reagents Market Size, and Share

To know about the assumptions considered for the study, Request for Free Sample Report

Market Definition:

Chromatography Reagents:

Chromatography is a biophysical technique that separates, identifies, and/or purifies the components of a mixture for qualitative and quantitative analysis. Chromatography reagents are essential chemicals used in chromatographic processes to separate and analyze complex mixtures of compounds. They enable accurate qualitative and quantitative analyses across various industries, including pharmaceuticals, biotechnology, environmental testing, food and beverage, and forensic science.

Key Stakeholders:

  • Chromatography reagent manufacturers
  • Third-party chromatography reagent suppliers
  • Reagent raw material suppliers
  • Pharmaceutical, biopharmaceutical, and biotechnology companies
  • Food and beverage industry
  • Environment protection and forensic institutes
  • Clinicians, researchers, hospitals, and pharmaceutical research laboratories
  • Research institutes and academic centers
  • Government bodies/municipal corporations
  • Contract research organizations (CROs)
  • Business research and consulting service providers
  • Forensic laboratories
  • Diagnostic laboratories
  • Research institutes and laboratories
  • Academic centers
  • Product manufacturers, distributors, and suppliers
  • Venture capitalists and other government funding organizations

Objectives of the Study:

  • To define, describe, segment, and forecast the chromatography reagents market based on type, technology, separation mechanism, end user, and region
  • To provide detailed information regarding the major factors influencing market growth (such as drivers, restraints, opportunities, and challenges), key industry trends, regulatory landscape, and pricing trends of major reagent categories at a regional level
  • To strategically analyze micromarkets1 with respect to individual growth trends, future prospects, and contributions to the overall chromatography reagents market
  • To analyze the opportunities in the global chromatography reagents market for stakeholders and provide details of the competitive landscape for market leaders
  • To forecast the revenue of market segments with respect to five major regions: North America (US and Canada), Europe (UK, Germany, France, Italy, Spain, and Rest of Europe), the Asia Pacific (Japan, China, India, Australia, South Korea, and Rest of Asia Pacific), Latin America (Brazil, Mexico, and Rest of Latin America), and the Middle East & Africa (GCC Countries and Rest of Middle East & Africa)
  • To profile the key players and comprehensively analyze their market shares and core competencies2
  • To benchmark players within the market using a proprietary Company Evaluation Matrix framework, which analyzes market players on various parameters within the broad categories of business strategy excellence and strength of product portfolio
  • To track and analyze competitive developments such as product launches, agreements & partnerships, mergers & acquisitions, and research activities in the chromatography reagents market

Available Customizations:

With the given market data, MarketsandMarkets offers customizations as per your company’s specific needs. The following customization options are available for the report:

Company Information:

  • Detailed analysis and profiling of additional market players (up to 5)

Geographic Analysis:

  • Further breakdown of the Rest of Europe Chromatography reagents market into Denmark, Norway, and others
  • Further breakdown of the Rest of Asia Pacific Chromatography reagents market into Vietnam, New Zealand, and others

Previous Versions of this Report

Chromatography Reagents Market by Technology (GC, LC, SFC, TLC, and Paper Chromatography), Type (Solvents, Buffers, Derivatization Reagents, Ion-Pair Reagents, and Others), Separation Mechanism,Application - Global Forecast to 2025

Report Code AST 3802
Published in Dec, 2020, By MarketsandMarkets™

Chromatography Reagents Market by Type (Solvents (HPLC Grade, GC Grade), Buffers, Derivatization Reagents (Silylation, Acylation), Ion Pair Reagents), by Application (Life Sciences, Environmental Testing) - Analysis & Global Forecasts to 2020

Report Code AST 3802
Published in Nov, 2015, By MarketsandMarkets™

Chromatography Reagents Market By Type [Alkylation, Acylation, Solvent, Buffer], Bed Shape [Column, Thin layer], Mobile Phase [HPLC, UHPLC, HILIC, Flash, SFC], Separation Mechanism [Adsorption, Partition, Affinity] & End User - Global Forecasts to 2018

Report Code AST 3802
Published in Aug, 2013, By MarketsandMarkets™
"Our USP is "providing game-changing business opportunities reports with free customization" - so please feel free to provide us with your specific areas of interest / business challenges in much greater detail !!"

We appreciate your interest in this report. Once you fill out the form, you'll be immediately directed to an exclusive solution tailored to your needs. This high-value offering can help boost your revenue by 30% - a must-see opportunity for anyone looking to maximize growth.


By clicking the "Submit" button, you are agreeing to the Terms of Use and Privacy Policy.

Custom Market Research Services

We Will Customise The Research For You, In Case The Report Listed Above Does Not Meet With Your Requirements

Get 10% Free Customisation

Growth opportunities and latent adjacency in Chromatography Reagents Market

DMCA.com Protection Status